 Muhammad Azrai1*
 Muhammad Aqil2
 Roy Efendi2
 Nining Nurini Andayani2Suwardi2Bunyamin Zainuddin2Marcia B. Pabendon2Trias Sitaresmi2Muhammad Fuad Anshori1Muhammad Riadi1Muhammad Yasin2Reynaldi Laurenze1Bahtiar3Suwarti2Amiruddin Syam4
- 1Department of Agronomy, Faculty of Agriculture, Hasanuddin University, Makassar, Indonesia
- 2Research Center for Food Crops, National Research and Innovation Agency Republic of Indonesia – BRIN, Bogor, Indonesia
- 3Research Center for Behavioral and Circular Economics, National Research and Innovation Agency Republic of Indonesia – BRIN, Jakarta, Indonesia
- 4Research Center for Macroeconomics and Finance, National Research and Innovation Agency Republic of Indonesia – BRIN, Jakarta, Indonesia
Drought stress is a critical constraint to maize production in tropical regions, impairing growth and reducing yield stability. In this study, a panel of hybrids was assessed under both well-watered and drought-stress conditions using yield-based drought tolerance indices and the Multi-Trait Genotype-Ideotype Distance Index (MGIDI). Thirty-three tropical maize hybrids were evaluated under optimal and water-limited conditions across two locations using a randomized complete block design. Drought stress was imposed 40 days after planting until the milk stage following CIMMYT protocols, and data on morphological, physiological, and yield traits were recorded. The dataset was subjected to multivariate analyses, including Principal Component Analysis and hierarchical clustering, as well as four yield-based drought tolerance indices: Stress Tolerance Index (STI), Stress Susceptibility Index (SSI), Yield Stability Index (YSI), and Harmonic Mean Index (HI). Yield-based drought indices identified six superior hybrids (GE13, GE17, GE21, GE26, GE29, and GE32) characterized by high yield stability and minimal reductions under stress. Multi trait analysis using the MGIDI, which integrated various morpho-physiological traits further highlighted GE13, GE21, and GE32 as consistently close to the ideotype. The overlap between yield-based indices and MGIDI confirms the robustness of these three hybrids, while demonstrating the value of integrating complementary selection tools for precise identification of drought tolerant genotypes.
Introduction
Drought remains one of the most significant constraints to agricultural production, reducing yields, limiting crop quality, and threatening food supply chains worldwide. Its impact is compounded by climate variability, declining soil moisture, and groundwater depletion, all of which contribute to lower crop productivity and increase the risk of food insecurity (Gupta et al., 2022; Gbegbelegbe et al., 2024). Drought affects not only the quantity but also the nutritional quality of food, while yield losses reduce farmer income and raise food prices, disproportionately affecting vulnerable populations (Bandyopadhyay et al., 2020). As droughts become more frequent and severe, understanding their impact on food systems and developing effective mitigation strategies is essential (Smakhtin and Schipper, 2008). Maize (Zea mays L.) productivity in Southeast Asia remains below the global average, with recent data indicating yields of around 5.4 t/ha in Indonesia, 4.6 t/ha in Thailand, and 4.2 t/ha in the Philippines, whereas global yields average approximately 6.0 t/ha (FAO, 2024). This gap is exacerbated by the impact of water scarcity, as drought conditions can reduce maize yields by 10%–50%, with losses commonly reaching 25–35% in tropical regions like Southeast Asia (Daryanto et al., 2017).
Maize is highly susceptible to the adverse impacts of climate change, particularly drought. The effects of drought on maize are extensive, impacting growth, development, and grain yield. Water scarcity significantly reduces kernel development in maize, directly impacting overall yield. Substantial yield losses are often caused by drought, particularly when it occurs during critical growth stages such as flowering and grain filling (Deribe, 2024). Persistent drought reduces biomass, alters maize morphology, and significantly lowers grain yield, especially when water stress coincides with flowering and grain filling (Agyare et al., 2013; Saad-Allah et al., 2022). Additionally, the rate of photosynthesis drops more during the flowering stage than during the jointing or milking stages, even under the same level of drought stress (Rossi et al., 2020).
Despite significant advancements in agricultural practices, drought remains a persistent threat to maize yields due to the plant’s inherent sensitivity to water stress. Maize plants have evolved various adaptive mechanisms to mitigate the effects of drought, including physiological, biochemical, and molecular responses. These adaptations, such as stomatal closure to reduce water loss, osmotic adjustment to maintain cell turgor, and the activation of antioxidant enzymes to combat oxidative damage, are essential for the plant’s survival under drought conditions (Chauhan et al., 2022). However, these mechanisms are often insufficient in the face of prolonged or severe drought, leading to a substantial decline in productivity. The challenge lies in the fact that these adaptive responses often come at a cost to the plant’s overall energy balance, diverting resources away from growth and yield production.
Maize genotypes exhibit a range of responses to drought stress, with significant variability in growth, yield, leaf gas exchange, osmolyte accumulation, and antioxidant activity. Drought-tolerant maize genotypes, for instance, produce higher levels of antioxidant enzymes, which play a crucial role in mitigating oxidative stress by neutralizing reactive oxygen species generated during drought (Ahmad et al., 2016). These genotypes also demonstrate reduced lipid peroxidation, preserving cell membrane integrity, and better osmolyte accumulation, which helps maintain cellular turgor and water content under water-deficient conditions (Gelaw and Mishra, 2024; Gelaw et al., 2023).
Drought stress also induces significant alterations in the metabolic processes of maize. The integrity of cell membranes, water relations within the plant, and photosynthetic efficiency are all compromised under drought conditions. Photosynthesis, the process by which plants convert light energy into chemical energy, is particularly sensitive to water stress. Drought conditions limit CO2 assimilation and increase photorespiration, leading to reduced photosynthetic efficiency and overall carbon fixation in plants (Leverne and Krieger‐Liszkay, 2021).
To address the challenge of drought-induced yield losses, breeding drought-tolerant maize varieties has become a critical strategy for sustaining productivity in water-limited environments. Advances in genomic technologies have facilitated the identification of drought-resistant traits and the development of maize varieties that are better equipped to withstand water scarcity. Furthermore, the use of plant growth-promoting rhizobacteria and endophytic bacteria offers promising mitigation measures. These beneficial microbes can enhance root growth, improve water uptake, and modulate stress-responsive pathways, thereby contributing to the maintenance of maize productivity under drought conditions (Agunbiade and Babalola, 2024).
To improve the selection of drought-tolerant maize genotypes, it is essential to evaluate performance under stress by analyzing key agronomic, morphological, and physiological traits (Bänziger et al., 2000). Techniques such as selection indices, AMMI, and GGE biplot are widely used to assess genotype superiority, quantify genotype–environment interaction (GEI), and identify high-yielding, stable hybrids across environments (Azrai et al., 2023). Incorporating secondary traits strongly associated with grain yield enhances selection accuracy under both drought stress and low nitrogen (Azrai et al., 2024). More recently, the Multi-Trait Genotype-Ideotype Distance Index (MGIDI) was introduced to integrate multivariate trait data into a single ideotype-based distance metric, assisting breeders in ranking genotypes by overall performance without multicollinearity issues (Olivoto and Nardino, 2021; Singamsetti et al., 2023). Furthermore, envirotyping and enviromics have introduced approaches to delineate mega-environments using long-term environmental data and to employ indices like MTMPS for joint yield–stability assessment, improving hybrid selection across diverse conditions (Yue et al., 2022). AI-based methods, such as compositional autoencoders, further enhance GEI modeling by disentangling genotype and environment-specific effects, achieving up to a tenfold gain in yield prediction accuracy (Powadi et al., 2024).
This study aimed to select drought-tolerant tropical maize genotypes by integrating multiple traits and drought indices to achieve a comprehensive evaluation under stress conditions. Morpho-physiological traits were combined with four established drought indices (STI, SSI, YSI, and HI), and genotype overlaps were visualized using multi-metric Venn diagram. Additionally, the MGIDI was applied to rank genotypes based on their overall performance across multiple key traits. This multi-layered analysis provides a new strategy for pinpointing elite maize hybrids with strong adaptability to water-limited environments.
Materials and methods
Screening of hybrid candidates
Field trials were carried out over two consecutive seasons (2020 and 2021) at two distinct research stations in South Sulawesi, Indonesia: The Maros site (119°50′E; −5°31′S) and the Bajeng Farm Station (119°57′E; −5°98′S) (Figure 1). Both locations represent rainfed lowland environments, situated at elevations of 80 m and 50 m above sea level, respectively. Despite slight variations in their microclimates, both sites experienced minimal rainfall during the experimental periods, with average daily temperatures ranging from 22°C to 34°C. Relative humidity averaged 74% in Maros and 76% in Bajeng, while wind speeds were recorded at 11.9 km/h and 13 km/h, respectively. Maros had slightly higher incident solar radiation (6.7 kWh/m2/day) compared to Bajeng (6.1 kWh/m2/day). Soils at the Maros site are classified as clay loam (Luvisols, FAO Soil Classification), while those at Bajeng are sandy clay loam (Fluvisols). The study involved 33 hybrid maize genotypes, derived from CIMMYT’s global maize breeding program and complemented with locally developed genetic material. These hybrids were evaluated under two water regimes: optimal irrigation and controlled drought stress. Planting was conducted in May 2020 at Maros and in June 2021 at Bajeng. Both trials followed a randomized complete block design (RCBD) with three replications. Each plot consisted of four rows measuring 5 meters in length, with a spacing of 70 cm between rows and 20 cm between plants. Two seeds were sown per hole and later thinned to one seedling.
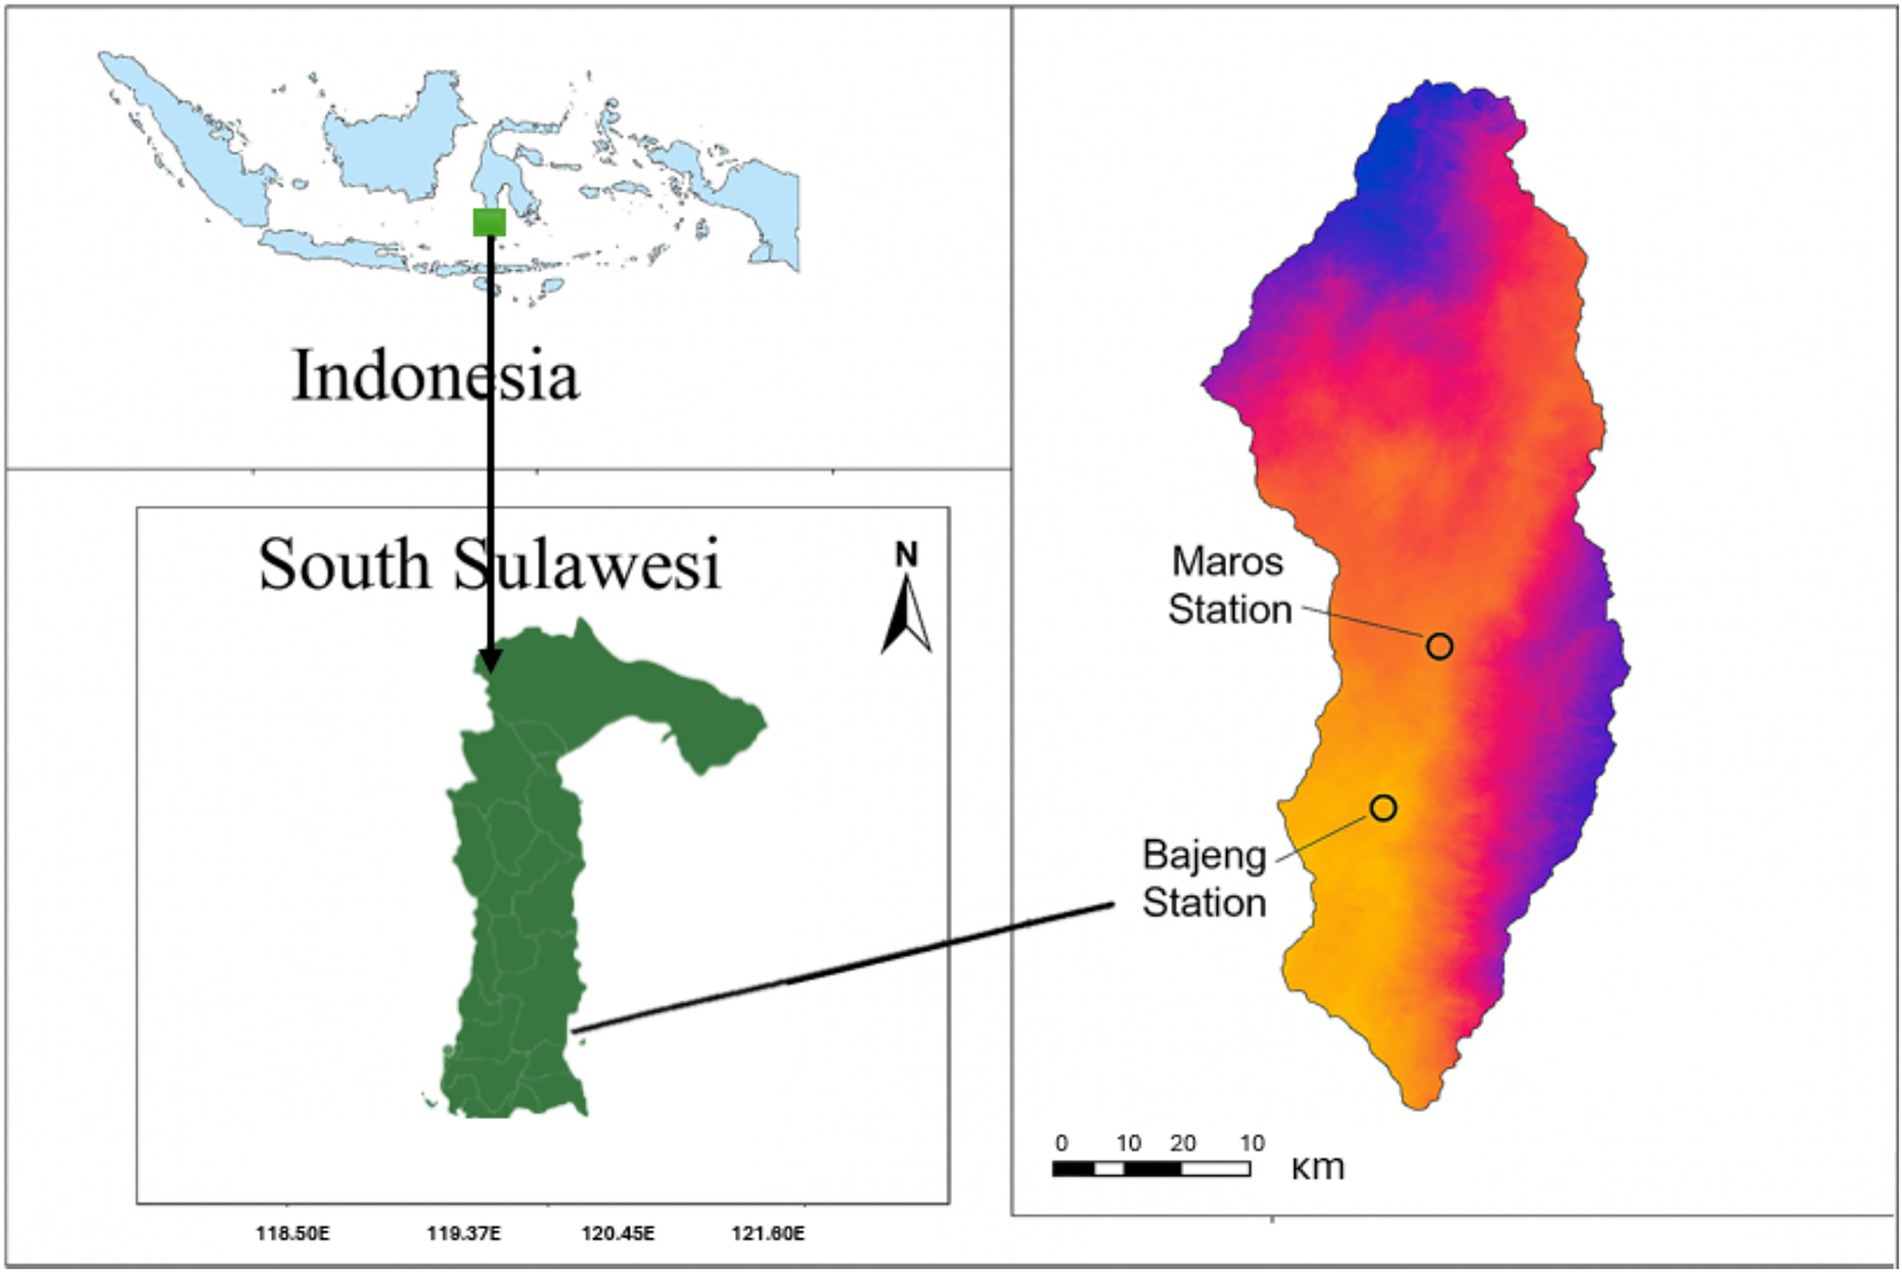
Figure 1. Map of the maize drought tolerance trial sites.
Drought stress was initiated 40 days after planting (DAP) corresponding to the late vegetative growth stage, by withholding irrigation, following the CIMMYT protocol (Bänziger et al., 2000). Stress was maintained through flowering (approximately 50 DAP) and continued until the milk stage (around 75 DAP), after which normal irrigation (furrow) was resumed. This timing ensured that the imposed stress coincided precisely with the critical stages of yield formation. All field management, including fertilization, weed management, and pest/disease control, were conducted in accordance with national agronomic guidelines established by the Indonesian Ministry of Agriculture. Under these standardized management practices, the genotypes displayed uniform phenological development, with an average flowering time of 50–53 DAP, grain filling between 70–75 DAP, and physiological maturity occurring at 100–102 DAP. The environmental conditions, soil properties, and experimental setup are presented in Table 1.
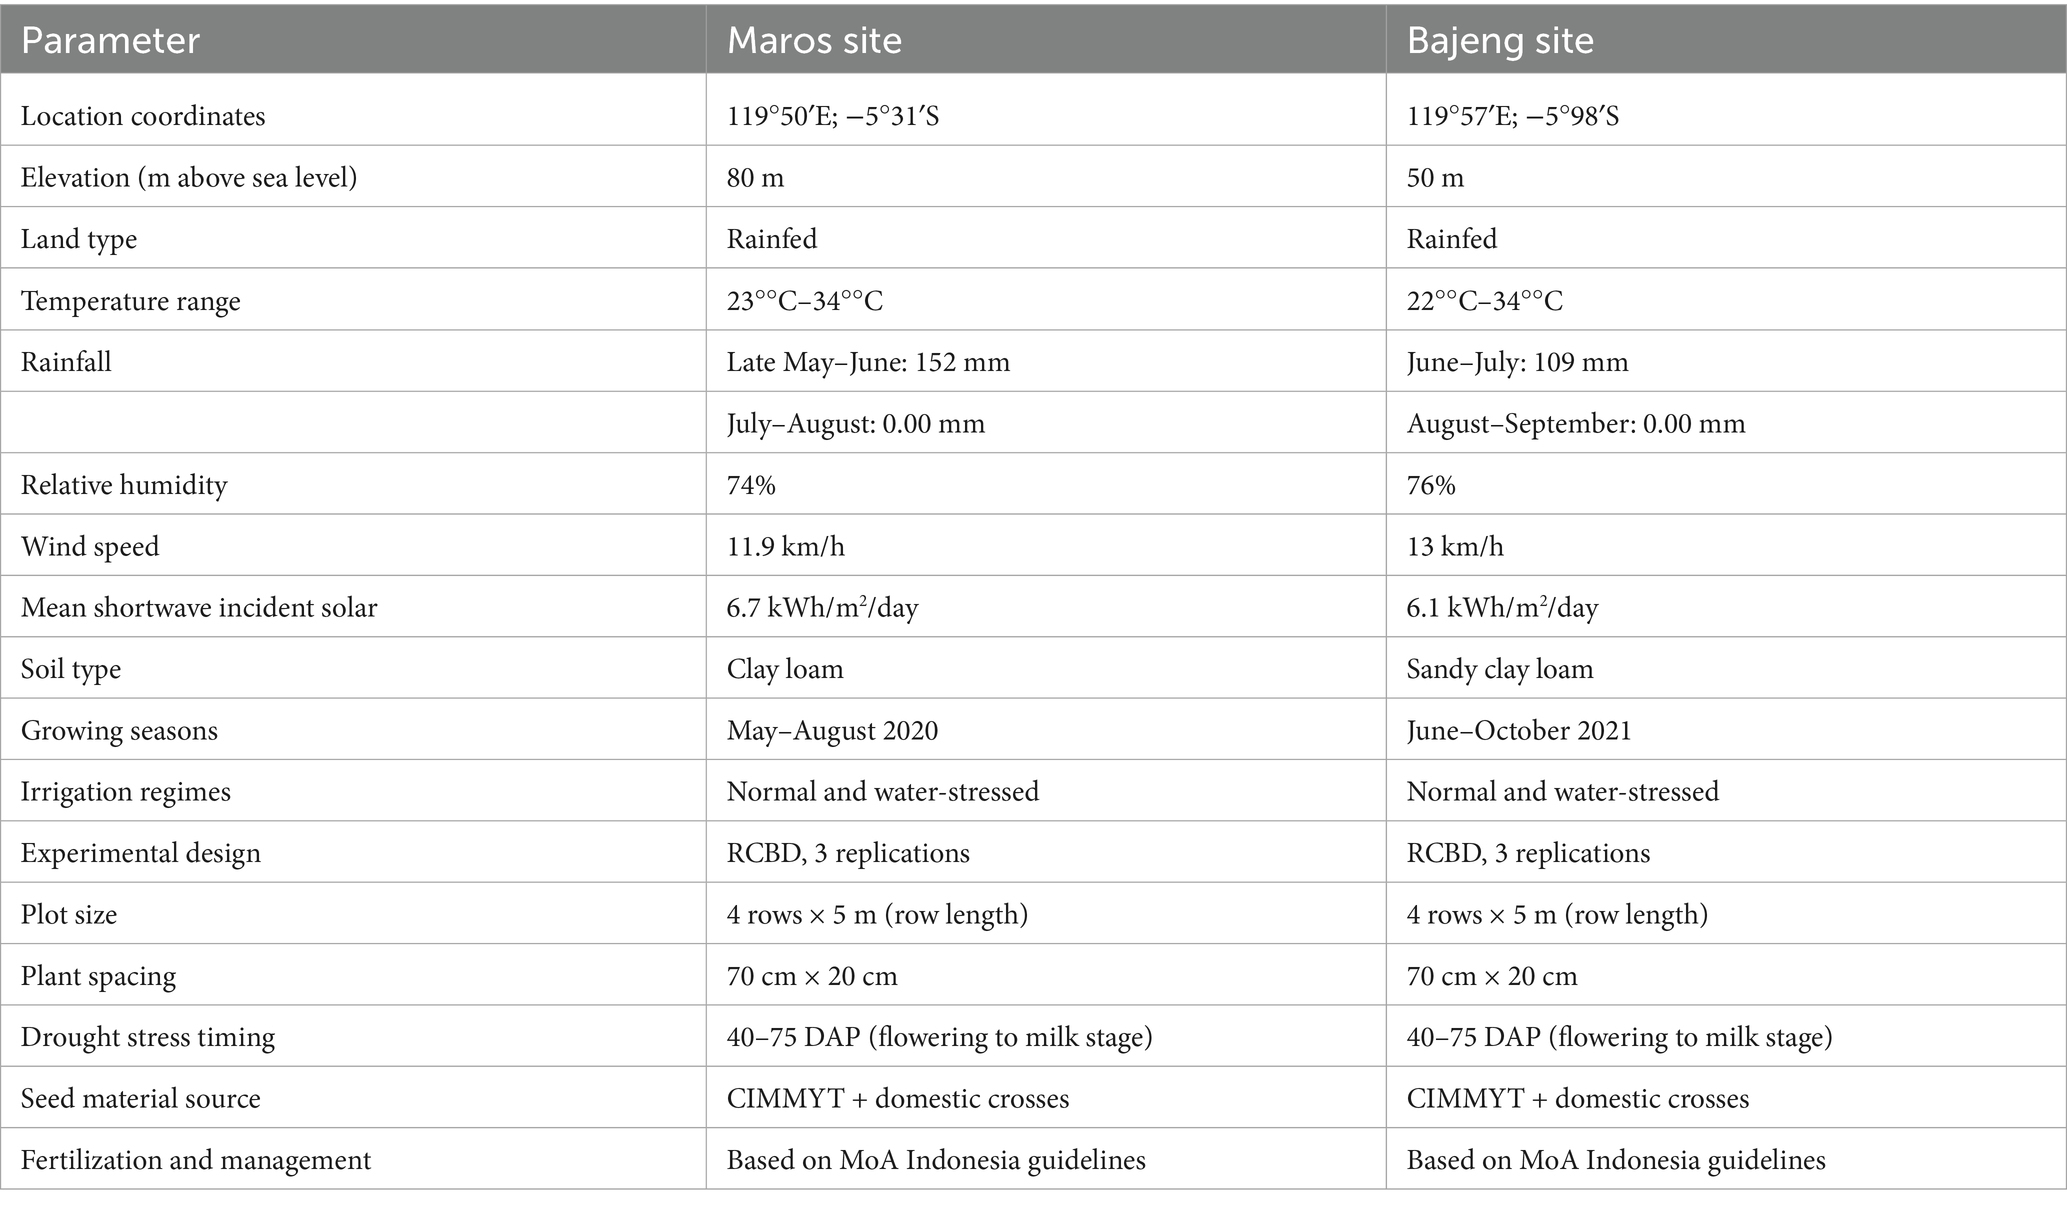
Table 1. Site characteristics, weather data, and experimental design details.
The observed variables encompassed a range of phenological and physiological traits, including plant height (PH), ear height (EH), ratio of plant to ear height (RPH), days to tasseling (DTS), days to silking (DSL), leaf angle (LAG), leaf area (LA), stem diameter (SD), anthesis to silking interval (ASI), and SPAD reading. The leaf angle in maize was determined by using an inclinometer, which measures the angle formed between the leaf blade and the stem. SPAD values of the flag leaves were measured using a SPAD-502 chlorophyll meter (Konica Minolta) at 75 days after planting (DAP), corresponding to the milk stage (the end of the imposed drought period). Leaf area was calculated according to the method proposed by (Radford, 1967). The leaf area was computed using the formula LA = K (L * W), where LA is the leaf area in square centimeters (cm2), K is a constant (0.75), L is the leaf length in centimeters, and W is the maximum leaf width in centimeters.
At harvest, maize cobs were collected from a five-meter plot stretch located in the central rows of each replicate. The measurements included ear diameter (ED), ear length (EL), number of kernel rows per ear (NR), number of kernels per row (NKR), shelling percentage (SP), 1,000-kernel weight (KW1000), and grain yield (GY). At physiological maturity, NR was determined by visually counting all kernel rows on a representative ear per plant. NKR was measured by counting the kernels in three complete rows and averaging the counts. Shelling percentage was calculated as the weight of the shelled kernels divided by the total ear weight, multiplied by 100. For KW1000, 1,000 shelled kernels per genotype were equilibrated to 15% moisture (grain moisture meter) and weighed on a digital balance. The grain yield of a maize plot is calculated as follows Equation 1
where PS is harvested plot (m2), MC is moisture content at harvest (%), FW is field weight per plot (kg), and SP is shelling percentage (%).
Assessment of multiple drought tolerant index
Four distinct indices (Equations 2-5) were calculated for each hybrid to comprehensively evaluate drought tolerance: Stress Tolerance Index (STI), Stress Susceptibility Index (SSI), Yield Stability Index (YSI), and Harmonic Mean Index (HI) (Fernandez, 1992; Arisandy et al., 2017). Each index was derived using performance data under both drought and normal conditions, capturing unique aspects of the genotype’s response. These indices were determined using the following formula, each designed to assess different aspects of drought tolerance in maize hybrids.
Where Ys, Yp and represent the average performance of the trait under drought stress conditions, the average performance under normal conditions for each maize hybrid, and the overall mean performance under normal conditions across all hybrids, respectively. The drought tolerance index for each hybrid was subsequently calculated based on these individual trait performances. In addition to drought indices, a multi-trait selection method was applied using the MGIDI index to identify genotypes with the most desirable combination of traits. The analysis began with a mixed linear model, treating genotypes as random effects and replications as fixed, to estimate adjusted means (BLUPs) for each trait. To handle multicollinearity and reduce trait dimensionality, factor analysis was conducted on the standardized BLUP values, followed by varimax rotation to clarify trait groupings. The ideotype was defined as a theoretical reference with optimal values for all traits, serving as a benchmark for comparison. Each genotype’s distance from this ideotype was then calculated within the factorial space, based on the retained components (Equations 6-7).
where Fij is the score of genotypes i on factor j, and Fj∗ is the ideal score for that factor. Genotypes with the shortest distances were considered closest to the ideotype and therefore the most promising.
Statistical analysis
The analysis of variance (ANOVA) for this study was based on a three-factor factorial design, involving 33 genotypes (G), two locations (L), and two water treatments (drought and normal), and arranged in a randomized complete block design (RCBD). In this mixed-effects model, Genotype, Location, and Treatment were treated as fixed effects, as their specific levels were of primary interest for comparison. The Replicate (Block) was treated as a random effect to control for variability within the experimental sites.
The general linear model (Equation 8) used for the three-way ANOVA is:
Where: is the observed value for the ith genotype, jth location, kth treatment, and lth replicate, is the overall mean, is the random effect of the ith replicate, , , and are the main fixed effects of genotype, location, and treatment, respectively, , , and are the two-way interaction effects, is the three-way interaction effect among genotype, location, and treatment, is the random error.
Trait distributions under each treatment were visualized with boxplots using the ggplot2 package in R. PCA was performed using the FactoMineR (Lê et al., 2008) and factoextra (Kassambara and Mundt, 2020) packages in R. A two-way hierarchical clustering heatmap was constructed using the Heatmap package in R. Correlation analysis was conducted using the metan package (Olivoto et al., 2019), which also supported the multi-index analysis. Boxplots of morpho-physiological traits across 33 hybrids were generated using ggplot2, while Venn diagrams and violin plots were created using Google Collaboratory and associated Python visualization libraries.
Results and discussion
Analysis of variance
A combined analysis of variance across two locations and two water regimes (drought and normal irrigation) for agronomic, physiological, and yield-related traits is presented in Table 2 and Supplementary Table 1. Environmental variation was partitioned into location (L) and water treatment (T) effects. Both location and treatment had highly significant effects (p < 0.001) on most traits, indicating substantial environmental influences on maize performance. The genotype (G) effect was highly significant (p < 0.001) for all traits, showing strong genetic variation among the hybrids. This variation led to differences in traits like PH, ASI, SPAD, EL, KW1000, and GY. The genotype × location (G × L) interaction was not significant for most traits (e.g., PH, SD, ASI, and LAG), except for SPAD, ED, NR, NKR, KW, SP, and GY, which showed significant interactions.
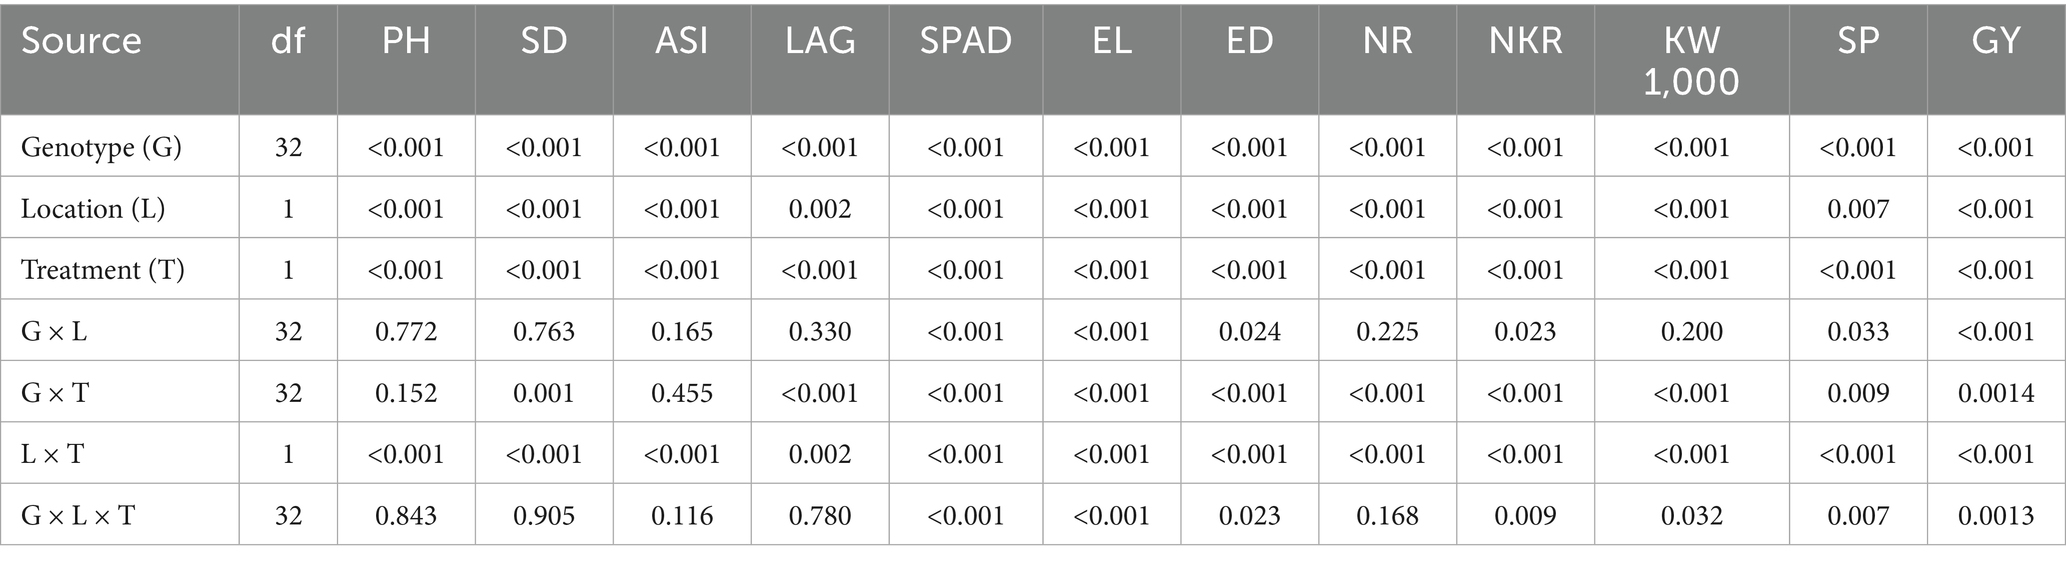
Table 2. Pooled ANOVA of maize geno types evaluated under normal and drought conditions.
A significant genotype × treatment (G × T) interaction was observed for most traits, including SD, LAG, SPAD, EL, ED, NR, NKR, KW, SP, and GY, indicating that genotypes responded differently under drought versus normal irrigation, especially in photosynthetic efficiency, reproductive development, and yield traits. The absence of significant interaction for ASI and PH suggests that these traits were more stable across water regimes. The G × T interaction for grain yield underscores the need to evaluate genotypes under both stress and non-stress conditions to identify drought-tolerant yet high-yielding lines. The three-way interaction (G × L × T) was significant for SPAD, EL, ED, NKR, KW, SP, and GY.
Morpho-physiological analysis
The comparative analysis of maize traits under normal and drought conditions reveals highly significant treatment effects (p < 0.001; Table 2), indicating the negative impact of water stress on growth development. A three-way ANOVA main effect for Treatment showed highly significant reductions in various plant growth traits under drought stress (p < 0.001; Table 2; Figure 2). Plant height was reduced by 12% under drought stress compared to normal conditions (p < 0.001; Table 2), indicating that limited water availability restricts cell expansion and elongation. This reduction aligns with the 20.7% decrease in leaf area observed under similar conditions, which likely represents a physiological adaptation to reduce water loss through transpiration. The increase of 61.8% in the ASI under drought conditions further emphasizes the impact of water stress, as the delay in flowering disrupts pollination synchrony, potentially resulting in reduced grain yields. Moreover, the 11.1% reduction in stem diameter suggests that drought negatively affects the plant’s structural system, compromising its ability to support itself and efficiently transport water and nutrients. SPAD values decreased by 12.9% under drought conditions (p < 0.001; Table 2), indicating a reduction in chlorophyll content and a decline in photosynthetic capacity and overall plant health. Improving traits such as plant height, leaf area, ASI, stem diameter, and chlorophyll content could improve the resilience of maize varieties to drought-prone or water-stressed environments.
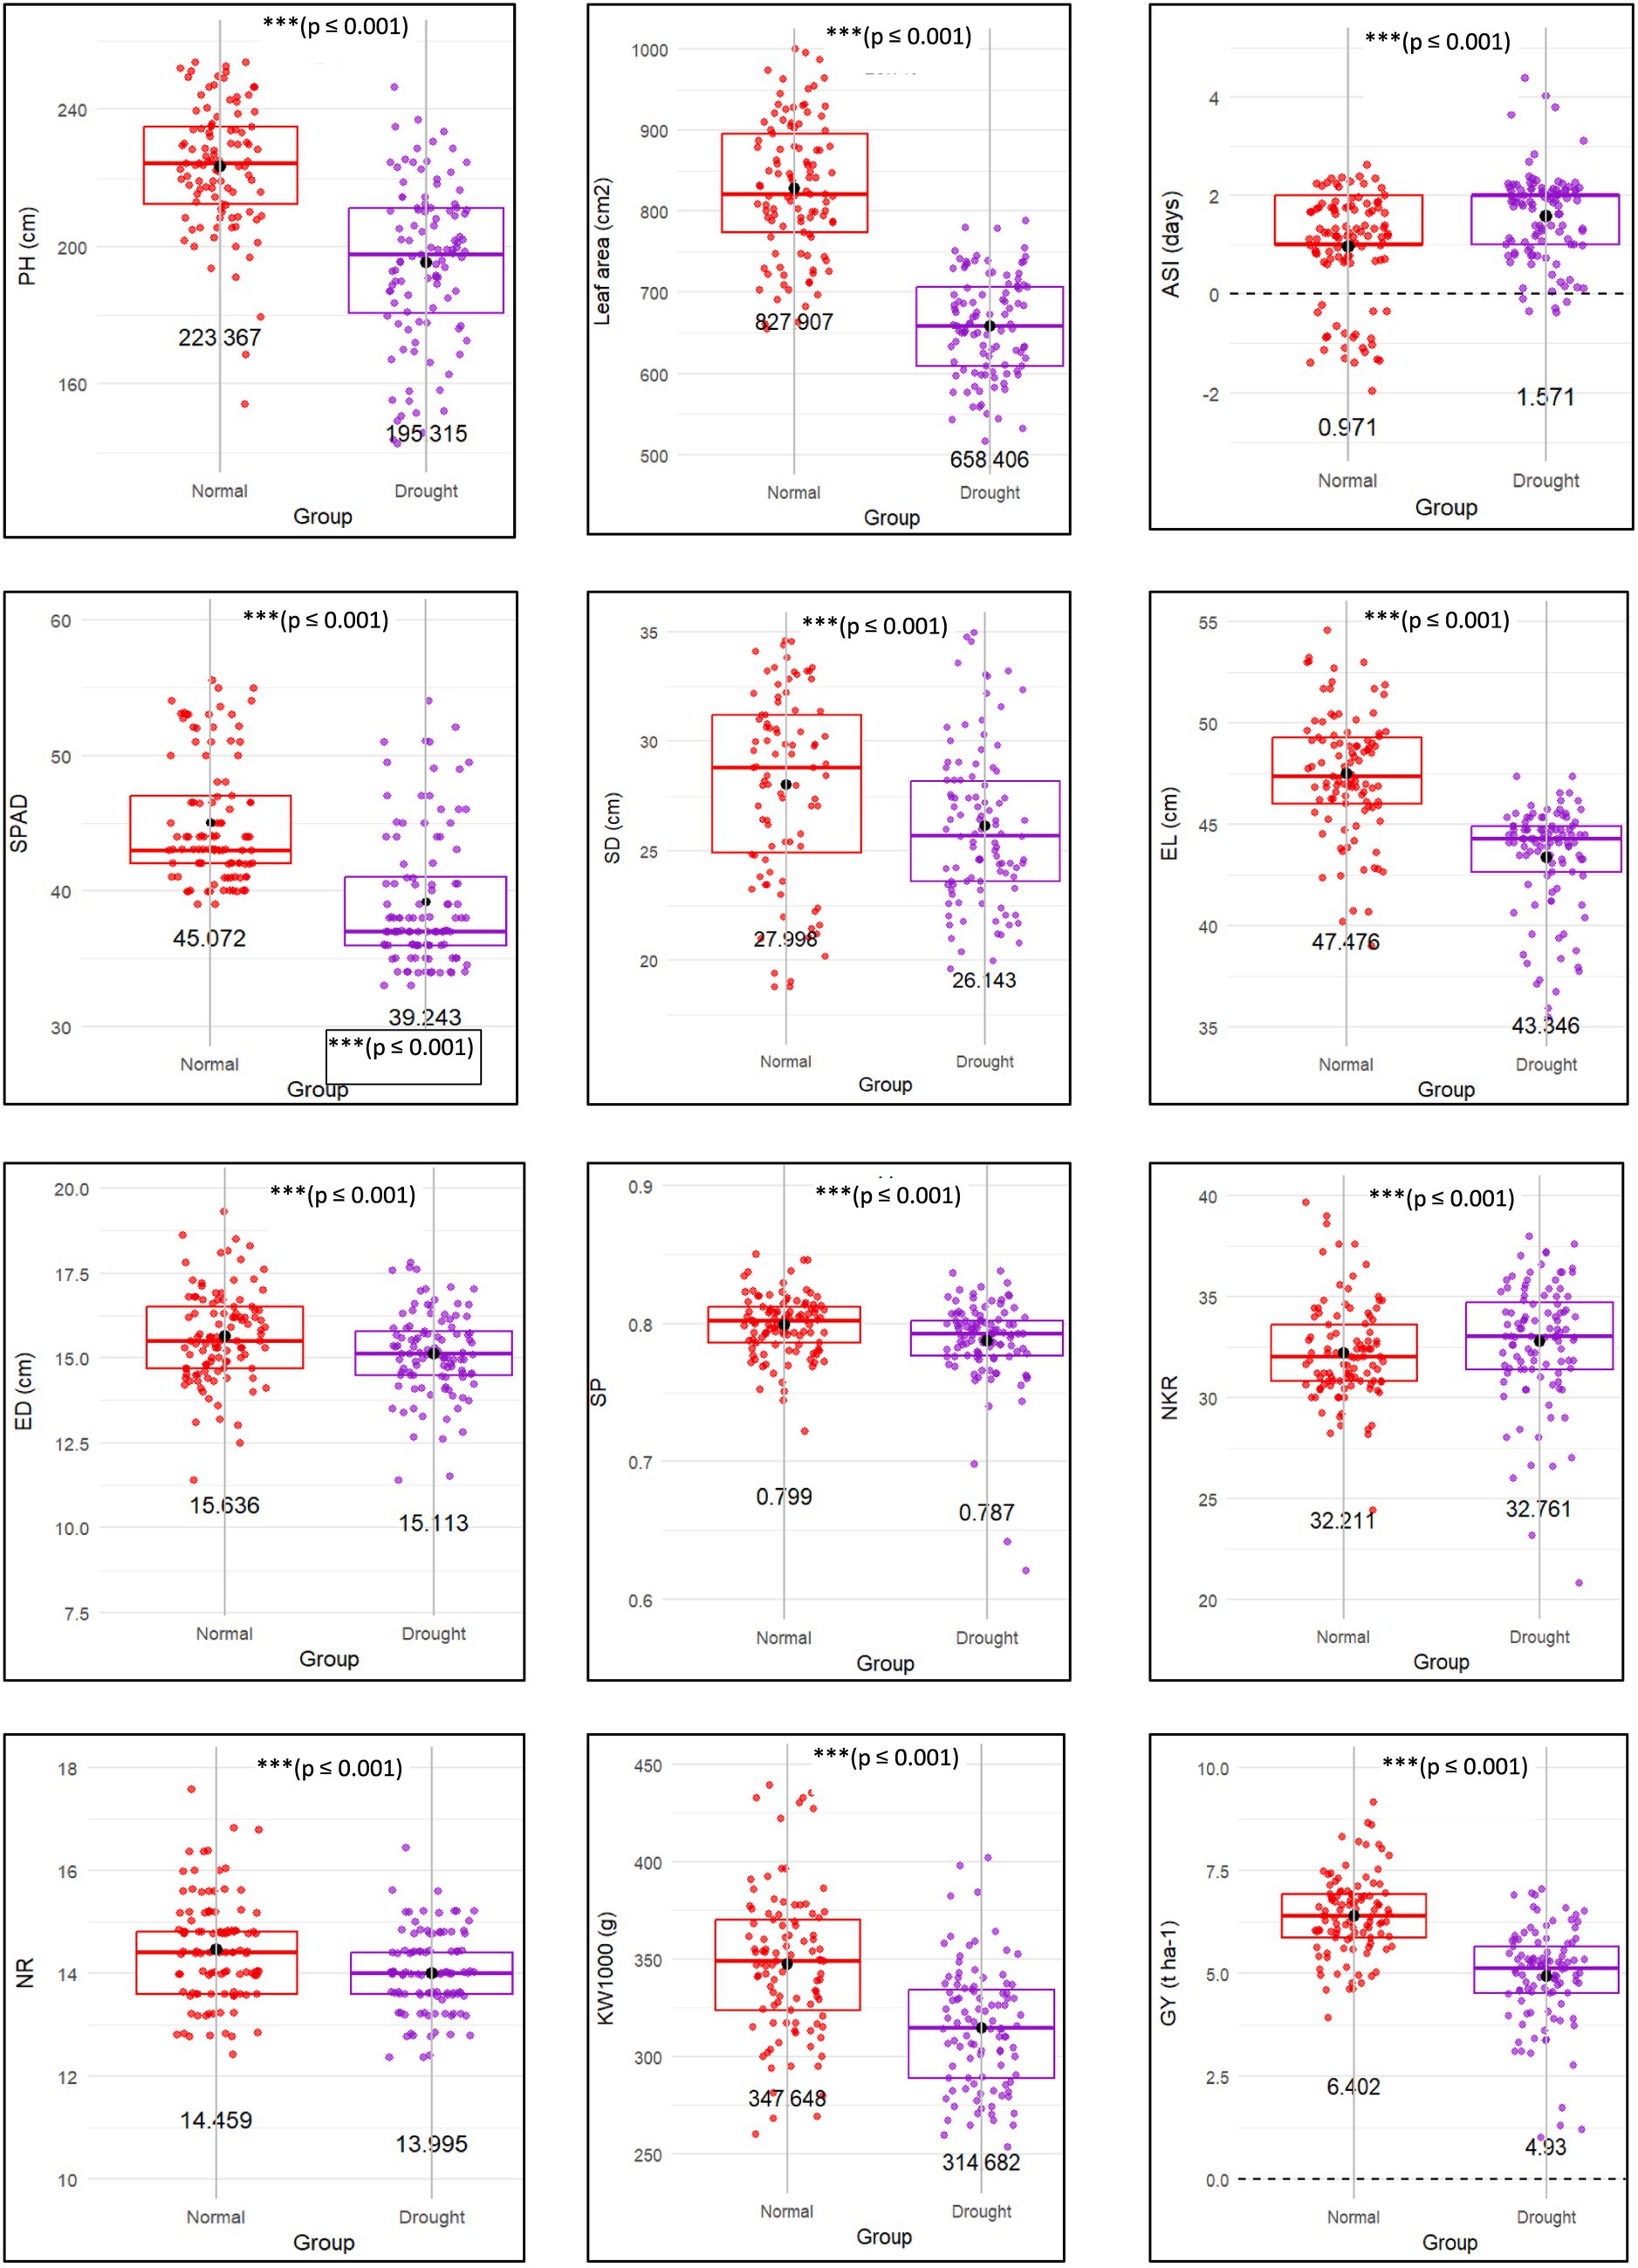
Figure 2. Boxplots showing 12 selected morpho-physiological traits of 33 hybrid candidates grown under both normal and drought stress conditions. Asterisks (***) indicate highly significant treatment effects (p ≤ 0.001) based on the main effect of Treatment in the three-way ANOVA. The traits are: PH, plant height (cm); leaf area (cm2); ASI, anthesis-to-silking interval (days); SPAD reading; SD, stem diameter (cm); EL, ear length (cm); ED, ear diameter (cm); SP, shelling percentage; NKR, number of kernels per row; NR, number of rows; KW1000, 1,000-kernel weight (g); GY, grain yield (t ha−1).
The analysis of maize yield components under drought conditions reveals a significant impact on various traits, indicating the sensitivity of ear and kernel development to water stress. Ear diameter shows a 3.3% reduction under drought conditions, demonstrating that water stress adversely affects ear growth, which could directly influence overall yield potential. Maintaining stable ear diameter under drought could thus be critical for securing yields, as ear size is closely linked to grain production. Additionally, the SP decreases slightly by 1.5% under drought stress. Although this reduction is minimal, it suggests a decrease in kernel weight within the cob due to drought stress. The NKR trait exhibited only a 0.2% difference between normal and drought conditions (p < 0.001; Table 2), suggesting that this trait is relatively stable under water stress. Furthermore, the number of rows (NR) decreased by 3.2% under drought conditions (p < 0.001; Table 2), reflecting moderate sensitivity to water stress and suggesting a need for breeding strategies that bolster this trait under drought conditions to support stable yields. The most substantial impact was observed in 1000-kernel weight, which decreased by 10.8% under drought conditions (p < 0.001; Table 2), reflecting the distinct effect of water stress on kernel development and weight. The significant reduction in KW1000 underlines the challenge of maintaining grain filling and final kernel size under drought, which are critical determinants of overall yield. These suggest that breeding efforts should prioritize traits such as ear diameter, kernel weight, and the number of rows to develop maize varieties capable of sustaining yields under drought conditions. A multi stress breeding program would enhance crop resilience and productivity in water-limited environments, contributing to more sustainable agricultural practices.
Further analysis revealed a substantial decline in grain yield under drought conditions, with a 23% reduction compared to normal conditions (p < 0.001; Table 2), emphasizing the significant impact of water stress on maize productivity. This sharp decrease in grain yield emphasizes maize’s vulnerability to drought, which can cause severe yield losses, especially in regions where water availability is limited. The increased variability in grain yield under drought conditions also suggests that the response of different maize genotypes to water stress is not uniform, pointing to genetic differences in drought tolerance among the tested genotypes. This variability indicates that some genotypes may possess natural drought tolerance, offering potential for selective breeding to enhance drought resilience.
PCA of maize traits under drought and normal
A PCA analysis was conducted on a dataset of 33 genotypes across 16 traits to reduce dimensionality and reveal potential correlations among the measured traits. The PCA results indicated that the eigenvalue for Dim.1 is 5.19 and accounting for 37.08% of the variance in the dataset. Dimensions with eigenvalues greater than 1 are considered important, which is the case for the first four dimensions. Dim.2 has an eigenvalue of 2.45, explaining 17.53% of the variance, followed by Dim.3 and Dim.4 with eigenvalues of 1.62 and 1.18, contributing 11.60 and 8.40%, respectively.
Together, these four dimensions explain 74.62% of the total variance of the relationships among the 16 examined traits. Dimensions beyond Dim.4 have eigenvalues below 1, suggesting less contribution to the data’s structure and can be considered less impactful in the analysis. This indicates that most of the variation in the dataset can be explained by the first four principal components, allowing for a significant reduction in data complexity.
Figure 3 displays the PCA biplot for 33 maize hybrids, the correlation circle for trait relationships, and bar plots showing the variance explained by each principal component. The biplot results revealed a clear distinction between the normal and drought treatments, showing a marked difference in their responses. The PCA biplot was generated using the first two principal components (PC1: 37.10% and PC2: 17.53%), which together explain 54.62% of the total variance. The biplot indicates the distribution of maize traits under drought stress conditions, with DTS, DSL, and ASI clustering in the rightmost region. These traits are dispersed around the hybrid candidates, highlighting their influence under drought stress (Figures 3A,B). Additionally, traits such as SPAD, LA, SP, SD, GY, PH, KW1000, LAG, and EL were clustered in the leftmost region of the biplot, closely associated with hybrids under normal conditions. In contrast, NKR was positioned near the center of the biplot, indicating relatively stable performance under both stress and normal environments.
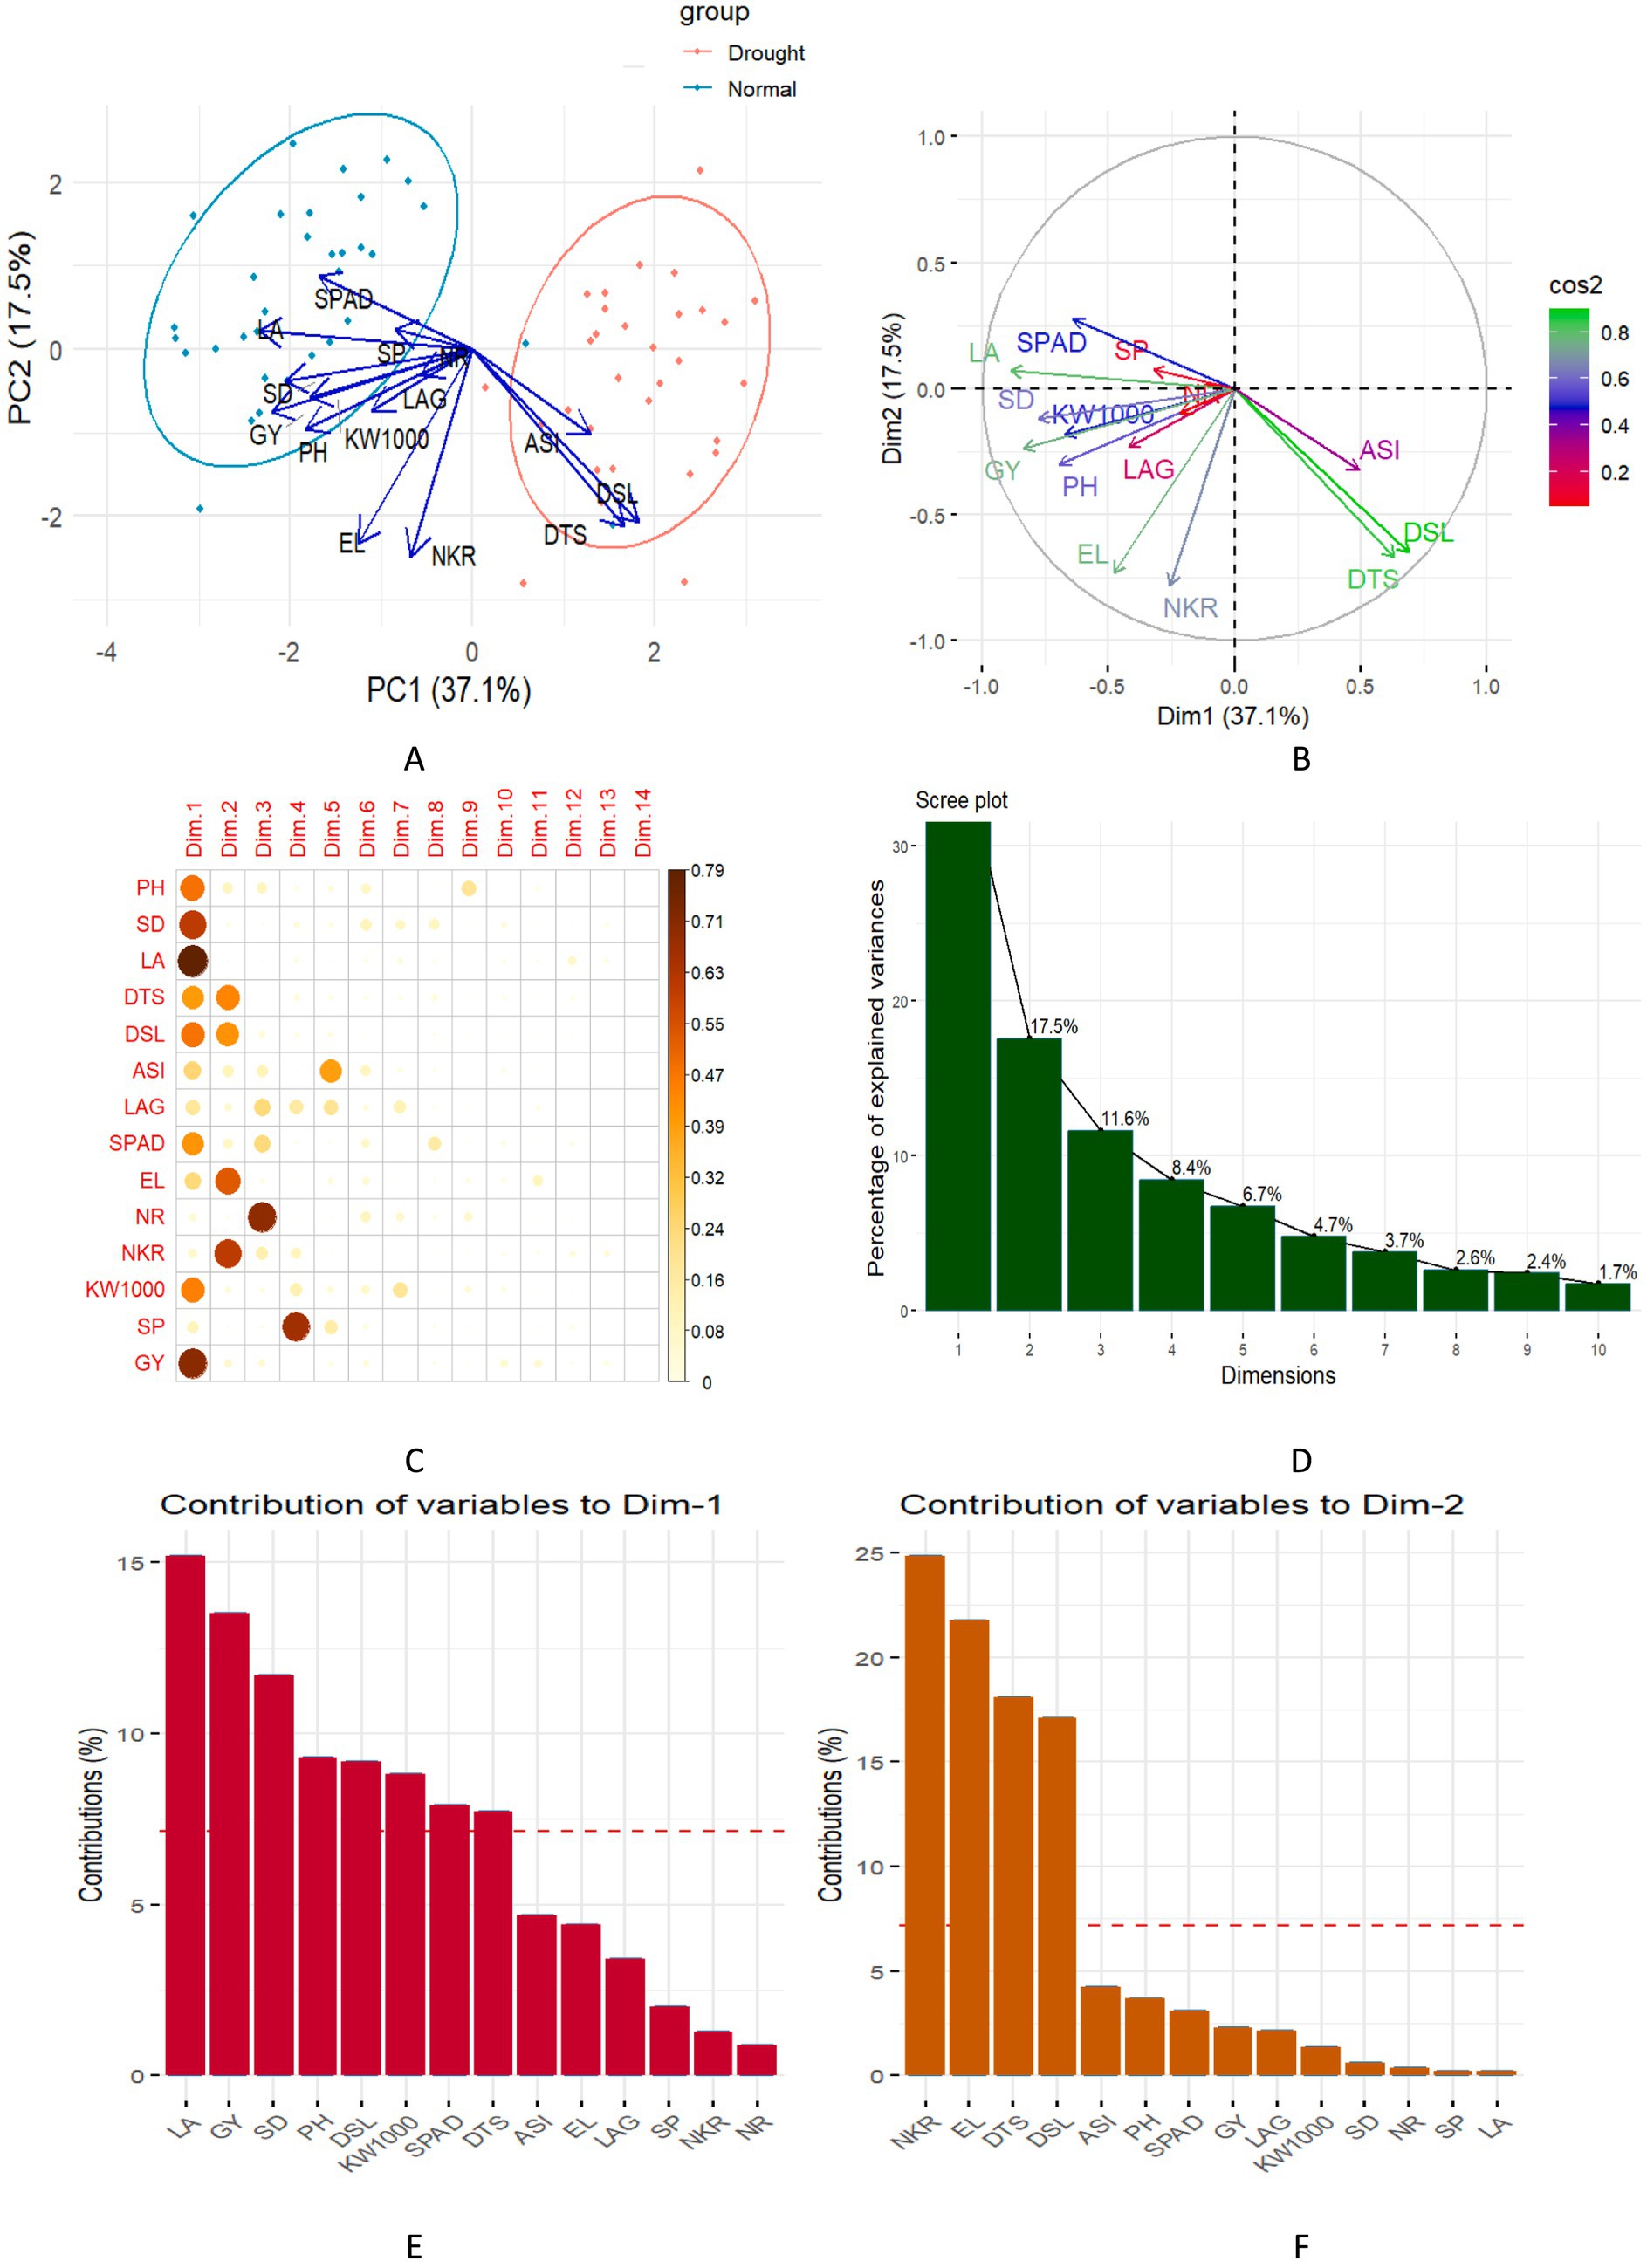
Figure 3. (A,B) PCA biplots of 33 maize hybrids showing trait-based variation under normal and drought conditions. (C) Correlation circle plot displaying variable relationships from PCA. (D) Screen plot indicating the percentage of variance explained by each principal component. (E,F) Bar plots showing the percentage contribution of variables to Dim-1 and Dim-2, respectively.
The bar plots illustrate the contributions of different variables to the first two principal components (Dim-1 and Dim-2) in the PCA (Figures 3C–3F). For Dim-1, the variables with the highest contributions include LA, GY, and SD, each accounting for more than 10% of the total variance explained by PC1. Other variables such as PH, DSL, and KW1000 also show significant contributions, though less prominent. In contrast, Dim-2 shows a different pattern with the NKR, EL, and DTS contributing most heavily, each exceeding 15% of the variance in PC2. The NKR trait makes the highest contribution to Dim-2. Different sets of traits influence the variation captured by each principal component, with plant structure and yield-related traits driving PC1, while reproductive traits dominate PC2.
Clustering hybrid candidates using drought tolerance indices
Considering the effect of drought on grain yield, incorporating traits that confer drought tolerance into maize breeding programs could mitigate the adverse effects of water scarcity on crop production, ensuring consistent yield performance even under challenging environmental conditions. The STI index evaluates a trait’s or genotype’s capacity to withstand stress conditions, such as drought, by assessing its ability to maintain high productivity under both stress and optimal conditions.
The STI values for GY and LA both at 0.8, were the lowest among the traits evaluated, indicating that these traits are highly susceptible to stress, resulting in substantial reductions in maize yield (Figure 4A). In contrast, the STI values for plant height, stem diameter, and SPAD readings demonstrated a similar level of sensitivity to stress, comparable to traits such as leaf angle and thousand-kernel weight. Conversely, the high STI value for ear diameter, at 1.1, suggests that this trait exhibited stable phenotypic performance under both stress and non-stress conditions, reflecting greater resilience. This shows that STI effectively identifies key morpho-physiological traits in maize hybrids contributing to drought tolerance.
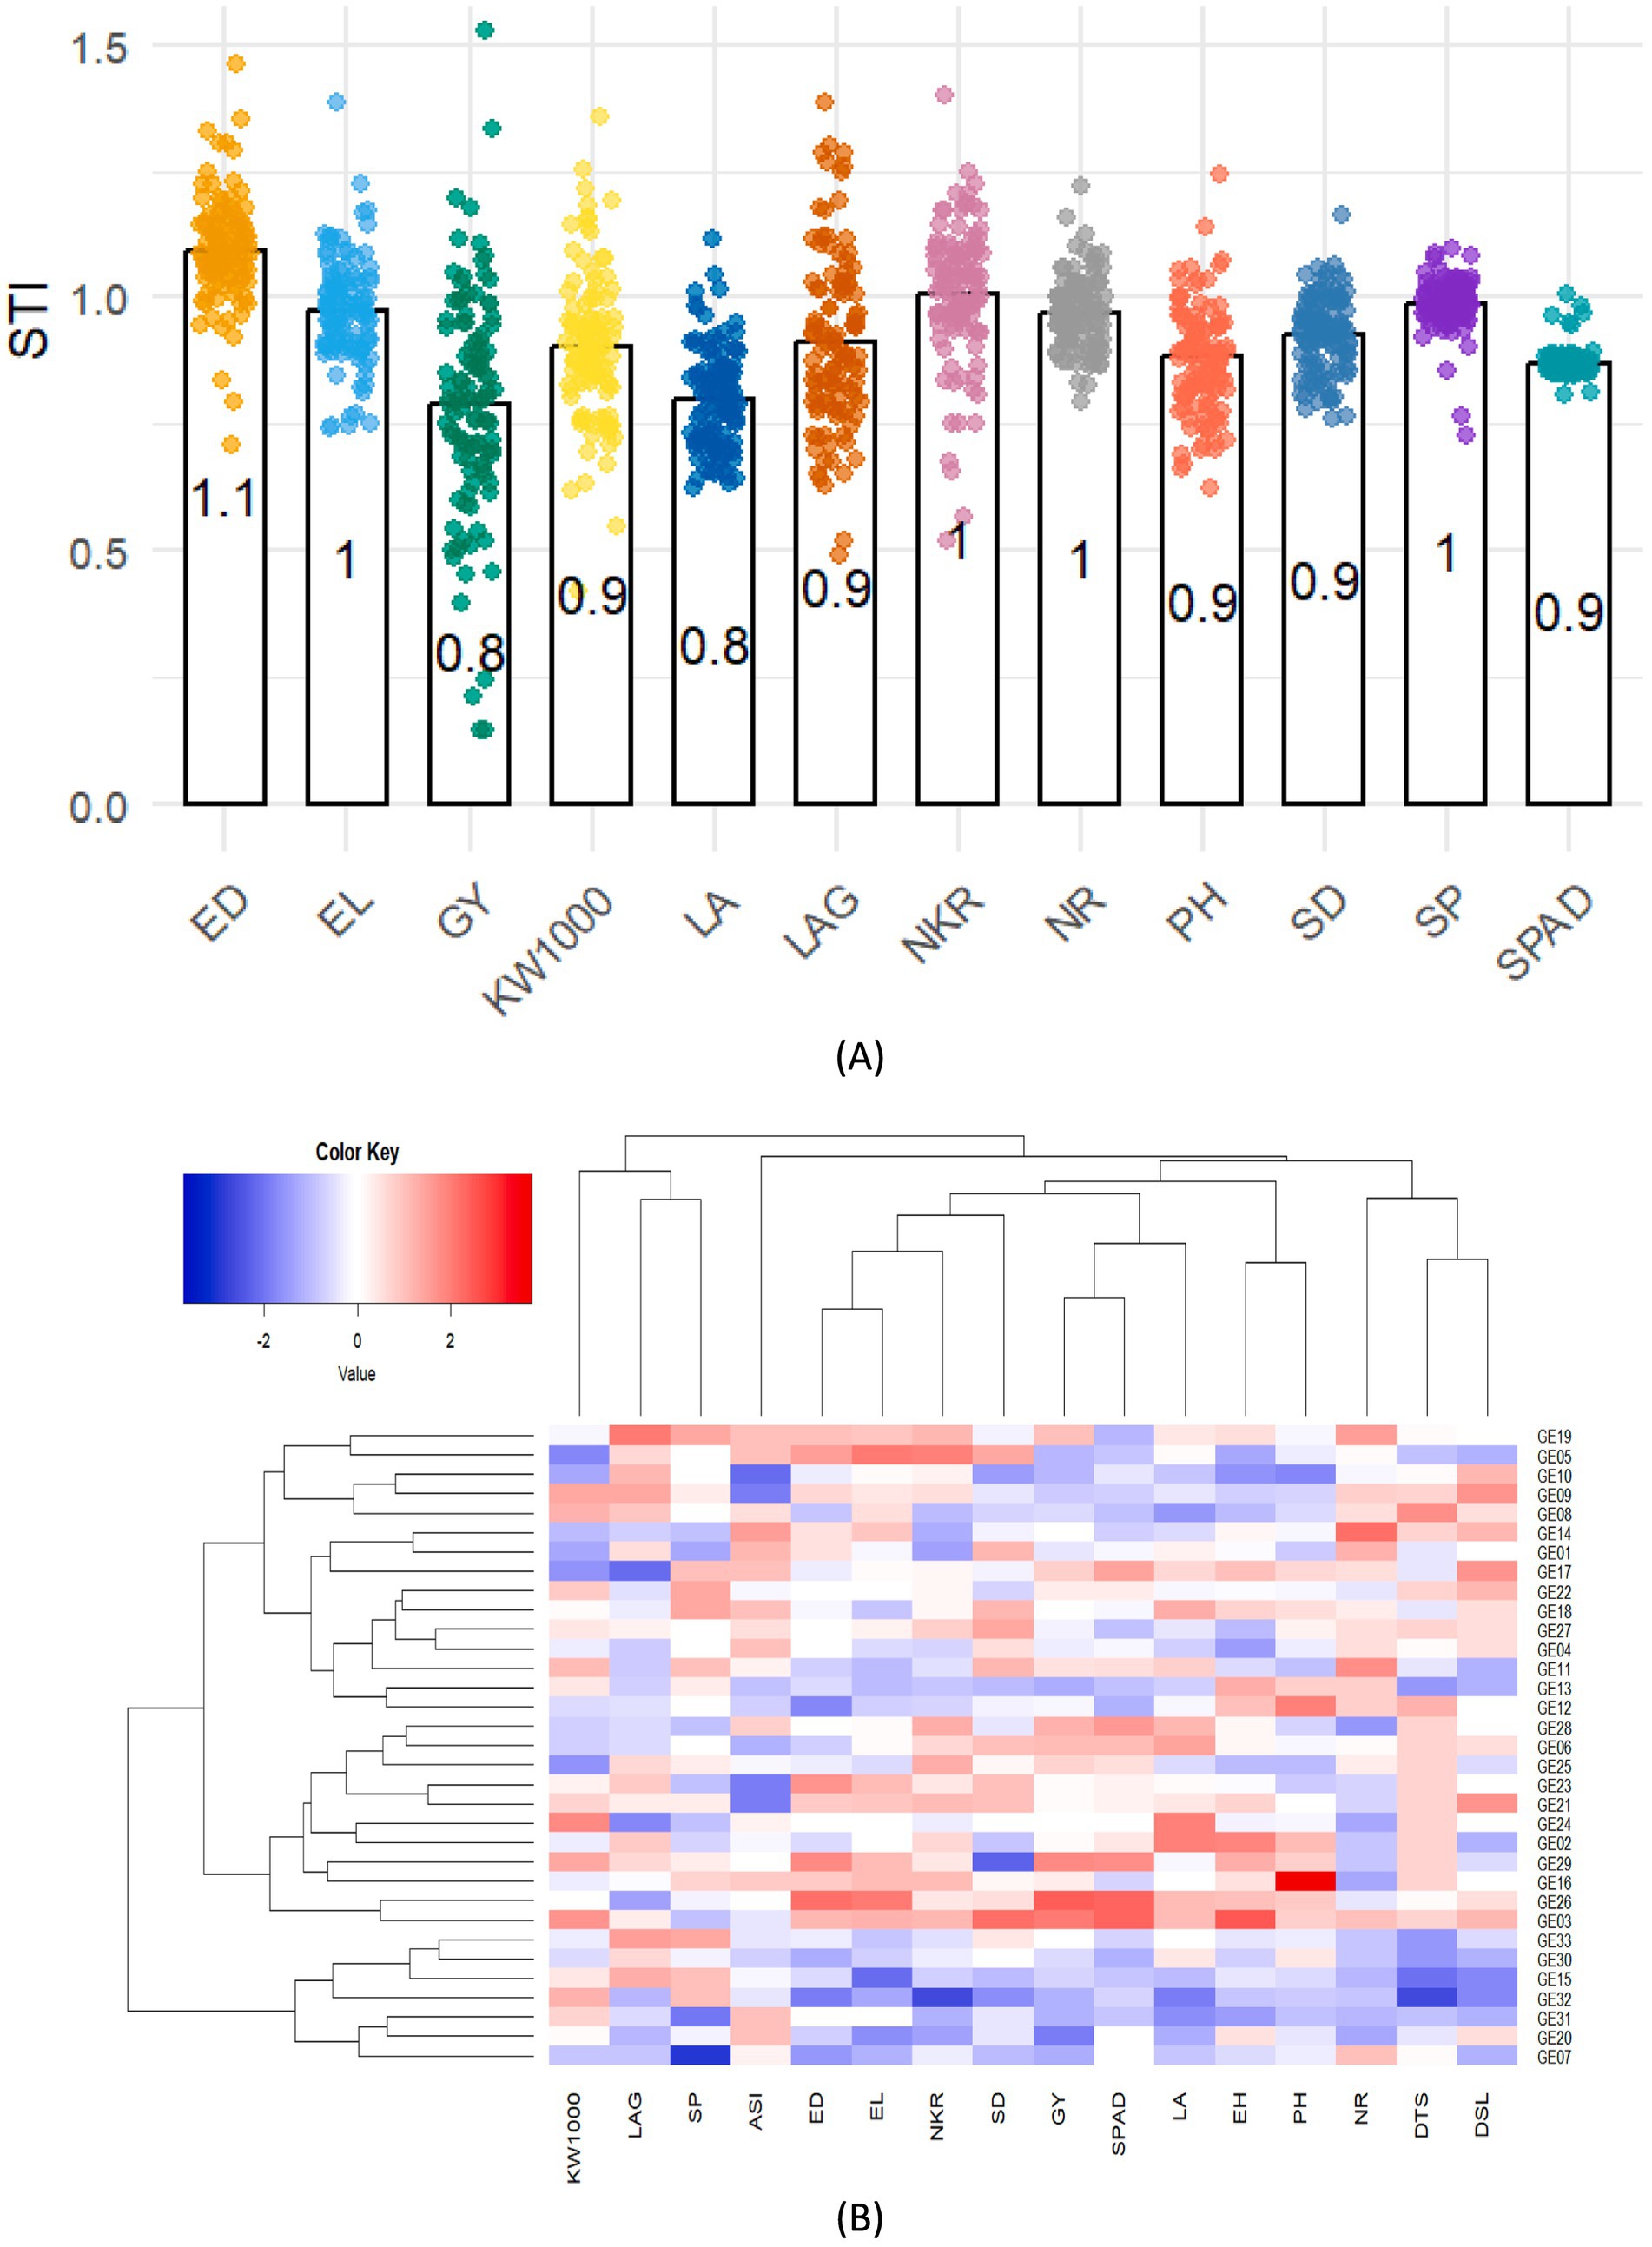
Figure 4. (A) Variation in the STI and SSI for selected morpho-physiological traits of hybrid maize candidates grown under normal and drought stress conditions. (B) Hierarchical clustering heatmap showing STI relationships among hybrid and morpho-physiology under drought stress. Color gradient indicates hybrid-trait associations, with deep blue showing low drought sensitivity and deep red indicating high drought tolerance.
Grouping hybrids for drought tolerance based on a multi-trait (morpho-physiological) approach allows for more comprehensive identification of adaptation mechanisms, accurate hybrid selection, and minimizes the risk of selection errors. Based on Figure 4B, the hierarchical clustering heatmap visualization illustrates the relationship among 33 maize hybrids and 16 morpho-physiological traits under drought stress conditions, effectively highlighting the performance of various hybrids by integrating these traits, with a color gradient from blue (indicating lower values) to red (indicating higher values) on the STI. The variation in drought resilience among genotypes, especially in terms of grain yield, is a crucial trait for maize production under drought stress. A higher STI value signifies a reduced negative impact of drought stress on the corresponding trait. As for the GY trait, hybrids GE 26, GE 03, and GE 29 exhibited the highest STI values, suggesting their superior tolerance under drought conditions. Hybrid GE 26 recorded the highest STI value of 1.12, while hybrid GE 20 displayed the lowest value of 0.56.
A similar trend was observed for SPAD readings, where hybrids GE 26, GE 03, and GE 29, which also showed high Stress Tolerance Index (STI) values, exhibited higher SPAD under drought stress. This suggests that these hybrids may maintain better chlorophyll content under water-limited conditions, contributing to sustained photosynthetic activity and yield. This is consistent with findings by Kira et al. (2016), who reported that drought reduces chlorophyll concentration and nitrogen levels in maize leaves. Hybrid GE 26 and GE 03 recorded the maximum STI value of 1.10, while hybrid GE 19 displayed the lowest value of 0.52. GE 26 also exhibits relatively higher STI values for ear length and density traits that are strongly related to high yield, as longer ears with higher density generally contribute to increased grain production per plant. In contrast, GE 03 shows relatively higher STI values for ear height, stem diameter and 1,000 kernel weight, indicating superior performance in these traits under drought conditions. Besides grain yield and SPAD, GE 29 also exhibits significant STI values for ear height and diameter underscoring the close relationship among these yield components and the final yield of the maize hybrid candidate.
Hierarchical clustering grouped the measured traits and 33 hybrid candidates into three distinct clusters based on STI variation: cluster 1 with 15 hybrids, cluster 2 with 11, and cluster 3 with 7. These clusters reflect close genetic or phenotypic associations, with hybrids sharing similar STI characteristics grouped together. Cluster 1, which consists of 15 hybrids, excelled in traits related to flowering, including DTS, DSL, and ASI. The cluster also showed strong performance in SD, indicating greater resilience during early growth stages, which is critical for stress tolerance in the initial development phase. Cluster 2, composed of 11 hybrids, led in yield-related traits. These hybrids showed superior performance in GY, PH, EH, SPAD, NKR, EL, ED, and KW1000, highlighting their potential for high productivity under favorable conditions. The strength of this cluster in these key agronomic traits suggests its suitability for maximizing yield in optimal environments. Cluster 3, which includes 7 hybrids, was dominated by hybrids with lower tolerance to drought stress, as indicated by their inferior performance across several stress-related traits. This cluster’s performance points to reduced adaptability to environments with high abiotic stress, particularly drought.
Furthermore, the column-based clustering of the 16 examined traits resulted in the formation of two primary clusters. The first cluster encompassed 13 traits, which were largely associated with growth, yield potential, and physiological responses, while the second cluster, consisting of 3 traits, was more related to reproductive efficiency and kernel characteristics. Cluster-1 include Cluster-1 included DSL, DTS, NR, PH, LA, SPAD, GY, SD, NKR, EL, ED, and ASI. These traits demonstrated strong interrelationships, suggesting their significant roles in determining plant productivity and growth patterns. In contrast, cluster-2, comprising SP, LAG, and 1,000 kernel weight, represented a group of traits with distinct associations, related to reproductive efficiency and biomass allocation. The clustering categorizes hybrids into two main groups: drought-tolerant hybrids and drought-sensitive hybrids.
Tolerant hybrids, such as GE 26 and GE 03, show high STI values in key traits such as GY, and are supported by agronomic and physiological characteristics such as EL, ED, NKR, SD, PH, EH and SPAD. Conversely, sensitive hybrids, such as GE 07, GE 15, GE 20, GE 30, GE 31, GE 32, and GE 33, exhibit low STI values in these traits. However, the grouping of other hybrids does not clearly explain the drought adaptation abilities.
Relationship among drought tolerance indices, yield reduction, and yield
To assess the drought tolerance of hybrid candidates in relation to grain yield and yield reduction, four key indices were included: SSI, STI, YSI and HI. SSI and YSI are essential indicators for assessing maize tolerance to drought stress, highlighting a hybrid’s capacity to reduce yield loss. The strong correlation between SSI and YSI values with the percentage of yield reduction under stress, reflected by R2 values of 1.00 and 0.99 respectively, indicates that genotypes with lower yield reductions under drought stress demonstrate higher tolerance levels (Figures 5, 6). Specifically, a smaller percentage of yield reduction indicates that a maize genotype can better withstand stress conditions, reflecting its resilience and adaptability. Therefore, incorporating SSI and YSI into the selection criteria for maize breeding programs will facilitate the differentiation between drought-tolerant and susceptible genotypes.
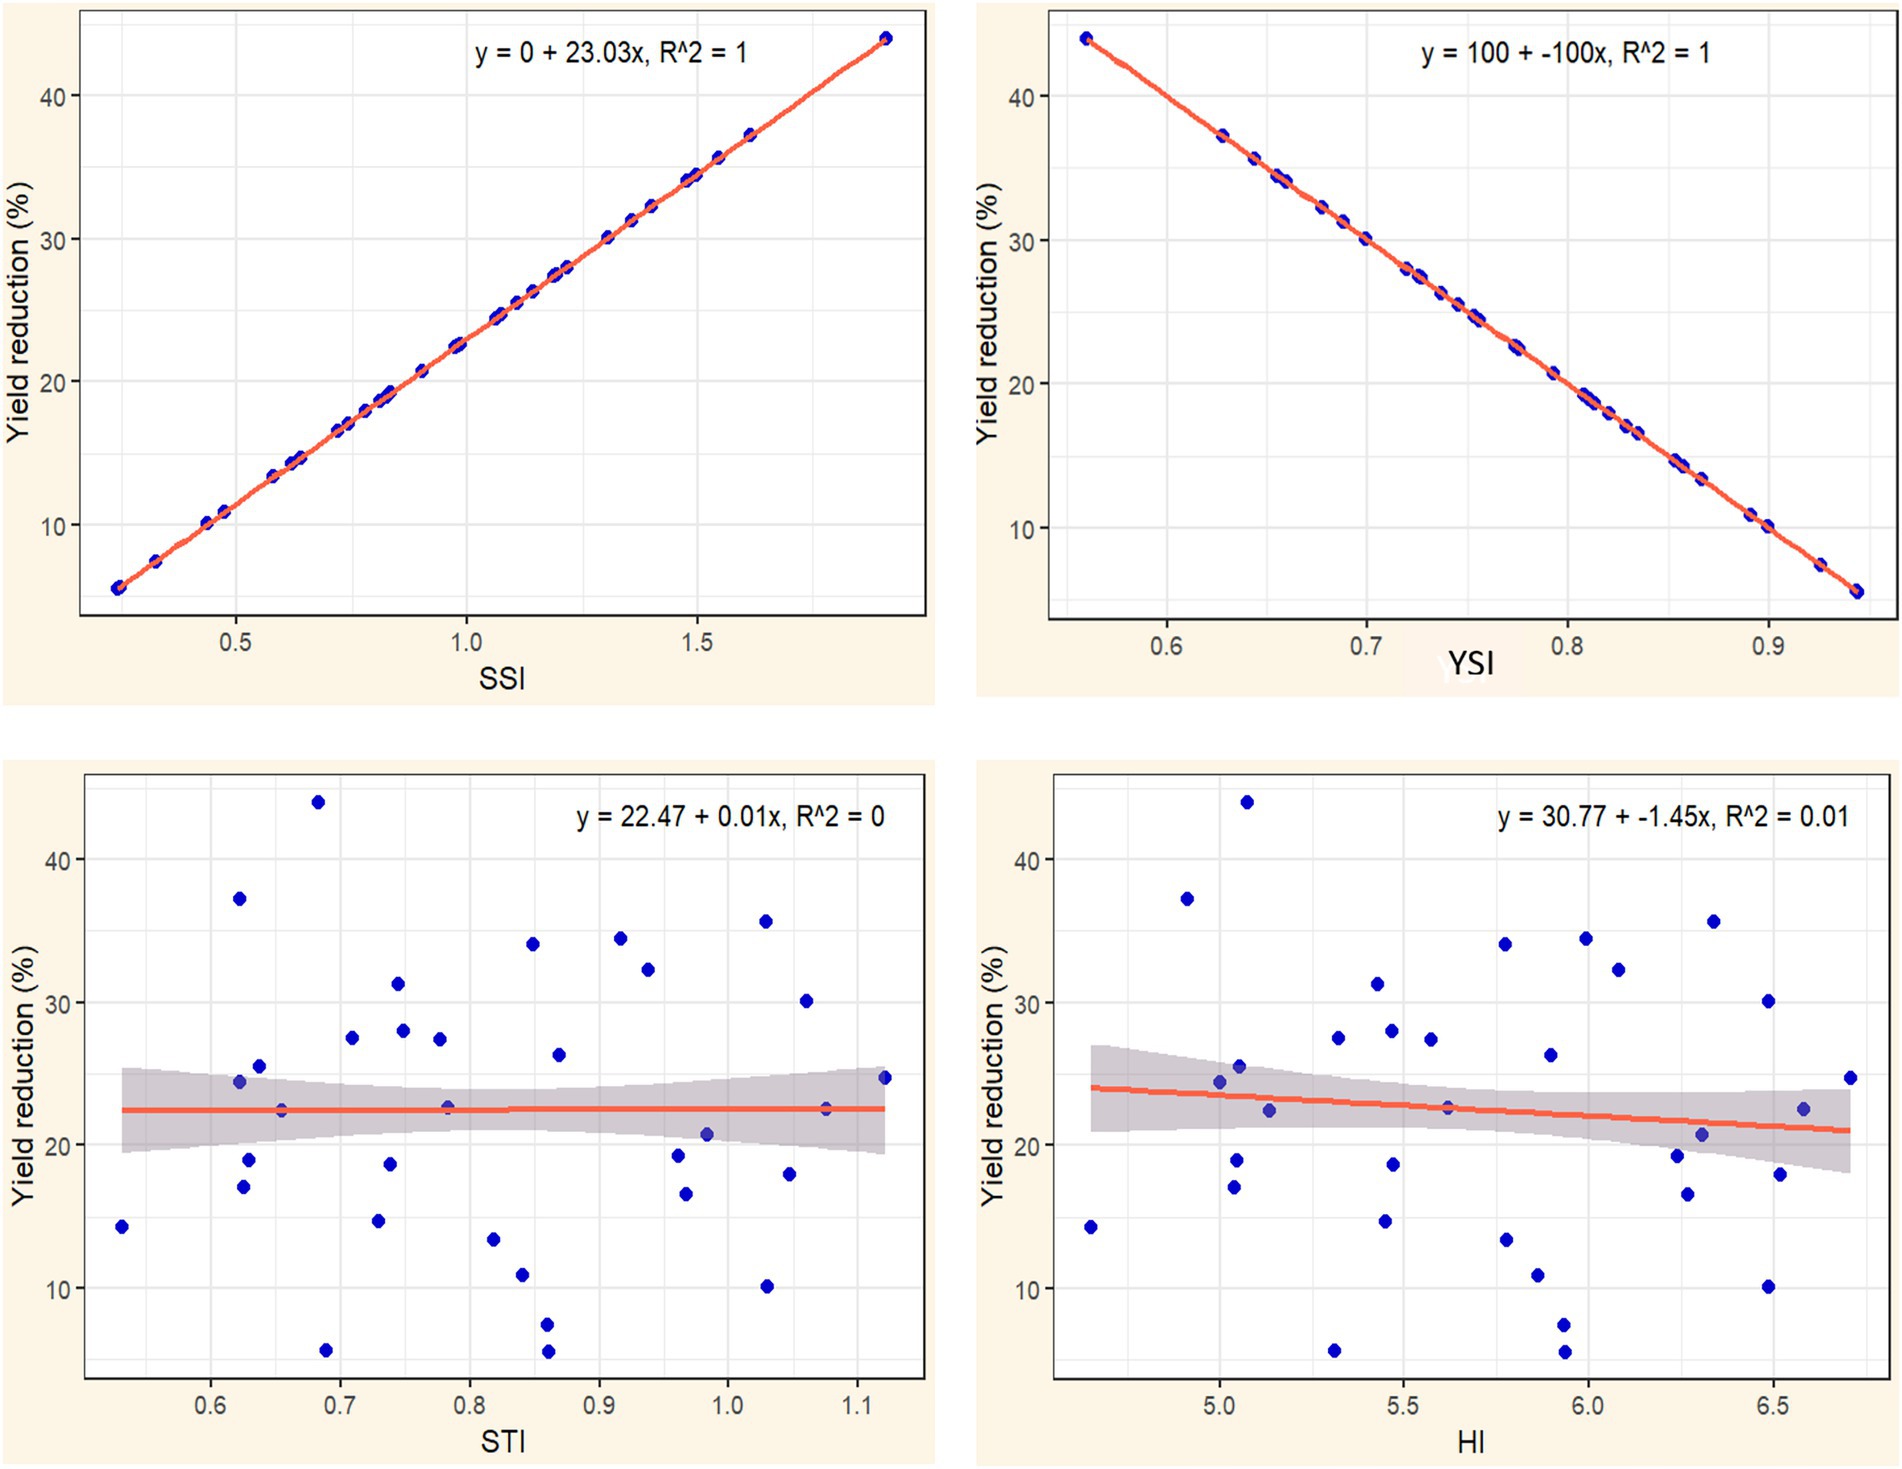
Figure 5. The relationship between four drought tolerance indices (STI, SSI, YSI, and HI) and percentage of yield reduction under drought conditions.
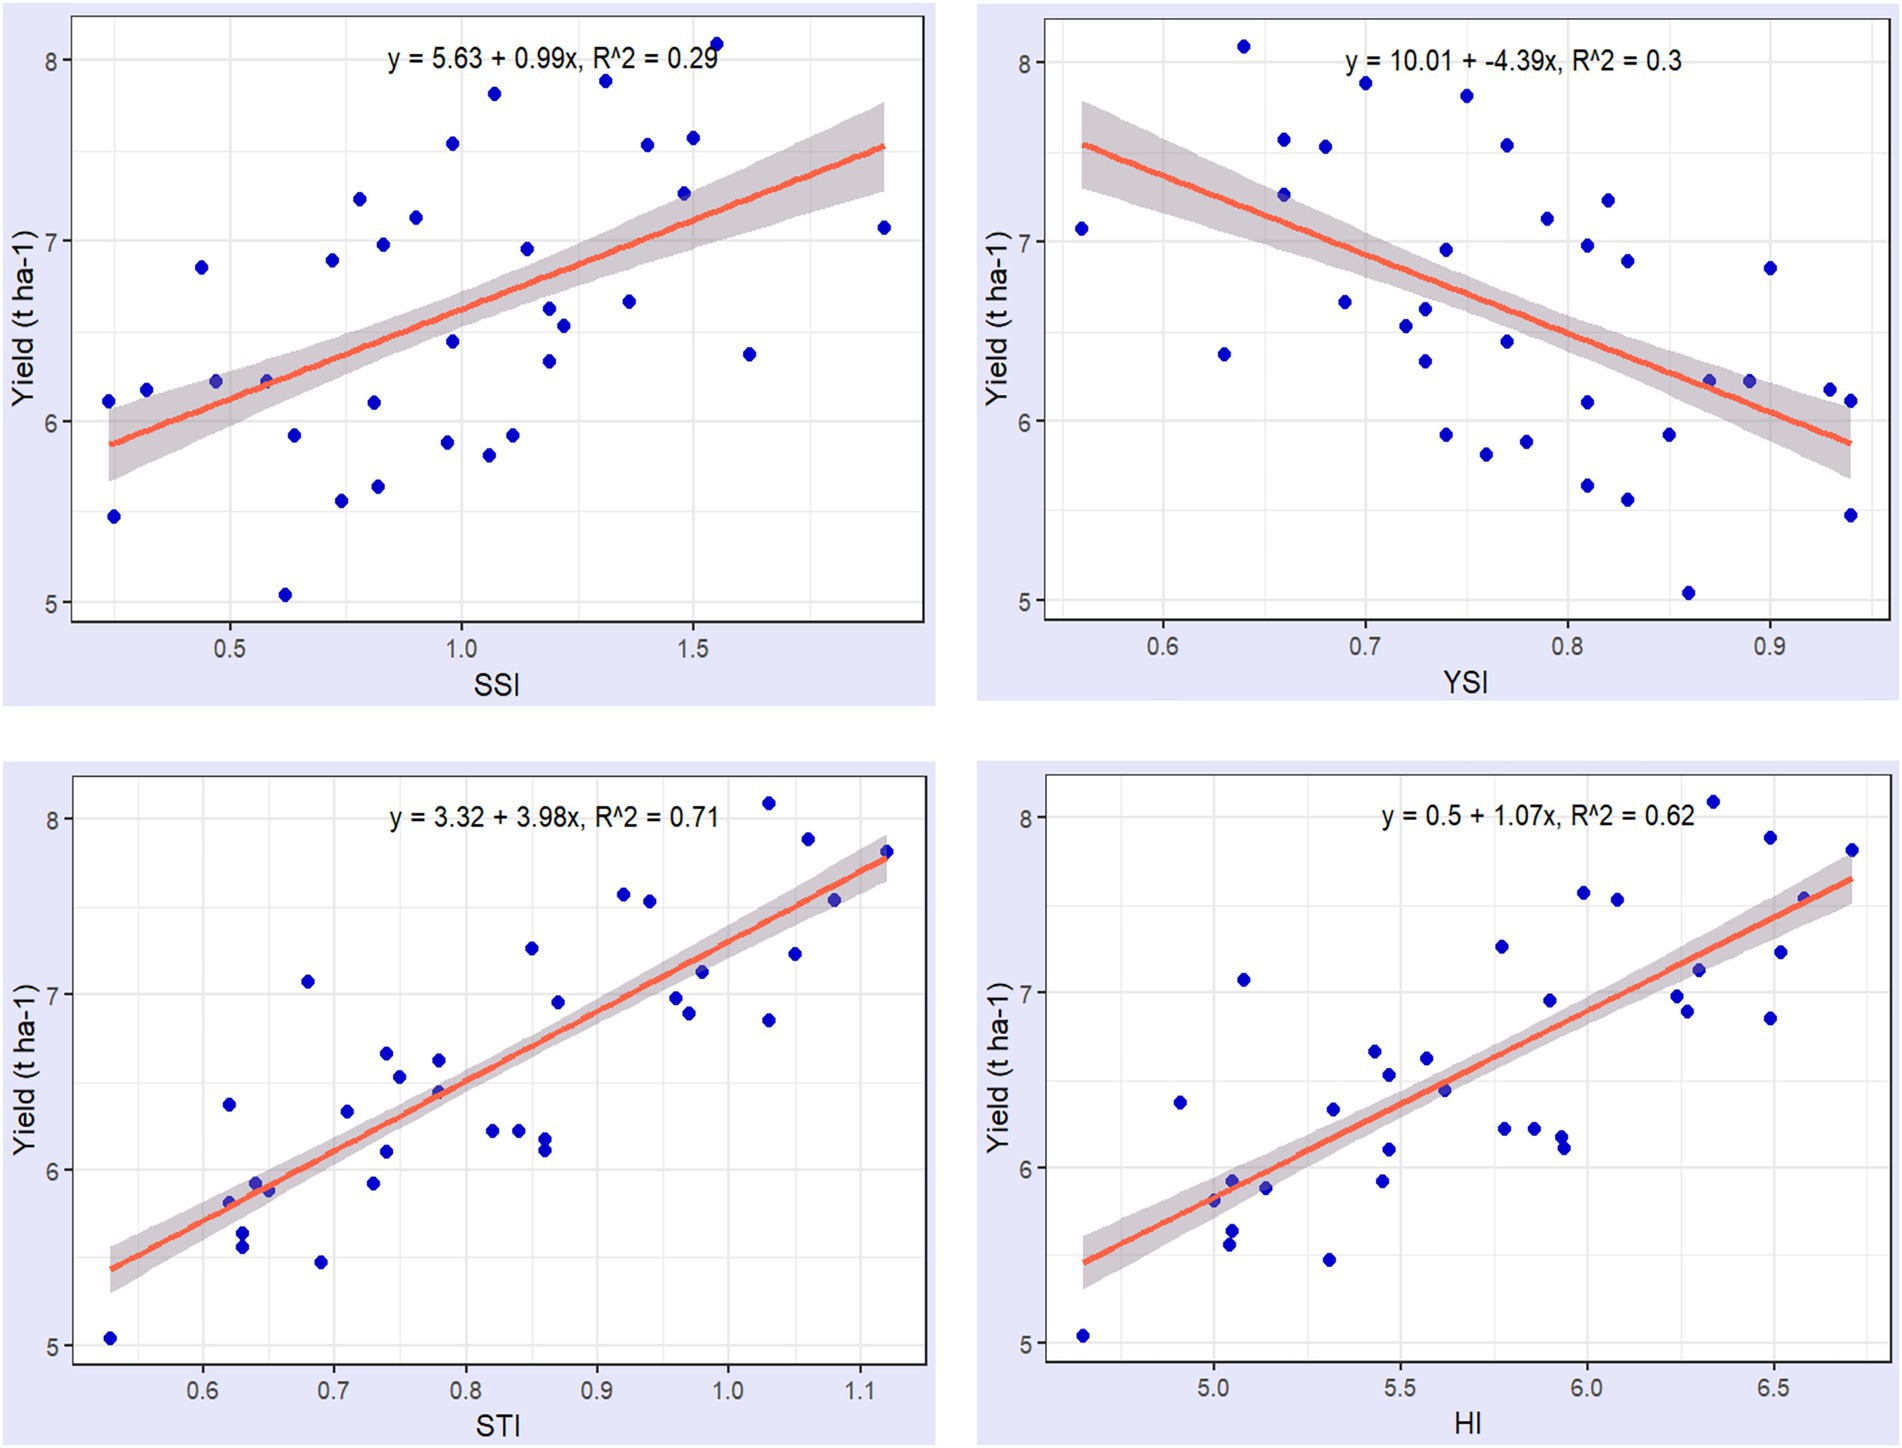
Figure 6. The relationship between four drought tolerance indices (STI, SSI, YSI, and HI) and hybrid productivity under drought stress conditions.
Maize genotypes with greater tolerance are characterized by lower SSI values and higher YSI values. Figure 5 demonstrates that a lower YSI value is associated with a reduced percentage of yield loss, indicating higher tolerance to stress conditions. Conversely, a higher YSI value signifies that a genotype is more effective at minimizing yield loss, reflecting enhanced tolerance under stressful conditions. The relationship between yield reduction, SSI, and YSI highlights the varying response of maize genotypes to drought stress. Genotypes with a high SSI, such as GE07 (1.62) and GE20 (1.91), show significant yield reductions under drought, indicating a high susceptibility to stress. These genotypes experience over 35% reduction in yield, demonstrating their inability to maintain performance in suboptimal conditions. In contrast, genotypes like GE29 (SSI 0.03, YSI 1.01) and GE26 (SSI 0.17, YSI 1.04) exhibit minimal yield reduction, maintaining stable yields under drought due to their low stress susceptibility and high stability index. This suggests that selecting genotypes with lower SSI and higher YSI, is crucial for improving yield resilience and consistency in drought-prone environments.
The tolerance criteria for maize genotypes based on SSI and YSI do not adequately reflect yield potential differences among genotypes with similar tolerance levels. Both high- and low yielding genotypes can exhibit comparable SSI values. In Table 3, for instance, under drought stress, the hybrid GE21 has an SSI of 0.78 and a YSI of 0.82, values that are almost identical to GE23, which has an SSI of 0.74 and a YSI of 0.83. Despite this similarity, GE21 has a higher yield, producing 5.93 t/ha compared to GE23’s 4.61 t/ha under the same conditions. This demonstrates that tolerance criteria based on SSI and YSI do not necessarily correlate with productivity, as yield is influenced by the genotype’s ability to limit reductions under stress. Thus, when selecting drought-tolerant maize genotypes using SSI and YSI, yield performance should also be considered.
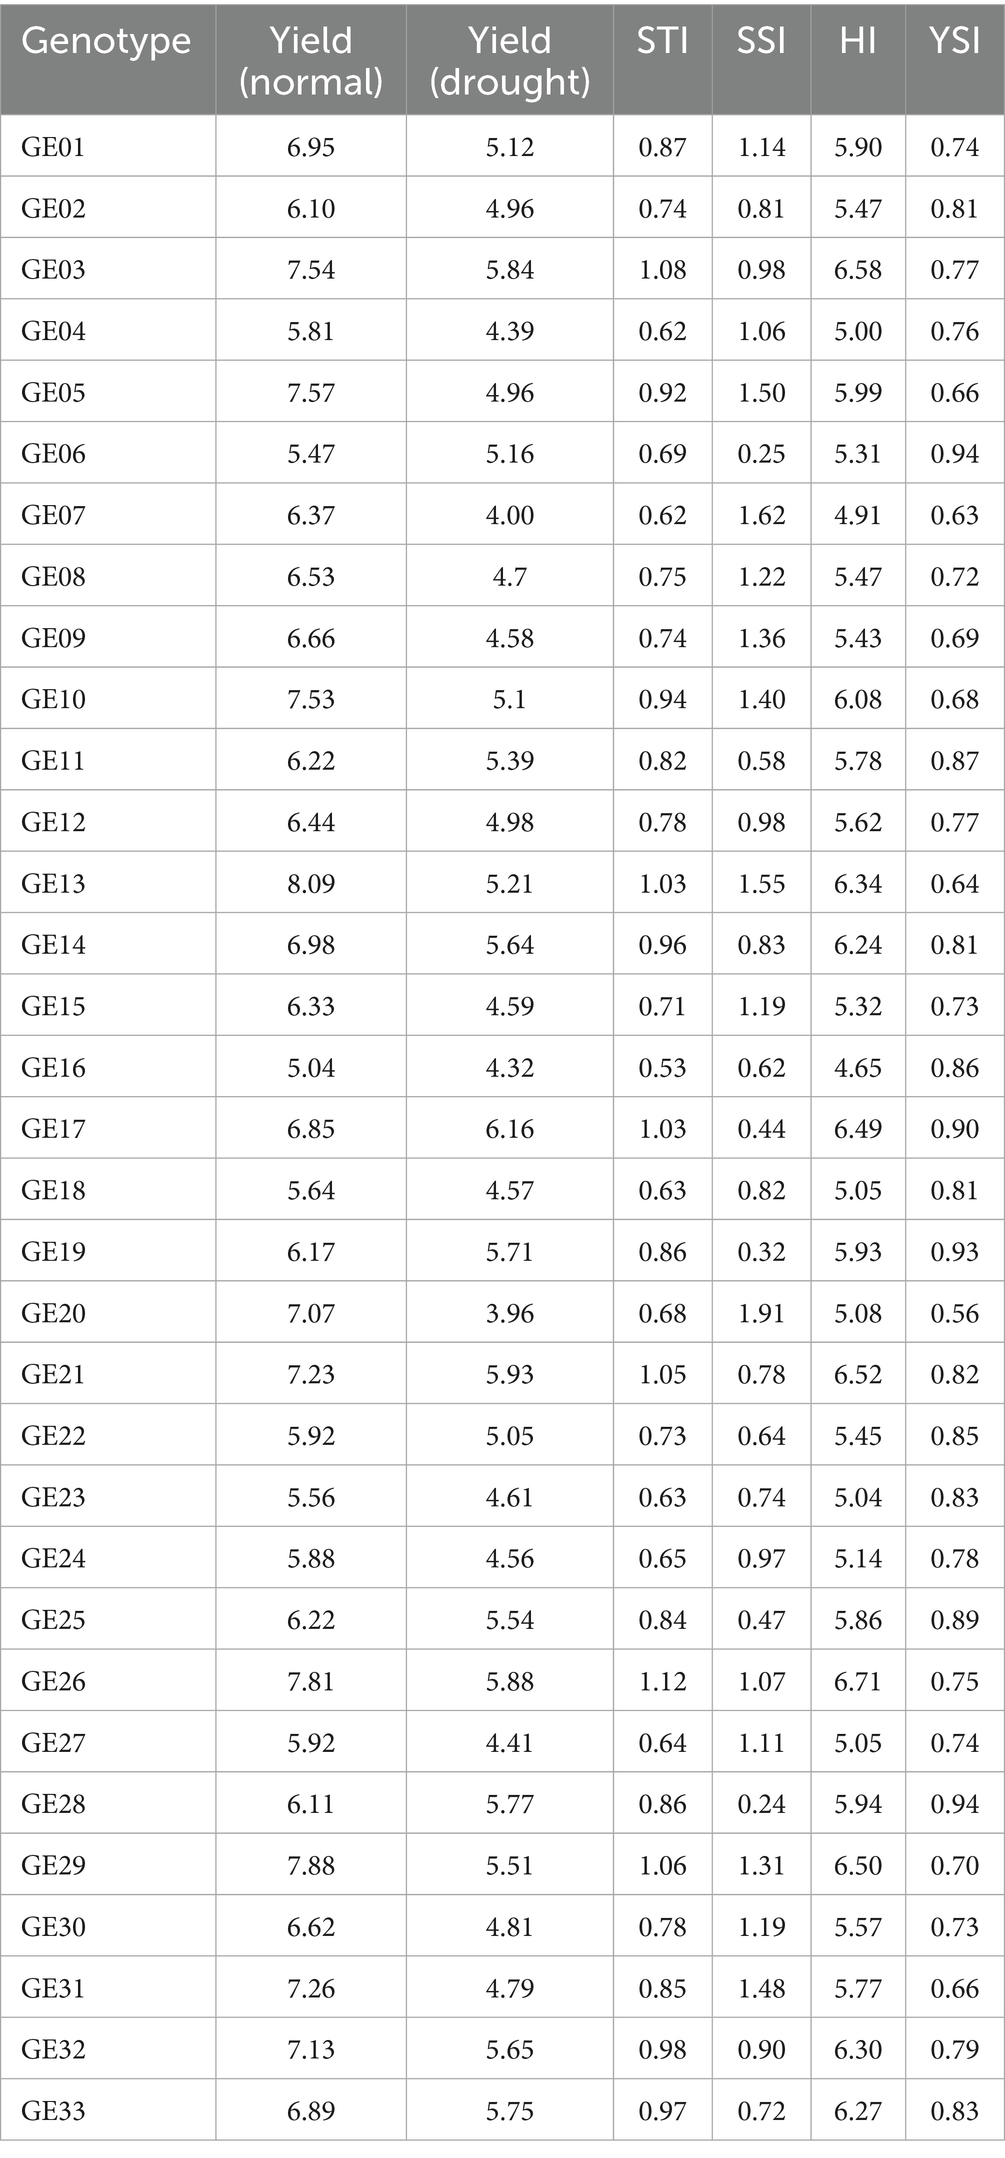
Table 3. Hybrid yield reduction and corresponding values of drought tolerance indices.
The tolerance of a maize genotype assessed by its productivity under stress conditions is more accurately reflected through the STI and HI indices. As shown in Figure 6, STI and HI exhibit a stronger correlation with maize productivity under drought stress, with a coefficient of determination between 0.71 and 0.62, respectively. Particularly, STI demonstrates a stronger correlation with productivity across various drought conditions compared to the other tolerance indices. A higher STI or HI value indicates greater productivity under stress and high tolerance to drought. This was demonstrated in the hybrid maize varieties GE26, GE29, GE03, and GE21, which under drought stress conditions exhibited STI values greater than 1.05 and HI values exceeding 6.5. These hybrids also had the highest productivity levels, surpassing 7.2 t ha−1 under normal conditions and 5.0 t ha−1 under drought conditions (Table 3). Drought tolerance in hybrids like GE 26 and GE 03 is supported by their ability to maintain strong vegetative, physiological, and agronomic traits.
Drought tolerant hybrid selection
Maize breeders mainly focus on selecting genotypes that exhibit both high yield potential and strong drought tolerance, aiming to identify varieties that can maintain productivity under stress conditions. In this study, 15 genotypes with the highest drought-tolerant indices, including STI-GY, STI-LAG, STI-SP, and HI-GY, were evaluated to identify the best drought-tolerant hybrids (Table 4). To further refine the selection process, a Venn diagram was utilized to compare and integrate the relationship between various stress tolerance indices used to assess maize yield under drought stress conditions, weight the overlap of genotypes across four key metrics: GY, LAG, SP, and HI. The central overlap, where all four indices intersect, identifies six genotypes that exhibit strong stress tolerance across all parameters. These genotypes demonstrate high grain yield, efficient plant architecture, optimized ear/kernel formation, and stable harmonic index. This comparative approach allowed for a more comprehensive identification of superior maize hybrids by highlighting genotypes that consistently performed well across various drought tolerance and productivity metrics.
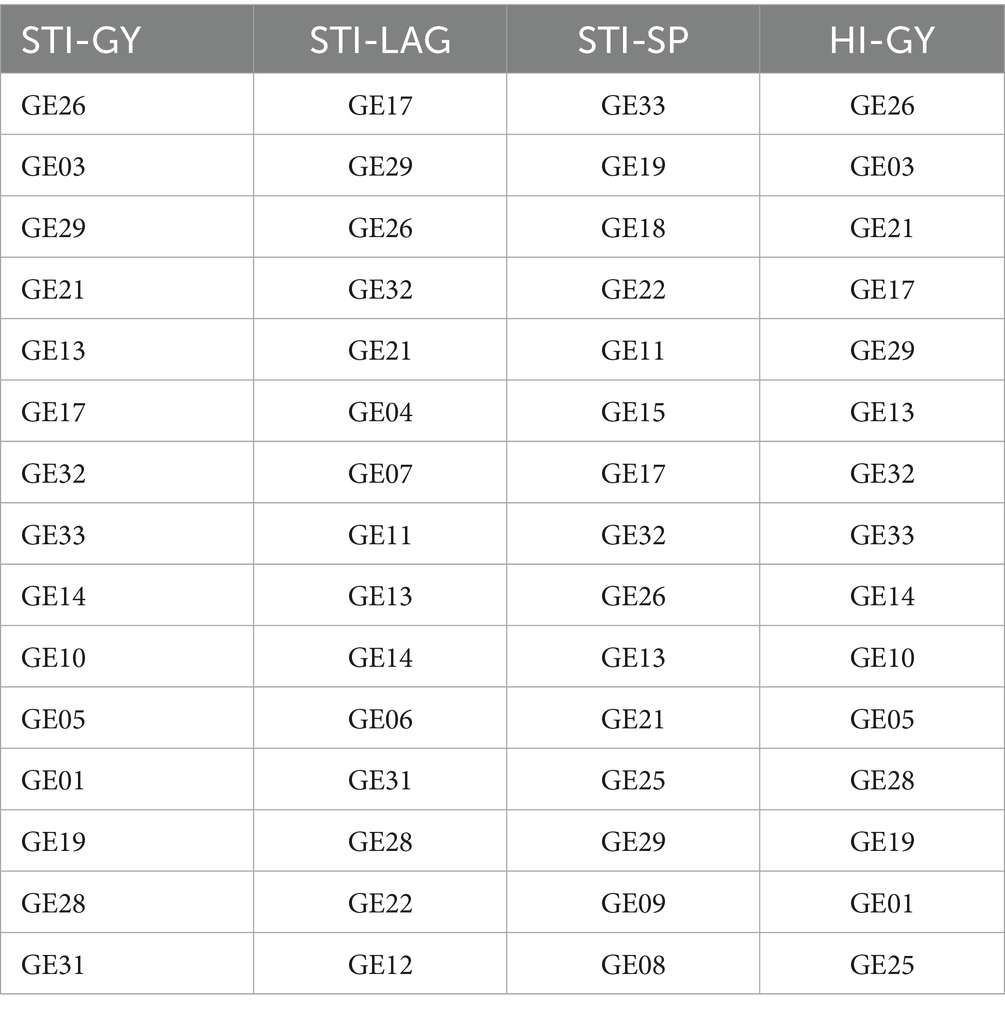
Table 4. Selected genotypes based on four tolerance indices.
The analysis revealed that the six drought-tolerant hybrids belonged to three distinct clusters, with GE13 and GE17 from Cluster 1, GE21, GE26, and GE29 from Cluster 2, and GE32 from Cluster 3 (Figure 7). These hybrids demonstrated a higher drought tolerance level, suggesting that genetic variation between these clusters plays a significant role in their drought resilience. The selected genotypes showed minimal reduction in yield, leaf area, and grain filling under drought stress, indicating their robustness under adverse conditions. This data is valuable for future breeding, highlighting genotypes as promising candidates for developing drought-tolerant maize with stable yields in both stressed and normal environments.
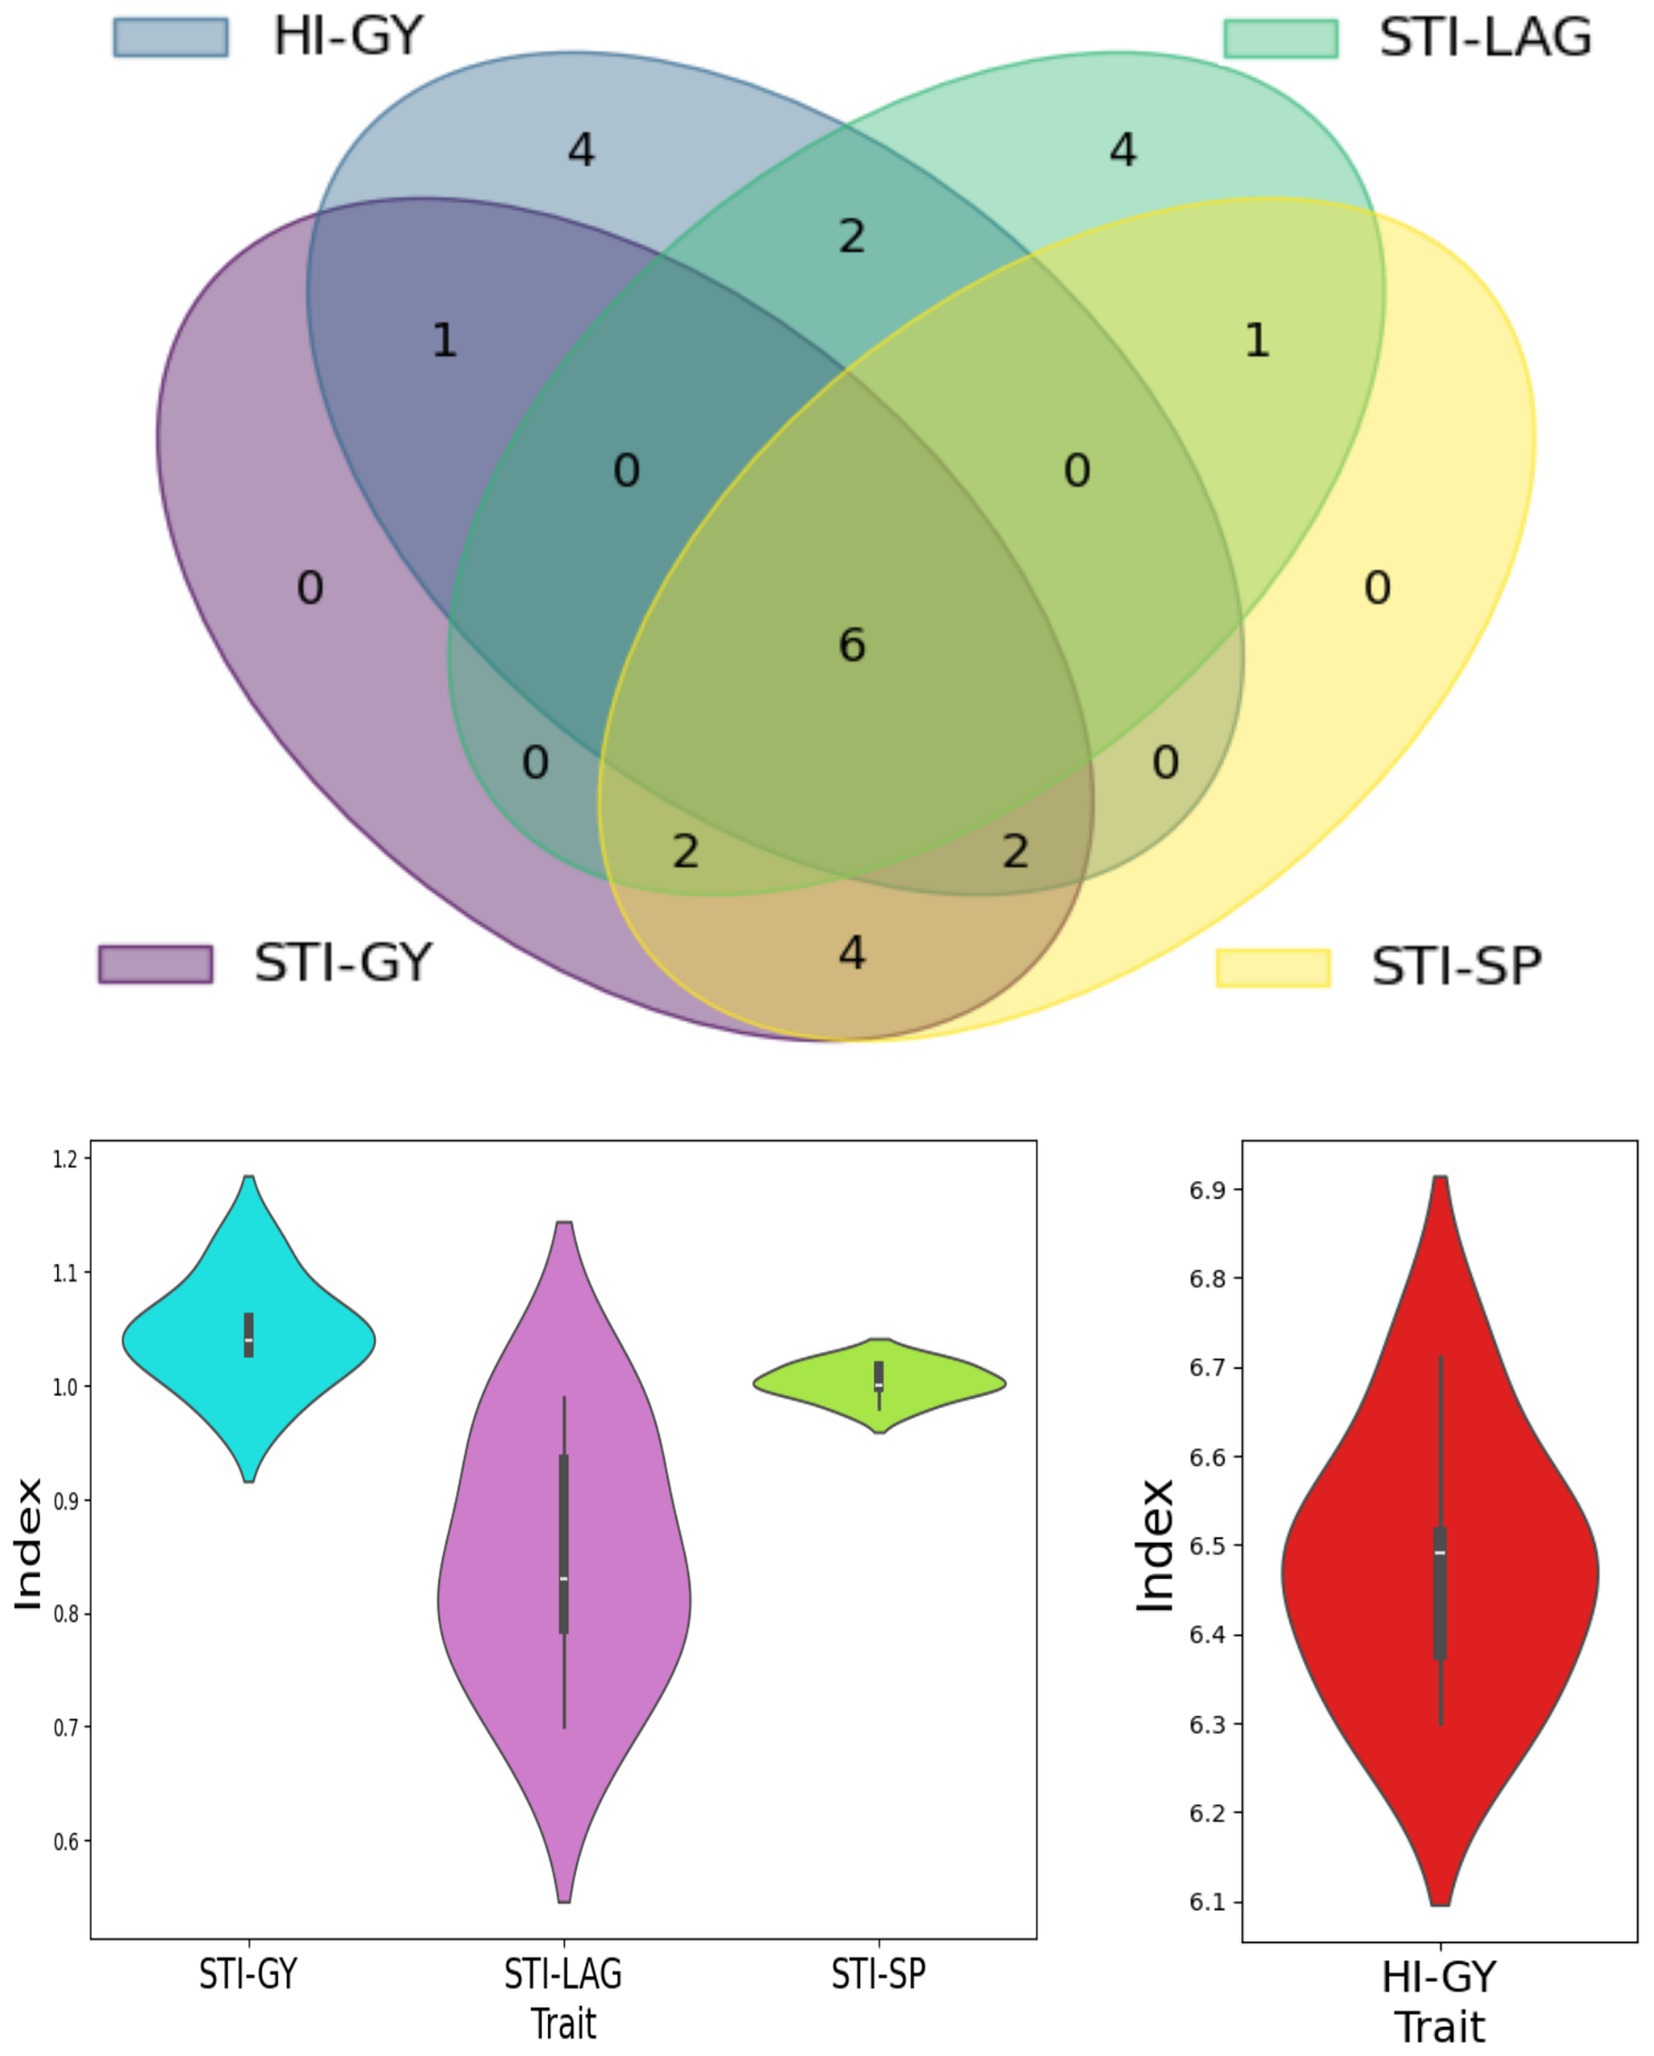
Figure 7. Selection of drought-tolerant maize genotypes based on four selected tolerant indices.
The study provides a thorough analysis of the impact of drought stress on various morpho-physiological traits and yields performance of tropical maize hybrids, emphasizing the significant challenges posed by water stress. The results confirm that drought stress reduces plant height, leaf area, stem diameter, and chlorophyll content, aligning with previous research that links these reductions to impaired cell expansion and elongation (Bolanos and Edmeades, 1996). These reductions are apparent through various traits such as ASI, which increased by 61.8% under drought, disrupting pollination synchrony and yield potential. Other yield components, such as ear diameter, kernel weight, and the number of kernel rows, also exhibit sensitivity to drought stress. The stability of the number of kernels per row under stress further suggests its resilience as a potential selection trait in breeding programs focused on drought tolerance (Magorokosho and Tongoona, 2003).
A multivariate selection approach was applied to identify maize hybrids with optimal trait combinations under drought conditions, using the MGIDI index as an integrative tool. Factor analysis with varimax rotation grouped the nine evaluated traits into three distinct components. The first factor (FA1) captured variation associated with yield-contributing traits such as ear diameter (ED) and 1,000-kernel weight (KW1000), along with an inverse relationship to plant height (PH) and shelling percentage (SP), suggesting a trade-off between compact plant architecture and grain development. The second factor (FA2) included traits linked to plant vigor and productivity, namely leaf area, stem diameter, and grain yield, while the third factor (FA3) was defined by opposite contributions from leaf angle and ear length, representing differences in canopy architecture and reproductive growth. On average, 67% of the trait variation was explained by these three factors. The trait biplots (Figures 8a,b) effectively illustrated these associations, where traits clustering in the same quadrant shared positive correlations, and those in opposite directions reflected functional trade-offs within the genotype profiles.
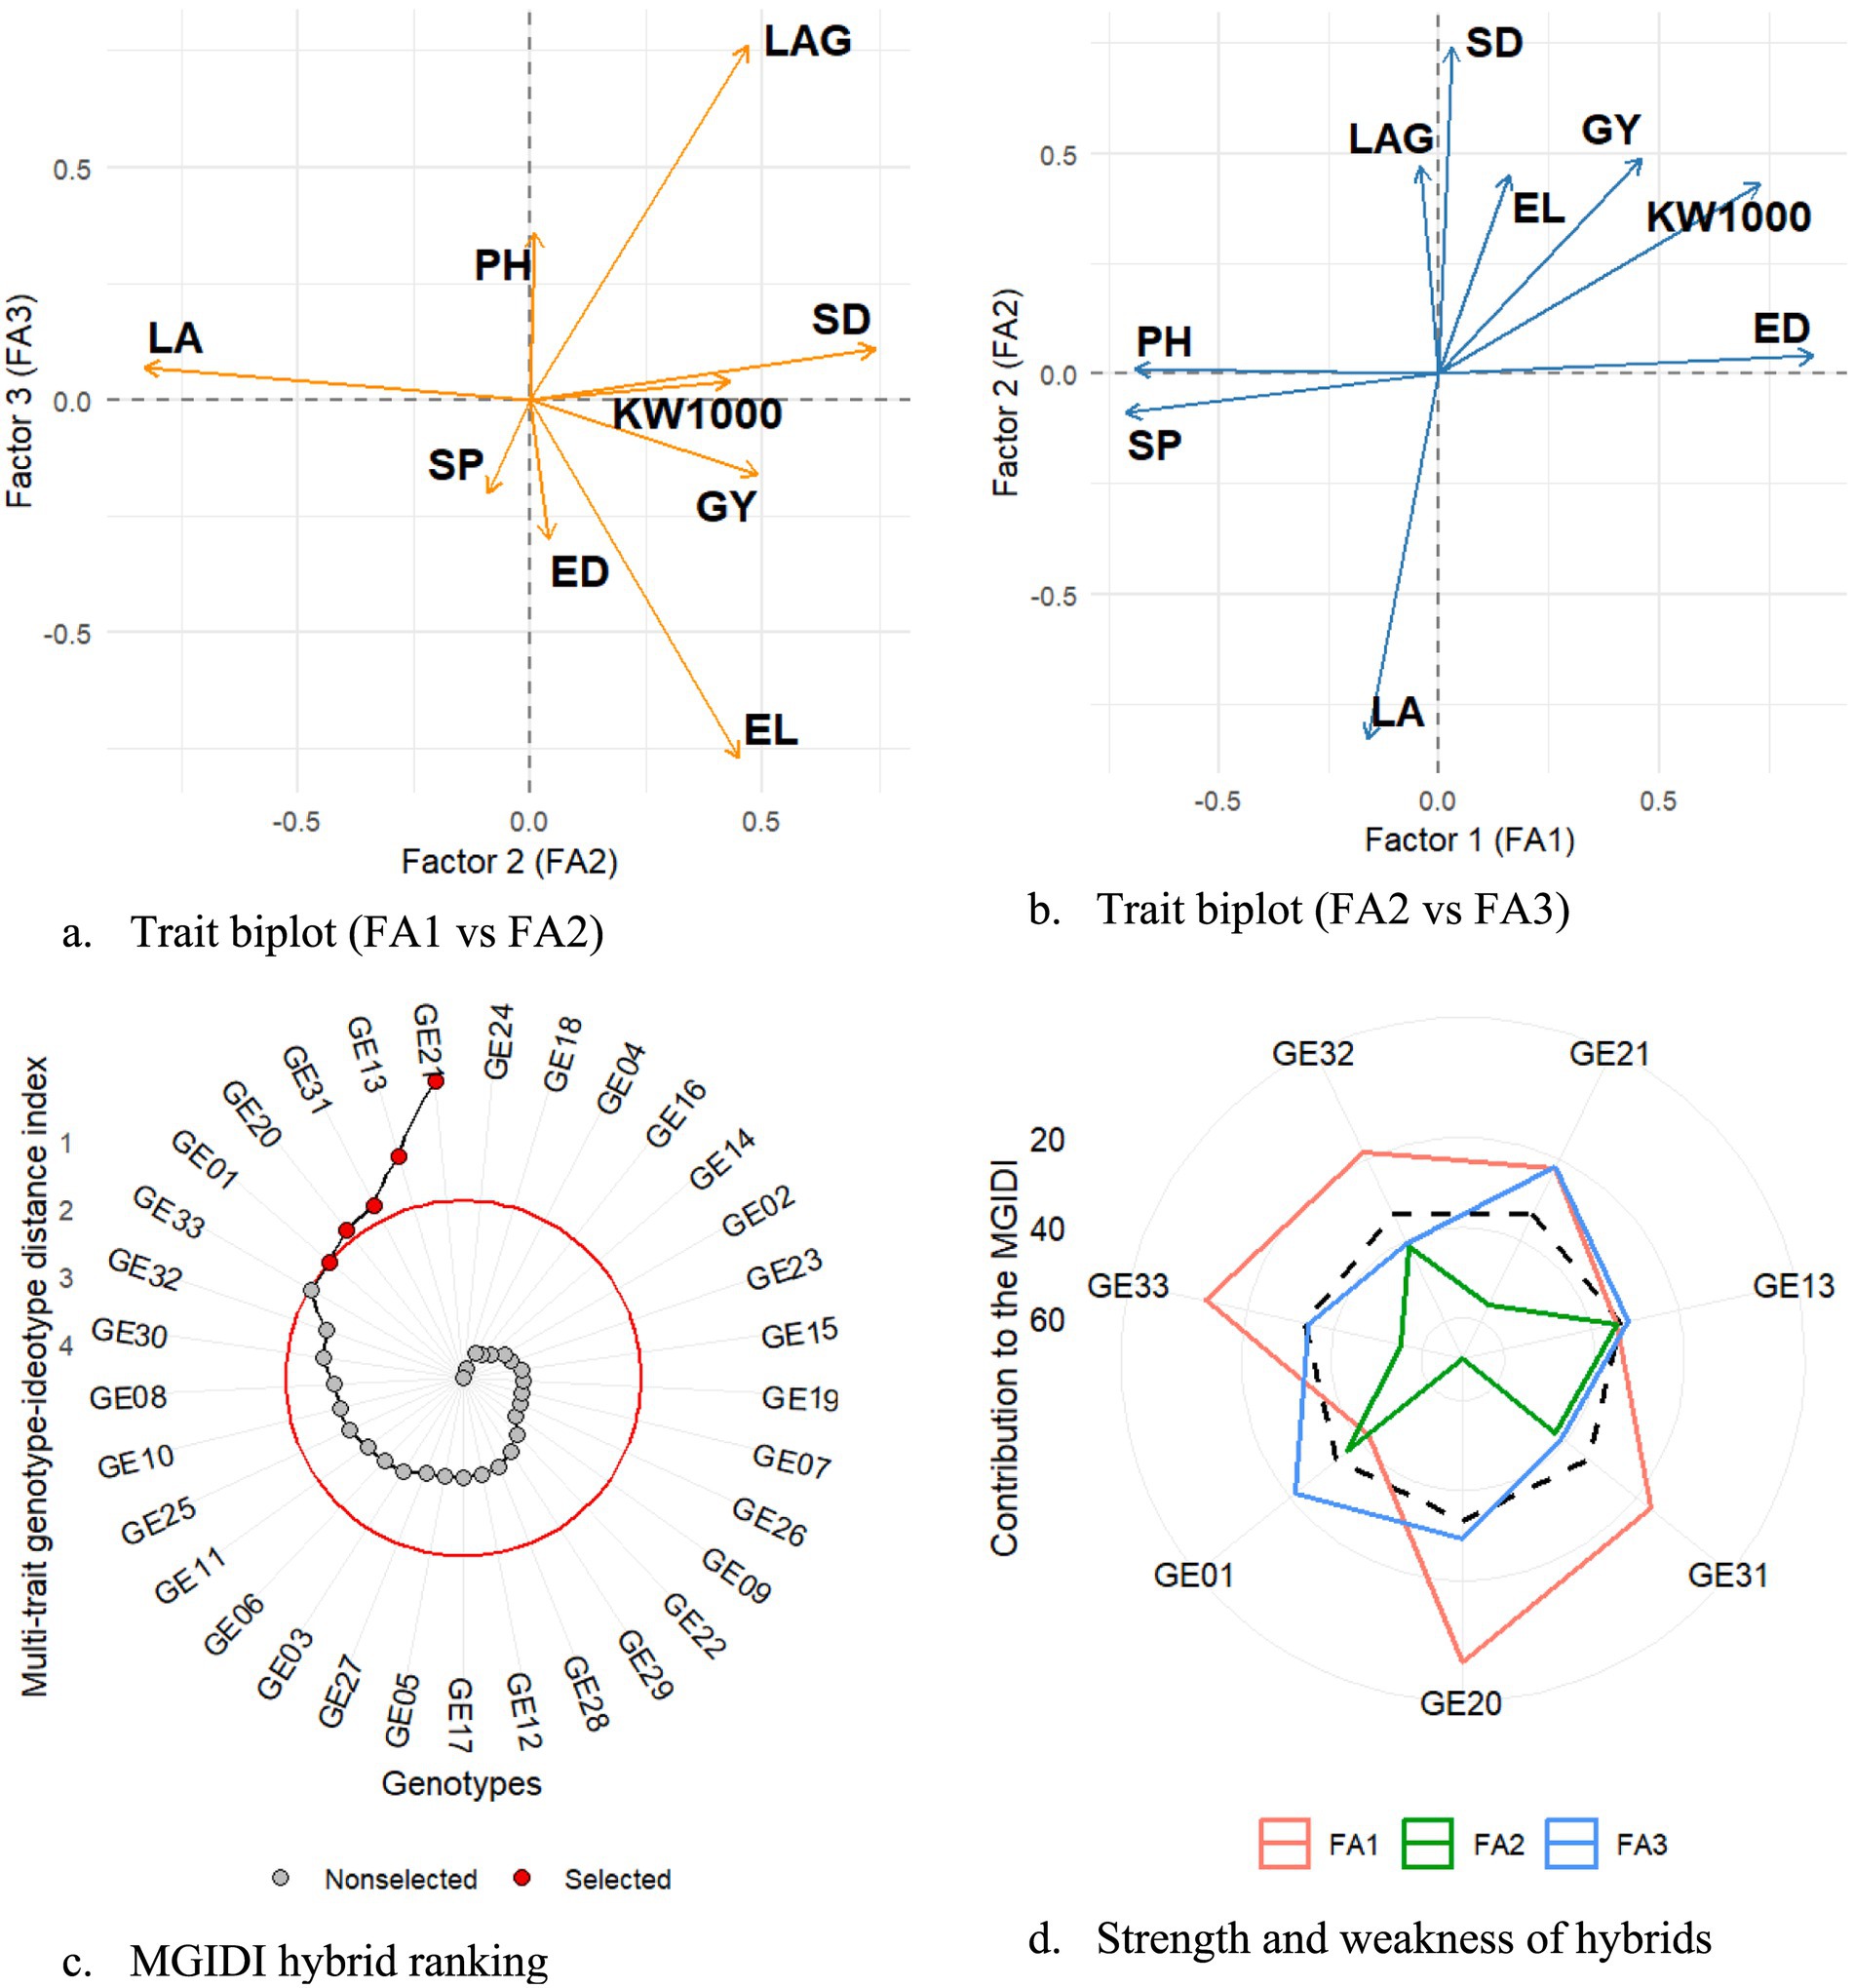
Figure 8. (a) Trait biplot based on FA1 and FA2. (b) Trait biplot based on FA2 and FA3. (c) MGIDI-based hybrid ranking. (d) Strengths and weaknesses of selected hybrids.
Genotype selection through MGIDI ranked hybrids based on their overall proximity to a multi-trait ideotype, with GE21, GE13, GE31, GE20, GE01, and GE32 emerging as the most desirable entries (Figure 8c). These genotypes combined favorable expressions across different trait dimensions. GE21 showed strong alignment with FA1, indicating its advantage in kernel weight and efficient plant stature. GE13 performed well across both FA2 and FA3, reflecting a balanced trait composition including leaf efficiency and superior ear traits. GE31 exhibited notable performance in FA2, corresponding to higher grain yield, leaf area, and stem robustness. The strengths and weaknesses chart (Figure 8d) provided further insight into how each hybrid contributed across factors. Selection differentials confirmed targeted gains: positive increases in key traits such as 1,000-kernel weight (+0.59%) and ear length (+1.58%) were observed, while reductions in plant height (−0.20%) and leaf angle (−2.85%) may support improved lodging resistance and canopy efficiency. These results demonstrate the utility of MGIDI in simplifying complex trait data and supporting informed decisions in hybrid development for drought-prone environments.
Discussion
Drought tolerance in maize involves complex physiological responses and genetic controls that coordinate to maintain plant productivity under water-limited conditions. In this study, significant genotype × environment interactions and a 23% grain yield reduction under drought stress reflect not only phenotypic plasticity but also a diverse set of physiological and genetic adaptations. Photosynthetic efficiency showed a 12.9% decline under drought, which correlates with reductions in chlorophyll content and thus limited carbon assimilation. Drought stress impairs chloroplast integrity and pigment biosynthesis, thereby reducing photosynthetic capacity. SPAD values thus serve as a proxy for leaf senescence and stress-induced oxidative damage. Genotypes such as GE26 and GE03 maintained higher SPAD under drought, suggesting enhanced antioxidative defense mechanisms or delayed senescence traits, which have been linked to increased drought resilience (Rivero et al., 2007). Furthermore, Zainuddin and Aqil (2021) reported that leaf color is closely related to SPAD readings, as both indicate chlorophyll levels on maize leaves.
This physiological decline in SPAD under drought reflects broader disruptions in reproductive and vegetative development. The 61.8% increase in ASI indicates impaired reproductive synchrony, a known drought-induced trait disruption that hampers kernel set (Bolanos and Edmeades, 1996). Longer ASI under stress suggests delayed silk emergence relative to pollen shed, reducing fertilization success. The stability of ASI in genotypes such as GE21 implies efficient hormonal regulation that supports silk elongation under drought (Bruce et al., 2002). The relative stability of NKR (kernels per row) across treatments further highlights its robustness and potential as a selection index for drought resilience.
In addition to reproductive traits, structural traits like stem diameter, plant height, and 1,000-kernel weight were significantly reduced under drought. These traits are associated with turgor maintenance, vascular development, and assimilating partitioning. Song et al. (2018) reported that stem diameter is not merely structural but also reflects hydraulic conductance and assimilate flow to reproductive sinks. The ability of GE29 and GE03 to sustain SD and PH under drought implies well-maintained xylem integrity and cellular osmotic adjustment.
Among reproductive traits, kernel development is especially vulnerable to drought stress. Kernel weight, reduced by 10.8%, is highly sensitive to water deficit due to impaired grain filling. Beyond phenotype-level observations, these patterns are rooted in specific genetic architectures. The variation in stress indices (STI, SSI) and trait clustering clearly reveal underlying genetic controls. The clustering patterns reflect functional genomic divergence: Cluster 2 genotypes (GE26, GE29) exhibited superior GY, EL, ED, and NKR under drought, traits strongly associated with two key loci on chromosome 2 (bins 2.09 and 2.03) jointly controlling grain yield, 100-kernel weight, and kernel size traits (Yang et al., 2016).
Furthermore, high STI values in kernel traits (ED, NKR) suggest favorable alleles for reproductive resilience. The multivariate analysis further validated these relationships by identifying genotype clusters aligned with stress performance metrics. The PCA biplot and hierarchical clustering confirmed the multidimensional nature of drought adaptation. Traits such as SPAD, EL, and GY, which are grouped closely under stress, suggest a physiological model that integrates photosynthesis, resource allocation, and reproductive output. Particularly, the ability to preserve grain yield under drought has emerged as a primary criterion in evaluating genotype performance (Chukwudi et al., 2021; Su et al., 2022). While STI provides a reliable indicator of drought resilience by integrating yield stability and potential, reliance solely on SSI may mask true genetic potential, as observed in GE21, which showed comparable SSI values to low-yielding hybrids despite its superior yield under drought. The high contribution of NKR and SD to PC2 and PC1, respectively, underscores their utility as selection anchors in breeding programs.
The Venn diagram analysis and violin plots provided valuable insights into the variability of drought tolerance across hybrids, emphasizing that multi-criteria selection frameworks can effectively capture the complexity of stress adaptation. The central overlap among the four drought indices revealed a set of genotypes with strong and consistent tolerance across traits, supporting the utility of combining multiple metrics to improve selection precision. These genotypes reflect a balanced integration of physiological resilience and yield potential, with optimized plant architecture, efficient kernel development, and a stable harmonic index. This approach aligns with prior findings (Azrai et al., 2023), which highlighted that integrating multiple indices can help balance high yield with stress tolerance in genotype selection. Such multi-layered evaluation frameworks offer a solid foundation for identifying hybrids suitable for water-limited environments and contribute to advancing sustainable agriculture and food security.
Beyond the index-based overlap, the application of MGIDI provided an important dimension to the selection process by ranking hybrids according to their closeness to an ideal multi-trait profile. MGIDI results aligned with the multi-index approach, with hybrids such as GE13, GE21, and GE32 consistently emerging as desirable entries across both methods. This consistency strengthens confidence in their adaptability and confirms the value of MGIDI as a complementary selection tool. Furthermore, MGIDI facilitated the identification of additional promising genotypes such as GE31 and GE20 by highlighting their unique trait advantages within specific factorial dimensions. Strengths and weaknesses analysis underscored the diversity of trait contributions, while selection differentials revealed potential for targeted genetic gains. Positive shifts in traits like kernel weight and ear length, coupled with modest reductions in plant height and leaf angle, point toward improvements in canopy efficiency and lodging resistance. Future research should be directed to specific genotypes for in-depth biochemical and molecular marker analyses to more thoroughly characterize the mechanisms underlying drought tolerance.
Conclusion
This study integrated multi-trait and multi-index approaches to develop an effective screening strategy for identifying drought-tolerant tropical maize genotypes. Under field conditions across two tropical locations, 33 hybrids were evaluated using morphological, physiological, and yield-related traits, alongside four drought tolerance indices: STI, SSI, YSI, and HI. Drought stress led to substantial reductions in grain yield (23%), leaf area (20.7%), and plant height (12%), highlighting its significant impact on maize growth and productivity. Multivariate analyses, including PCA and hierarchical clustering, effectively captured genetic variability and grouped hybrids by performance. The integration of multi-trait indices and MGIDI analysis proved effective in identifying drought-tolerant maize hybrids with stable performance under stress conditions. Six hybrids, GE13, GE17, GE21, GE26, GE29, and GE32 were consistently highlighted for their yield stability and reduced drought-related losses. Notably, GE13, GE21, and GE32 were selected by both the multi-metric and MGIDI approaches, underscoring their robust adaptability across diverse trait dimensions. This integrated framework not only strengthens the understanding of the relationship between drought tolerance and yield but also provides a practical strategy for selecting elite maize hybrids suited to water-limited environments.
Data availability statement
The raw data supporting the conclusions of this article will be made available by the authors, without undue reservation.
Author contributions
MAz: Conceptualization, Funding acquisition, Investigation, Methodology, Project administration, Writing – original draft. MAq: Formal analysis, Writing – original draft, Writing – review & editing. RE: Formal analysis, Methodology, Supervision, Writing – original draft. NA: Data curation, Formal analysis, Validation, Writing – original draft. Suwardi: Data curation, Methodology, Validation, Writing – review & editing. BZ: Funding acquisition, Investigation, Methodology, Writing – original draft. MP: Investigation, Resources, Writing – original draft. TS: Project administration, Software, Supervision, Writing – review & editing. MFA: Conceptualization, Software, Writing – review & editing. MR: Conceptualization, Investigation, Validation, Writing – review & editing. MY: Funding acquisition, Project administration, Resources, Writing – review & editing. RL: Investigation, Software, Supervision, Writing – review & editing. Bahtiar: Funding acquisition, Investigation, Project administration, Resources, Writing – review & editing. Suwarti: Funding acquisition, Software, Supervision, Writing – review & editing. AS: Funding acquisition, Project administration, Validation, Writing – review & editing.
Funding
The author(s) declare that financial support was received for the research and/or publication of this article. This publication was supported by Hasanuddin University, Makassar, Indonesia.
Acknowledgments
We would like to express our sincere gratitude to Hasanuddin University for their generous support in facilitating the publication of this article, IAARD as well as BRIN for their assistance in supporting and facilitating the research.
Conflict of interest
The authors declare that the research was conducted in the absence of any commercial or financial relationships that could be construed as a potential conflict of interest.
Generative AI statement
The authors declare that no Gen AI was used in the creation of this manuscript.
Any alternative text (alt text) provided alongside figures in this article has been generated by Frontiers with the support of artificial intelligence and reasonable efforts have been made to ensure accuracy, including review by the authors wherever possible. If you identify any issues, please contact us.
Publisher’s note
All claims expressed in this article are solely those of the authors and do not necessarily represent those of their affiliated organizations, or those of the publisher, the editors and the reviewers. Any product that may be evaluated in this article, or claim that may be made by its manufacturer, is not guaranteed or endorsed by the publisher.
Supplementary material
The Supplementary material for this article can be found online at: https://www.frontiersin.org/articles/10.3389/fsufs.2025.1608307/full#supplementary-material
References
Agunbiade, V. F., and Babalola, O. O. (2024). Drought stress amelioration attributes of plant-associated microbiome on agricultural plants. Bioinf. Biol. Insights 18:11779322241233442. doi: 10.1177/11779322241233442
Agyare, W. A., Freduah, B. S., Ofori, E., Kpongor, D. S., and Antwi, B. O. (2013). Field and modelled maize (Zea mays) response to water stress at different growth stages. Glob. J. Biol. 2, 68–75.
Ahmad, N., Malagoli, M., and Wirtz, M. (2016). Drought stress in maize causes differential acclimation responses of glutathione and sulfur metabolism in leaves and roots. BMC Plant Biol. 16:247. doi: 10.1186/s12870-016-0940-z
Arisandy, D., Suwarno, W. B., and Azrai, M. (2017). Evaluation of drought tolerance in maize hybrids using stress tolerance indices. Int. J. Agron. Agric. Res. 11, 46–54.
Azrai, M., Aqil, M., Andayani, N. N., Efendi, R., Suarni,, Suwardi,, et al. (2024). Optimizing ensembles machine learning, genetic algorithms, and multivariate modeling for enhanced prediction of maize yield and stress tolerance index. Front. Sustain. Food Syst. 8, 11–14. doi: 10.3389/fsufs.2024.1334421
Azrai, M., Aqil, M., Efendi, R., Andayani, N., Makkulawu, A., Iriany, R., et al. (2023). A comparative study on single and multiple trait selections of equatorial grown maize hybrids. Front. Sustain. Food Syst. 7, 6–12. doi: 10.3389/fsufs.2023.1185102
Bandyopadhyay, N., Bhuiyan, C., and Saha, A. K. (2020). Drought mitigation: critical analysis and proposal for a new drought policy with special reference to Gujarat. Prog. Disaster Sci. 5, 1–18. doi: 10.1016/j.pdisas.2019.100049
Bänziger, M., Edmeades, G. O., Beck, D., and Bellon, M. (2000). Breeding for drought and nitrogen stress tolerance in maize: From theory to practice. Mexico, D.F: CIMMYT, 68.
Bolanos, J., and Edmeades, G. O. (1996). The importance of the anthesis-silking interval in breeding for drought tolerance in tropical maize. Field Crop Res 48, 65–80.
Bruce, W. B., Edmeades, G. O., and Barker, T. (2002). Molecular and physiological approaches to maize improvement for drought tolerance. J. Exp. Bot. 53, 13–25. doi: 10.1093/jexbot/53.366.13
Chauhan, J., Srivastava, J. P., Singhal, R. K., Soufan, W., Dadarwal, B. K., Mishra, U. N., et al. (2022). Alterations of oxidative stress indicators, antioxidant enzymes, soluble sugars, and amino acids in mustard [Brassica juncea (L.) Czern and Coss.] in response to varying sowing time, and field temperature. Front. Plant Sci. 13:875009. doi: 10.3389/fpls.2022.875009
Chukwudi, U. P., Kutu, F. R., and Mavengahama, S. (2021). Heat stress effect on the grain yield of three drought-tolerant maize varieties under varying growth conditions. Plants 10, 1–15. doi: 10.3390/plants10081532
Daryanto, S., Wang, L., and Jacinthe, P. A. (2017). Global synthesis of drought effects on maize and wheat production. Agric. Water Manag. 179, 18–33. doi: 10.1371/journal.pone.0156362
Deribe, H. (2024). Review on effects of drought stress on maize growth, yield and its management strategies. Commun. Soil Sci. Plant Anal. 56, 123–143. doi: 10.1080/00103624.2024.2404663
FAO. (2024). FAOSTAT Statistical Database. Food and Agriculture Organization of the United Nations. Available online at: https://www.fao.org/faostat/en/#data/QCL (Accessed November 20, 2024)
Fernandez, G. C. J. (1992) Effective selection criteria for assessing plant stress tolerance. Proceedings of the International Symposium on Adaptation of Vegetables and Other Food Crops in Temperature and Water Stress, Taiwan, pp. 257–270
Gbegbelegbe, S., Chikoye, D., Alene, A., Kyei-Boahen, S., and Chigeza, G. (2024). Strategic foresight analysis of droughts in southern Africa and implications for food security. Front. Sustain. Food Syst. 7:1159901. doi: 10.3389/fsufs.2023.1159901
Gelaw, T. A., Goswami, K., and Sanan-Mishra, N. (2023). Individual and interactive effects of nitrogen and phosphorus on drought stress response and recovery in maize seedlings. Agriculture 13:654. doi: 10.3390/agriculture13030654
Gelaw, T. A., and Mishra, N. S. (2024). Molecular priming with H₂O₂ and proline triggers antioxidant enzyme signals in maize seedlings during drought stress. Biochim. Biophys. Acta Gen. Subj. 1868:130633. doi: 10.1016/j.bbagen.2024.130633
Gupta, N. K., Gupta, S., Singh, J., Garg, N. K., Saha, D., and Singhal, R. K. (2022). On-farm hydro and nutri-priming increases yield of rainfed pearl millet through physio-biochemical adjustments and anti-oxidative defense mechanism. PLoS One 17:e0265325. doi: 10.1371/journal.pone.0265325
Kassambara, A., and Mundt, F. (2020) Factoextra: Extract and Visualize the Results of Multivariate Data Analyses (Version 1.0.7) [R package]. Available online at: https://CRAN.R-project.org/package=factoextra (Accessed August 18, 2024)
Kira, O., Nguy-Robertson, A. L., Arkebauer, T. J., Linker, R., and Gitelson, A. A. (2016). Informative spectral bands for remote green LAI estimation in C3 and C4. Crops. Agric. Meteorol. 218–219, 243–249. doi: 10.1016/j.agrformet.2015.12.064
Lê, S., Josse, J., and Husson, F. (2008). Factominer: an R package for multivariate analysis. J. Stat. Softw. 25, 1–18. doi: 10.18637/jss.v025.i01
Leverne, L., and Krieger‐Liszkay, A. (2021). Moderate drought stress stabilizes the primary quinone acceptor QA and the secondary quinone acceptor QB in photosystem II. Physiol. Plant. 171, 260–267. doi: 10.1111/ppl.13286
Magorokosho, C., and Tongoona, P. (2003) Selection for drought tolerance in two tropical maize populations. Afr. Crop. Sci. J., 11, 151–161. Available online at: https://www.ajol.info/index.php/acsj/article/view/27566
Olivoto, T., Lucio, A., Silva, J., Sari, B., and Diel, M. I. (2019). Mean performance and stability in multi-environment trials ii: selection based on multiple traits. Agron. J. 111, 2961–2969. doi: 10.2134/agronj2019.03.0221
Olivoto, T., and Nardino, M. (2021). MGIDI: toward an effective multivariate selection in biological experiments. Bioinformatics 37, 1383–1389. doi: 10.1093/bioinformatics/btaa981
Powadi, A., Jubery, T. Z., Tross, M. C., Schnable, J. C., and Ganapathysubramanian, B. (2024). Disentangling genotype and environment specific latent features for improved trait prediction using a compositional autoencoder. Front. Plant Sci. 15, 8–11. doi: 10.3389/fpls.2024.1476070
Radford, P. J. (1967). Growth analysis formula-their use and abuse 1. Crop Sci. 7, 171–175. doi: 10.2135/cropsci1967.0011183X000700030001x
Rivero, R. M., Kojima, M., Gepstein, A., Sakakibara, H., Mittler, R., Gepstein, S., et al. (2007). Delayed leaf senescence induces extreme drought tolerance in a flowering plant. Proc. Natl. Acad. Sci. USA 104, 19631–19636. doi: 10.1073/pnas.0709453104
Rossi, S., Chapman, C., and Huang, B. (2020). Suppression of heat-induced leaf senescence by γ-aminobutyric acid, proline, and ammonium nitrate through regulation of chlorophyll degradation in creeping bentgrass. Environ. Exp. Bot. 177:104116. doi: 10.1016/j.envexpbot.2020.104116
Saad-Allah, K. M., Nessem, A. A., Ebrahim, M. K. H., and Gad, D. (2022). Evaluation of drought tolerance of five maize genotypes by virtue of physiological and molecular responses. Agronomy 12:59. doi: 10.3390/agronomy12010059
Singamsetti, A., Zaidi, P. H., Seetharam, K., Vinayan, M. T., Olivoto, T., Mahato, A., et al. (2023). Genetic gains in tropical maize hybrids across moisture regimes with multi-trait-based index selection. Front. Plant Sci. 14:1147424. doi: 10.3389/fpls.2023.1147424
Smakhtin, V., and Schipper, E. L. (2008). Droughts: the impact of semantics and perceptions. Water Policy 10, 131–143. doi: 10.2166/wp.2008.036
Song, H., Li, Y., Zhou, L., Xu, Z., and Zhou, G. (2018). Maize leaf functional responses to drought episode and rewatering. Agric. For. Meteorol. 249, 57–70. doi: 10.1016/j.agrformet.2017.11.023
Su, Z., Zhao, J., Marek, T. H., Liu, K., Harrison, M. T., and Xue, Q. (2022). Drought tolerant maize hybrids have higher yields and lower water use under drought conditions at a regional scale. Agric. Water Manag. 274:107978. doi: 10.1016/j.agwat.2022.107978
Yang, C., Zhang, L., Jia, A., and Rong, T. (2016). Identification of QTL for maize grain yield and kernel-related traits. J. Genet. 95, 239–247. doi: 10.1007/s12041-016-0628-z
Yue, H., Olivoto, T., Bu, J., Li, J., Wei, J., Xie, J., et al. (2022). Multi-trait selection for mean performance and stability of maize hybrids in mega-environments delineated using envirotyping techniques. Front. Plant Sci. 13:Article 1030521. doi: 10.3389/fpls.2022.1030521
Keywords: maize, drought tolerance, yield indices, multi-trait, MGIDI
Citation: Azrai M, Aqil M, Efendi R, Andayani NN, Suwardi, Zainuddin B, Pabendon MB, Sitaresmi T, Anshori MF, Riadi M, Yasin M, Laurenze R, Bahtiar, Suwarti and Syam A (2025) Integrating multi-trait and multi-index approaches for identifying drought tolerant tropical maize genotypes. Front. Sustain. Food Syst. 9:1608307. doi: 10.3389/fsufs.2025.1608307
Edited by:
Shaowu Hu, Yangzhou University, ChinaReviewed by:
Ashok Singamsetti, Banaras Hindu University, IndiaTemesgen Assefa Gelaw, Debre Birhan University, Ethiopia
Cousin Musvosvi, Chinhoyi University of Technology, Zimbabwe
Copyright © 2025 Azrai, Aqil, Efendi, Andayani, Suwardi, Zainuddin, Pabendon, Sitaresmi, Anshori, Riadi, Yasin, Laurenze, Bahtiar, Suwarti and Syam. This is an open-access article distributed under the terms of the Creative Commons Attribution License (CC BY). The use, distribution or reproduction in other forums is permitted, provided the original author(s) and the copyright owner(s) are credited and that the original publication in this journal is cited, in accordance with accepted academic practice. No use, distribution or reproduction is permitted which does not comply with these terms.
*Correspondence: Muhammad Azrai, YXpyYWlAYWdyaS51bmhhcy5hYy5pZA==