 Yang Yang
 Junmin Chen2
- 1School of Economics and Management, Shihezi University, Shihezi, China
- 2School of Economics and Management, Henan Institute of Science and Technology, Xinxiang, China
- 3School of Economics and Management, Jiangxi Agricultural University, Nanchang, Jiangxi, China
- 4School of Business Administration, Henan University of Animal Husbandry and Economy, Zhengzhou, China
Introduction: This study aligns with the United Nations Sustainable Development Goals (SDGs), examining the critical trade-offs between agricultural water use and agricultural economic growth in Henan Province, China’s major grain-producing region (SDG 2: Zero Hunger; SDG 6: Clean Water and Sanitation).
Methods: Based on 19 years of municipal-level panel data from Henan Province, this study employs methods such as the coupling coordination degree model and Moran’s I index to assess agricultural economic development and agricultural water resources utilization, and to explore their directions for synergistic development.
Results: The results indicate that, although the overall trends in agricultural economic development and agricultural water resource utilization have improved, the momentum for further agricultural economic growth is weak, and the subsystems of agricultural water resources show contradictory changes. Consequently, despite some improvements, the coupling coordination level between the two remains relatively low and unstable. Spatially, the improvement in coordination levels shows a south > central > north trend, leading to a shift in the coordination pattern from southeast > northwest to south > central > north. Regions with low coordination levels are concentrated in the north, while those with high coordination levels are mainly in the south.
Discussion: To facilitate the smooth implementation of the United Nations Development Goals in China, it is imperative to establish measures such as a spatiotemporal-based agricultural water resources-economy coordinated governance system.
1 Introduction
Agricultural economic development holds significant importance for regional development and people’s livelihood (Xu, 2024). There exists an interactive relationship between agricultural economy and water resources. Agricultural economic development can pose threats to water resources security by increasing demand and pollution (Shi et al., 2020). However, it also provides financial and technological capacity to enhance water management. These improvements can balance water use and agricultural needs, promoting long-term sustainability (Wu, 2010; Echarte et al., 2023; Wang et al., 2014). Therefore, conducting research on the relationship between the agricultural economy and agricultural water resources carries substantial relevance for the sustainable development, particularly in agricultural systems.
Research on the relationship between water resources and agriculture has become a prominent field of study, particularly in the context of global climate change and increasing resource constraints. Contemporary literature typically addresses three key dimensions.
First, water resources play a critical supporting role in agricultural economic development. Water scarcity significantly constrains agricultural growth, while policy measures such as improved water resource management can enhance agricultural productivity and water use efficiency. Alrwis et al. (2020) found that the availability of water resources is a key determinant of agricultural economic development; its shortage not only limits crop planting area and yield but also has a significant negative impact on total agricultural output. Khamidov and Ashurbek (2021) noted that in the arid regions of Central Asia, the promotion of water-saving irrigation technologies can effectively improve the economic returns of agricultural water use. Studies by Peng et al. (2020) and Zhou et al. (2022) show that optimizing water resource allocation can significantly enhance the productive efficiency of agricultural water use and promote rural economic development. Hussein et al. (2024) further emphasized that improved water management practices can substantially increase crop yields. In addition, Dai et al. (2017) argued that establishing effective compensation mechanisms is crucial for mitigating water-use conflicts and achieving sustainable agricultural development.
Second, studies have examined the impact of agricultural growth on hydrological conditions. While agricultural expansion may intensify regional water stress in the short term, long-term technological spillover effects may help alleviate this pressure. Huang et al. (2021) and Xu et al. (2022) found that pollution emissions generated during agricultural production exert significant pressure on the water environment, affecting the effective utilization of water resources. Cao et al. (2012) pointed out that with the acceleration of industrialization and urbanization, the increasing demand for agricultural water is compounded by pollution from industrial and urban water use, further reducing the availability of water for agriculture. Huai et al. (2024), using the Beijing—Tianjin—Hebei region as a case study, explored the relationship between irrigation water demand and water scarcity, proposing specific strategies such as adjusting crop structures and improving irrigation efficiency to mitigate water stress. Shah et al. (2024) found that the adoption of modern agricultural technologies enables farmers to implement water-saving practices more effectively, thereby significantly improving agricultural water use efficiency. Han et al. (2023) further demonstrated that promoting water-saving irrigation technologies not only enhances crop yields and agricultural performance but also generates positive spatial spillover effects.
Third, studies have explored the interdependence between hydrological systems and socio-economic systems, as well as their dynamic coupling mechanisms. Researchers have quantitatively assessed the development trends of water resource systems and socio-economic systems by constructing comprehensive evaluation frameworks. Zhang et al. (2022) developed a coupling coordination evaluation system for water resource utilization efficiency and economic development levels, finding that while the overall development capacity across various regions in China has improved, the overall coordination level remains low. Zheng et al. (2018) demonstrated in their study of the Ganjiang River Basin that the region has transitioned from socio-economic lag to water environmental lag, predicting that future water environmental pressures will continue to increase. Yang et al. (2021) forecasted in their research in Shanxi Province, China, that agricultural water resource utilization will significantly lag behind socio-economic development. Jiang et al. (2023) and Li et al. (2019) investigated the coordinated development of water resources, food, and energy. The former emphasized the pivotal role of water resources as a core support, while the latter highlighted the importance of sustainable development within agricultural systems. Liu et al. (2023), using the Beijing–Tianjin–Hebei region as a case study, constructed a coupling coordination model for food security and agricultural water use security, revealing that although the composite index has risen, the coupling coordination degree remains at a low level.
Previous studies have highlighted the strong interdependence between agricultural water resources and agricultural economic development, with water resource utilization playing a crucial role in their coordinated development. However, much of the existing research has focused on single aspects of water resources, particularly their natural endowments or use efficiency. Although some recent studies have begun to incorporate sustainability principles into comprehensive assessment frameworks, the explicit linkages between these frameworks and the agricultural economic system remain underexplored. This study aims to fill this gap by constructing an integrated evaluation index for both agricultural economic development and agricultural water resource utilization, thereby providing a basis for analyzing their synergistic relationship.
Situated along the southern sector of the North China Plain, Henan Province features a transitional monsoon climate that spans warm-temperate to northern subtropical zones. The region exhibits clearly demarcated seasonal variations with synchronized rainfall and heat, creating favorable conditions for crop cultivation. Consequently, Henan has emerged as one of the nation’s most productive agricultural regions (Chen et al., 2020). Water serves as both the fundamental resource for agricultural activities and a key determinant of stable expansion and long-term sustainability in agrarian economies (Zhang et al., 2020). However, issues such as water scarcity, supply pressures, and irrational use currently pose significant challenges to agricultural progress in Henan Province (Jiao et al., 2020; Liu et al., 2022; Liu and Cui, 2020). Given this context, investigating the developmental trends between agricultural water resources and the agricultural economy in Henan Province, and promoting their coordinated development, is of significant practical importance. This study selects 17 prefecture-level cities in Henan Province as research units and constructs a comprehensive evaluation index system for the coordinated development of agricultural water resources and the agricultural economy. By applying the coupling coordination degree model, the relative development degree model, and Moran’s I index, this study evaluates the state of water-agriculture coordination over the past 19 years and explores its spatiotemporal evolution characteristics. The research findings will provide empirical evidence to support China’s implementation of the United Nations Sustainable Development Goals (SDGs), particularly SDG 2 (Zero Hunger) and SDG 6 (Clean Water and Sanitation), through analyzing the agricultural water-economy nexus in Henan Province.
2 Materials and methods
2.1 Study area
Henan Province encompasses the central and downstream sections of the Yellow River basin, receiving substantial runoff from the upper reaches. The region comprises 17 municipal divisions covering 167,000 km2 (Liu et al., 2022). According to the data from the China Statistical Yearbook, despite possessing merely 6.36% of China’s farmland, Henan generated 9.53% of total grain harvests in 2023, with wheat outputs representing 25.99% of national totals, making significant contributions to national food security. The region receives 500–1,000 mm annual precipitation, with over 60% occurring in summer—a pattern reflecting strong monsoon dominance (Chen et al., 2020). Water availability in Henan falls beneath global water scarcity benchmarks at <500 m3/person/year, with pronounced north–south disparities in distribution. These conditions qualify the province as a high-stress hydrological region (Jiao et al., 2020). According to the Henan Provincial Water Resources Bulletin, the average depth to shallow groundwater across Henan’s plains was 7.23 meters in 2022, with groundwater reserves declining by 4.231 billion cubic meters. Although 2023 monitoring data show a temporary recovery to 6.17 m and a 3.770 billion m3 reserve increase due to 34.7% above-average precipitation, the long-term trend (1980–2023) reveals a net depletion of 4.815 billion m3 in shallow groundwater reserves, indicating persistent structural water deficits unaffected by annual precipitation variability. The administrative divisions of investigated territory are shown in Figure 1.
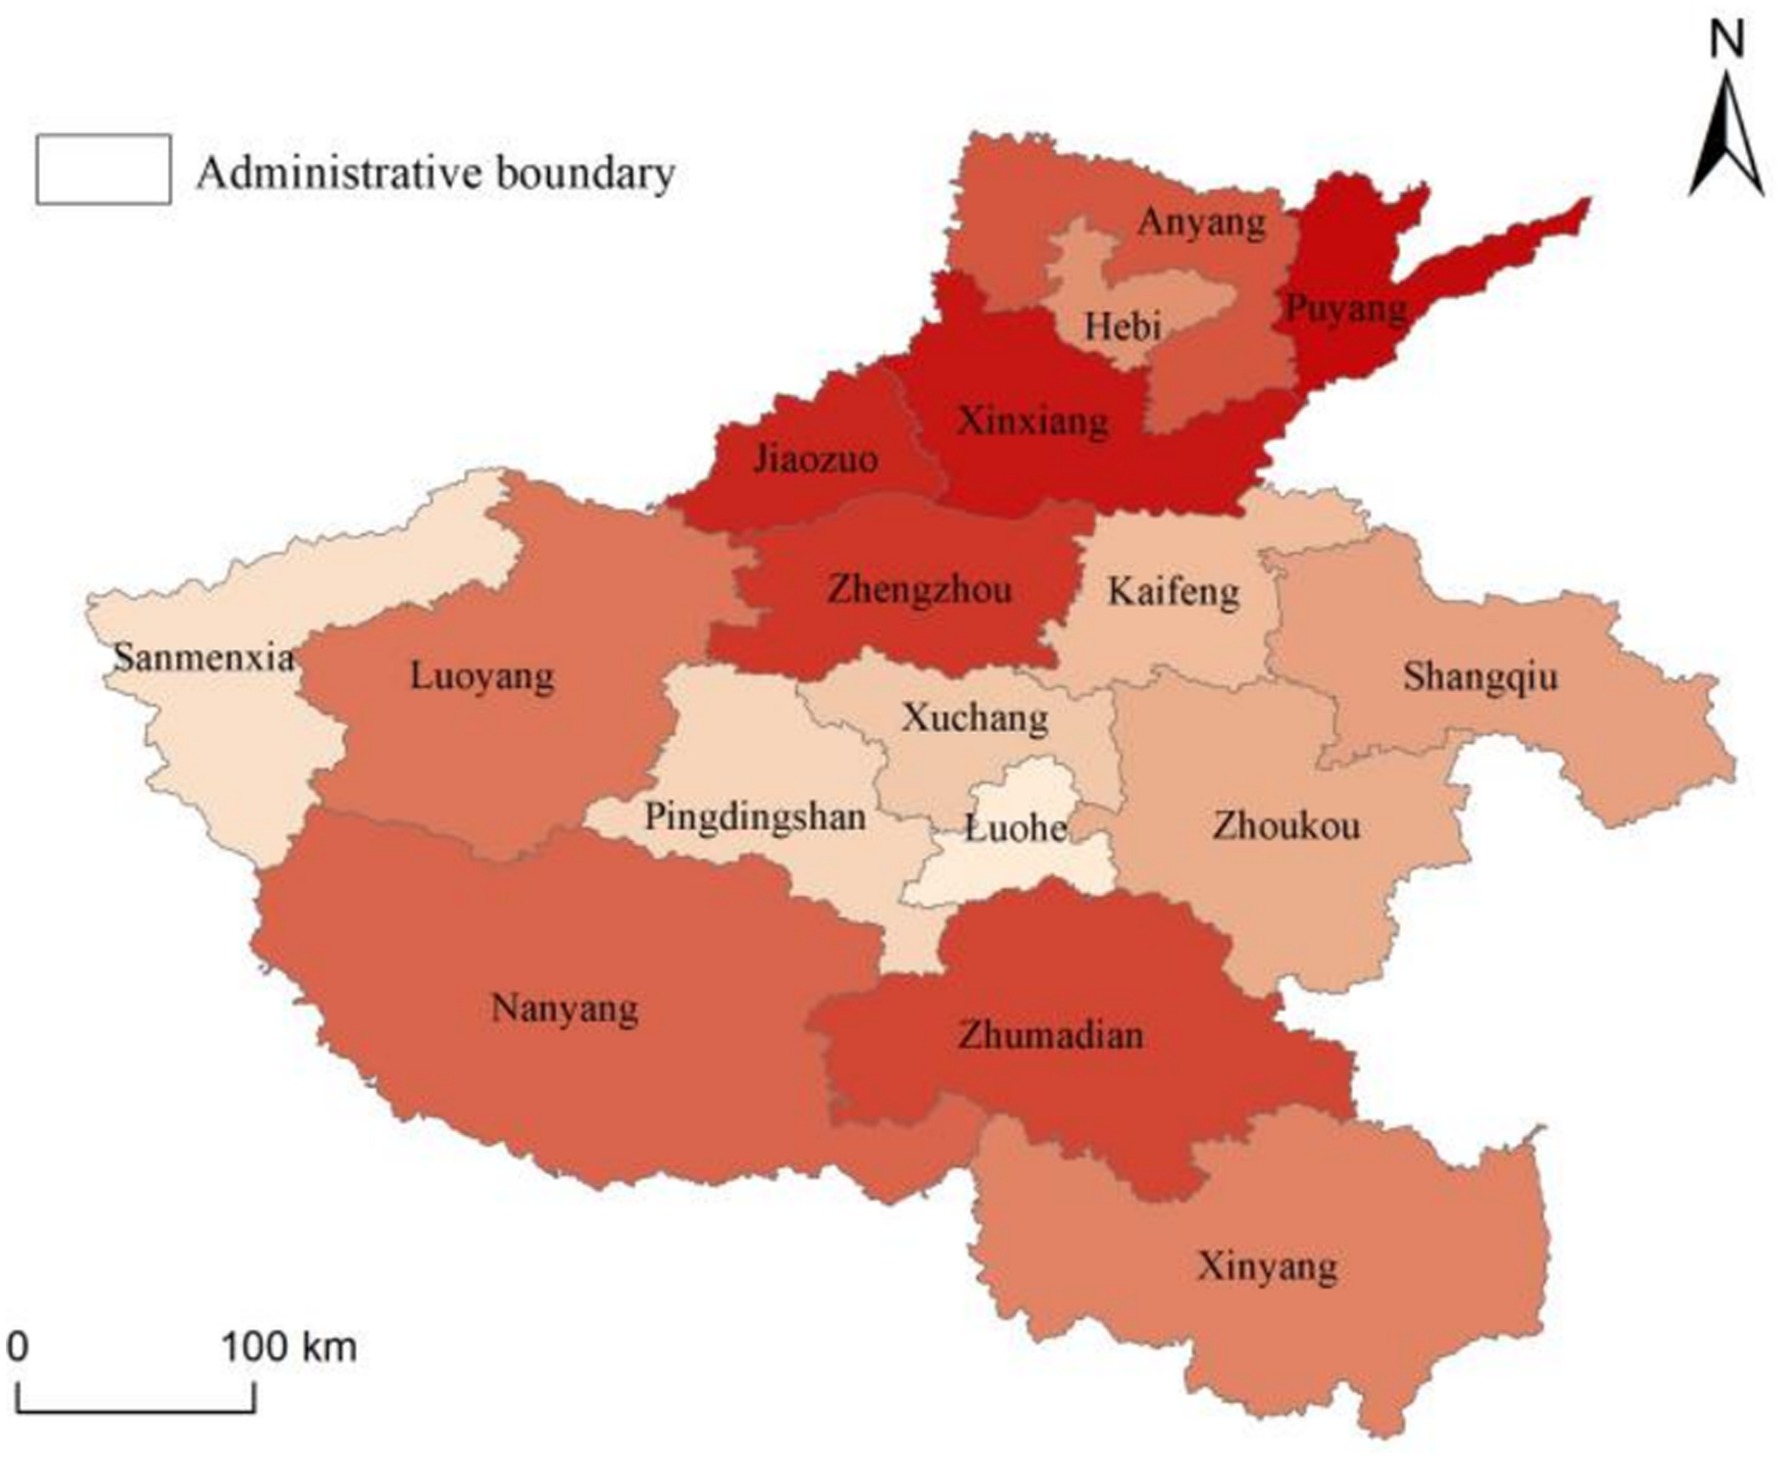
Figure 1. Administrative divisions of investigated territory.
2.2 Selection of indicators
2.2.1 Indicators of agricultural water resources utilization level
Agricultural water resources refer to surface water, groundwater, and soil water used for agricultural production. These can primarily be categorized into two parts: irrigation water and water for forestry, animal husbandry, and fisheries. Referring to relevant studies (Chen and Xu, 2021; Shin et al., 2024; Momm et al., 2022; Zhang et al., 2023; Qi et al., 2023; Ghosh et al., 2017; Benfetta and Ouadja, 2020; Zhao et al., 2023) and considering the current status of agricultural water resources development in Henan Province and the availability of data, this paper selects 13 indicators from four aspects—Water resource endowment, Water use efficiency, Water use technology level, and Water use sustainability—to measure the level of agricultural water resources utilization (see Table 1).
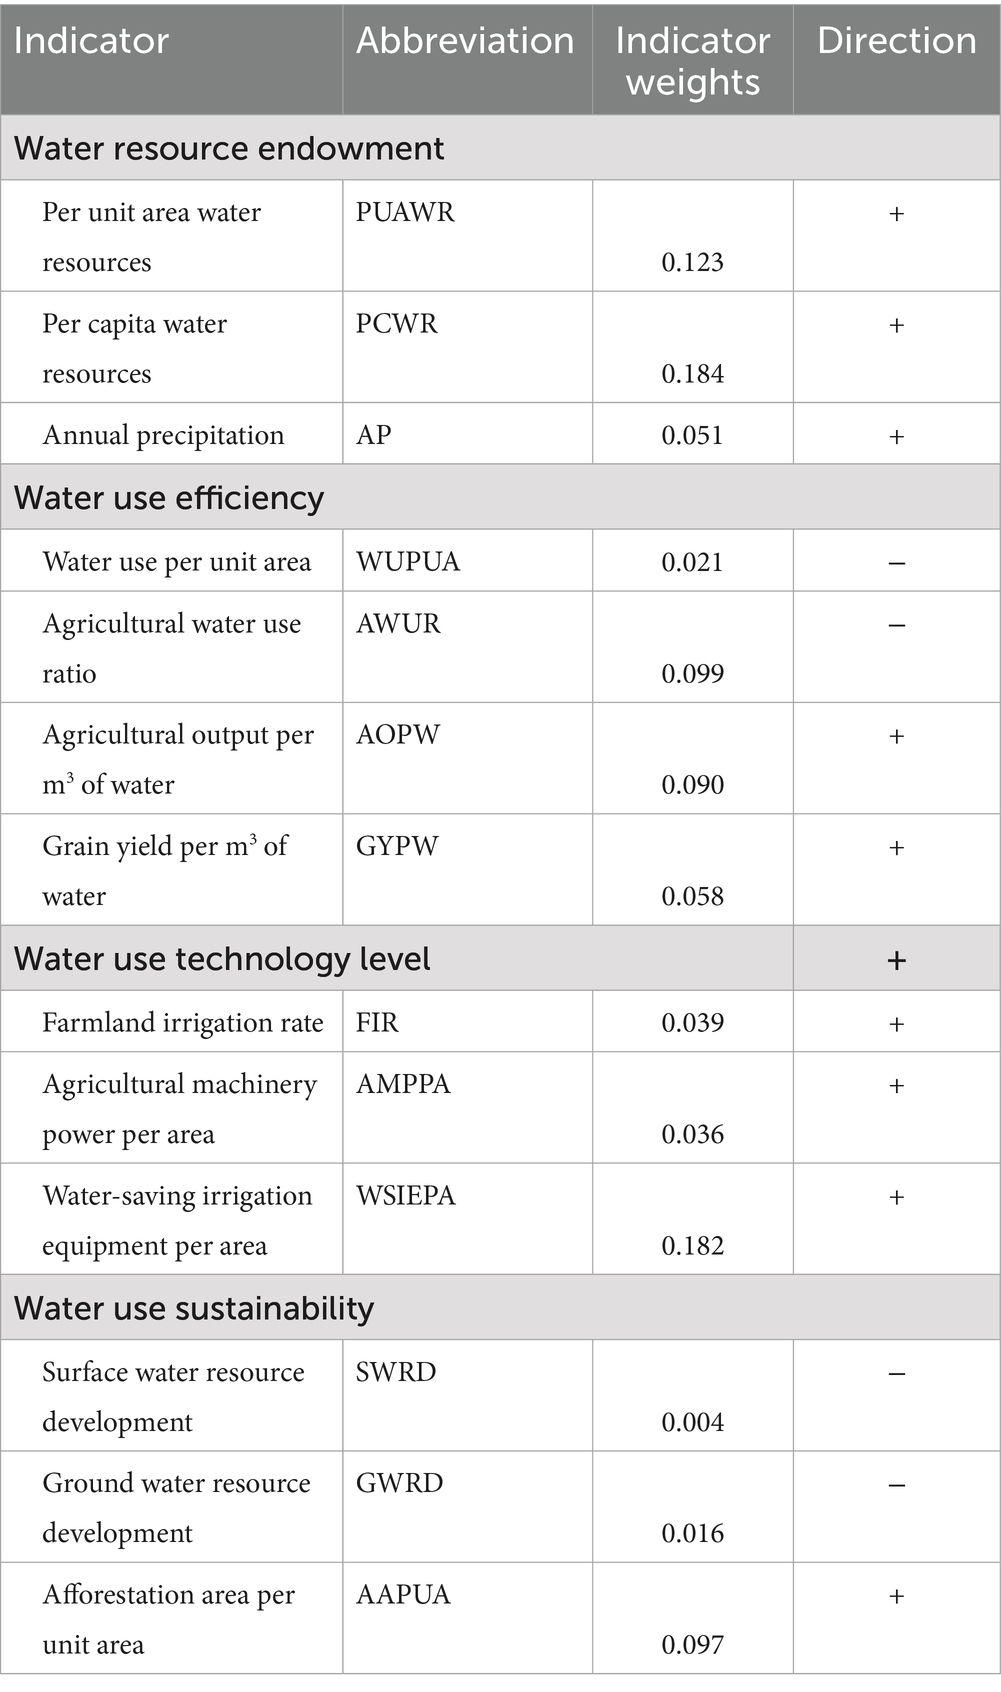
Table 1. Indicator system for assessing agricultural water resources utilization level.
2.2.1.1 Water resource endowment
Water resource endowment refers to the abundance of water resources in a given area. Generally, regions with a higher water resource endowment can conduct agricultural irrigation and production activities more fully. In other words, a rich water resource endowment provides favorable conditions for the efficient use of agricultural water resources. The Per unit area water resources (PUAWR) reflects the amount of water available per person, indicating the water supply capacity under population pressure. The Per capita water resources (PCWR) reflects the water supply capacity per unit area and is closely related to the spatial distribution of agricultural activities. Annual precipitation (AP), as the main source of natural rainfall, directly affects the stability of agricultural water demand structure.
1. PUAWR: This metric derives from the total water resources divided by the total cultivated land area, with the unit being cubic meters per hectare. Higher PUAWA values indicate enhanced Water resource endowment level.
2. PCWR: This metric derives from the total water resources divided by the total population, with the unit being cubic meters per person. Higher PCWR values indicate enhanced Water resource endowment level.
3. AP: This metric is measured by the actual rainfall in a given year, with the unit being millimeters. Higher Ap values indicate enhanced Water resource endowment level.
2.2.1.2 Water use efficiency
Water use efficiency denotes the measurement and assessment of current water resources utilization under given levels of input, technology application, and other relevant conditions. High water use efficiency reflects a more rational and full utilization of water resources under the same conditions. The Water use per unit area (WUPUA) and Agricultural water use ratio (AWUR) reflect the intensity of water consumption. The Agricultural output per m3 of water (AOPW) and Grain yield per m3 of water (GYPW) indicate the productivity and economic efficiency of water resources.
4. WUPUA: This metric derives from the total agricultural water use divided by the total cultivated land area, with the unit being cubic meters per hectare. Lower WUPUA values indicate enhanced Water use efficiency level.
5. AWUR: This metric derives from the agricultural water use divided by the total water use, with the unit being a percentage. Lower AWUR values indicate enhanced Water use efficiency level.
6. AOPW: This metric is calculated by dividing the added value of agriculture, forestry, animal husbandry, and fisheries by the agricultural water use, with the unit being yuan per cubic meter. Higher AOPW values indicate enhanced Water use efficiency level.
7. GYPW: This metric is calculated by dividing the grain production by the agricultural water use, with the unit being kilograms per cubic meter. Higher GYPW values indicate enhanced Water use efficiency level.
2.2.1.3 Water use technology level
Water use technical level denotes the level of equipment for agricultural irrigation and water conservancy facilities. It reflects the role of technological investment in supporting efficient water resource utilization, enhances the capacity to improve natural conditions for agricultural production, and helps reduce water wastage. The Farmland irrigation rate (FIR) reflects the coverage rate of irrigation facilities. The Agricultural machinery power per area (AMPPA) indicates the level of agricultural mechanization, showcasing the capacity for the application of water-saving technologies. The Water-saving irrigation equipment per area (WSIEPA) measures the prevalence of water-saving technologies.
8. FIR: This metric derives from the irrigated area divided by the total cultivated land area, with the unit being a percentage. Higher FIR values indicate enhanced Water use technology level.
9. AMPPA: This metric is calculated by dividing the total power of agricultural machinery by the total cultivated land area, with the unit being kilowatts per hectare. Higher AMPPA values indicate enhanced Water use technology level.
10. WSIEPA: This metric is calculated by dividing the total power of agricultural machinery by the total cultivated land area, with the unit being kilowatts per hectare. Higher WSIEPA values indicate enhanced Water use technology level.
2.2.1.4 Water use sustainability
Water use sustainability denotes the level and maintenance of water resource development and utilization. By considering the carrying capacity of resources, scientifically and rationally developing water resources and strengthening their regenerative protection can effectively enhance their sustainability. The Surface water resource development (SWRD) and Ground water resource development (GWRD) reflect the intensity of overall water resource exploitation. The Afforestation area per unit area (AAPUA) indicates efforts to enhance water conservation capacity through ecological restoration, thereby supporting agricultural water security.
11. SWRD: This metric is calculated by dividing the surface water supply by the total surface water resources, with the unit being a percentage. Lower SWRD values indicate enhanced Water use sustainability level.
12. GWRD: This metric is calculated by dividing the groundwater supply by the total groundwater resources, with the unit being a percentage. Lower GWRD values indicate enhanced Water use sustainability level.
13. AAPUA: This metric is calculated by dividing the afforested area in a given year by the total area of the region, with the unit being a percentage. Higher AAPUA values indicate enhanced Water use sustainability level.
2.2.2 Indicators of agricultural economic development level
Agricultural economy refers to the collective term for economic activities and relations in agriculture, including production, exchange, distribution, and other related aspects. According to the theory of industrial economics, economic development can be measured from five aspects: economic growth, industrial structure, factor input, output level, and sustainability. Based on this theory and with reference to relevant research (Deng et al., 2021; Zhang and Jin, 2024; Sun et al., 2022; Zhao and Tang, 2018; Li and Yi, 2024; Xu et al., 2020; Liu et al., 2023), this paper selects a total of 15 indicators from four aspects—Scale and structure, Factor input, Output level, and Sustainability—to assess the agricultural economic development level (see Table 2).
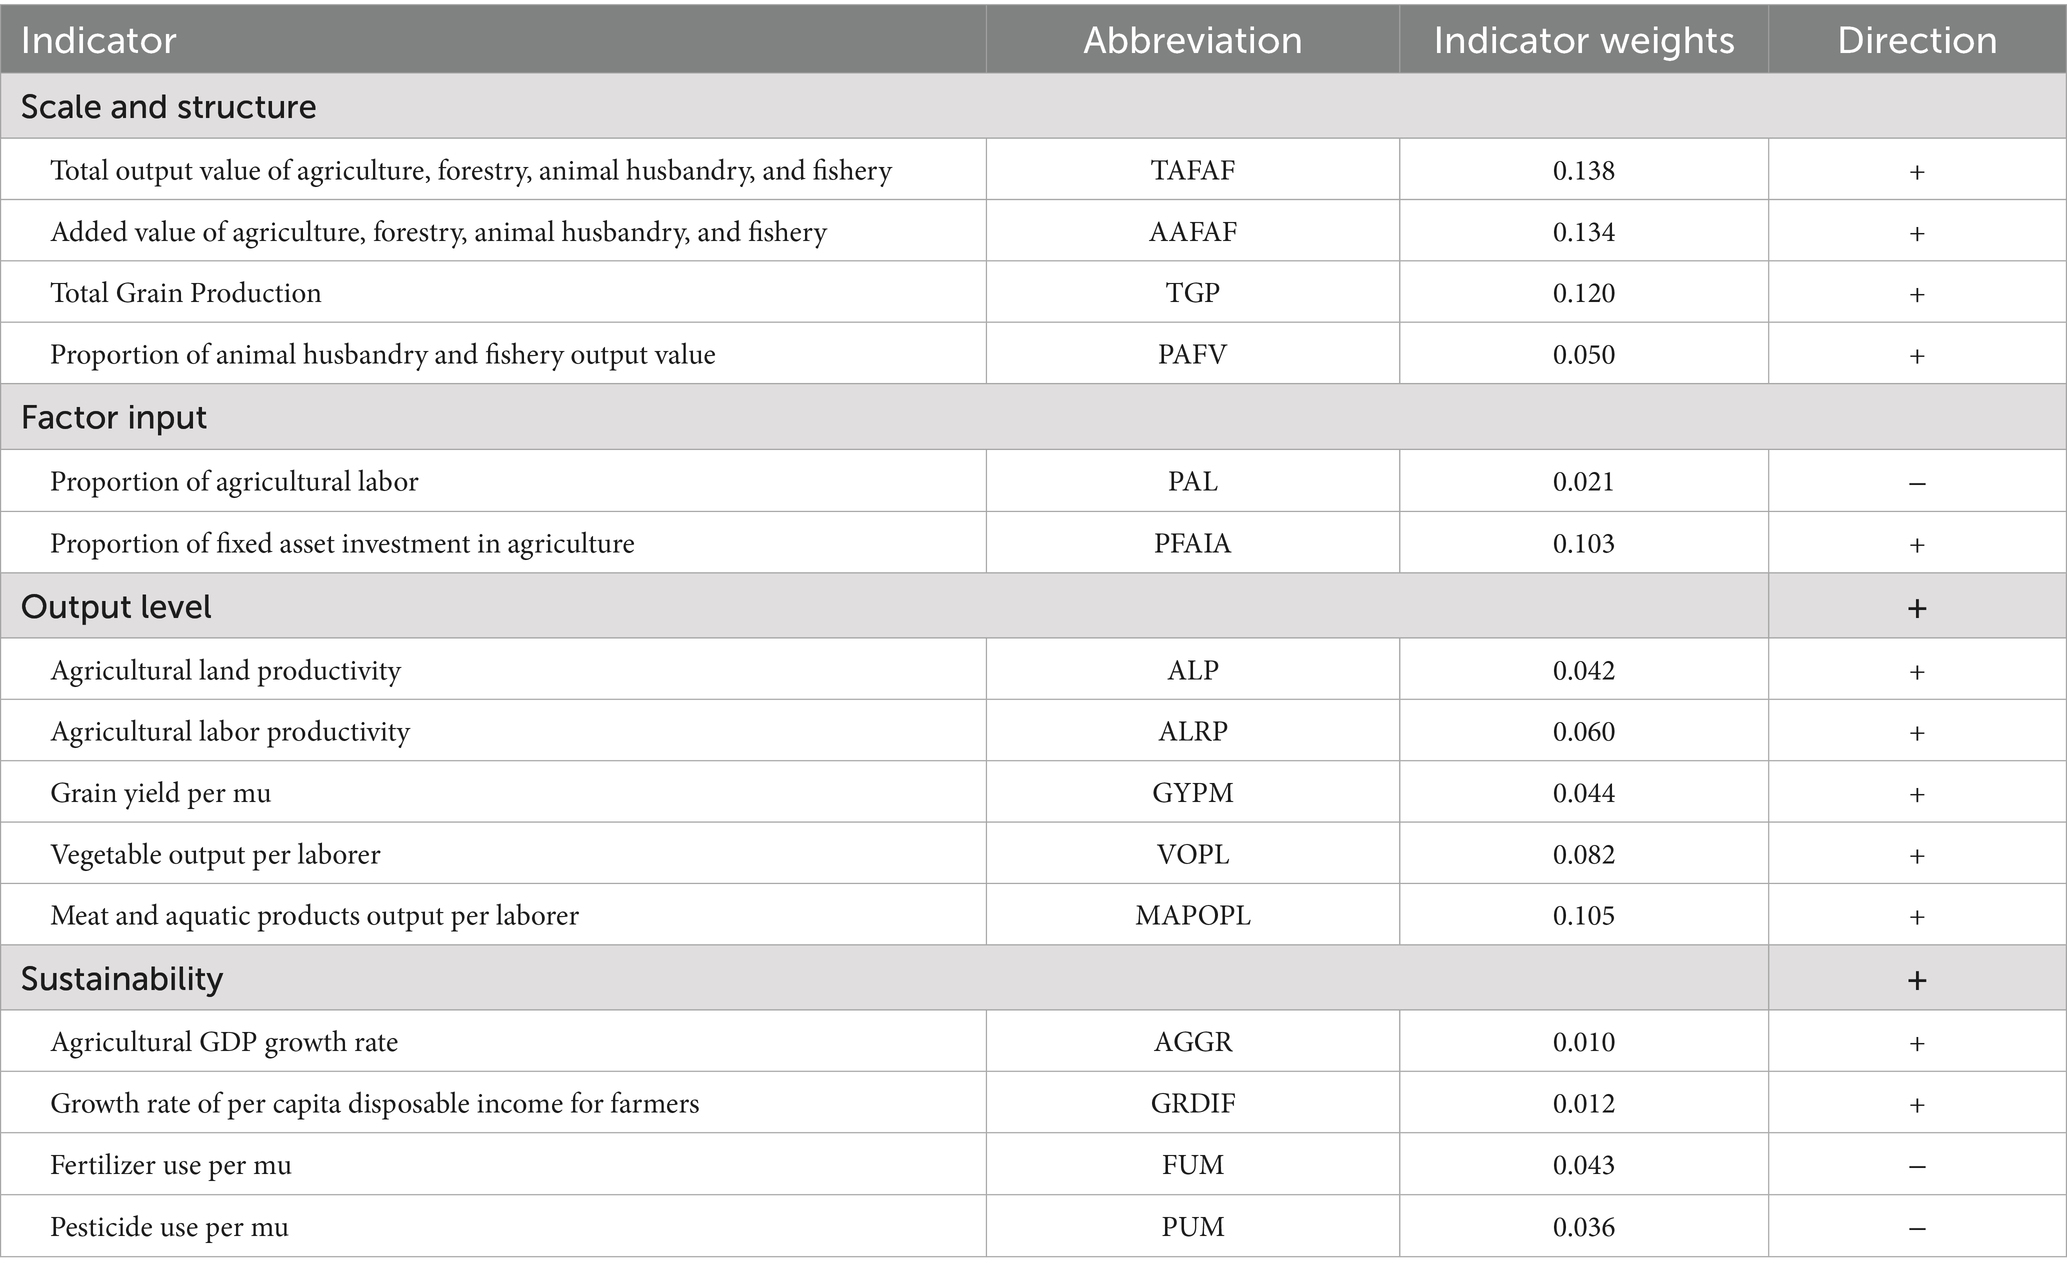
Table 2. Indicator system for assessing agricultural economic development level.
2.2.2.1 Scale and structure
Scale is a total quantity indicator reflecting the level of agricultural economic development. Generally speaking, the larger the scale, the higher the level of agricultural economic development. The Total output value of agriculture, forestry, animal husbandry, and fishery (TAFAF) and Added value of agriculture, forestry, animal husbandry, and fishery (AAFAF) are commonly used for measurement (Liu et al., 2023). Given the strategic importance of food security, this paper separately includes the Total grain production (TGP) in the scale measurement system. Structure refers to the composition and proportional relationship of the agricultural industry. Under the premise of stabilizing food production, the higher the Proportion of animal husbandry and fishery output value (PAFV), the higher the level of agricultural economic development (Zhao and Tang, 2018). Therefore, the proportion of animal husbandry and fishery output value is selected for measurement.
1. TAFAF: TAFAF refers to the actual output value for the current year, measured in billions of yuan.
2. AAFAF: AAFAF is calculated by subtracting intermediate consumption from the total output value, with the unit being billion yuan.
3. TGP: TGP refers to the actual production in a given year, with the unit being ten thousand tons.
4. PAFV: PAFV is calculated by dividing the output value of animal husbandry and fisheries by the total output value of agriculture, forestry, animal husbandry, and fisheries, with the unit being a percentage.
2.2.2.2 Factor input
Factor input refers to the capital, labor, and other production factors required to sustain agricultural production. A decrease in the Proportion of agricultural labor (PAL) and an increase in the average cultivated land per laborer facilitate the moderate-scale operation of land resources. An increase in the Proportion of fixed asset investment in agriculture (PFAIA) indicates the adoption of more advanced equipment.
5. PAL: PAL is calculated refers to the number of workers in the primary sector divided by the total number of workers, with the unit being a percentage.
6. PFAIA: PFAIA is calculated by dividing the fixed asset investment in the primary sector by the total fixed asset investment in society, with the unit being a percentage.
2.2.2.3 Output level
Output level represents the total quantity of various useful goods created or services provided during the production process. The Agricultural land productivity (ALP) and Agricultural labor productivity (ALRP) are key indicators reflecting the efficiency of land and labor use. Furthermore, the Grain yield per mu (GYPM), along with Vegetable output per laborer (VOPL) and Meat and aquatic products output per laborer (MAPOPL), serve as specific indicators to evaluate the production capacity of key agricultural commodities.
7. ALP: ALP is calculated as the added value of agriculture, forestry, animal husbandry, and fisheries divided by the total area of cultivated land, with the unit being yuan per mu. Higher ALP values indicate enhanced Output level.
8. ALRP: ALRP is calculated as the added value of agriculture, forestry, animal husbandry, and fisheries divided by the number of workers in the primary sector, with the unit being yuan per person. Higher ALRP values indicate enhanced Output level.
9. GYPM: GYPM is calculated as the total grain production divided by the total sown area of grain crops, with the unit being kilograms per mu. Higher GYPM values indicate enhanced Output level.
10. VOPL: VOPL is calculated as the total vegetable production divided by the number of workers in the primary sector, with the unit being kilograms per person. Higher VOPL values indicate enhanced Output level.
11. MAPOPL: MAPOPL is calculated as the total production of meat and aquatic products divided by the number of workers in the primary sector, with the unit being kilograms per person. Higher MAPOPL values indicate enhanced Output level.
2.2.2.4 Sustainability
Sustainability in agriculture refers to the formation of a new development pattern that not only supports farmers’ income growth but also enhances environmental sustainability. The Agricultural GDP growth rate (AGGR) and Growth rate of per capita disposable income for farmers (GRDIF) are used to measure agricultural economic vitality and improvements in rural livelihoods. The Fertilizer use per mu (FUM) and Pesticide use per mu (PUM) reflect the environmental pressures associated with agricultural production.
12. AGGR: AGGR is calculated as the difference between the current year’s total agricultural output value and the previous year’s total agricultural output value, divided by the previous year’s total agricultural output value, expressed as a percentage. Higher AGGR values indicate enhanced Sustainability level.
13. GRDIF: GRDIF is calculated as the difference between the current year’s farmers’ per capita disposable income and the previous year’s farmers’ per capita disposable income, divided by the previous year’s farmers’ per capita disposable income, expressed as a percentage. Higher GRDIF values indicate enhanced Sustainability level.
14. FUM: FUM derives from the total amount of fertilizer applied divided by the total area of cultivated land, with the unit being kilograms per mu. Lower FUM values indicate enhanced Sustainability level.
15. PUM: PUM derives from the total amount of pesticide applied divided by the total cultivated farmland area, with the unit being kilograms per mu. Lower PUM values indicate enhanced Sustainability level.
2.3 Data and methods
2.3.1 Data
2.3.1.1 Study period
The amount of precipitation has a significant impact on water resources utilization (Khamidov and Ashurbek, 2021). According to the Henan Provincial Water Resources Bulletin, Henan Province experienced similar total precipitation in 2001 and 2019, with 543.3 mm and 529.1 mm, respectively. Using these 2 years as the starting and ending years can, to some extent, mitigate the interference caused by significant interannual fluctuations in precipitation, thereby enhancing the robustness and scientific validity of the analysis.
2.3.1.2 Data sources
The water resource data adopted in this study originate from the Water Resources Bulletin of Henan Province published by the Henan Provincial Hydrology and Water Resources Forecast Center. Other data are sourced from the Henan Statistical Yearbook and statistical bulletins released by the Henan Provincial Bureau of Statistics, as well as the statistical yearbooks and bulletins of various prefecture-level cities within the province.
2.3.1.3 Data preprocessing
For single-point missing values in time series data, linear interpolation is used for imputation; for consecutive missing values, trend fitting is applied. All imputed results are cross-validated to ensure reliability. To further ensure data quality, variables with more than 10% missing values are excluded. Additionally, to guarantee comparability among various indicators, economic indicators related to output value were uniformly adjusted for price changes. All data were also subjected to non-dimensionalization processing.
2.3.2 Methods
This study first employs the entropy weight method to quantify the levels of agricultural water resource utilization and agricultural economic development. This approach avoids subjective bias in the weighting process, offering greater objectivity and stability compared to traditional methods such as principal component analysis and the analytic hierarchy process. Subsequently, the coupling coordination degree model is applied to comprehensively capture the interaction and coordinated evolution between the two systems. This is further combined with the relative development degree model to analyze the relative development speeds and the dynamic stability of the coordinated development level. Finally, spatial autocorrelation analysis is conducted to reveal the spatial distribution patterns and agglomeration characteristics of regional coordination levels. This approach compensates for the limitations of traditional non-spatial analytical methods in identifying spatial heterogeneity and spatial dependence, thereby providing a more comprehensive understanding of the spatial evolution mechanisms of regional coordinated development.
2.3.2.1 Data standardization
The data is first standardized to guarantee comparability between indicators and remove the influence of various measurement units and scales (Li et al., 2021). Equations 1,2 show the calculation method.
When the indicators are positive:
When the indicators are negative:
In the equations, Zλij stands for the standardized value; xλij stands for the original value before standardization; λ stands for the year; i stands for the evaluation object; j stands for the evaluation indicator.
2.3.2.2 Indicator weights
Indicator weights serve to measure the relative importance of each evaluation indicator toward the evaluation object. The greater the value, the more significant the indicator is in the assessment procedure (Chen and Zhang, 2023). Equations 3–5 show the calculation method.
In the equations, Pλij represents the relative proportion; Ej represents the entropy value; Wj represents the weight. The meanings of other symbols are the same as those used in data normalization.
2.3.2.3 Comprehensive development index
The following formula is employed to compute the comprehensive development index of agricultural economic development and water resource utilization. The higher the comprehensive development index, the higher the level of development (Chen and Zhang, 2023). Equation 6 shows the calculation method.
2.3.2.4 Coupling coordination degree
The coupling coordination degree model is used to reflect the interaction between agricultural economy and agricultural water resources in Henan (Li et al., 2021). Equations 7–9 show the calculation method.
In the equations, μ1 and μ2 represent the agricultural water resources utilization level and agricultural economic development level, respectively; the coupling degree is denoted by C; the coordination degree is denoted by T; and D represents the coupling coordination degree, with a value range of 0 to 1. The higher the value of D, the stronger the coupling coordination degree between agricultural water resources utilization and agricultural economic development. Based on the numerical value of the coupling coordination degree D, the coordination level is divided into ten grades from extreme imbalance to excellently coordinated (Yang et al., 2020). The specific classification criteria are shown in Table 3.
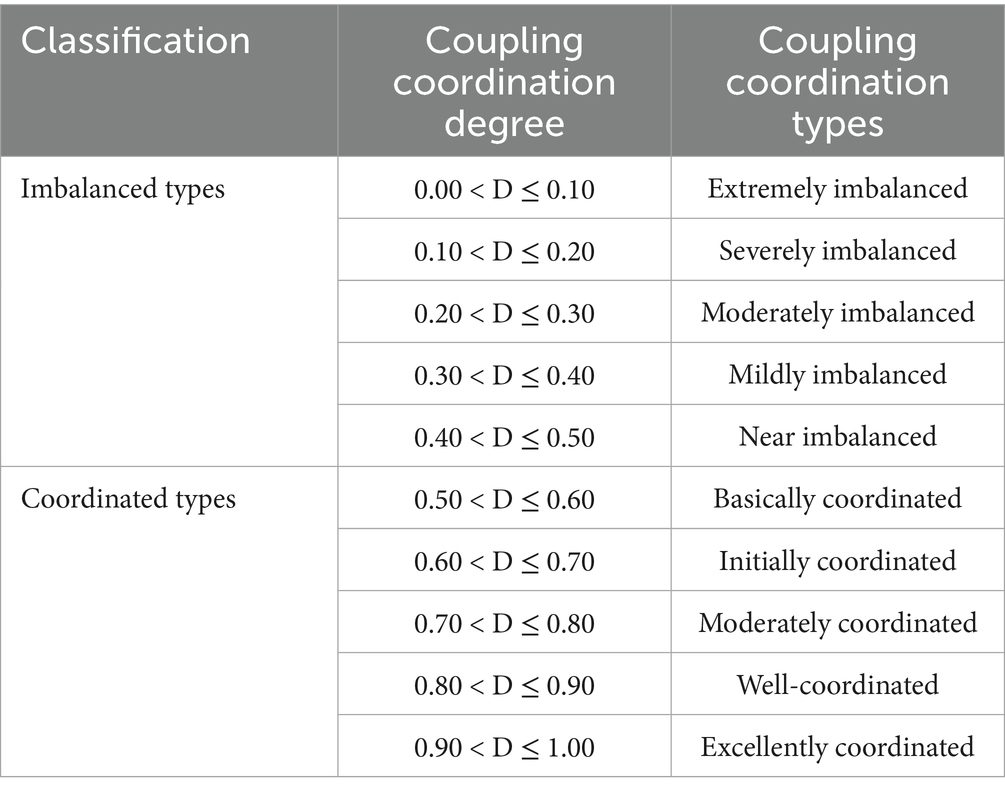
Table 3. Classification of coupling coordination degree.
2.3.2.5 Relative development degree
The relative development degree model is employed to evaluate the stability of the coupling and coordination development stage between agricultural water resources and the agricultural economy (Yang et al., 2020). Equation 10 shows the calculation method.
When U ≤ 0.8 or U > 1.2, it indicates a desynchronization between agricultural economic development and water resource utilization, suggesting system degradation. Conversely, if 0.8 < U ≤ 1.2, it signifies synchronization between these two aspects, indicating system optimization (Yang et al., 2020).
2.3.2.6 Moran’s I index
2.3.2.6.1 Global Moran’s I index
The global Moran’s I index, a measure of spatial autocorrelation, was applied to assess whether the coupling coordination degree between agricultural water resources and economic development in Henan Province exhibits spatial clustering (Perry et al., 2010). Equation 11 shows the calculation method.
The equations include: N (number of prefecture-level cities), xi and xj (observed values for cities i and j), (mean value across all cities), wij (spatial weight matrix element), W (sum of spatial weights), and I (global Moran’s I index value). A positive I indicates spatial clustering of similar values, a negative I suggests dispersion of dissimilar values, while I = 0 implies random spatial distribution (Perry et al., 2010).
2.3.2.6.2 Local Moran’s I
The local Moran’s I is employed to analyze spatial clustering patterns in the coupling coordination between agricultural water resources and economic development across Henan Province’s prefecture-level cities (Pang et al., 2020).
In the equations, Ii represents the local Moran’s I value; S2 denotes the sample variance; and other symbols hold the same meanings as in the global Moran’s I. High-High clusters signify aggregations of high values, while Low-Low clusters indicate aggregations of low values.
3 Results
3.1 Analysis of agricultural water resources utilization level and agricultural economic development level
3.1.1 Agricultural water resources utilization level
Among the evaluation indicators for the agricultural water resources utilization level, PCWR (0.184), WSIEPA (0.182), and PUAWR (0.123) have relatively high influence weights (Table 1). As shown in Figure 2, ① although it has shown an upward trend over the past 19 years, the level of agricultural water resources utilization in Henan Province remains relatively low, ranging from 0.155 to 0.249. Notably, there was a significant upward trend from 2001 to 2011; however, from 2011 to 2019, the improvement in Water use technology level subsystem related to agricultural water resources utilization was outpaced by the decline in Water use sustainability subsystem, leading to an overall decrease in utilization levels. ② From a development speed perspective, the agricultural water resources utilization levels in Luoyang, Puyang, Xinxiang, Sanmenxia, Zhengzhou, Pingdingshan, Luohe, Kaifeng, Xinyang, and Xuchang have increased more significantly than the overall level in Henan Province, indicating a relatively faster pace of development. ③ From a geographical distribution perspective, the utilization of agricultural water resources in Henan Province has been uneven. Specifically, the northern cities of Anyang, Puyang, Hebi, Xinxiang, and Jiaozuo have significantly lower levels of agricultural water resources utilization compared to cities in other regions, indicating a geographical distribution pattern with higher levels in the central and southern regions compared to the northern region.
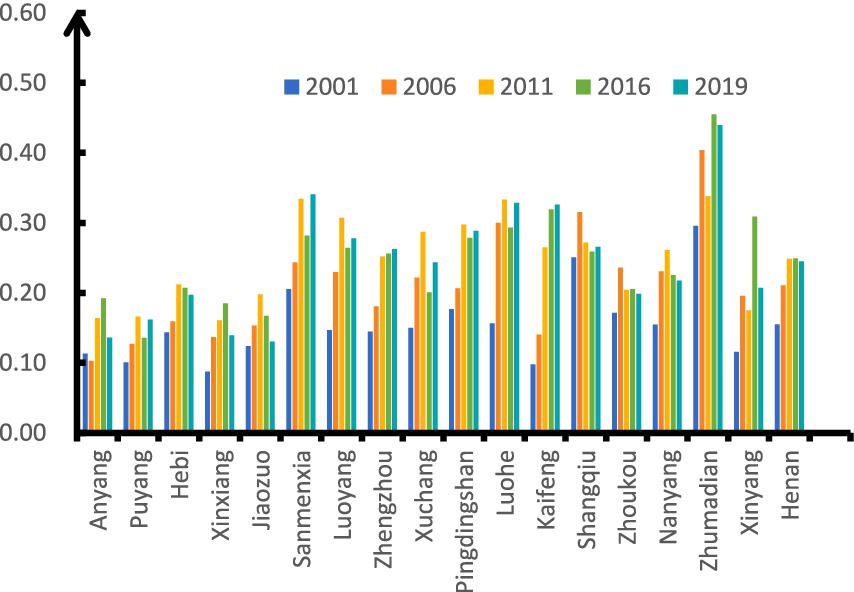
Figure 2. Agricultural water resources utilization level in Henan Province.
3.1.2 Agricultural economic development level
Among the evaluation indicators for the agricultural economic development level, TAFAF (0.137), AAFAF (0.134), TGP (0.120), MAPOPL (0.105), and PFAIA (0.103) have relatively high influence weights (Table 2). As shown in Figure 3, ① the agricultural economic development level has shown an annual increasing trend, with a 78.32% increase over the past 19 years. This is mostly due to the high level and rapid development of the Scale and structure subsystem, and Factor input subsystem, which have driven the agricultural economic development of Henan. ② In terms of development speed, Puyang, Hebi, Sanmenxia, Luoyang, Kaifeng, Zhoukou, Zhumadian, and Xinyang have experienced higher growth rates in agricultural economic development than the provincial average, indicating faster development. ③ From a geographical perspective, Nanyang, Zhumadian, Xinyang, Kaifeng, Shangqiu, and Zhoukou have similar agricultural economic development levels, which are relatively high. Zhengzhou, Xuchang, Pingdingshan, Luohe, Sanmenxia, and Luoyang also have similar agricultural economic development levels, but these are relatively low, demonstrating that the southeastern regions are more developed than the northwestern regions.
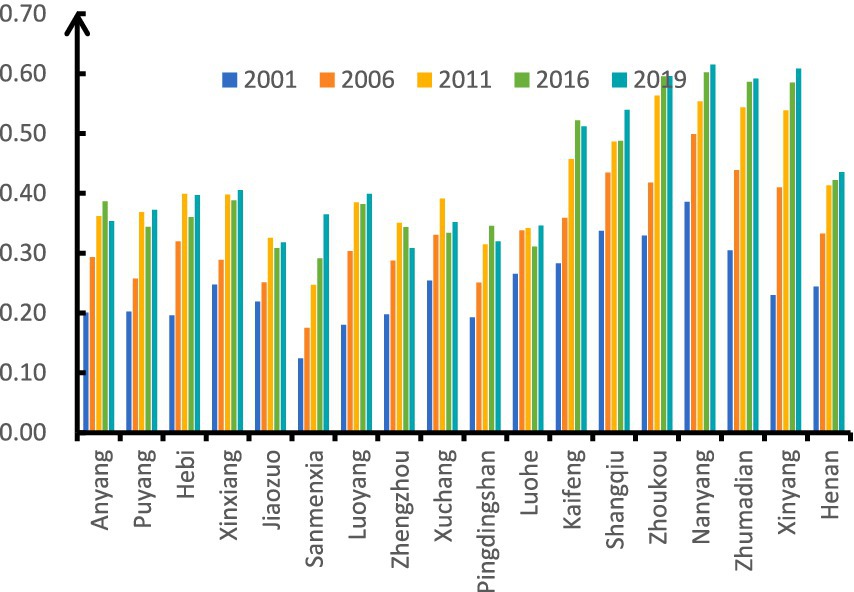
Figure 3. Agricultural economic development level in Henan Province.
3.2 Temporal changes in the coupling and coordination of agricultural economy and agricultural water resources
As shown in Figure 4, from 2001 to 2019, the coupling coordination degree index between agricultural water resources and the agricultural economy in Henan Province generally showed an upward trend, increasing from a minimum of 0.433 in 2001 to a maximum of 0.573 in 2015. After 2015, the rate of increase slowed, indicating a tendency toward stabilization.
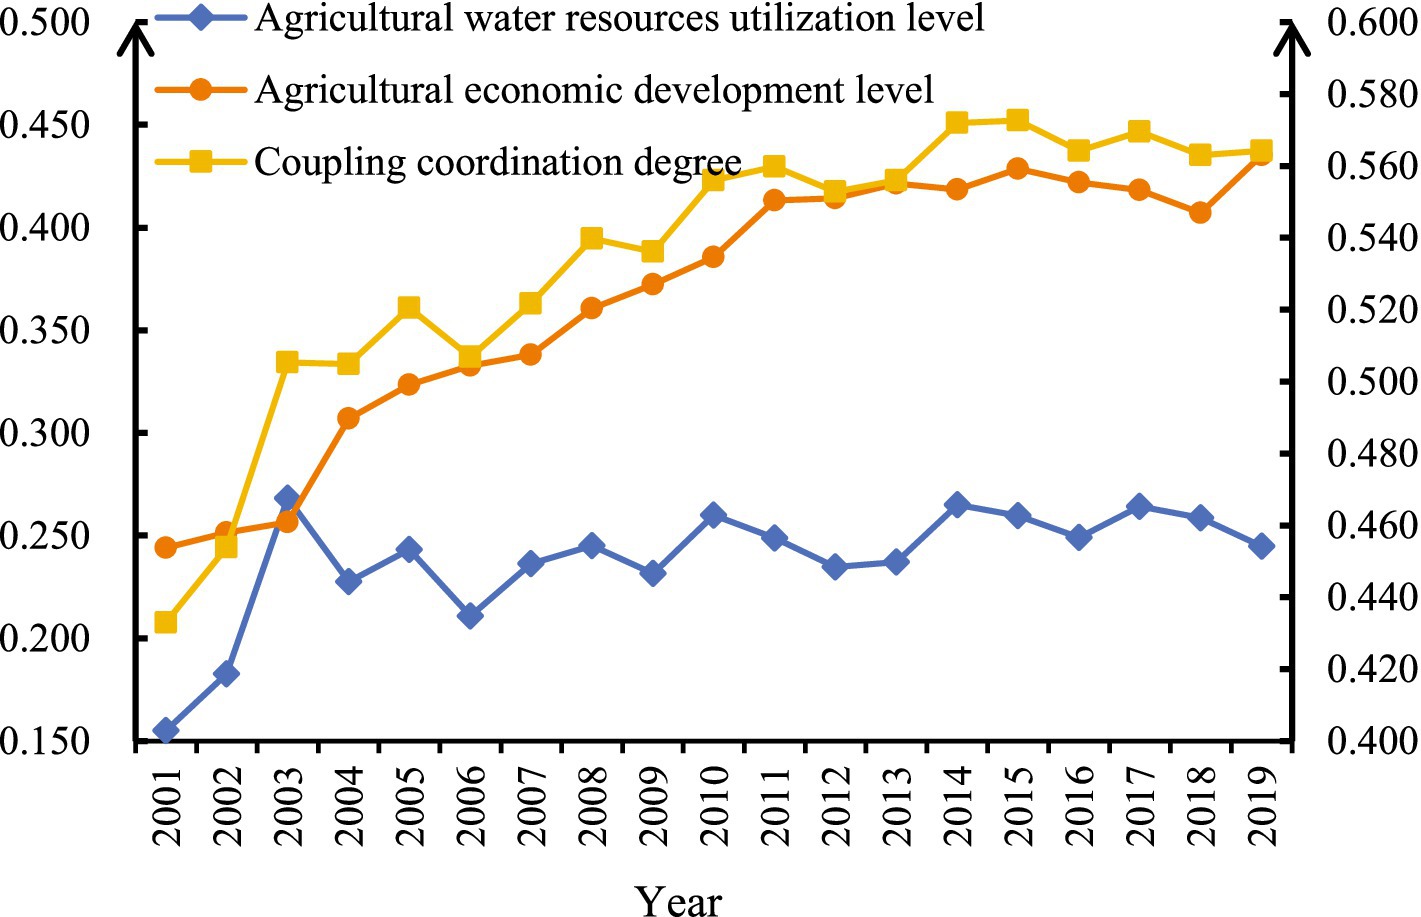
Figure 4. Temporal changes in the coupling and coordination of agricultural economy and agricultural water resources in Henan Province.
In 2001, the degree of coupling coordination between agricultural water resources utilization and agricultural economic development was 0.433, indicating a Near imbalanced level. The reason for this was that, in 2001, China’s management mechanism for agricultural water resources was relatively backward, lacking effective planning, allocation, and regulatory systems. Water resource conservation was neglected during the agricultural economic development process, which led to major problems such as water waste and declining water quality. Consequently, the two systems were in a state of imbalance.
In 2006, the degree of coupling coordination was 0.507, indicating a Basically coordinated level. This improvement can be attributed to the consistent expansion of the agricultural economy, as well as the policy guidance provided by the Several Opinions of the CPC Central Committee and the State Council on Promoting the Construction of a New Socialist Countryside issued in 2006, which emphasized strengthening farmland water conservancy construction. These policies improved the technical efficiency of agricultural water resource utilization, leading to an overall increase in the coordination level.
In 2011, the degree of coupling coordination was 0.560. In the same year, the State Council issued the Decision of the CPC Central Committee and the State Council on Accelerating the Reform and Development of Water Conservancy, emphasizing the importance of water conservancy development. This action improved the sustainability of the use of water resources in agriculture. However, Henan Province’s water supply and demand contradiction persisted, as most prefecture-level cities’ agricultural economic development levels exceeded their agricultural water resource utilization levels, leading to unstable coupling coordination grades.
In 2016, the degree of coupling coordination was 0.564. The 2016 Central Document No. 1 proposed the rational determination of agricultural water prices and the establishment of water-saving incentives, which enhanced agricultural water use efficiency. However, due to the long-standing lack of technological breakthroughs and further declines in water resource sustainability, the growth rate of the coupling coordination degree index between agricultural economics and water resources remained limited. With the exception of Luohe and Sanmenxia, the gap between agricultural water resources and agricultural economy continued to widen in the other cities in Henan, leading the coupling coordination grades to develop in a more unstable direction.
In 2019, the degree of coupling coordination was 0.564. In the same year, the Several Opinions of the CPC Central Committee and the State Council on Prioritizing Agricultural and Rural Development and Doing Well in Work Related to Agriculture, Rural Areas, and Farmers proposed to carry out water rights trading, promote the optimal allocation of water resources, strengthen the connection between water use systems, and have a positive impact on the utilization of agricultural water resources. 2019 is a heavy dry year. The sudden decrease of precipitation has reduced the endowment index of agricultural water resources, and the utilization level of agricultural water resources has also decreased. Moreover, the supply of agricultural production water resources is insufficient, and agricultural economic development is restricted, which has a negative impact on the coordination level of the two.
3.3 Spatial changes in the coupling and coordination of agricultural economy and agricultural water resources
The level of coordinated development has gradually shifted from a “southeastern regions > northwestern regions” pattern to a “southern regions > central regions > northern regions” pattern (see Figure 5).
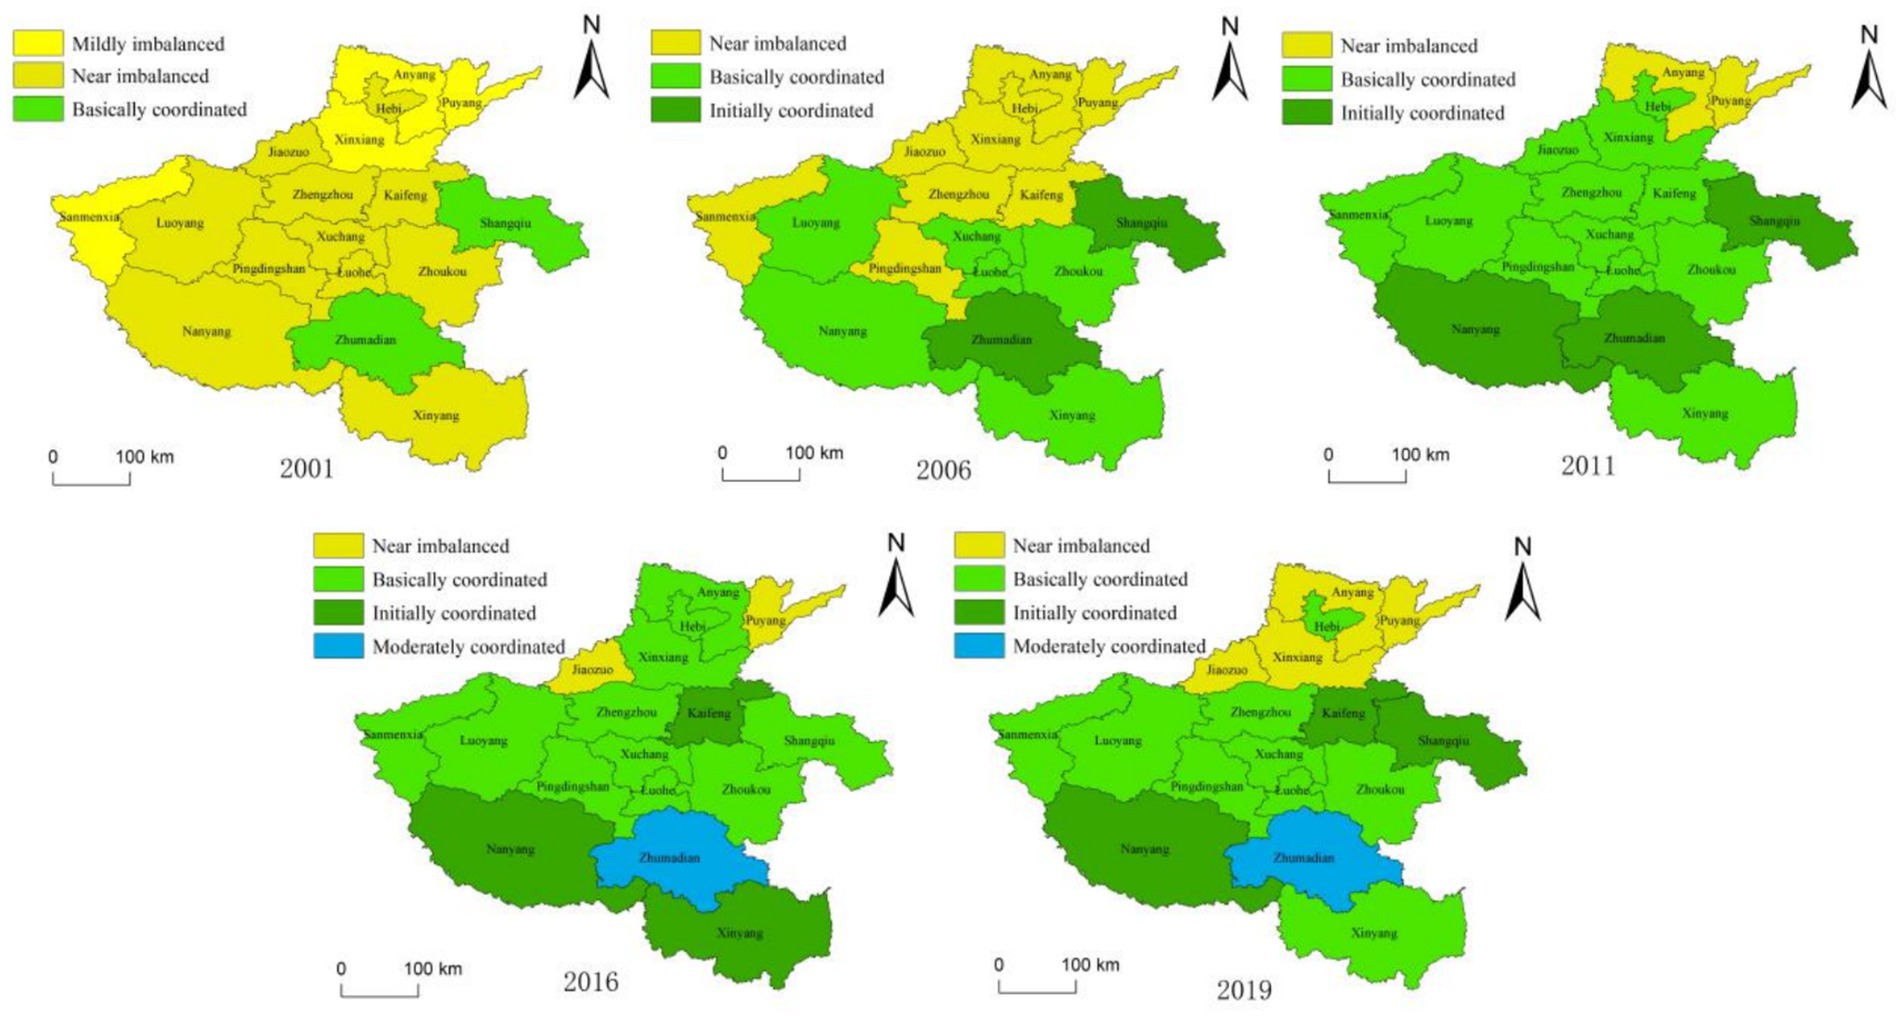
Figure 5. Coupling and coordination types of agricultural water resources utilization and agricultural economic development in various level cities.
In 2001, cities in the northwestern part, such as Sanmenxia, Anyang, Xinxiang, and Puyang, were Mildly imbalanced, while cities in the southeastern part, like Shangqiu and Zhumadian, were Basically coordinated. Other cities at the prefecture-level were Near unbalanced level, indicating a clear “southeastern regions > northwestern regions” trend in agricultural economic development and agricultural water resources utilization in Henan Province.
In 2006, high-level coupling and coordination were concentrated in the southeast, with low-level coupling and coordination still mostly concentrated in the northwest.
In 2011, Henan Province’s agricultural economic development and water resources utilization coupling and coordination grades first showed a “southern regions > central regions > northern regions” trend.
In 2016, Nanyang and Xinyang in the south were Initially coordinated, while Zhumadian was Moderately coordinated. Puyang and Jiaozuo in the north were Near imbalanced. Kaifeng in the central region was Initially coordinated, and other prefecture-level cities were also Initially coordinated. Regarding the level of coordinated development, the “southern regions > central regions > northern regions” pattern was comparatively noticeable.
In 2019, the coupling and coordination grades of Xinxiang and Anyang in the north declined, whereas the grade of Shangqiu in the central region improved. Despite Xinyang in the south dropping by one grade, the geographical distribution pattern of coupling and coordination grades still showed the “southern regions > central regions > northern regions” trend.
The southern region is endowed with abundant natural resources and favorable climatic conditions, which provide a solid foundation for agricultural economic development. In contrast, the central and northern regions have relatively weaker resource endowments. Particularly in the north, increasingly severe water shortages have constrained the sustained growth of the agricultural economy and exacerbated the imbalance between agricultural water resources utilization and economic development. These factors have significantly contributed to the trend of greater improvement in the coupling coordination level from south to central to north, and have directly influenced the spatial pattern of coordination between agricultural water resources and economic development.
3.4 Spatial correlation in the coupling and coordination of agricultural economy and agricultural water resources
3.4.1 Global spatial autocorrelation analysis
As shown in Table 4, the global Moran’s I values for the coupling coordination degree between agricultural economy and agricultural water resources in Henan Province from 2001 to 2019 are all positive, ranging between 0.296 and 0.596, with Z values ≥2.309 and p values ≤0.021. This indicates that the coupling coordination degree between agricultural economy and agricultural water resources across prefecture-level cities in Henan has a positive spatial autocorrelation in its spatial distribution, meaning that cities with high values and those with low values tend to be geographically adjacent to each other. From 2001 to 2010, the global Moran’s I values for the coupling coordination degree between agricultural economy and agricultural water resources across prefecture-level cities in Henan fluctuated, suggesting instability in the spatial correlation of coordination levels. The main reason for this is that during this decade, Henan Province underwent a series of significant changes and adjustments in policies related to agricultural economy and agricultural water resources, including adjustments to grain production targets, the purchase and sale of agricultural products, the abolition of agricultural taxes, and the construction and development of irrigation district water conservancy facilities. These policy initiatives constantly altered the consistent patterns between agricultural economic activities and water resources utilization across regions, resulting in fluctuations in the spatial correlation between the two. From 2011 to 2019, the fluctuation range of the Global Moran’s I index narrowed, indicating that the spatial association pattern of the coordination between agricultural economy and water resources tended to stabilize.
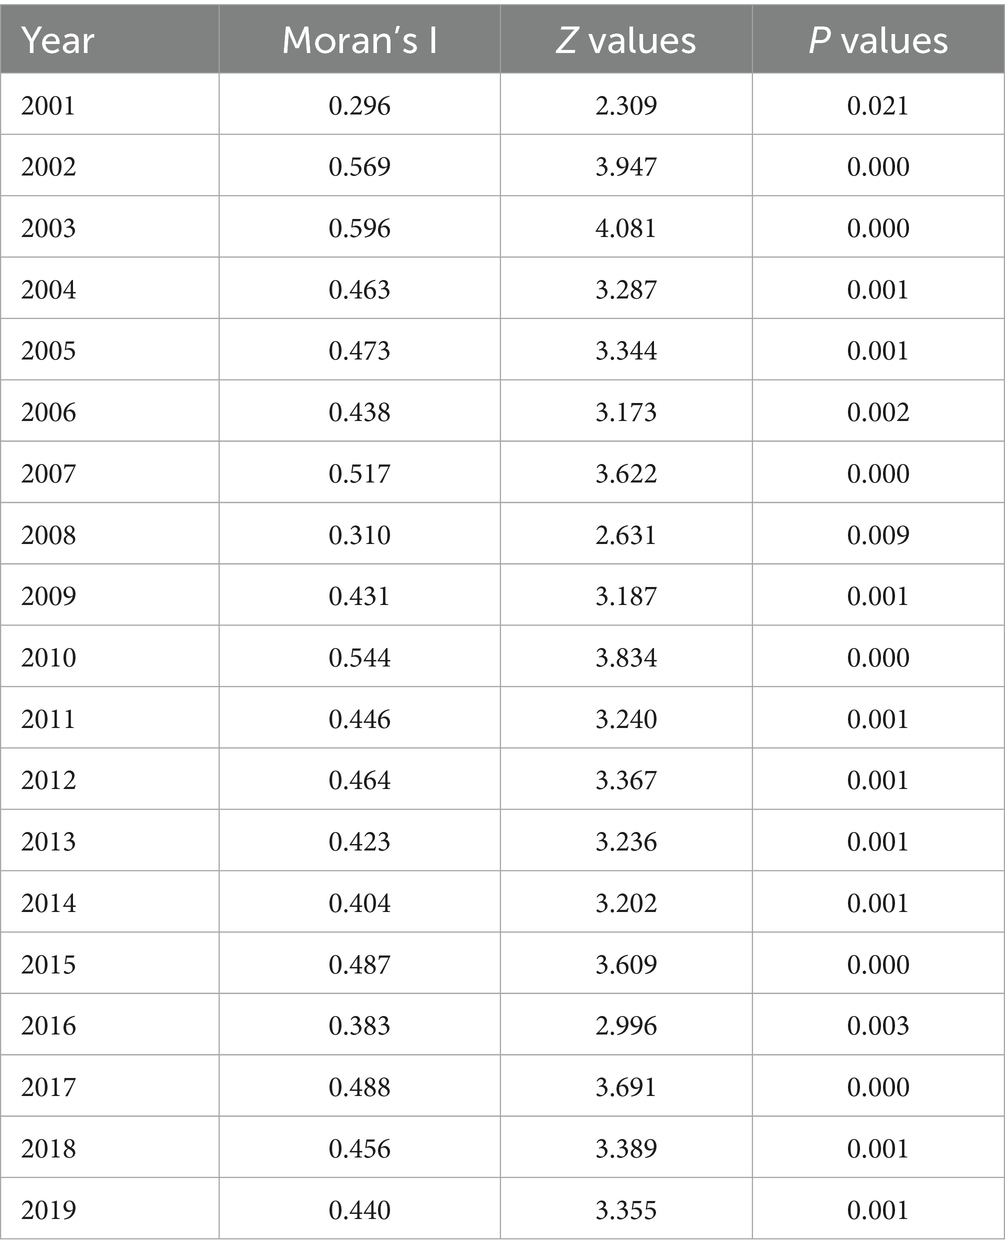
Table 4. Moran’s I value of coupling coordination degree between agricultural economy and agricultural water resources in Xinjiang.
3.4.2 Local spatial autocorrelation analysis
The “low-low” cluster type shows a concentrated pattern of coordination between agricultural economy and agricultural water resources, characterized by “low in the center and low around” (see Figure 6). Over the past 19 years, the “low-low”cluster type has consistently been concentrated in northern Henan, particularly around Anyang, Puyang, Hebi, and Xinxiang. Northern Henan faces natural challenges, including scarcity of precipitation, high evaporation rates, and insufficient surface water sources, which have led to excessive groundwater extraction to support agricultural production. This situation exacerbates the contradiction between water resources availability and agricultural economic development needs. Coupled with land degradation and significant soil erosion, these conditions further constrain agricultural production potential and the long-term sustainable utilization of water resources. In addition, the region has long relied on pipeline transportation, with relatively outdated irrigation infrastructure, and the recent rise in temperature and decline in precipitation effectiveness have further exacerbated the problem of water scarcity. In contrast, southern regions benefit from more abundant water resources, enabling more sustainable utilization of agricultural water.
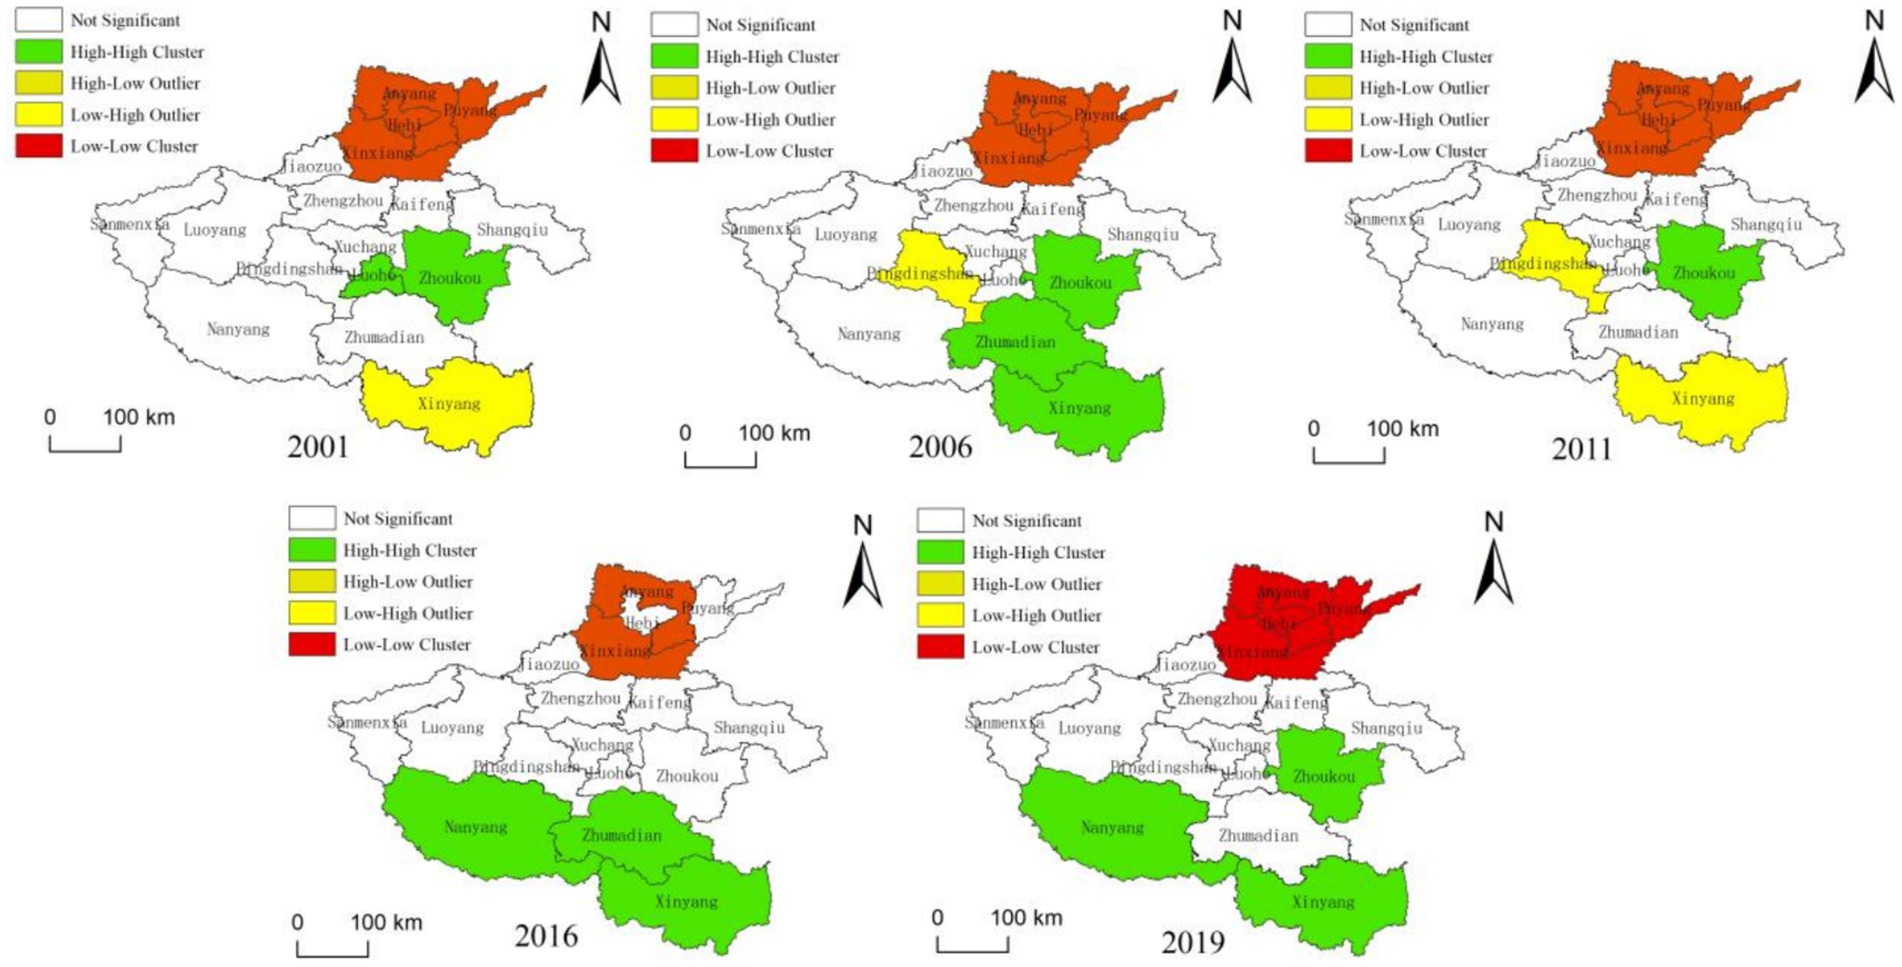
Figure 6. LISA agglomeration map of agricultural economy and agricultural water resources coordination levels in various level cities of Henan Province.
The “high-high” cluster type shows a concentrated pattern of coordination between agricultural economy and agricultural water resources, characterized by “high in the center and high around.” In 2001, the “high-high” cluster type was found in Luohe and Zhoukou. By 2006, it had expanded to include Luohe, Zhoukou, Zhumadian, and Xinyang, indicating a southward shift in its geographical distribution. In 2011, it was observed in Zhoukou; in 2016, it was present in Nanyang, Zhumadian, and Xinyang; and in 2019, it was found in Nanyang, Zhoukou, and Xinyang. Nanyang, Zhumadian, Luohe, Zhoukou, and Xinyang are all situated within the Huai River basin, which provides them with relatively abundant surface and groundwater resources, favorable irrigation conditions, and longer growing periods. These factors collectively promote crop growth and agricultural economic development. Additionally, these regions have made significant achievements in recent years in the construction of high-standard farmland and comprehensive watershed management, further enhancing the efficiency of agricultural water resource utilization and thereby supporting higher agricultural economic output.
4 Discussion
From 2001 to 2019, the level of agricultural economic development in Henan Province showed an overall upward trend. This pattern is consistent with the development trajectories observed in other regions of China, such as Sichuan (Deng et al., 2021) and Liaoning (Zhang and Jin, 2024). This indicates that Henan’s growth model aligns with the broader national trend of agricultural economic development (Zhao and Tang, 2018). Unlike previous studies that often rely on short-term data or single-dimensional indicators, this study employs a comprehensive evaluation framework based on a long-term dataset spanning 19 years and multiple subsystems, offering deeper insights into the stage-based characteristics of agricultural development in Henan. This rapid growth phase in agricultural economic development between 2001 and 2011 was driven by land consolidation efforts, increased agricultural investment, and significant technological progress. During this period, the subsystems of scale and structure, factor input, and output level increased by 76.72, 100.97, and 137.41%, respectively. However, from 2011 to 2019, the growth rate slowed considerably due to limitations in arable land resources and other external factors. Although continuous technological improvements allowed the output level subsystem to maintain a 16.59% growth rate during this period, the scale and structure subsystem declined by 1.12%, and the factor input subsystem decreased by 5.13%. This suggests that the model that relies solely on technological advancement to drive agricultural economic growth became insufficient in later stages. This finding is not entirely consistent with the conclusions of Han et al. (2023), suggesting that while technology can temporarily overcome resource constraints, its marginal returns diminish over time.
Regarding the trend in agricultural water resource utilization, existing studies present conflicting findings: some argue that water use efficiency in Henan has improved due to technological progress (Zhao et al., 2022), while others suggest that declining water resource endowments or lagging management have led to efficiency losses (Jiao et al., 2020). By analyzing the trend in agricultural water use in Henan from 2001 to 2019, this study reveals that these divergent conclusions actually reflect the differentiated evolution of various subsystems. From the perspective of the water resource endowment subsystem, its indicator value decreased by 33.37% over the 19 years, objectively confirming the ongoing deterioration of regional water resource conditions and supporting the argument of intensifying resource constraints (Jiao et al., 2020). In contrast, the water use efficiency subsystem showed continuous improvement, increasing by 122.80% from 2001 to 2011, and a further 11.94% from 2011 to 2019. This result aligns with previous findings that technological advancement enhances water use efficiency (Shah et al., 2024), suggesting that the adoption of water-saving technologies has, to some extent, alleviated pressure from resource shortages. Notably, the water use sustainability subsystem exhibited a trend of first increasing and then decreasing: it rose by 50.85% from 2001 to 2011, but declined by 22.86% from 2011 to 2019. This turning point indicates that although technological progress temporarily improved efficiency, the overall sustainability of the agricultural water use system is now under threat in the context of continuously deteriorating resource bases.
Furthermore, this study is the first to explore the coupling and coordination relationship between agricultural water resource utilization and agricultural economic development. The results show that the coupling and coordination degree between agricultural water resources and the agricultural economy in Henan has exhibited a significant upward trend overall. From 2001 to 2011, the coupling and coordination degree increased substantially, with the coordination level improving from Near imbalanced to Basically coordinated. This was mainly attributed to the synergistic driving forces of agricultural water resource utilization and agricultural economic development, which mutually reinforced each other, forming a positive resource-economy cycle. However, from 2011 to 2019, although the coupling and coordination index continued to rise, the growth rate of the agricultural economy significantly outpaced that of agricultural water resource utilization, while regional disparities widened. This reflects the marginal inhibitory effect of resource constraints on further coordination improvements. These findings reflect a water scarcity-driven growth dilemma: regions with limited water endowments face exacerbated sustainability challenges when prioritizing agricultural economic expansion. To achieve high-quality coordination in the future, differentiated policies and institutional innovations are needed to narrow regional gaps.
The most important contribution of this study is the construction of two comprehensive evaluation index systems. The level of agricultural economic development is assessed from four dimensions: scale and structure, factor input, output level, and sustainability. Meanwhile, agricultural water resource utilization is evaluated across four other dimensions: water resource endowment, water use efficiency, water use technology level, and water use sustainability. To ensure objectivity, the entropy weight method was introduced for indicator weighting, minimizing the influence of subjective judgment on the results. This study further analyzed the development levels of agricultural economy and water resources utilization in Henan Province, as well as their coupling and coordination relationship, providing empirical support for China to harmonize the “Zero Hunger” (SDG 2) and “Clean Water” (SDG 6) goals. Meanwhile, the findings offer important insights into the integrated management of agricultural economy and water resources. However, when applying the Coupling Coordination Degree Model (CCDM), this study assumed equal contribution weights for the two subsystems. Although this approach is widely used and facilitates cross-regional comparisons, it fails to capture the dynamic lag effects and feedback mechanisms between the agricultural economy and water resource systems. Moreover, to ensure the stability of the results, the annual average precipitation in Henan Province exhibited minimal variation during the study period. While this condition helps reduce interference from extreme climatic events on water resource endowments, it also implies that the discussion on climate change and variability in precipitation patterns remains limited—factors that are clearly critical to both water resource availability and agricultural sustainability. Future research should incorporate longer time series data and integrate these variables into scenario simulations, aiming to provide specific and feasible development plans for the sustainable development of agricultural water resources and the agricultural economy in the province.
5 Conclusions and suggestions
5.1 Conclusion
Against the backdrop of global climate change and increasingly severe water resource constraints, the coordination between agricultural water resources and agricultural economic development has emerged as a critical issue for achieving sustainable development. Based on panel data from Henan Province, spanning the period from 2001 to 2019, this study systematically evaluates the spatiotemporal evolution characteristics of the coordination level between agricultural water resources and agricultural economic development, employing methods such as comprehensive evaluation, coupling coordination degree analysis, relative development degree analysis, and spatial autocorrelation analysis. It offers empirical evidence for the implementation of the United Nations Sustainable Development Goals (SDG 2 and SDG 6) in China and provides scientific references for formulating policies to promote sustainable development in the country. The main conclusions are as follows:
1. The evaluation index of agricultural economic development in Henan Province shows an increasing trend, but the development model lacks long-term momentum. In terms of the subsystems, the rapid growth in the early stage was driven by significant improvements in the Scale and structure subsystem, the Factor input subsystem, and the Output level subsystem. However, in the later period, both the Scale and structure subsystem, and the Factor input subsystem declined. Although Output level subsystem continued to rise and the Sustainability subsystem also showed growth, these changes still slowed the overall growth rate. Regarding agricultural water resources utilization, the overall level increased, but the subsystems exhibited contradictory trends: the Water use efficiency subsystem improved by 149.42%, the Water use technology level subsystem increased by 41.30%, while the Water resource endowment subsystem declined by 33.37%. These results confirm that the current development model has yet to overcome the rigid constraints imposed by resource limitations.
2. The coupling coordination degree index between agricultural water resources and the agricultural economy shows an upward trend but remains at a low level of coupling coordination. The process of coupling and coordinated development can be roughly divided into three stages. During 2001–2002, the development of Henan’s agricultural economy neglected the protection of water resources, leading to issues such as water wastage and deteriorating water quality. Consequently, the level of coordination between the two was relatively low, reflecting an imbalanced state. From 2003 to 2010, with the development of water infrastructure such as reservoirs, wells, and water-saving irrigation systems, the level of agricultural water use in Henan gradually improved, significantly enhancing the coordination between agricultural water resources and the agricultural economy. However, the improvement in agricultural economic development outpaced that of agricultural water resources utilization. From 2011 to 2019, the over-exploitation of surface and groundwater resources became increasingly prominent, leading to a decline in the sustainability of agricultural water resources utilization and, ultimately, a reduction in agricultural water use levels. Although the level of agricultural economic development continued to rise, the coordination level between the two did not improve and remained unstable.
3. Spatially, in 2001, the coordination level between agricultural water resources and the agricultural economy in Henan Province exhibited a pattern of southeast > northwest. With the development of the agricultural economy and improvements in agricultural water resources utilization, the coupling coordination level also showed an upward trend. The improvement in coupling coordination was closely related to geographical location, showing a clear south > central > north pattern. By 2019, the northern cities of Xinxiang, Anyang, and Puyang had improved to Near imbalance, while Hebi had advanced to Basically coordinated. In the central region, Kaifeng and Shangqiu had reached Initially coordinated, while other prefecture-level cities had achieved Basically coordinated. In the south, Nanyang had progressed to Initial coordination, Zhumadian to Moderately coordinated, and Xinyang to Basically coordinated.
4. The analysis of spatial correlation characteristics indicates that there is a positive spatial autocorrelation in the coordination degree between agricultural water resources and economic development in Henan Province. During the period from 2001 to 2010, influenced by agricultural policy adjustments, the spatial correlation exhibited fluctuating characteristics; from 2011 to 2019, it tended to stabilize. Local spatial analysis further identifies two types of typical agglomeration areas. There is a “low-low” aggregation area distributed in the northern part of Henan, where the region is constrained by natural conditions such as scarce precipitation and intense evaporation, and the problem of groundwater over-exploitation is prominent, leading to intensified contradictions between water resources and agricultural economic development. In contrast, there is a “high-high” aggregation area distributed in the southern part of Henan, which benefits from relatively abundant water resources and superior irrigation conditions in the Huai River Basin, forming a benign pattern of resource-economic coordinated development.
5.2 Suggestions
5.2.1 Promote the transformation and upgrading of agricultural development and water resource utilization
To promote coordinated development between agriculture and water resources, efforts should focus on three key areas: optimizing scale structure, enhancing technological innovation, and implementing water-use constraints.
First, optimize land management models. In response to the fragmentation of agricultural production in the northern regions, it is recommended to encourage the integration of fragmented farmland through land transfer, cooperatives, or family farms, thereby improving the scale of agricultural operations. For example, cities such as Anyang and Puyang have initiated programs to cultivate agricultural business entities, establishing dynamic adjustment mechanisms for concentrated land use. This model not only improves land use efficiency but also enhances farmers’ resilience to market risks.
Second, increase investment in water-saving technological innovation. Greater efforts should be made to develop and promote advanced technologies such as smart irrigation and precision fertilization. The successful pilot implementation of integrated drip and sprinkler irrigation systems in Nanyang’s high-standard cropland projects provides a valuable reference. It is recommended that similar efficient water-saving technologies be extended to other water-scarce regions in northern Henan and incorporated into local plans for agricultural modernization, in order to support sustainable development goals.
Third, implement water-use constraint mechanisms and crop structure adjustments. Building on the ongoing agricultural water pricing reform pilots in Henan Province, rigid water-use constraints based on the principle of “production determined by available water” should be applied in severely groundwater-overexploited areas in the north. Price subsidies or tax incentives should be provided for water-saving agricultural projects. At the same time, the planting area of high-water-consumption crops should be controlled, with a shift toward drought-resistant crops such as minor grains and forage crops. For instance, a demonstration program for drought-tolerant crop cultivation has been launched in Hebi, accompanied by seed subsidies and technical training to help farmers transition to new cropping patterns.
5.2.2 Establish a spatiotemporal coordination governance system for agricultural water resources and economic development
To address the significant regional disparities in the level of coordination between agricultural development and water resource utilization, it is essential to construct a coordinated governance framework based on both temporal evolution and spatial distribution.
First, implement a zoned and categorized management mechanism. In the southern parts of Henan Province within the Huai River Basin—where water resources are relatively abundant—ecological cyclic agriculture should be encouraged, with the promotion of integrated rice-fish farming models. In the transitional central regions, efforts should focus on cultivating water-saving agricultural industrial clusters. In the northern water-scarce areas, greater emphasis should be placed on popularizing water-saving technologies and protecting groundwater resources. This differentiated management approach better aligns with local resource endowments and promotes healthy and sustainable agricultural economic development.
Second, establish a “Agricultural Water Resources–Economic Development” coordinated development fund. Drawing on recent experiences with environmental compensation mechanisms in Henan Province, fiscal transfers should be linked to water-saving performance to support infrastructure construction and the promotion of efficient water-use technologies in the northern regions. For example, funding can be used for the upgrading of small pumping stations or subsidies for the purchase of field-level smart irrigation equipment, thereby enhancing the policy’s targeting and operational feasibility. Such measures not only improve local water use efficiency but also contribute to the sustainable growth of the agricultural economy.
Third, build a dynamic policy adjustment mechanism. Based on annual assessments of coupling coordination levels, regions should be dynamically classified and managed accordingly. Fiscal support and water allocation quotas should be adjusted in a timely manner to ensure that policy measures remain aligned with actual regional development conditions, improving the flexibility and timeliness of policy responses. Through regular evaluation and feedback mechanisms, potential issues can be identified and addressed promptly, ensuring the effective implementation of policies.
5.2.3 Improve the spatial coordination governance system
Given the spatial autocorrelation characteristics of agricultural economy and water resources, regional coordinated development should be promoted through three key dimensions: cross-regional resource allocation, differentiated support policies, and ecological compensation mechanisms.
First, advance inter-regional water resource allocation mechanisms. Accelerate the construction of supporting infrastructure for the Central Route of the South-to-North Water Diversion Project in Henan Province, and improve the irrigation networks that utilize Yellow River water for groundwater recharge. These efforts will enhance water security in northern Henan. At the same time, explore the establishment of a regional water-sharing mechanism between Nanyang and Xinyang to achieve spatial rebalancing of water resources and alleviate the imbalance in water availability between southern and northern parts of the province. Optimized water resource allocation can significantly ease the water shortage situation in northern Henan.
Second, implement differentiated support policies. Targeted technical assistance and investment in water-saving infrastructure should be provided to regions in northern Henan that have long been characterized by “low–low” development levels. For example, a demonstration zone for smart water-saving agriculture has been launched in Anyang, where social capital is encouraged to participate in the investment, operation, and maintenance of water-saving facilities. This model serves as a replicable and scalable approach. Such initiatives not only enhance the technological sophistication of local agricultural production but also stimulate coordinated development in surrounding areas.
Third, strengthen horizontal ecological compensation mechanisms. Drawing on experiences from ecological compensation practices in the Yangtze River Basin, a fiscal transfer system based on the principle of “upstream ecological conservation supported by downstream beneficiaries” should be explored within the province. This would help balance the differences in resource use and development benefits between southern and northern Henan. By establishing a multi-level coordination network, positive spillover effects can be generated—from high–high agglomeration areas to low–low agglomeration areas—thereby promoting sustainable and coordinated development of agriculture and water resources across the entire province. Such a compensation mechanism not only supports environmental protection but also facilitates balanced regional development.
Data availability statement
The raw data supporting the conclusions of this article will be made available by the authors, without undue reservation.
Author contributions
YY: Writing – original draft. JC: Writing – review & editing, Writing – original draft. ZL: Writing – review & editing, Funding acquisition. JW: Writing – review & editing, Methodology. XZ: Writing – review & editing.
Funding
The author(s) declare that financial support was received for the research and/or publication of this article. This research was supported by the Philosophy and Social Science Planning Youth Project of Henan Province (2023CJ181).
Conflict of interest
The authors declare that the research was conducted in the absence of any commercial or financial relationships that could be construed as a potential conflict of interest.
Generative AI statement
The authors declare that no Gen AI was used in the creation of this manuscript.
Publisher’s note
All claims expressed in this article are solely those of the authors and do not necessarily represent those of their affiliated organizations, or those of the publisher, the editors and the reviewers. Any product that may be evaluated in this article, or claim that may be made by its manufacturer, is not guaranteed or endorsed by the publisher.
References
Alrwis, N. K., Ghanem, M. A., Alnashwan, S. O., AI Duwais, A. A. M., Alaagib, S. A. B., and Aldawdahi, N. M. (2020). Measuring the impact of water scarcity on agricultural economic development in Saudi Arabia. Saudi J. Biol. Sci. 28, 191–195. doi: 10.1016/j.sjbs.2020.09.038
Benfetta, H., and Ouadja, A. (2020). Groundwater overuse in arid areas: case study of syncline Bouguirat-Mostaganem, Algeria. Arab. J. Geosci. 13, 81–86. doi: 10.1007/s12517-020-05765-1
Cao, J. J., Xu, J. X., and Zhao, Y. F. (2012). Research on agricultural water resource shortage under the background of rapid industrialization and urbanization—for the example of Shandong Province. Adv. Mater. Res. 1793, 4935–4940. doi: 10.4028/www.scientific.net/AMR.518-523.4935
Chen, J. D., Tian, H. G., Huang, J., Zhang, J., Zhang, F., et al. (2020). Climate-driven yield variability for winter wheat in Henan Province, North China and its relation to large-scale atmospheric circulation indices. Int. J. Plant Prod. 15, 79–91. doi: 10.1007/s42106-020-00119-z
Chen, Y., and Xu, L. F. (2021). Evaluation and scenario prediction of the water-energy-food system security in the Yangtze River Economic Belt based on the RF-Haken model. Water 13:695. doi: 10.3390/W13050695
Chen, C. H., and Zhang, H. J. (2023). Evaluation of green development level of Mianyang agriculture, based on the entropy weight method. Sustain. For. 15:7589. doi: 10.3390/SU15097589
Dai, X. P., Zhang, X. H., Han, Y. P., Dai, X., Zhang, X., Han, Y., et al. (2017). Impact of agricultural water reallocation on crop yield and revenue: a case study in China. Water Policy 19, 513–531. doi: 10.2166/wp.2016.040
Deng, F. M., Jia, S. Y., and Gong, Q. X. (2021). Regional agriculture coupling coordination analysis based on sustainable development: a case study of Sichuan, China. E3S Web Conf. 245:02014. doi: 10.1051/E3SCONF/202124502014
Echarte, L., Alfonso, C. S., González, H., Hernández, M. D., Lewczuk, N. A., Nagore, L., et al. (2023). Influence of management practices on water-related grain yield determinants. J. Exp. Bot. 74, 4825–4846. doi: 10.1093/JXB/ERAD269
Ghosh, S., Gorain, S., and Mondal, B. (2017). Spatio-temporal variations and links between irrigation and agricultural development in an eastern Indian state. Irrig. Drain. 66, 784–796. doi: 10.1002/ird.2151
Han, A. H., Huang, J., Wang, X., Han, A., and Zhu, Z. (2023). Efficient water-saving irrigation, space efficiency and agricultural development—study based on spatial stochastic frontier model. J. Syst. Sci. Complex. 36, 2559–2579. doi: 10.1007/s11424-023-1383-x
Huai, H. J., Zhang, Q., Li, Z. L., Liang, L., and Tang, X. (2024). Analysis of crop irrigation water requirements and water scarcity footprint in the Beijing–Tianjin–Hebei region based on the GeoSim–AquaCrop model. Agronomy 14:192. doi: 10.3390/AGRONOMY14010192
Huang, Y. J., Huang, X. K., Xie, M. N., Huang, Y., Huang, X., Xie, M., et al. (2021). A study on the effects of regional differences on agricultural water resource utilization efficiency using super-efficiency SBM model. Sci. Rep. 11:9953. doi: 10.1038/S41598-021-89293-2
Hussein, M. A., Haileslassie, A., Derseh, M. B., Assefa, T. T., Riga, F. T., Adie, A., et al. (2024). Enhancing irrigated forage crop production through water and nutrient management in the Ethiopian sub-humid highlands. Front. Sustain. Food Syst. 8:1373698. doi: 10.3389/FSUFS.2024.1373698
Jiang, S., Wang, J. H., Liu, H., Zhu, Y., He, G., Li, W., et al. (2023). Coordinated development of water, food, and energy in upper and middle reaches of the Yellow River. Chin. Eng. Sci. 25, 180–190.
Jiao, S. X., Chen, L. F., Wang, A. Z., Yin, Y. X., Zhang, J. W., Li, Z. X., et al. (2020). The spatial-temporal patterns of vulnerability analysis and the obstacle diagnosis of agricultural water resource in Henan Province. Agric. Mod. Res. 41, 312–320. doi: 10.13872/j.1000-0275.2020.0030
Jiao, S. X., Wang, A. Z., Zhang, X. X., Zhang, C. C., Zhao, R. Q., Chen, L. F., et al. (2020). Coordinated development of industrial structure and water resources in Henan Province under the “New Normal”. World Geogr. Res. 29, 358–365.
Khamidov, M., and Ashurbek, M. (2021). Effectiveness of rainwater irrigation in agricultural crops in the context of water resources. IOP Conf. Ser. Mater. Sci. Eng. 1030:012130. doi: 10.1088/1757-899X/1030/1/012130
Li, D. W., Chen, J. B., and Qiu, M. L. (2021). The evaluation and analysis of the entropy weight method and the fractional grey model study on the development level of modern agriculture in Huizhou. Math. Probl. Eng. 2021:5543368. doi: 10.1155/2021/5543368
Li, M., Singh, V. P., Fu, Q., Liu, D., Li, T., and Zhou, Y. (2019). Optimization of agricultural water–food–energy nexus in a random environment: an integrated modelling approach. Stoch. Environ. Res. Risk Assess. 35, 1–17. doi: 10.1007/s00477-019-01672-4
Li, H. M., and Yi, Q. (2024). The mechanism and promotion path of water rights trading empowering farmers' income increase. Res. Agric. Mod. 45, 177–187. doi: 10.13872/j.1000-0275.2024.0025
Li, Q., Zhao, Y., Li, S. L., Li, S., and Zhang, L. (2021). Spatial-temporal characteristics of the coupling coordination of social security and economic development in China during 2002–2018. Reg. Sustain. 2, 116–129. doi: 10.1016/J.REGSUS.2021.04.001
Liu, J. T., Liu, R. Y., and Xu, Y. X. (2022). Evaluation research on water resources carrying capacity of prefecture-level cities in Henan Province[J]. People’s Yellow River 44, 53–58.
Liu, Q. L., and Cui, S. J. (2020). Study on the spatial-temporal characteristics of the coupling coordinated between water poverty and urbanization in Henan Province. People Yellow River 42, 62–66+72.
Liu, T. B., Fang, Y., Huang, F., Wang, S., Du, T., and Kang, S. (2023). Dynamic evaluation of the matching degree and utilization condition of generalized agricultural water and arable land resources in China. J. Agric. Eng. 39, 56–65. doi: 10.11975/j.issn.1002-6819.202302136
Liu, M. M., Pan, P. P., Ren, J. X., Wen, J. Y., and Zhang, B. (2023). Coupling coordination of food security and agricultural water security in Beijing-Tianjin-Hebei region. Agric. Resour. Zoning China 44, 170–182.
Momm, H. G., Bingner, R. L., Moore, K., and Herring, G. (2022). Integrated surface and groundwater modeling to enhance water resource sustainability in agricultural watersheds. Agric. Water Manag. 269:107692. doi: 10.1016/J.AGWAT.2022.107692
Pang, J. X., Li, H. J., Lu, C. P., Lu, C., and Chen, X. (2020). Regional differences and dynamic evolution of carbon emission intensity of agriculture production in China. Int. J. Environ. Res. Public Health 17:7541. doi: 10.3390/ijerph17207541
Peng, L., Deng, W., and Tan, J. (2020). The matching relationship between the utilization of water and land resources and economic growth in the Hengduan Mountains. Acta Geograph. Sin. 75, 1996–2008.
Perry, E. M., Dezzani, R. J., Seavert, C. F., and Pierce, F. J. (2010). Spatial variation in tree characteristics and yield in a pear orchard. Precis. Agric. 11, 42–60. doi: 10.1007/s11119-009-9113-5
Qi, X. F., Li, W. P., Zheng, Y. J., Cui, H., Kang, W., Liu, Z., et al. (2023). Coupling simulation and prediction of sustainable utilization of water resources in an arid Inland River basin under climate change. Water 15:3232. doi: 10.3390/W15183232
Shah, H. U. W., Hao, G., Yasmeen, R., Yan, H., and Qi, Y. (2024). Impact of agricultural technological innovation on total-factor agricultural water usage efficiency: evidence from 31 Chinese provinces. Agric. Water Manag. 299:108905. doi: 10.1016/J.AGWAT.2024.108905
Shi, C. F., Yuan, H., Pang, Q. H., Shi, C., Pang, Q., and Zhang, Y. (2020). Research on the decoupling of water resources utilization and agricultural economic development in Gansu province from the perspective of water footprint. Int. J. Environ. Res. Public Health 17:5758. doi: 10.3390/ijerph17165758
Shin, H., Lim, H., Lee, J., Lee, S., Jin, Y., Lee, C.-s., et al. (2024). Hydrological analysis of agricultural reservoir watersheds based on water utilization system using the catchment hydrology cycle analysis tool model. Sustain. For. 16:3887. doi: 10.3390/SU16103887
Sun, Y., Zhao, Z., and Li, M. Q. (2022). Coordination of agricultural informatization and agricultural economy development: a panel data analysis from Shandong Province, China. PLoS One 17:e0273110. doi: 10.1371/JOURNAL.PONE.0273110
Wang, Y. B., Wu, P. T., Engel, B. A., and Sun, S. K. (2014). Application of water footprint combined with a unified virtual crop pattern to evaluate crop water productivity in grain production in China. Sci. Total Environ. 497-498, 1–9. doi: 10.1016/j.scitotenv.2014.07.089
Wu, P.-t. (2010). The modern water saving agricultural technology progress and focus. Afr. J. Biotechnol. 9, 6017–6026.
Xu, J. H. (2024). Spatial spillover and threshold effects of digital rural development on agricultural circular economy growth. Front. Sustain. Food Syst. 8:1337637. doi: 10.3389/fsufs.2024.1337637
Xu, B. W., Niu, Y. R., Zhang, Y. N., Xu, B., Niu, Y., Zhang, Y., et al. (2022). China's agricultural non-point source pollution and green growth: interaction and spatial spillover. Environ. Sci. Pollut. Res. Int. 29, 60278–60288. doi: 10.1007/S11356-022-20128-X
Xu, Y. W., Wang, Y. H., Liang, D. L., Fu, Q., Zhou, Y., and Chen, X. H. (2020). Irrigation water resources allocation in Jinxi Irrigation District based on agricultural sustainability. J. Agric. Mach. 51, 299–309.
Yang, G. Q., Ding, L. R., Huo, L. J., Yang, G., Ding, L., Huo, L., et al. (2021). Coordinated development of agricultural water resources and the socio-economy in Shanxi province considering uncertainty. Irrig. Drain. 70, 861–870. doi: 10.1002/IRD.2581
Yang, S. S., Zhang, L. G., Yu, L., Xu, B., and Xiong, Y. (2020). Evolution of coordinated development of social economy and water resources utilization in Hunan Province. Econ. Geogr. 40, 86–94. doi: 10.15957/j.cnki.jjdl.2020.11.010
Zhang, Z. Y., and Jin, G. (2024). Measurement of agricultural eco-efficiency and analysis of its influencing factors: insights from 44 agricultural counties in Liaoning Province. Land 13:300. doi: 10.3390/LAND13030300
Zhang, Y., Khan, S. U., Swallow, B., Liu, W., and Zhao, M. (2022). Coupling coordination analysis of China's water resources utilization efficiency and economic development level. J. Clean. Prod. 373:133874. doi: 10.1016/j.jclepro.2022.133874
Zhang, Y., Liu, W. X., Cai, Y., Khan, S. U., and Zhao, M. (2020). Decoupling analysis of water use and economic development in arid region of China–based on quantity and quality of water use. Sci. Total Environ. 761:143275. doi: 10.1016/j.scitotenv.2020.143275
Zhang, Q. Y., Qian, H., Xu, P. P., Zhang, Q., Xu, P., Liu, R., et al. (2023). A numerical assessment and prediction for meeting the demand for agricultural water and sustainable development in irrigation area. Remote Sens. 15:571. doi: 10.3390/RS15030571
Zhao, J. C., Fan, S. Y., Feng, J. Y., and Shi, Y. Q. (2022). Temporal and spatial variations of water resources utilization efficiency in the middle and lower reaches of the Yellow River. J. Henan Normal Univ. (Nat. Sci. Ed.) 50, 37–44. doi: 10.16366/j.cnki.1000-2367.2022.06.006
Zhao, J. F., and Tang, J. M. (2018). Understanding agricultural growth in China: an international perspective. Struct. Change Econ. Dyn. 46, 43–51. doi: 10.1016/j.strueco.2018.03.006
Zhao, X., Tao, W. H., Su, L. J., Tao, W., Su, L., Sun, Y., et al. (2023). Spatio-temporal study on irrigation guarantee capacity in the northwest arid region of China. Water 15:1396. doi: 10.3390/W15071396
Zheng, B. F., Zhao, J. Y., and You, D. (2018). Study on the coupling relationship between water environment and social economy in Ganjiang River basin. Desalin. Water Treat. 12, 14–19. doi: 10.5004/dwt.2018.22583
Keywords: SDGs, agricultural water resources, agricultural economy, coupling coordination, spatiotemporal differentiation, sustainable management
Citation: Yang Y, Chen J, Li Z, Wang J and Zhou X (2025) Coupling coordination of agricultural water-economy systems in China: evidence from high-stress hydrological zones in a major grain-producing province. Front. Sustain. Food Syst. 9:1608329. doi: 10.3389/fsufs.2025.1608329
Edited by:
Damodhara Rao Mailapalli, Indian Institute of Technology Kharagpur, IndiaReviewed by:
Inder Sekhar Yadav, Indian Institute of Technology Kharagpur, IndiaPiyush Singh, Indian Institute of Technology Kharagpur Center for Rural Development and Innovative Sustainable Technology, India
Copyright © 2025 Yang, Chen, Li, Wang and Zhou. This is an open-access article distributed under the terms of the Creative Commons Attribution License (CC BY). The use, distribution or reproduction in other forums is permitted, provided the original author(s) and the copyright owner(s) are credited and that the original publication in this journal is cited, in accordance with accepted academic practice. No use, distribution or reproduction is permitted which does not comply with these terms.
*Correspondence: Yang Yang, MjAyMjIzMTYxMTNAc3R1LnNoenUuZWR1LmNu