 Benjamin Heine
 Frédéric Gaspart2
 Nicolas Biot
- 1Plant Ecology, Eco-physiology, and Sustainable Agriculture, ELI-Agronomy, UCLouvain, Louvain-la-Neuve, Belgium
- 2ELI-Agronomy, Université Catholique de Louvain, Louvain-la-Neuve, Walloon Brabant, Belgium
- 3Geography Department, Transitions Institute, University of Namur, Namur, Belgium
Small-and medium-scale market gardening plays an important role in transitioning toward a sustainable food system, yet its viability remains underexplored. This study assesses the viability of small- and medium-scale market gardening farms in the Coeur de Condroz region (Belgium) using field data from 17 farms. A set of five indicators; land productivity, labor productivity, gross added value, estimated profit, and a risk index were developed to analyze viability. Results reveal significant variability among farms. Some achieve viability, while others rely on off-farm income. Three distinct farm profiles were identified based on viability indicators; one composed of less performant farms and two of viable farms with different strategies. Key drivers of viability were highlighted to include greenhouse surface, crop diversity, and years since establishment. Additionally, farms integrating complementary on-farm activities exhibited lower risk of cost but lower productivity per hectare. By redefining viability assessment methods and engaging directly with farmers, this research offers valuable insights into the factors shaping small-and medium-scale market gardening farms. Findings indicate that viability cannot be measured through financial indicators alone but must consider broader socio-economic dimensions. Additionally, farmers' perceptions of viability vary, with some incorporating quality of life into their assessment. This study demonstrates that market gardening can be viable through diverse strategies, despite limited public financial support. It offers practical recommendations for research, and also highlights the potential of applying this methodology to cross-regional longitudinal studies, as well as the need to investigate the relationship between perceived and measured viability.
Introduction
The current global food system is unsustainable and lacks resilience. Its systemic failures contribute to environmental degradation and heavy inequalities resulting in poverty and health impacts on the world's population (Horton, 2023; De Schutter, 2017; Béné et al., 2019a,b; FAO, 2023). Agroecology is defined as a science, a set of practices and a social movement (Wezel et al., 2009) that has come as a reaction to the challenges of the current global food system (Altieri et al., 2018; IPBES-Food, 2021). While the core principle of agroecology focused on environmental sustainability at the farm and field level, agroecology now encompasses a broader perspective that integrates the socio-economic and governance dimensions of sustainability at the level of the whole food system (Wezel et al., 2020). The approach of agroecology has gained recognition and has been highlighted as an effective approach to move toward achieving food security and nutrition by the United Nations (De Schutter, 2017).
Small- and medium-scale market gardening can be considered an agroecological farming model (Dumont, 2017; Drottberger et al., 2021; Navarrete et al., 2014; IPBES-Food, 2016). In this paper, we refer to market gardening farms as farms where fresh fruits and vegetables are cultivated exclusively within their rotations (Chevalier, 2022; Dumont, 2017). Small- and medium-scale market gardening farms share common characteristics. They are farms with a cultivated area ranging from less than one to ten hectares, use a low level of mechanization, and grow a wide variety of fruits and vegetables (Dumont, 2017). They are also known for promoting more sustainable practices and using short food supply chains, often selling directly to consumers (Dumont, 2017; Morel, 2016; Navarrete et al., 2014; Chiffoleau, 2019; Chiffoleau et al., 2017). Aside from these positive aspects, studies show that market gardening is a highly physical, and poorly paid work practice, sometimes not reaching the minimum wage (Dumont, 2017; Morel, 2016). Although their viability remains questionable, small- and medium-scale market gardening aligns with most agroecological values and principles, such as reduced use of inputs and stronger connectivity between producers and consumers (Wezel et al., 2020).
According to the multi-level perspective model (Geels, 2002), small-and medium-scale market gardening can be seen as a “niche model” within the dominant vegetable sector. As a result, it has the potential to challenge the prevailing system and play a key role in transitioning the vegetable food sector toward greater sustainability (Dumont et al., 2020). In Wallonia, small- and medium-scale market gardeners only produce a small part of the region's total vegetable production. Wallonia's vegetable sector is a highly specialized system focusing primarily on peas, green beans and onions destined to be transformed, and exported (Riera et al., 2020; Dumont, 2017). As a result, the auto-consumption rate of vegetables in Wallonia is only 17% (Riera et al., 2020). Additionally, 5% of vegetables are purchased through short food supply chains (Collège des producteurs FWH, 2018). In spite of this, small- and medium-scale market gardeners are still able to exist by filling a gap supermarkets do not. It is the health, environmental, and economic concerns of consumers that push them to buy food from these short food supply chains, despite higher prices (Apaq-W, 2024).
Despite their ecological and social benefits, little is known about the economic performance of market gardening farms. Collecting reliable financial data is challenging, leading to biased conclusions. National statistical agencies primarily survey farms participating in the Common Agricultural Policy, a requirement that many small- and medium-scale market gardeners do not meet due to ideological opposition to subsidies, reluctance toward government oversight, or administrative burden (Riera et al., 2020). Additionally, the Farm Accounting Data Network (European Commission, 2025) is inadequate for studying small- and medium-scale farming due to sampling biases (Mari, 2020). Accounting practices further complicate economic analysis as many farmers optimize their financial records to reduce taxes, inflating costs by including personal expenses and underreporting cash revenue (Louah, 2020). Moreover, self-employed farmers often prioritize reinvesting in their business over personal financial gains, making traditional profit-based assessments less relevant (Dumont, 2017; Louah, 2020). Assessing the viability of small- and medium-scale market gardening requires robust economic data and practical, field-based indicators that accurately reflect the reality of the farm. Developing such tools is essential for navigating the complexities of viability and its challenges (Louah, 2020).
In this paper, viability of a farm is seen as a sub-concept of sustainability. In which case, sustainability is based on four distinct principles, but not exclusively independent: reproducibility (i.e., environmental sustainability), livability (i.e., social related aspects), transmissibility (i.e., intergenerational transfer) and viability (i.e., economical aspects; Landais, 1998). But viability has no universal definition. There are many different ways to define it, from opportunity cost techniques, to financial and productivity indicators (Loughrey et al., 2022; Spika et al., 2019). Many authors approach viability as having one requirement: revenue per worker must be superior to market salary, once operating costs and asset depreciation costs have been met. It is considered that a farm is only viable if it can pay all its actors with at least a minimum salary without endangering the farm itself on a financial level (Spika et al., 2019; Cochet, 2015; Mazoyer and Roudart, 2002; Landais, 1998). Other definitions of viability take unpaid workers into account by assigning them an average wage (Hennessy et al., 2008). However, this discards the fact that unpaid labor is not as efficient as other worker types according to the farmers. Others employ opportunity cost approaches to assess viability, mainly taking into account paid labor (Nurmet and Omel, 2020; O'Donoghue et al., 2016). Some definitions further include a requirement for a minimum 5% return on non-land assets to qualify a farm as viable (Hennessy et al., 2008; Frawley and Commins, 1996). Another related term is economic sustainability, which is similar to viability but emphasizes the farm's ability to withstand changing economic contexts (Latruffe et al., 2016; Spika et al., 2019). This nuance complements the concept of viability by acknowledging that farms which are not viable on their own can still achieve economic sustainability through off-farm income sources (Hennessy et al., 2008; Spika et al., 2019). Assessing viability requires an understanding of the socio-economic environment of the farm (Louah, 2020; Spika et al., 2019).
Based on the issues identified above, namely the central role of agroecological farms in food system transitions, the complexity of their viability, and the lack of contextualized data and analysis, this study aims to provide a set of indicators to evaluate viability of small and medium-scale market gardening farms, in a specific area. The results are based on data from 17 market gardeners in the “Coeur de Condroz” region. The dataset is not a sample as all small- and medium-scale market gardening farms on the territory have been surveyed. The indicators aim not only to evaluate the viability of market gardening farms in this region, but also to highlight factors that influence the viability of this type of farm. Therefore, the two main research questions of this paper are:
• What indicators can effectively evaluate the viability market gardening farms ?
• What factors influence the viability results provided by these indicators ?
This paper provides valuable insight to understand viability using quantitative indicators. In doing so, we seek to contribute to the ongoing research on building a more sustainable and resilient food system for the future by providing nuanced data and analysis on a specific agroecological system in a specific area.
Materials and methods
The Coeur de Condroz territory
Coeur de Condroz is a rural region in southern Belgium, covering ~625 km2 and comprising seven municipalities with a total population of 55,880 inhabitants (Flagothier and Van Overmeire, 2024). Vegetable production in the region accounts for only 1.9% of the cultivated area (~632 ha), compared to a national average of 3% (StatBel, 2024). Cœur de Condroz is a coherent territorial unit that offers key methodological advantages. This territory is characterized by shared policy frameworks, market conditions, and socio-economic dynamics, which provide a consistent context for analysis.
The term Coeur de Condroz refers both to a natural park and a food policy council (Parc naturel Cœur de Condroz, 2025). This council emerged from the merger of two local action groups, dedicated to strengthening the local economy. In collaboration with local stakeholders, their primary goal is to develop a more sustainable territorial food system that promotes local actors. This dynamic creates an opportunity for research to actively contribute to the process, providing valuable insights for decision-making while enriching academic literature.
Additionally, studying a well-defined and coherent territory helps mitigate certain sources of variability such as consumer behavior, meteorological conditions, and regional policies, subsidies and market conditions.
The surveying procedure
Within the Coeur de Condroz region, 17 market gardeners were surveyed. They were identified by integrating information from three sources: the two local action groups in the territory, the Belgian federal food safety agency (Agence Fédérale pour la Sécurité de la Chaine Alimentaire, AFSCA), and data collected from market gardeners' websites. Two criteria were used for selecting market gardeners. The first criterion was designed to ensure the inclusion of practitioners who grow fresh fruits and vegetables exclusively in their rotations. This involves market gardeners in small, medium and large areas (Dumont, 2017). The selection excluded field crop producers mostly engaged in major and specialized vegetable field crop production. The second criterion stipulated that market gardeners must be situated within the Cœur de Condroz area. However, two market gardeners, located close to the boundaries of the area, were included in the study. They were chosen through snowball sampling due to their interactions with other market gardeners or consumers in the region. Through a rigorous screening process and the use of multiple identification channels, it was estimated that all small- and medium-scale market gardeners in the Coeur de Condroz region were identified.
Data collection
The data was collected through the means of one semi-structured interview (Kaufmann, 2016; Magaldi and Berler, 2020) and relates to the year 2022. Every interview lasted around 2 h and was recorded to serve as basis for qualitative assessment. The questionary used to help conduct the interview is shown in Appendix A. The data was centralized into one database whose variables and units are listed in Appendix B. Along with data collected by the interview, seven market gardeners provided their income statement relative to the year 2022. These income statements were used to help build the database and to cross-validate data points.
The interviews aimed to collect economic and qualitative data about operating costs of the farm. The interview involved direct questions about the market gardeners' specific characteristics such as cultivated areas, types and quantities of vegetables grown, revenue, working hours, the type of workforce and other relevant information. Here, the vegetable type refers to the specific distinction each market gardener defines when they label their own products. It does not necessarily refer to the varieties or the species. The end goal of the data collection was to build and identify the relevant indicators of viability.
Indicators of viability
Five indicators of viability were developed for this study. They were selected based on data availability and designed to represent the diversity of market gardeners. The framework used to define viability with these indicators does not rely on opportunity cost or financial metrics but rather on productivity indicators and the farm's ability to provide a decent salary to all workers, including, to some extent, unpaid labor.
They are described as follows:
• Average land productivity = revenue (without buy-and-resell practices1)/cultivated area
• Average labor productivity = revenue/Full Time Equivalent2
• Gross added value = (revenue – operating costs)/number of workers
• Estimated profit = (revenue – imputed costs)
• Risk indicator = /cultivated area
The full-time equivalent in the labor productivity indicator was modified in order to better represent the reality of the field. Conventionally, workers with a volunteer or trainee are not granted a salary. However, in order to include their work input into the farm productivity assessment and financial decisions, in this study they were given a minimum income salary for the profit indicator. Furthermore, in considering that their productivity is lower than qualified personnel and the main farmers, their full-time equivalent (and indirectly the imputed salary as well) was multiplied by 0.5 in this study. This value was confirmed to be a good estimation by some market gardeners themselves.
The minimum salary was preferred to the median salary when designing the estimated profit indicator. Market gardeners allegedly pay themselves low salaries, that sometimes does not reach the minimum salary (Morel, 2016; Dumont, 2017). Within this study, the chosen salary value was 2,000 euros per month per full-time equivalent. It was based on the minimum salary chosen by the “Commission paritaire de l'agriculture CP 144” which fixes minimum salaries for workers in the agricultural sector of Wallonia (Commission paritaire pour l'Agriculture CP 144, 2022). The minimum salary in Belgium is barely sufficient to ensure basic quality living standards (Frederickx et al., 2025). However, this value remains a good threshold value since the market gardeners usually have other benefits when they are self-employed, as their personal costs are sometimes included in their businesses.
The operating costs consists of costs that were explicitly requested in the questionnaire. They include seeds, plants, fuels, electricity, land leasing, water, pesticides and fertilizers. Furthermore, additional costs for each farm were estimated based on their unique characteristics as well as financial documents that were provided by six market gardeners. These imputed costs gave all farms a maximum of financial constraints in order to evaluate what would be left to invest after all other costs have been accounted for. It is different to the profit before taxes because it includes salaries of 2,000 euros/full-time equivalent, even for volunteers, trainees and family members. Theses imputed costs also include fixed taxes, administrative expenses, replacement of small materials and working clothes.
The profit equilibrium factor is a proxy of the factor by how much farmers have to multiply their selling prices to achieve equilibrium in terms of profit. For example, market gardeners with a positive estimated profit will have a multiplier inferior to one.
It is calculated as follows :
The risk indicator aimed to give an idea of how much the market gardeners are exposed to a steep rise in certain prices. The shocks were estimated based on previous shocks in the market such as the invasion of Ukraine, the COVID-19 pandemic and their impact on prices. A shock does not consider a latent rise in prices over the courses of multiple years. The shock is the potential increase in the price and is therefore multiplied by the operating cost to calculate the risk indicator. Given the high variability and speculatory aspects of electricity prices, the related shock is estimated to be up to 100% (Belgian Energy Market, 2024; Entso-e, 2024). Fuel prices are more stable, and their associated shock is estimated to be 20% (StatBel, 2024). The national Belgian statistical institute offers indexes for agricultural input prices (StatBel, 2024). Price shock for pesticide cost is set at 20%, 50% for fertilizers due to their extra-European origin and 10% for seeds and plants (StatBel, 2024).
Besides the viability indicators, farmers were also asked to scale the viability of their farm on a scale of 1 to 7 according to their perception. This question served as a qualitative information source and helped to capture the advantages and disadvantages that the farmer attributes to his or her situation.
Finaly, a proximity indicator was made as a potential explanatory variable. The proxy was made using three parameters: density within 3 km radius, proximity to primary roadway access and proximity to supermarket. The parameters were normalized and then summed into one “proximity indicator”.
Data processing: mixed-methods validation approach
Descriptive and multivariate statistical analyses were performed using R software. Principal Component Analysis was used to discriminate farm categories and reduce dimensions of the viability indicators into independent variables. Principal component analysis is a dimensionality reduction technique. It transforms correlated variables into a smaller set of uncorrelated principal components, ranked by their contribution to total variance. Each principal component is a linear combination of the original variables.
A general linear model was applied to model the indicator and test plausible explanatory variables and hypotheses. The general linear model is a flexible framework used to model the relationship between a dependent variable and one or more independent variables. It assumes that the dependent variable is linearly related to the predictors, and it can be used for both continuous and categorical variables. All quantitative variables in the model were log-transformed to account for differences in scale and units. A small constant was added to prevent errors caused by log-transformation of zero values.
All interview recordings and handwritten notes were transcribed manually and then coded and analyzed through an inductive approach using QualCoder software (Brailas et al., 2023). Quotes are translated by the authors into English and selected to give key insight on market gardeners' perspective.
Results
Description of the farms
The farms surveyed had heterogeneous statuses (Table 1). Among the 17 farms, 14 operated as sole proprietorships, while the remaining three included a cooperative, a company, a farm incubated within a support program, and a farm managed as a sub-service of a public social action center. Eight market gardeners had complementary activities, including three that had other on-farm activities. Thirteen market gardeners followed organic farming practices. Market gardeners rely on a wide range of distribution channels and sell their products locally. On average, the two primary main distribution channels are on-farm sales and sales to local markets, respectively, accounting for 35 and 19% of the total revenue, and groceries stores contributing for 19% of the farms.
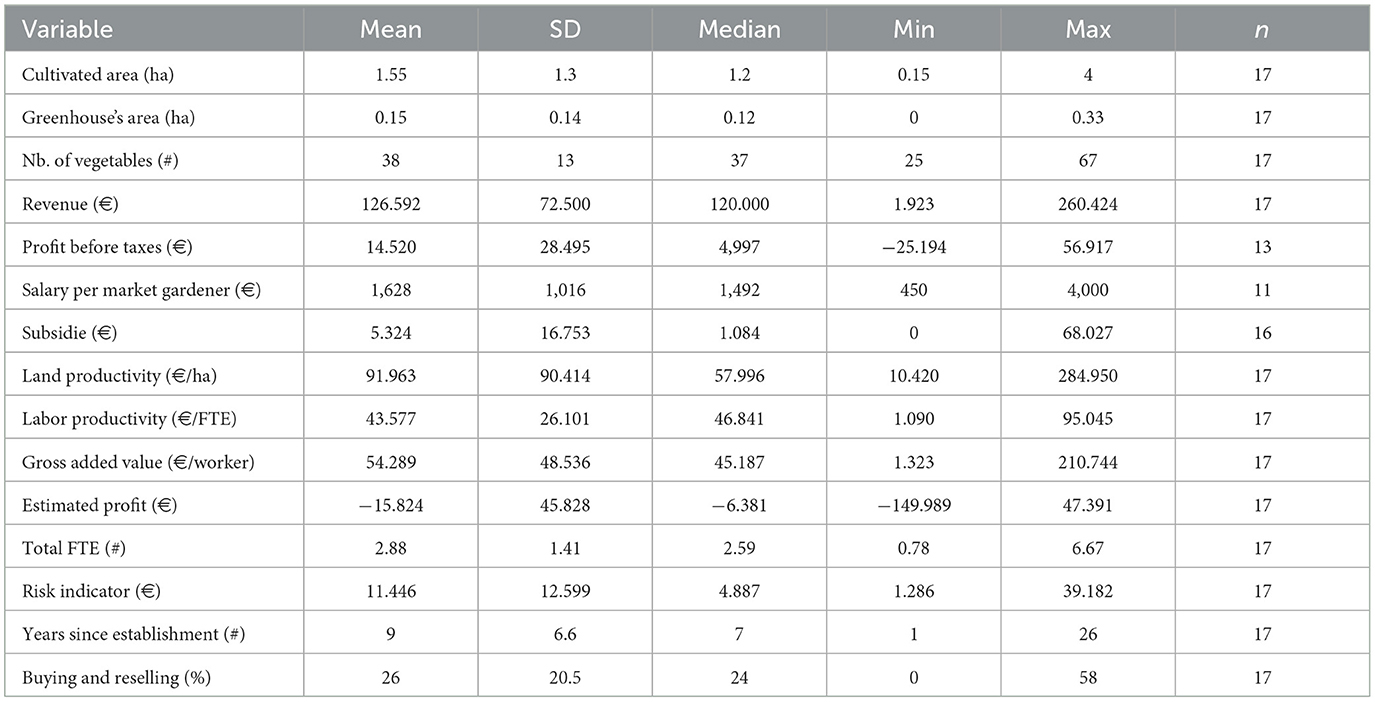
Table 1. Main characteristics of the farms surveyed.
Revenue varied significantly from one market gardener to another, primarily due to complementary activities that divided their time and, consequently, their earnings. Those in the lower revenue brackets often did not rely solely on market gardening to secure a salary. This underlines the importance of putting viability in relation to full-time equivalent or number of workers.
The salary per market gardener represents the amount they allocate to themselves for personal income and expenses, separate from the farm's operational costs.
Estimated profit was negative for 11 market gardeners, primarily because a minimum wage was assigned to each full-time equivalent. For example, a market gardener earning less than the minimum wage per hour may still generate a positive profit for their farm in practice, even if the estimated profit appears negative on paper. Interestingly, even under maximum cost constraints, six market gardeners were able to remain profitable.
Subsidies included both financial help from the common agricultural policy and other sources of funding as well, such as help with hiring, investing and local subsidies.
Finally, buying and reselling refers to the practice of purchasing products from external sources to enhance the diversity of items offered for sale. Ten market gardeners were observed to generate more than 20% of their revenue through buy-resale activities.
On average, plants represented the highest cost, although not all market gardeners purchased them for their crops (Table 2). Fuel followed as the second largest expense, used primarily for machinery and vehicles. Electricity costs were mainly driven by refrigeration and water pumps. Pesticide expenses include both organic and conventional products, with significantly higher costs for market gardeners using conventional methods compared to those following an organic model. Only one farm payed for water, while the others relied on other water sources on their property.
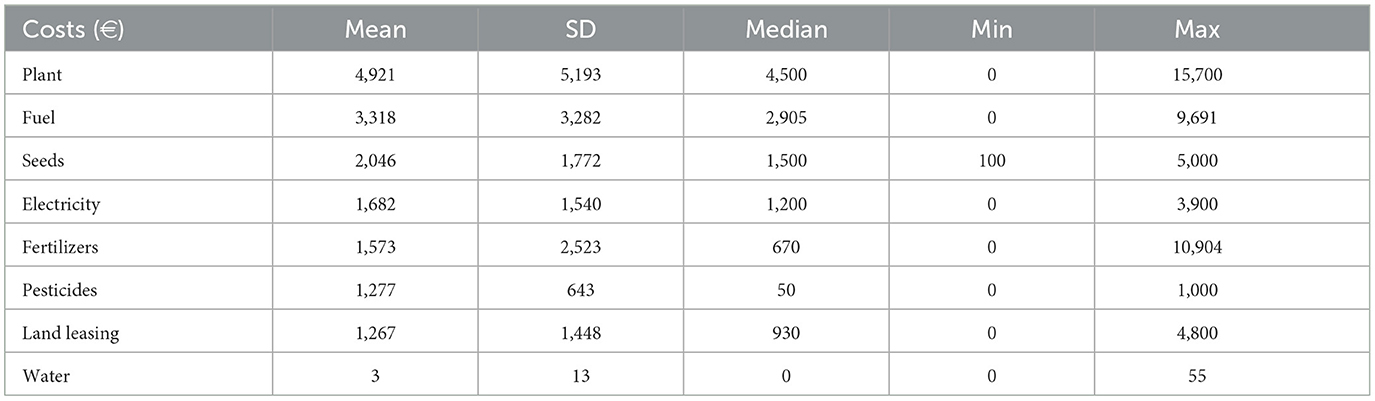
Table 2. Description of the operating costs for the 17 surveyed farms.
Assessment of the viability of the farms
Using the results of the five indicators, a principal component analysis was conducted. Two farms were excluded for clarity, as the year 2022 was not representative of their viability due to exceptional external factors.
Figure 1 displays a principal component analysis (PCA) biplot illustrating the relationships between five viability indicators (detailed in the Materials and Methods section). The first two dimensions explain 60.2 and 29.9% of the total variance, capturing the main structural differences between farms. The positioning of variables reflects their correlations, with positively associated indicators clustering together and negatively associated ones appearing in opposite directions. Additionally, the perception indicator, representing the farmer's subjective assessment of viability, is included as an illustrative variable and does not influence the calculation of the principal components' calculation.
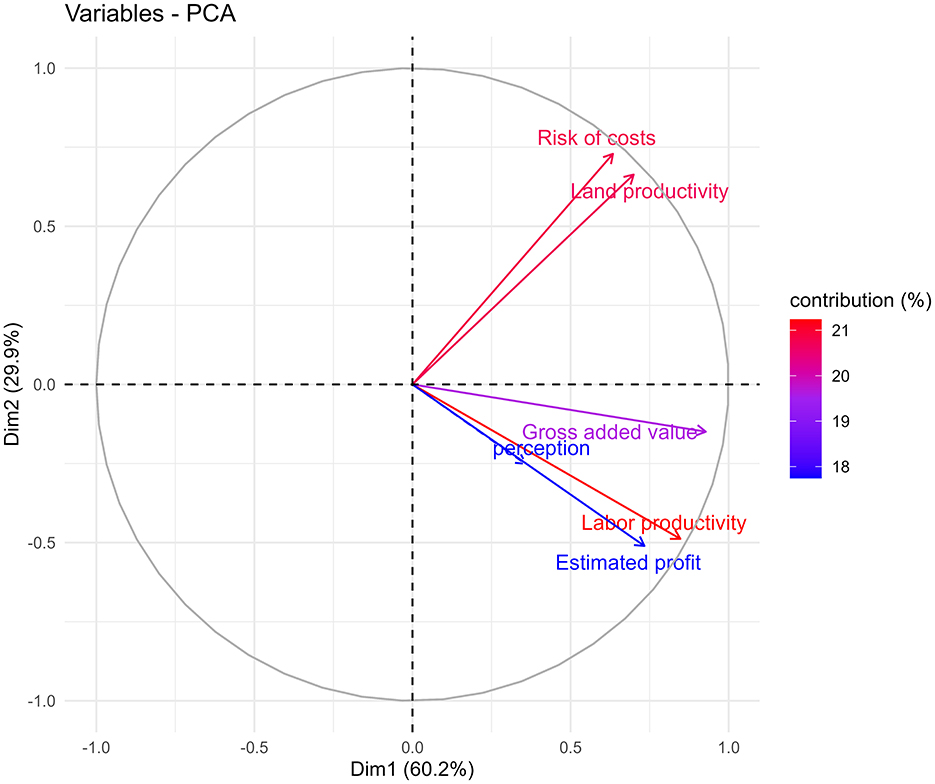
Figure 1. PCA biplot: contribution and representation of viability indicators on dimensions 1 and 2.
The first dimension is primarily driven by gross added value, which has the highest contribution at 28.61%, followed by labor productivity at 23.86%, estimated profit at 17.89%, and land productivity at 16.27%. The risk of costs contributes the least to this dimension, with a contribution of 13.37%. This dimension is positively driven by all indicators of viability. The second dimension is mainly influenced by the risk of costs, which make the highest contribution at 35.60%, followed by land productivity at 29.49%. Labor productivity and estimated profit contribute 15.95 and 17.46%, respectively, while gross added value has the lowest contribution at 1.50%. Labor productivity and estimated profit are closely positioned, indicating a strong correlation. Farms that achieved high profitability also tend to have high labor efficiency. Unlike other variables, land productivity and risk of costs are positively correlated along dimension 2, suggesting that farms with higher land productivity also experienced higher risk of cost. The illustrative variable is located separately from the main viability indicators, suggesting that it does not align strongly with either dimension.
Figure 2 shows the clustering of farms based on the five indicators of viability. Each point represents an individual farm, and the three distinct identified clusters are differentiated by color.
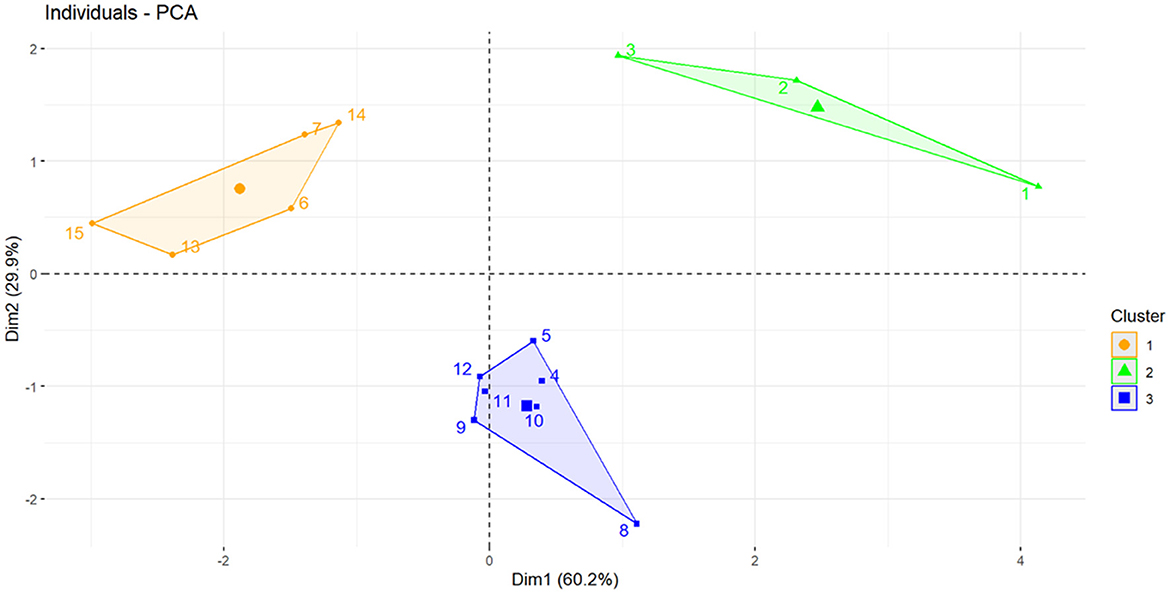
Figure 2. Clustering of individual farms into three groups based on PCA results, using viability indicators.
Farms from the first cluster, represented in orange, are located toward the left side of the first dimension, indicating lower viability. The widespread distribution of this cluster along the second dimension suggests a variability in cost risk and land productivity within this group. The second cluster, in green, is located at the far right of the first dimension. This suggests that these farms exhibited the highest viability performances. Their higher position in the second dimension indicates that they also experienced greater land productivity and higher variability of cost risk compared to the other clusters. The third cluster, in blue, is located further down in the second dimension, but remains also positive in the first one. Unlike the green cluster, farms in this cluster did not rely on high land productivity but maintain stable profitability with relatively low-cost risk. The low dispersion of this group along the dimensions suggests that the farms in this group shared similar economic characteristics. This clustering highlights different viability profiles among farms: group one was hardly viable, group two had good viability performances but was vulnerable to price shocks and group three had a lower land productivity but remained viable due to lower risks associated with the costs.
Figure 3 compares the relative viability of market gardeners using the five indicators of viability and the perception indicator. All indicators are standardized, with values expressed as deviations from the average (centered at 0) on a red-to-blue scale. This visualization highlights trends across indicators and illustrates how they contribute to distinguishing farms. Numbers 1 to 15 correspond to individual farms; these numbers match the ones from Figure 2 and are highlighted by the color of the cluster group.
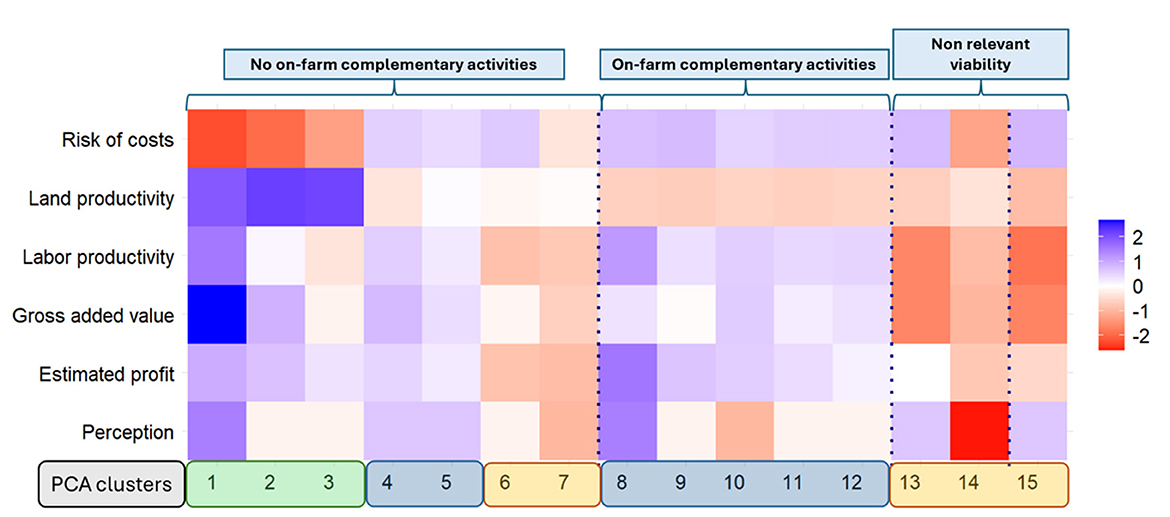
Figure 3. Heatmap of viability indicators by individual farms. Indicators are standardized and centered at zero. Colors associated with the PCA clusters relate to the colors of the clusters identified in the PCA presented in Figure 2.
Farm 1 to 7 consist of farmers who had not inherited or acquired an existing farm but have set up their own farm. They exclusively cultivated vegetables, adhered to organic farming practices, and used a greater amount of greenhouses surface than other groups. Additionally, they all engaged in buying and reselling activities. Farms 1 to 3 are part of the second PCA cluster. This means that they performed well in terms of viability but are vulnerable to price shocks. These three farms had high land productivity compared with the others. Farms 4 and 5 from the third PCA cluster had lower land productivity values but remained viable due to lower risks associated with their costs. These two farms had in common the fact that they use draft horses for field work. This can be a potential factor in diminishing the risk of cost indicator. One market gardener that used draft horses pointed out its benefits in terms of reducing fuel costs.
“Animal traction allows you to avoid dependence on fossil fuels. Sometimes, it can even be more efficient than the tractor. […]. It can also give you manure for the field. But you need meadows.” (Market gardener A)
The two lasts farms that do not have complementary activities, farms 6 and 7, belong to the first PCA cluster. This cluster represents the farms that have overall low indicators of viability, as shown by their relative values in Figure 3. Farms 8 to 12 include market gardeners who either inherited or purchased an existing farm and may not follow organic production methods. Their production systems are generally more mechanized and specialized. These farms had a larger cultivated area, fewer greenhouses' surfaces, and lesser reliance on buying and reselling. Furthermore, they engaged in additional agricultural activities such as field cropping or landscape gardening, which enable them to share equipment and reduce costs. They also had a low risk of costs and land productivity results compared to farms 1 to 5. All of them belong to the third PCA cluster.
Farm 13 to 15 belong to the first PCA cluster and share in common a reduced performance of the viability indicators. The poor viability of farms 13 and 14 is explained by the nature of their market gardening activity. Indeed, the market gardening activity of these farms is not particularly intended to be viable on its own. Market gardening activities can be integrated into broader farm diversification strategies or serve purposes beyond vegetable production, such as fostering employment. Farm 15 was on a very small-scale and ceased its activity in 2023, 3 years after its establishment. It was not intended to produce a salary out of the revenue of this farm as the farmer was employed part-time in another job.
The perception indicator shows disparities between real viability performance and the way market gardeners perceive their viability. Still, the two farms with the most estimated profit were also the ones with the highest perception score. On the other hand, farms 10, 13 or 15 have a perception score at the opposite of their viability indicators. To put this indicator into perspective with the other ones, we need to acknowledge that market gardeners perceive viability in different ways. Some of them made the distinction between the viability of their farm strictly speaking (i.e., viability stricto sensu), and some integrate some aspects of livability into it. In other terms, they did not make differences between their wellbeing and the viability of the farm. Some of them implicitly referred to economic sustainability as they integrated the fact that they are viable thanks to an external salary. For example, farm 14 had a negative perception of the viability of its farm, however, can afford to persist due to a monthly salary given for his or her on-farm job by external fundings. Farm 15 had a positive view of its viability, due to the salary from another job providing funds to the farm.
The estimated profit indicator gives an idea of the investment potential remaining after costs and salaries have been retrieved. As previously shown, the estimated profit is negative for eleven market gardeners. This indicator is better seen when put into perspective with the profit equilibrium factor. As a reminder, the profit equilibrium factor is a proxy of the factor by how much farmers have to multiply their selling prices to achieve equilibrium in terms of profit. For the first twelve farms, which are the ones for which estimated profit remains a relevant indicator, the average Profit Equilibrium Factor is 1.06, with a median of 1.01. Interestingly, eight farms fall within the [0.9–1.1] range, suggesting that their pricing strategies are close to achieving financial equilibrium. On average, it would take an additional 4,806 euros per farm per year of revenue to make them reach a null estimated profit. Considering factors such as cost, income, and consumer demand, these results indicate that the market gardeners have a good intuitive understanding of how to adjust their business to maintain financial stability. In addition, if we now consider all fifteen farms, it would take an average multiplier of 1.23 (i.e. an average of 24 624 euros) to make them reach an equilibrium in terms of estimated profit.
Factors influencing indicators
A general linear model was used to test variables onto viability indicators. Table 3 shows the results of the working models and tested variables. The estimated profit and risk indicator were not statistically significant and are therefore not present in Table 3.
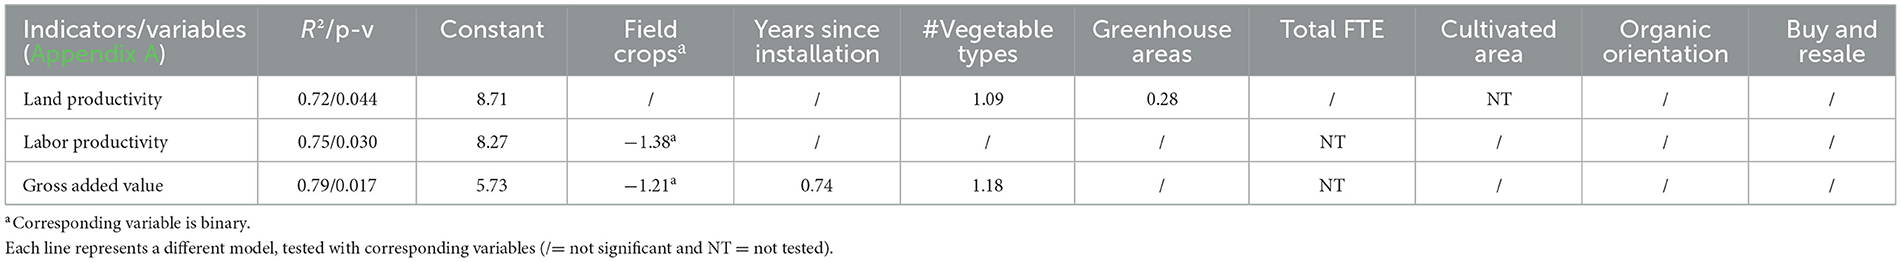
Table 3. Results from several general linear models, showing factors influencing the indicators.
Field crop producers are markets gardeners who also cultivate main crop types (e.g., cereals, potatoes, etc.) as another on-farm activity. This factor has a significant impact on gross added value and labor productivity, reducing them sharply. Years since installation have a significant positive impact on the gross added value but not on land productivity or labor productivity. The amount of cultivated vegetable types significantly impacts land productivity and gross added value. It contradicts what some market gardeners said during the interviews. Indeed, they pointed out that growing fewer types of vegetables was a strategy they would recommend in order to increase their viability, as it allowed them to concentrate solely on growing vegetables that are profitable for their farm. Area under greenhouse, as expected, increases the land productivity. However, it was not significant for the other variables. Interestingly, cultivated areas have no significant impact on any indicators.
The buying and reselling practice does not significantly affect the three indicators in the models, even though it has a significant and moderate positive correlation with the revenue (r = 0.45, p-value = 0.07). This contradicts what market gardeners said about buying and reselling practices. Some market gardeners claimed that this practice is essential to be viable, to meet consumer expectations in terms of the diversity of products sold.
“We need the buying-reselling to survive. And it is necessary to propose different products for the consumer” (Market gardener B)
Technical orientation (i.e., organic or conventional) has no impact on the indicators either, and no significant difference between the two orientations can be established.
Due to the high heterogeneity of the farms, modeling estimated profit, and the risk of costs indicator was not possible.
However, the risk of costs per hectare is highly correlated to the land productivity (r =0.86, p-value < 0.001). Risk of costs per hectare is driven mostly by the cost of electricity which is very volatile.
Unexpectedly, alternative general linear models show that the proximity indicator has no significant impact on any indicators of viability.
Discussion
Strength of the data collection method by direct interview
Through this study, direct interviews with farmers proved to be a valuable data collection method, despite being time-consuming. While many studies rely on the Farm Accountancy Data Network (European Commission, 2025), this database often excludes small-scale farms (Loughrey et al., 2022) and is not representative of the small-scale marketing sector. In light of this analysis, with both the quantity and quality of the data collected, the national statistical agency (StatBel) database on the farming sector does not appear to accurately represent the market gardening sector. Since small- and medium-scale market gardeners do not always ask for subsidies and fill out official documents, the sector is highly underrepresented in StatBel (Riera et al., 2020). It also lacks detailed information on specific farm costs, including contextual and historical data which are crucial for a comprehensive understanding of individual farms.
The interviews conducted within this study allowed researchers to avoid common pitfalls and gain a clear, integrative understanding of farm histories. They also helped to identify and exclude outliers experiencing atypical years, accurately assess the quality and status of each worker, and distinguish costs related to market gardening from those linked to other on- or off-farm activities. Moreover, qualitative insights into market gardeners' opinions and experiences provided valuable context, enriching the research and helping to interpret results. A sufficient level of trust was also established between farmers and interviewers, as data was collected over multiple interviews and as part of a broader participatory action research approach (Lenette, 2022; McIntyre, 2008). The interviews therefore strengthened data validity and contextual interpretation.
Can the indicators effectively evaluate the viability of market gardening farms?
In light of the data collection and interviews with farmers, it becomes evident that binary frameworks for assessing viability are insufficient to assess small and medium-scale market gardening farms. Ultimately, viability as a binary concept depends on the definition applied; a farm may be considered viable under one framework but not under another (Loughrey et al., 2022). When asked about their viability, market gardeners also had different definitions between them. Seven farmers saw viability through the lens of economic performance of the farm only, while seven of them made no distinction between their personal lives and their farm, integrating off-farm salary into what they call viability.
“The two are linked [farm viability and personal wellbeing], but thanks to the fact that I have an off-farm job, I have less pressure […]. Now, I have what I need to live and live well. So, in a sense, I do not need the money from the project (the farm). It is more that I am contributing to something in my village, you see. I can now, thanks to this side job, feel like it is viable.” (Market gardener C)
Furthermore, a farm deemed non-viable in research terms can still continue to operate. A farm may generate low or even negative profits yet persist, nonetheless. Unlike corporations, these farms are human endeavors shaped by values and social dimensions. For example, one market gardener chooses to persist in his or her work despite financial losses, often adjusting his or her lifestyle to make the farm sustainable.
“I learned how to live with 1000 € per month. […]. Because otherwise, you do not hold up three years. So, viable yes, but it is due to my lifestyle.” (Market gardener D)
The indicators effectively captured the diverse realities of farm viability. Land and labor productivity indicators offer complementary insights beyond revenue, helping to distinguish different farm categories in the Principal Component analysis. The results also indicate that while labor productivity is somewhat linked to the estimated profit, land productivity is not. Farms with low land productivity but higher levels of mechanization can still achieve strong labor productivity and profitability. Given the heterogeneity of the small- and medium-scale market gardening farms, multiple indicators are essential for a comprehensive assessment of viability. To ensure a fair comparison between farms using the indicators, market gardening activities were analyzed separately from other on-farm activities. However, this approach may overlook the sharing of materials between activities and the potential synergies they create. Farm diversification should be considered when studying viability, as many farms adopt this strategy to spread risks and stabilize income (Navarrete, 2009). Accordingly, the indicators of viability showed that farms with complementary activities related to farming have lower risk of costs, and more stable labor productivity than the other farms whose market gardening remains their only on-farm activity.
Accounting for unpaid labor in the profit indicator was both fair and necessary to ensure comparability between farms with and without volunteers and trainees. To mitigate the impact of these unpaid workers, their full-time equivalent was divided by two, because they are generally less qualified than farmers and regular employees. While the inclusion of unpaid labor in viability indicators is recommended by several authors, existing studies do not account for the lower productivity of unpaid workers compared to regular employees (Spika et al., 2019; O'Donoghue et al., 2016; Karlsson et al., 2023). This gap in the literature is partly due to the fact that most research on farm viability assumes unpaid labor consists solely of family members (Stock, 2016). However, this is not the case in market gardening, where volunteers and trainees represent a significant share of the total labor force, averaging 17% of the total full-time equivalents in our study. Dumont (2017) had similar results with 16% of volunteers' workforce for small-scale agroecological market gardeners and 35% for small-scale conventional market gardeners. Other farm scales and models had little to none volunteer workforce. This highlights the need for adjusted labor metrics to reflect the realities of workforce composition more accurately in the market gardening sector.
Estimated profit is a much better indicator than profit before taxes from financial statements. The latter is not a reliable viability indicator for several reasons. First, disparities in farm legal status within our sample affect the interpretation of profit before taxes. Self-employed farmers, for example, do not include their own salaries as costs and instead pay themselves directly from pre-tax profit, whereas farms operating as cooperatives or companies account for salaries as expenses before calculating profit. To address this issue, Dumont (2017) incorporated the farmer's salary into the calculation of profit before taxes. Additionally, farms often optimize their financial statements to minimize profit before taxes. This can be achieved by artificially increasing costs, for instance, accelerating depreciation schedules beyond the actual lifespan of equipment, paying for personal expenses such as private vehicle costs, or even underreporting cash income. As a result, profit before taxes does not necessarily provide a consistent basis for comparing farm profitability.
While estimated profit is not perfectly accurate, it offers a more comparable measure of farm profitability. Unlike accounting profit, it does not incorporate depreciation—either in terms of accountancy or the actual decline in assets' value over time. Depreciation is particularly complex to assess as some market gardeners report no depreciation costs, while others report amounts as high as €18,000. These variations stem from differences in farm infrastructures, investment strategies, and the fact that some equipment is received free of charge. Given the challenges in assessing the condition and fair value of farm assets, depreciation was excluded in this study. Despite this limitation, estimated profit provides valuable insight into the investment capacity of a farm and its ability to replace capital.
Indicators showed that market gardeners that belong to the second and third clusters of the PCA are viable (Figure 2). However, only seven of them have a positive estimated profit. Several factors may explain this outcome: the farmer may be paying themselves below minimum wage, rely on unpaid labor, lack of full insurance coverage, or omit certain tax payments. Additionally, some unreported cash income may not have been accounted for, as market gardeners did not disclose this information during the interviews.
One farm ceased its activity in 2023. This farm had very low indicators of viability in 2022. On the contrary, the farmer said that according to him or her, his or her farm was viable, and the perspective indicator was above average. The farm, although not viable, was technically economically sustainable due to an off-farm job. This highlights not only the ability of the indicators to effectively assess farm viability, but also the discrepancy between farmers' perceptions and their actual quantitative results. This gap likely stems from how the perception question was formulated—farmers may have interpreted “viability” in a broader sense, encompassing more than just the economic dimension. Future research should further explore the relationship between perceived and measured viability. A clear and explicit definition of viability communicated to stakeholders is essential to deepen the understanding and assessment of this concept.
What factors influence the viability results provided by these indicators?
Analysis showed that multiple factors have an impact on the viability of a farm. For instance, the area under greenhouses and the diversity of vegetables grown influence farm viability. These factors increase the length of the season and allow the farmers to sell a greater diversity of fresh products over longer periods of the year. In addition, crop diversity can play a large role in disease regulation by enabling intra- and inter-annual crop rotation (Mireille et al., 2012). However, small- and medium-scale farms do not always implement efficient crop rotation due to their limited cultivated areas, especially under greenhouses (Navarrete et al., 2014). Yet, with high crop diversity, the risk in terms of pests and diseases for crops remains effectively low as these diversified systems enhance biodiversity and natural pest regulation (Navarrete, 2009). This helps to considerably reduce the costs of pesticides for market gardeners, thereby improving their viability.
Years since installation is a significant factor in the gross added value. Morel (2016) showcased that stage of development played a significant role in labor productivity, lowering it because of the early investment in terms of materials and land that have to be made. In addition, Drottberger et al. (2021) emphasis the fact that newly established market gardeners lack practical skills related to vegetable cultivation and financial management, which can play a role on viability. This is consistent with the idea that most businesses that cease their activities, do so within a few years after their creation. Furthermore, it means that with time, farms are able to build and capitalize on materials, infrastructure and land, in turn increasing their viability.
Although cultivated area and revenue are slightly correlated (r = 0.44, p = 0.06), cultivated area did not appear as a significant factor influencing the viability indicators. One explanation is that, in our sample, one small farm with < 0.3 hectares under cultivation and two full-time equivalents was able to persist, provided that an important percentage of sales came from buying and reselling activities. Given this threshold of 0.3 hectares, most market gardeners in our study are not constrained by land availability, as their surface requirements remain above this minimum.
Proximity to main roads axis and consumers did not influence our viability indicators. One possible reason is that market gardeners can take the proximity constraint into account in their choice of distribution channels. However, conclusions must be approached carefully because the territory is quite homogenous in terms of population density and road axis. With no market gardener's farm being further than 3 km away from a main road axis.
Study limitations and suggestions for future research
Studying market gardeners on a regional scale permitted to avoid some sources of heterogeneity such as local policies or consumer behavior. However, it also partially limits the results to the Coeur de Condroz region itself. To strengthen the results and conclusions of this study, the same methodology has to be applied to small- and medium scale market gardeners in other regions to allow cross-regional comparative studies. Furthermore, longitudinal studies could further validate the findings over time.
The significance of the results with a population as small as 17 farms is a sign that the methodology developed in this study allows for an effective data collection that represents the realities of the farms surveyed. The authors recommend that future research on similar farm profiles account for unpaid labor using a 0.5 correction factor, or adjust this value based on validation with the farmers themselves. The risk indicator has proven to be useful to distinguish farm profiles. It was built to fit the reality of the price volatility for Belgium in 2022. It can be adapted to better fit the needs of future research, depending on the context (i.e., another country). The three farm profiles identified represent a valuable structure for navigating the nuances of small- and medium scale market gardening farms. In this study, they are based on comparative results rather than actual, fixed, standardized values. Future research could focus on developing criteria for distinguishing agroecological farm profile based on variables such as; mechanization level, farm status, farm history and complementary activities.
It would also be valuable to investigate the relationship between perceived and measured viability, as discrepancies may result from varying interpretations of the concept. Providing stakeholders with a clear and explicit definition of viability is in turn essential to strengthen both the understanding and evaluation of this notion.
Conclusion
This study assessed the viability of small- and medium-scale market gardening farms in Wallonia through semi-structured interviews. Five indicators were developed to evaluate the viability of 17 market gardeners in the Cœur de Condroz region. The results revealed significant heterogeneity among farms, with some achieving viability and others relying on off-farm income, outside investments, and unpaid labor.
Principal component analysis identified three distinct farm profiles: (1) highly profitable farms with intensive land use but increased cost risks, (2) farms with lower risk associated to the costs and a high labor productivity and viability, and (3) farms with alternative structures resulting in low viability. This segmentation underscores the diversity of strategies within the sector, showing that viability is not solely linked to financial performance but also to the farm strategy.
Generalized Linear Models revealed key factors influencing viability. Greenhouse surface significantly enhanced land productivity, while crop diversity boosted both gross added value and land productivity. Additionally, financial stability was displayed to improve with farm age. In contrast, technical orientation (i.e., organic or conventional) had no apparent impact on viability, nor did location. Farms incorporating field crops or complementary activities benefited from lower costs and reduced financial risks. However, their per-hectare productivity remained below that of specialized market gardening farms.
A key finding of this study is the discrepancy between the viability of a farm based on viability indicators compared to the farmer's perception of viability. While market gardeners generally earn low incomes and often do not pay themselves a full salary, this does not necessarily mean that they see the farm as being non-viable. Some farmers are willing to accept modest earnings in favor of maintaining their lifestyle, values, and autonomy. This confirms that viability cannot be understood through a binary framework where farms either survive or disappear based on financial thresholds. The reality is more nuanced, where some market gardeners persist despite financial difficulties, adjusting their expectations and their living standards rather than abandoning their activity. While others consider off-farm work as a way to sustain their farms, integrating external income into their overall economic strategy.
These findings call for a reconsideration of how small- and medium-scale market gardening is supported at the policy level. The results show that small- and medium-scale market gardening farms can be viable. Many of these farms respect the principles of agroecology and are relevant alternatives to moving toward a more sustainable food system. Solutions to help increase the viability of such farms include facilitating access to land, improving investment opportunities, and strengthening institutional recognition. Moreover, fostering territorial food networks, enhancing technical support, and adapting training programs to the realities of small- and medium-scale farming could significantly contribute to strengthening the sector.
This study provides valuable data on an often-neglected sector and contributes to a deeper understanding of the challenges faced by small- and medium-scale market gardeners. It demonstrates that various levers exist to improve farm viability. Furthermore, it emphasizes that viability is more than a question of financial sustainability alone. Here, viability emerges as a balance between economic performance, quality of life for farmers, and the broader social recognition of their work.
Ultimately, small- and medium-scale market gardening could play a crucial role in the transition to more sustainable and resilient food systems. Its potential impacts in terms of employment, environmental benefits, and the structuring of local food networks deserve greater attention from policymakers. Strengthening the conditions for its viability is not just an agricultural issue but a societal one, as it directly relates to food sovereignty, rural development, and ecological transition.
Data availability statement
The raw data supporting the conclusions of this article will be made available by the authors, without undue reservation.
Ethics statement
Ethical approval was not required for the studies involving humans because the data collected and interviews were part of a participatory action research process, and informed consent was obtained during the first round of interviews. Although this initial set of interviews is not presented in the current paper, the project's purpose, the confidentiality of the discussions, and the intended use of the data were clearly explained and agreed upon in writing. Since the nature of the data collected remained the same, participants were not asked to complete a new form specific to the interviews presented here. Furthermore, their anonymity was guaranteed to ensure that no individual farm could be identified in the study. The study was conducted in accordance with local legislation and institutional requirements. The participants provided their written informed consent to participate in this study.
Author contributions
BH: Data curation, Methodology, Writing – original draft, Conceptualization, Visualization, Investigation, Writing – review & editing, Software, Formal analysis. FG: Supervision, Funding acquisition, Data curation, Methodology, Resources, Writing – review & editing, Conceptualization, Validation. NB: Methodology, Conceptualization, Supervision, Validation, Investigation, Writing – review & editing, Data curation, Funding acquisition, Formal analysis, Project administration, Visualization, Resources, Software.
Funding
The author(s) declare that financial support was received for the research and/or publication of this article. This research was funded by the Fondation Baillet Latour. The funder had no role in the study design, data collection and analysis, decision to publish, or preparation of the manuscript.
Acknowledgments
The authors warmly thank Monica Rothwell for her generous help and support in the preparation of this manuscript.
Conflict of interest
The authors declare that the research was conducted in the absence of any commercial or financial relationships that could be construed as a potential conflict of interest.
Correction note
A correction has been made to this article. Details can be found at: 10.3389/fsufs.2025.1681473.
Generative AI statement
The author(s) declare that Gen AI was used in the creation of this manuscript. In the preparation of this manuscript, an AI-based tool (ChatGPT) was utilized for language refinement, including rewording and improving the clarity of certain phrases. The AI did not contribute to the generation of scientific content, data analysis, or the interpretation of results. The author(s) take full responsibility for the accuracy, originality, and integrity of the manuscript.
Publisher's note
All claims expressed in this article are solely those of the authors and do not necessarily represent those of their affiliated organizations, or those of the publisher, the editors and the reviewers. Any product that may be evaluated in this article, or claim that may be made by its manufacturer, is not guaranteed or endorsed by the publisher.
Supplementary material
The Supplementary Material for this article can be found online at: https://www.frontiersin.org/articles/10.3389/fsufs.2025.1608860/full#supplementary-material
Footnotes
1. ^Refers to a practice where the farmer sells products, he did not produce himself/herself.
2. ^38 h workweek.
References
Altieri, M. A., Farrell, J. G., Hecht, S. B., Liebman, M., Magdoff, F., Murphy, B., et al. (2018). Agroecology: The Science of Sustainable Agriculture, 2nd Édn. Boca Raton, FL: CRC Press.
Apaq-W. (2024). Baromètre de la consommation de fruits et légumes | l'Apaq-W.Available online at: https://www.apaqw.be/fr/node/11646 (Accessed July 16, 2025).
Belgian Energy Market (2024). Belgian Energy Prices. Available online at: https://www.belgianenergymarket.be/electricity_data/endex_data (Accessed November 1, 2024).
Béné, C., Oosterveer, P., Lamotte, L., Brouwer, I. D., de Haan, S., Prager, S. D., et al. (2019a). When food systems meet sustainability – current narratives and implications for actions. World Dev. 113, 116–130. doi: 10.1016/j.worlddev.2018.08.011
Béné, C., Prager, S. D., Achicanoy, H. A. E., Toro, P. A., Lamotte, L., Bonilla, C., et al. (2019b). Global map and indicators of food system sustainability. Sci Data 6:279. doi: 10.1038/s41597-019-0301-5
Brailas, A., Tragou, E., and Papachristopoulos, K. (2023). Introduction to qualitative data analysis and coding with QualCoder. Am. J. Qualitative Res. 7, 19–31. doi: 10.29333/ajqr/13230
Chevalier, C. (2022). Exploring Intercropping in Market Gardening. UCL - Université Catholique de Louvain. Available online at: https://dial.uclouvain.be/pr/boreal/object/boreal:263448 (Accessed November 1, 2024).
Chiffoleau, Y. (2019). Les circuits courts alimentaires: Entre marché et innovation sociale. Erès. 2019:174. doi: 10.3917/eres.chiff.2019.01
Chiffoleau, Y., Akermann, G., and Canard, A. (2017). Les circuits courts alimentaires, un levier pour une consommation plus durable? Le cas d'un marché de plein vent. Terrains Travaux 31, 157–177. doi: 10.3917/tt.031.0157
Cochet, H. (2015). Controverses sur l'efficacité économique des agricultures familiales : indicateurs pour une comparaison rigoureuse avec d'autres agricultures. Revue Tiers Monde 221, 9–25. doi: 10.3917/rtm.221.0009
Collège des producteurs and FWH (2018). Horticulture Comestible—Plan de développement stratégique 2018 – 2028. Filagri. Available online at: http://filagri.be/horticulture-comestible/le-secteur~horticulture-comestible/plan-strategique-horticulture-comestible/ (Accessed November 1, 2024).
Commission paritaire pour l'Agriculture CP 144 (2022). Commission paritaire pour l'Agriculture CP 144. Available online at: https://public-search.werk.belgie.be/website-download-service/joint-work-convention/144/144-2022-002661.pdf (Accessed November 1, 2024).
De Schutter, O. (2017). The political economy of food systems reform. Eur. Rev. Agric. Econ. 44, 705–731. doi: 10.1093/erae/jbx009
Drottberger, A., Melin, M., and Lundgren, L. (2021). Alternative food networks in food system transition—values, motivation, and capacity building among Young Swedish Market Gardeners. Sustainability 13:4502. doi: 10.3390/su13084502
Dumont, A. (2017). Analyse systémique des conditions de travail et d'emploi dans la production de légumes pour le marché du frais en Région wallonne (Belgique), dans une perspective de transition agroécologique. UCL - Université Catholique de Louvain. Available online at: https://dial.uclouvain.be/pr/boreal/object/boreal:192704 (Accessed November 1, 2024).
Dumont, A. M., Gasselin, P., and Baret, P. V. (2020). Transitions in agriculture: Three frameworks highlighting coexistence between a new agroecological configuration and an old, organic and conventional configuration of vegetable production in Wallonia (Belgium). Geoforum 108, 98–109. doi: 10.1016/j.geoforum.2019.11.018
Entso-e (2024). Entsoe—European Transparency Platform Dashboard. Available online at: https://transparency.entsoe.eu/dashboard/show (Accessed November 1, 2024).
European Commission (2025). Farm Accountancy Data Network (FADN) – Public Database. Available online at: https://ec.europa.eu/agriculture/rica/ (Accessed November 1, 2024).
FAO (2023). La Situation mondiale de l'alimentation et de l'agriculture 2023. Pour une transformation des systèmes agroalimentaires: connaître le coût véritable des aliments. Rome.
Flagothier, J., and Van Overmeire, K. (2024). La population par commune wallonne et le nombre de mandataires communaux. Union des Villes et Communes de Wallonie. Available online at: https://www.uvcw.be/finances/etudes/art-1872 (Accessed November 1, 2024).
Frawley, J. P., and Commins, P. (1996). The Changing Structure of Irish Farming: Trends and Prospects. Carlow: Teagasc.
Frederickx, M., Delanghe, T., Penne, T., and Storms, B. (2025). Peut-on vivre décemment avec un revenu minimum en Belgique? Les budgets de référence comme pierre de touche. Revue belge de sécurité sociale, 66, 29–77.
Geels, F. W. (2002). Technological transitions as evolutionary reconfiguration processes: a multi-level perspective and a case-study. Res. Policy 31, 1257–1274. doi: 10.1016/S0048-7333(02)00062-8
Hennessy, T., Shresthra, S., and Farrell, M. (2008). Quantifying the viability of farming in Ireland: can decoupling address the regional imbalances? Irish Geogr. 41, 29–47. doi: 10.1080/00750770801909342
IPBES-Food (2016). From Uniformity to Diversity: A Paradigm Shift From Industrial Agriculture to Diversified Agroecological Systems. International Panel of Experts on Sustainable Food systems. Available online at: http://www.ipes-food.org/ (Accessed November 1, 2024).
IPBES-Food IFOAM Agroecology Europe, FiBL Europe, and Regeneration International. (2021). A Unifying Framework for Food Systems Transformation. A Call for Governments, Private Companies and Civil Society to Adopt 13 Key Principles. Brussels.
Karlsson, J. O., Robling, H., Cederberg, C., Spörndly, R., Lindberg, M., Martiin, C., et al. (2023). What can we learn from the past? Tracking sustainability indicators for the Swedish dairy sector over 30 years. Agric. Syst. 212:103779. doi: 10.1016/j.agsy.2023.103779
Kaufmann, J.-C. (2016). L'entretien compréhensif: Vol. 4e éd. Armand Colin; Cairn.info. Available online at: https://www.cairn.info/l-entretien-comprehensif−9782200613976.htm (Accessed November 1, 2024).
Landais, E. (1998). Agriculture durable: les fondements d'un nouveau contrat social? Le Courrier de l'environnement de l'INRA 33, 5–22 hal-01204654.
Latruffe, L., Diazabakana, A., Bockstaller, C., Desjeux, Y., Finn, J., Kelly, E., et al. (2016). Measurement of sustainability in agriculture: a review of indicators. Stud. Agric. Econ. 118, 123–130. doi: 10.7896/j.1624
Lenette, C. (2022). Participatory Action Research?: Ethics and Decolonization. Oxford University Press. doi: 10.1093/oso/9780197512456.001.0001
Louah, L. (2020). The Nature of Farming: Peasantness and Entrepreneurship Revisited Through the Lens of diverging Survival Strategies of Farms Within the Same Micro-territory (Doctoral thesis). Université libre de Bruxelles, Wallonia, Belgium. Available online at: https://researchportal.unamur.be/en/activities/phd-thesis-doctor-of-science-the-nature-of-farming-peasantness-an (Accessed November 1, 2024).
Loughrey, J., O'Donoghue, C., and Conneely, R. (2022). Alternative measures of family farm viability–incorporating gap measures. J. Rural Stud. 89, 257–274. doi: 10.1016/j.jrurstud.2021.11.022
Magaldi, D., and Berler, M. (2020). “Semi-structured interviews,” in Encyclopedia of Personality and Individual Differences, eds. V. Zeigler-Hill, and T. K. Shackelford (Cham: Springer International Publishing), 4825-4830.
Mari, F. (2020). The Representativeness of the Farm Accountancy Data Network (FADN): Some Suggestions for Its Improvement. Eurostat Statistical Working Papers. Luxembourg: Publications Office of European Union.
Mazoyer, M., and Roudart, L. (2002). Histoire des agricultures du monde: Du néolithique à la crise contemporaine (Nouv. éd.). Paris: Éd. du Seuil.
Mireille, N., Lucie, D., Claire, L., and Marguerie, M. M. (2012). Species Diversification in Market-Garden Farms and Consequences on Crop Management, Labour Organization and Marketing at Farm and Territorial Scales. 10. European IFSA Symposium: Producing and reproducing farmingsystems. New modes of organisation for sustainable food systems of tomorrow, Aarhus University[Aarhus]. Aarhus, DNK., Jul 2012, Aarhus, Denmark. 10 p. hal-01000656.
Morel, K. (2016). Viabilité des microfermes maraîchères biologiques. Une étude inductive combinant méthodes qualitatives et modélisation (Ph.d. thesis). Université Paris Saclay (COmUE). Available online at: https://hal.archives-ouvertes.fr/tel-02801554 (Accessed November 1, 2024).
Navarrete, M. (2009). How do farming systems cope with marketing channel requirements in organic horticulture? The case of market-gardening in southeastern France. J. Sustain. Agric. 33, 552–565. doi: 10.1080/10440040902997785
Navarrete, M., Dupre, L., and Lamine, C. (2014). Crop management, labour organization, and marketing: three key issues for improving sustainability in organic vegetable farming. Int. J. Agric. Sustainab. 13, 257–274. doi: 10.1080/14735903.2014.959341
Nurmet, M., and Omel, R. (2020). Economic viability by farm size of Estonian family farms. Probl. Agric. Econ. 1, 14–28. doi: 10.30858/zer/118265
O'Donoghue, C., Devisme, S., Ryan, M., Conneely, R., Gillespie, P., and Vrolijk, H. (2016). Farm economic sustainability in the European Union: a pilot study. Stud. Agric. Econ. 118, 47–54. doi: 10.7896/j.1631
Parc naturel Cœur de Condroz (2025). Available online at: https://coeurdecondroz.be/ (Accessed November 1, 2024).
Riera, A., Antier, C., and Baret, P. (2020). The Vegetable Sector in the Walloon Region : Current Situation and Scenarios Towards 2050. Sytra. Available online at: https://sytra.be/publication/vegetable-sector-wallonia/ (Accessed November 1, 2024).
Spika, J., Bockstaller, C., and Delmotte, S. (2019). Approaches to estimating farm-level economic viability and sustainability in agriculture: a literature review. Agric. Econ. 65, 269–278. doi: 10.17221/269/2018-AGRICECON
StatBel (2024). Tarif officiel moyen des produits pétroliers en euros. Available online at: https://bestat.statbel.fgov.be/bestat/crosstable.xhtmiew=74d181b1-7074-4c9f-9a71-85303980d41f (Accessed November 1, 2024).
Stock, G. (2016). The State of Family Farming in Europe. Luxembourg: Publications Office of European Union.
Wezel, A., Bellon, S., Doré, T., Francis, C., Vallod, D., and David, C. (2009). Agroecology as a science, a movement and a practice. A review. Agron. Sustain. Dev. 29, 503–515. doi: 10.1051/agro/2009004
Keywords: agroecology, market gardening, local food system, farm viability, viability indicators
Citation: Heine B, Gaspart F and Biot N (2025) Developing indicators to assess the viability of small- and medium-scale farms: a case study of market gardening farms at the regional scale. Front. Sustain. Food Syst. 9:1608860. doi: 10.3389/fsufs.2025.1608860
Received: 09 April 2025; Accepted: 07 July 2025;
Published: 05 August 2025; Corrected: 28 November 2025.
Edited by:
Tamara Gajić, Serbian Academy of Sciences and Arts, SerbiaReviewed by:
SneŽana KneŽević, Academy of Applied Studies Polytechnic, SerbiaDragan Vukolic, University for Business Studies, Bosnia and Herzegovina
Copyright © 2025 Heine, Gaspart and Biot. This is an open-access article distributed under the terms of the Creative Commons Attribution License (CC BY). The use, distribution or reproduction in other forums is permitted, provided the original author(s) and the copyright owner(s) are credited and that the original publication in this journal is cited, in accordance with accepted academic practice. No use, distribution or reproduction is permitted which does not comply with these terms.
*Correspondence: Nicolas Biot, bmljb2xhcy5iaW90QHVjbG91dmFpbi5iZQ==