 Catherine Brinkley
 John Ulimwengu
 Subhashni Raj
- 1Department of Human Ecology, University of California, Davis, Davis, CA, United States
- 2International Food Policy Research Institute, Washington, DC, United States
- 3Department of Urban and Regional Planning, University of Hawaii at Manoa, Honolulu, HI, United States
Introduction: This study provides a novel, system-wide framework that integrates food and economic systems using networked input–output.
Methods: We demonstrate this framework in analyzing food system resilience to real and simulated sector-level shocks, yielding insights into how structural vulnerabilities within the economy can compromise the food system and vice versa. The nested and networked approach of considering the food system as embedded within the overall economic system, enables predictions within and across both systems as they relate to one another. We focus on recovery and resiliency after a shock by evaluating the U.S. food and economic system in 2007 and 2012, a period covering a major financial downturn.
Results and Discussion: We find that between 2007 and 2012, the majority (82.2%) of food systems sectors increased in centrality compared to other sectors within the economy, showing how the food system became more integral in the overall economic system during and after the financial crisis. Further, we demonstrate that simulated removal of sectors with the highest centrality in the economic system leads to a decrease in overall network density, clustering, degree, and weighted degree—highlighting vulnerabilities within each economic sector with the potential to propagate system-wide. We draw timely attention to the critical role of scientific research as an important sector within the economy that requires relatively little funding input but amplifies economic outputs across the food system and other economic sectors. We conclude by warning about the bias produced in analyzing food system dynamics outside of overall economic systems and urge future research to consider a nested food-economic model.
Introduction
Why focus on food system resilience?
As election debates continuously highlight, the price of groceries remains a salient motivator at the polls. Urban riots reveal how political combustible any food insecure populations can be, and political volatility in one city can lead to further destabilization and food insecurity well beyond. One of the key analytical tools for safeguarding food and economic security is to predict areas of vulnerability and their networked, interdependence with the greater universe of allied economic sectors. Predictions of various failure scenarios provide insights into overall resilience and recovery from shocks within particular sectors.
Scholars and policymakers are increasingly recognizing the need to model how shocks propagate across economic and food systems. For its part, the food system encompasses the processes that require inputs to generate outputs involved in feeding a population, including growing, harvesting, processing, packaging, transporting, marketing, consuming, and disposing of food (Hawkes, 2009; Sobal et al., 1998; Ericksen, 2008; Tu et al., 2019). Each aspect of the food system is subject to climate, social, and economic disruption through pricing, policies, or localized disaster. For example, localized failure can result from crop disease (as in the potato famine of 1845) or closure of central processing plants (as in the closure of slaughter houses during COVID-19). Changes induced by various economic, political, climate, markets, and infrastructural factors can also disrupt food supply at multiple levels, from growing food to distributing supplies (Davis et al., 2021; Watson et al., 2017). Even when components of the food system are resilient in the face of different shocks and crises, expected outcomes such as food and nutrition security are not always guaranteed for all (Piters et al., 2021)—a finding we explain is due to the food system being nested within the overall economic system where some communities cannot afford to access the food that is produced and delivered.
Given the increasing occurrence of political, socio-economic, and environmental instability with climate change and extreme weather events (Cottrell et al., 2019), it is critical to understand how food systems react to shocks and stressors, as a food-insecure population can rapidly cause disruption in many other sectors. We define food system resilience as the capacity to withstand shocks or rapidly recover in the face of stressors.
This research advances the field by demonstrating that food system resilience requires conceptualizing the food system as an integral part of the broader economic, political, and environmental systems. The intensification of modern scientific and engineering methods in farming, processing, and distribution technologies further reinforces the connection between the food system and the rest of the economic system (Matson et al., 1997). Yet, a review by Tendall et al. (2015) shows that most studies on food system resilience lack a systems approach, focusing instead on selected segments such as agricultural production or specific stages in the food value chain (Van Apeldoorn et al., 2011; Soane et al., 2012) or particular components of resilience like adaptability and transformability (Walker et al., 2009), cascading effects in regime shifts (Kinzig et al., 2006), or specific outcomes and contexts, e.g., food security in emergency situations (Pingali et al., 2005). Given that resilience varies across locations, time, and scales, vulnerability to shocks should be correspondingly analyzed over time and across food system components (Tendall et al., 2015; Konar et al., 2018).
Measuring the resilience of food systems through simulated shocks is a critical approach to understanding the ability to withstand and recover from various disruptions. By subjecting food systems to simulated shocks, researchers can assess vulnerabilities and identify strategies to enhance resilience. Several studies have employed this methodology, modeling the food system as a network (Karakoc and Konar, 2021; Lin et al., 2019; Gephart and Pace, 2015; Brinkley et al., 2025). Building on such network studies, Burkholz and Schweitzer (2019) explore the impacts of cascading shocks on global crop trade networks from 176 countries across 21 years. Their findings highlight the role of higher order trade interactions, and they note that “networks reveal hidden dependencies between countries” that are likely the result of economic and trade agreements beyond crops (Burkholz and Schweitzer, 2019, p. 1). Similarly, in modeling commodity price shocks related to the Ukraine-Russia war, Laber et al. (2023) demonstrate how a localized shock to agricultural production in one country can create food shortages well beyond immediate trade partners. While such simulated shocks help assess losses from weather events like drought to identify critical vulnerabilities, authors note that networked food supply models often treat each commodity in isolation of the broader food system, neglecting how products may be further processed or used. Along these lines, studies do not always nest the food system within the broader economic system and therefore miss the buffering and propagating impacts of economic sectors that feed into the food system.
Similarly, recent studies leverage input–output (IO) frameworks to quantify food-system resilience under shocks. For example, Revoredo-Giha and Dogbe (2023) applied a dynamic inoperability IO model (DIIM) to Scotland’s economy, simulating a ~ 60% demand collapse in hospitality and tracking recovery paths. They computed sectoral “resilience coefficients” and inoperability trajectories, finding that preserved meats and agriculture recovered fastest (high coefficients) while soft drinks and other food processors recovered slowest (coefficients ≈0.1). This dynamic IO approach explicitly models how an initial shock cascades through intermediate demand, incorporates adaptive strategies (e.g., telework or inventory buffers as higher resilience parameters), and yields recovery times and cumulative losses for each sector. Huang et al. (2025) synthesize 26 empirical studies to assess how global food supply systems (FSS) respond to sudden shocks like COVID-19 and natural disasters, emphasizing that systems with strong operational, relational, and structural attributes are best positioned for recovery, adaptation, and transformation. However, they find that while many FSS display short-term adaptability, few convert these coping mechanisms into long-term structural reforms, especially in resource-constrained settings. Rocha Aponte (2024) used Leontief–Ghosh IO analysis on Norway’s seafood sector, revealing strong backward/forward linkages and low import dependence. The fisheries/aquaculture sector remained stably connected to food, beverage and tobacco industries even amid COVID, suggesting adaptive supply-chain policies that maintained resilience. Together, these modeling studies—from Scotland to Norway (and by extension U.S. analyses using similar DIIM methods)—show how systemic shocks propagate through food networks. They identify vulnerable sectors and quantify recovery dynamics, informing policies (e.g., diversification or local sourcing) to bolster cross-sector resilience.
In building from these studies, this research combines methods in input–output modeling with a network approach to understand value creation and economic functionality of the food system within the broader economic system. We utilize the concept of the input-supply network, where an economy is described through a set of specialized production units or nodes, each relying on the flow of inputs from their suppliers to produce their own output, which in turn is routed towards other downstream units, forming a production network (Carvalho and Voigtländer, 2014; Lin et al., 2014). Production units are measured in dollar value. While a production network approach does not include household food consumption, Taschereau-Dumouchel (2019) points out that understanding the structure of the production network is key to determining whether and how microeconomic shocks affecting only a particular node propagate throughout the economy and shape network outcomes. Such shock propagation will ultimately affect the main outcome of the food system, which is food and nutrition security, by impacting the availability and pricing of food. Further, our dataset covers the global food crisis of 2008, when a convergence of different market shocks and disruptions in food production caused dramatic increases in global food prices and food shortages (Headey, 2011).
Input–Output (I-O) captures the interdependence of different sectors in an economic system. This interdependence is critical for understanding how shocks propagate through the system (Miller and Blair, 2009). Several studies have applied I-O models to measure economic resilience. For example, Hallegatte (2008) used an I-O model to simulate the economic impacts of natural disasters, finding that the resilience of an economy largely depends on its ability to substitute inputs, which can be measured using I-O tables. Koks and Thissen (2016) extended this approach by considering the resilience of global supply chains, showing how I-O tables can capture the global propagation of local shocks. Infrastructure systems are also increasingly being studied using I-O models. Haimes (2009) argued that I-O models can measure the resilience of infrastructure systems by capturing their interdependence. This approach was later applied by Ouyang and Dueñas-Osorio (2012), who used an I-O model to measure the resilience of interconnected infrastructure systems after a natural disaster. I-O models have also been used to measure the resilience of ecological systems. Finnoff and Tschirhart (2008) used an I-O model to capture the interaction between economic and ecological systems and measure their resilience. Avelino and Hewling (2019) used I-O tables to examine the resilience and adaptability of regional economies, highlighting the role of economic concentration and activity outflow in shaping regional resilience. Inoue and Todo (2019) used I-O tables to examine how shocks propagate at the firm level through supply-chain networks, providing valuable insights into the resilience of individual firms and their supply chains, and by extension, the resilience of the systems in which they operate. Contreras and Fagiolo (2014) found that (i) the more a sector is globally central in the country network, the larger its impact; and (ii) the largest European countries, such as those constituting the core of the European Union’s economy, are more vulnerable to economic shocks. The model developed by Carvalho (2014) explicitly highlights the role of input-supply linkages, where an idiosyncratic shock affecting a single sector is transmitted to its downstream neighbors in the network and, via the latter, propagates further downstream to other production nodes indirectly connected with the original sector.
Despite these promising applications, several challenges remain in using I-O tables to measure system resilience. For one, I-O models are linear, which may not adequately capture the non-linear behavior of real-world systems (Dietzenbacher and Los, 1997). Furthermore, I-O tables are typically static, making it difficult to capture dynamic changes in system resilience (Acemoglu et al., 2012). Addressing these challenges will require the development of more advanced I-O models and the integration of I-O models with other modeling approaches.
To address these shortcomings, we combine the standard input–output (I-O) framework developed by Leontief (1949) with a network approach. In the context of complex networks, by combining food and non-food sectors, the use of I-O tables avoids truncation bias as explicit food system nodes may have multiple linkages with nodes or sectors outside the mainstream food system. For example, chemistry (for fertilizers and pesticides) and machinery (for agricultural equipment) are critical to farming activities. By using a networked I-O approach, we are also able to quantify the bias in more truncated systems measures of resilience that focus only on the food system and not the greater economic system. Studies on other sectors of the economy note that node or sector removal simulations based on highest degree (Albert et al., 2000; Callaway et al., 2000; Cohen et al., 2001) or highest betweenness centrality (Magoni, 2003) have the ability to propagate.
We use a network centrality approach, which allows for multiple features of the system to be observed by implementing node deletion scenarios. Deng et al. (2007) argue that node deletion does not necessarily destroy the connectedness of a growing network if the increasing rate of edges is not excessively small. Early studies on network resilience focusing on node deletion assume that once the system has fallen apart, some key functions or features may be lost (Albert et al., 2000); for example, it is expected that once a critical number of server nodes are down, the internet will collapse. This study explores how the food system operates without the overall economic system and vice versa. We also highlight vulnerable sectors that can drastically change system functionality.
While node deletion simplifies the complex nature of economic systems, it is employed here as a stress-testing tool to identify structurally fragile sectors within the network. Crucially, removing a node inherently eliminates all of its associated edges—effectively severing that sector’s connections to the rest of the network. This means that node deletion can also be interpreted as a form of targeted edge deletion, representing the abrupt disruption of critical intersectoral linkages such as supply chain dependencies or technological collaborations. From this perspective, the approach offers a useful proxy for simulating realistic economic shocks without the need to model every potential mode of partial failure explicitly. This interpretation addresses concerns about the realism of node deletion by situating it within a broader framework of network disruption analysis.
Methods
Any system can be represented as a network of graphs where a given graph is a pair of sets of nodes (or agents) and edges (or relationship) with their cardinality denoted by and , respectively. Weighted and oriented networks can be described using an adjacency matrix , , where represents the level of interaction between nodes and . In our study, each edge in the network represents an actual financial transaction between two sectors, as reported in the U.S. Input–Output (I-O) tables. Specifically, the weight of a directed edge from sector i to sector j corresponds to the dollar value of intermediate goods or services that sector i provides to sector j.1 This approach allows us to simulate the structural importance of sectors based on their actual economic footprint, rather than relative proportions, thereby offering a more realistic view of systemic vulnerability and resilience.
It follows that a network can also be defined by . A generic -path with starting node is given by , where are distinct nodes in and arcs
All the -paths of network starting from node can be assembled as shown in Equation (1):
Following Carvalho (2014), Acemoglu et al. (2016) and Acemoglu and Guerrieri (2008), in Equation (2), we assume that each node of the network is approximated by the following constant return to scale technology:
where is the corresponding productivity shock, the amount of production input used by node is given by , while is the share of input in production; is a given constant; denotes the amount of good from node supplied to node while the exponent , element of adjacency matrix , represents the share of good from node in the total intermediate input used by node .
In this context, the adjacency matrix is defined by three main elements (Carvalho, 2014): (i) a collection of nodes, each node corresponding to one of the sectors in the economy; (ii) a collection of directed edges, where an edge between any two nodes denotes an input-supplying relationship between two nodes; and (iii) a collection of weights, each of which is associated with a particular directed edge and given by the exponent in the output function.
We assume a representative consumer with Cobb–Douglas preferences, as shown in Equation (3):
where is the amount of good consumed and is some positive constant.
The first-order conditions of the firm’s problem at node i are given in Equations (4) and (5), representing input allocation and labor choice, respectively:
where and represent, respectively, the wage market and the price of good . Since , it follows that the optimal production for node is given by Equation (6)
for some constant .
Given a constant , Taking the log-linear transformation of the production function yields Equations (7) and (8), simplifying downstream aggregation:
where .
As pointed out by Acemoglu et al. (2017), because of constant return to scale assumption, nodes make zero profits in equilibrium; hence, value added is simply equal to the market wage . Assuming with , the log real value of the economy is derived in Equation (9), capturing system-wide output adjusted for productivity.
For an appropriate choice of , as shown in Equation (10), aggregate output is computed as the mean of node-level logs:
As shown in Equation (11), without loss of generality, Carvalho (2014) shows that aggregate output, , is simply a weighted sum of the (logarithm of) nodes-level shocks,
where the weights, , are determined by the network matrix , .
Equation 11 states that aggregate output might fluctuate over time due to shocks from individual nodes; the magnitude of these aggregate fluctuations can be traced back to the network structure through adjacency matrix using network centrality measures such as the Katz–Bonacich centrality measure.
The Katz–Bonacich centrality vector is expressed in Equation (12), which links adjacency matrix W to centrality θ. The Katz–Bonacich eigenvector centrality measure is derived by assigning to each node , a centrality weight , which is defined by some baseline centrality level , equal across all nodes, plus a term which is proportional to the weighted sum of the centrality weights of its downstream nodes: for some parameter . In matrix form, this implies that the vector of centralities is given by:
where is the vector of Katz–Bonacich centralities given an input–output network where , the share of intermediate inputs in Equation 2.
It follows that Equation 11 can be written as
Hence, Equation 13 establishes the link between aggregate network outcome and its centralities. Finally, Acemoglu et al. (2016) show that in any given interaction network, node or agent ’s Bonacich centrality can be written as
Equation 14 implies that node has a higher centrality (and hence a more pronounced impact on the rest of the nodes) if it interacts strongly (if is close to 1) with nodes that are themselves central. In other words, “a shock to an agent with a higher Bonacich centrality impacts the states of other relatively central agents, which in turn propagates the shock further to other agents, and so on, eventually leading to a larger aggregate impact” (Acemoglu et al., 2016, p. 586). Therefore, network centrality measures can be used to assess overall system resilience.
Finally, network volatility can also be measured by
Equation 15 can be decomposed into economy-wide sub-systems which include the food system.
While complete sectoral collapse is rare, node deletion serves as a stylized tool for stress-testing the network, identifying structurally critical sectors, and mapping the propagation of failures. The method is conceptually aligned with existing literature in complex networks and systemic risk modeling (e.g., Albert et al., 2000; Acemoglu et al., 2016), where node or edge deletion simulates extreme disruptions like strikes, natural disasters, or policy shutdowns. This modeling experiment provides insights into fragility and interdependence that real-world variability might obscure.
Data and metrics
The empirical implementation of a simple analytical framework laid out in the previous section is conducted by using 2007 and 2012 Input–Output Tables (IOTs) of the United States of America (USA) from the Bureau of Economic Analysis (BEA) as networks that describe, for a given period, transactional flows within an economy. The 2007 and 2012 time points were selected to capture pre- and post-2008 financial crisis dynamics. This interval allows examination of how economic shocks affect intersectoral dependencies and which sectors gained or lost influence as a result. This implies that that economic shocks—such as the 2008 financial crisis—impact not only the volume of sectoral production but also the structural position of sectors within the broader economic network. In other words, beyond measurable changes in output, shocks can reconfigure intersectoral dependencies by altering how sectors are interconnected and how influential they are within the system.
The US has I-O tables over 1997–2021 period but with a maximum of 71 industries compared to 405 industries for 2007 and 2012. In addition to their disaggregated structures, the choice of 2007 and 2012 I-O tables allows for an assessment of system resilience after the 2008 food and financial shocks. The estimates are available at four levels of detail (see Howells et al., 2018): sector (21 industry groups), summary (71 industry groups), underlying summary (138 industry groups), and detail (405 industry groups). Sectors are presented according to the 2012 North American Industry Classification System (NAICS) code structure. In this paper, after cleaning data to remove negative entries and isolated nodes, the resulting network comprises 363 nodes and 43,599 edges for 2007, and 362 nodes and 42,906 edges for 2012.• In a fully connected network where every node/sector has a connection to all other nodes, the overall system would have 131,406 edges for the 2007 sector (N*(N−1)). Thus, the US economic system has many, differently weighted, interdependencies, but not every sector is connected to every other sector, opening interesting opportunities to model resiliency. To comply with network analysis requirement, the diagonal of adjacency matrix was set to zero for each network.
Following the North American Industry Classification System (NAICS) (Horowitz and Planting, 2006), the selection of food sector includes processing (for example, flour milling and malt manufacturing) and non-processing (for example, grain farming) food activities, and related supporting activities/services (for example, full-service restaurants, farm machinery and equipment manufacturing, and support activities for agriculture and forestry). To assess the resilience of US food system to shocks, we run a series of simulations by deleting nodes with the highest degree centrality. Furthermore, the volatility of the system is assessed by using a measure developed by Acemoglu et al. (2016, equation 15 in Supplementary material). We look also at the impact of shocks in the form of nodes deletion on the network outcome (here, production). Finally, we assess the bias of analyzing food system resilience based on truncated food system as in most previous studies. We define a truncated food system as a network of food sectors disconnected from non-food sectors in the overall economic system. In a way, food system truncation corresponds to an extreme case of the deletion of non-food nodes. The complete list of deleted nodes for each scenario is presented in Table 1.
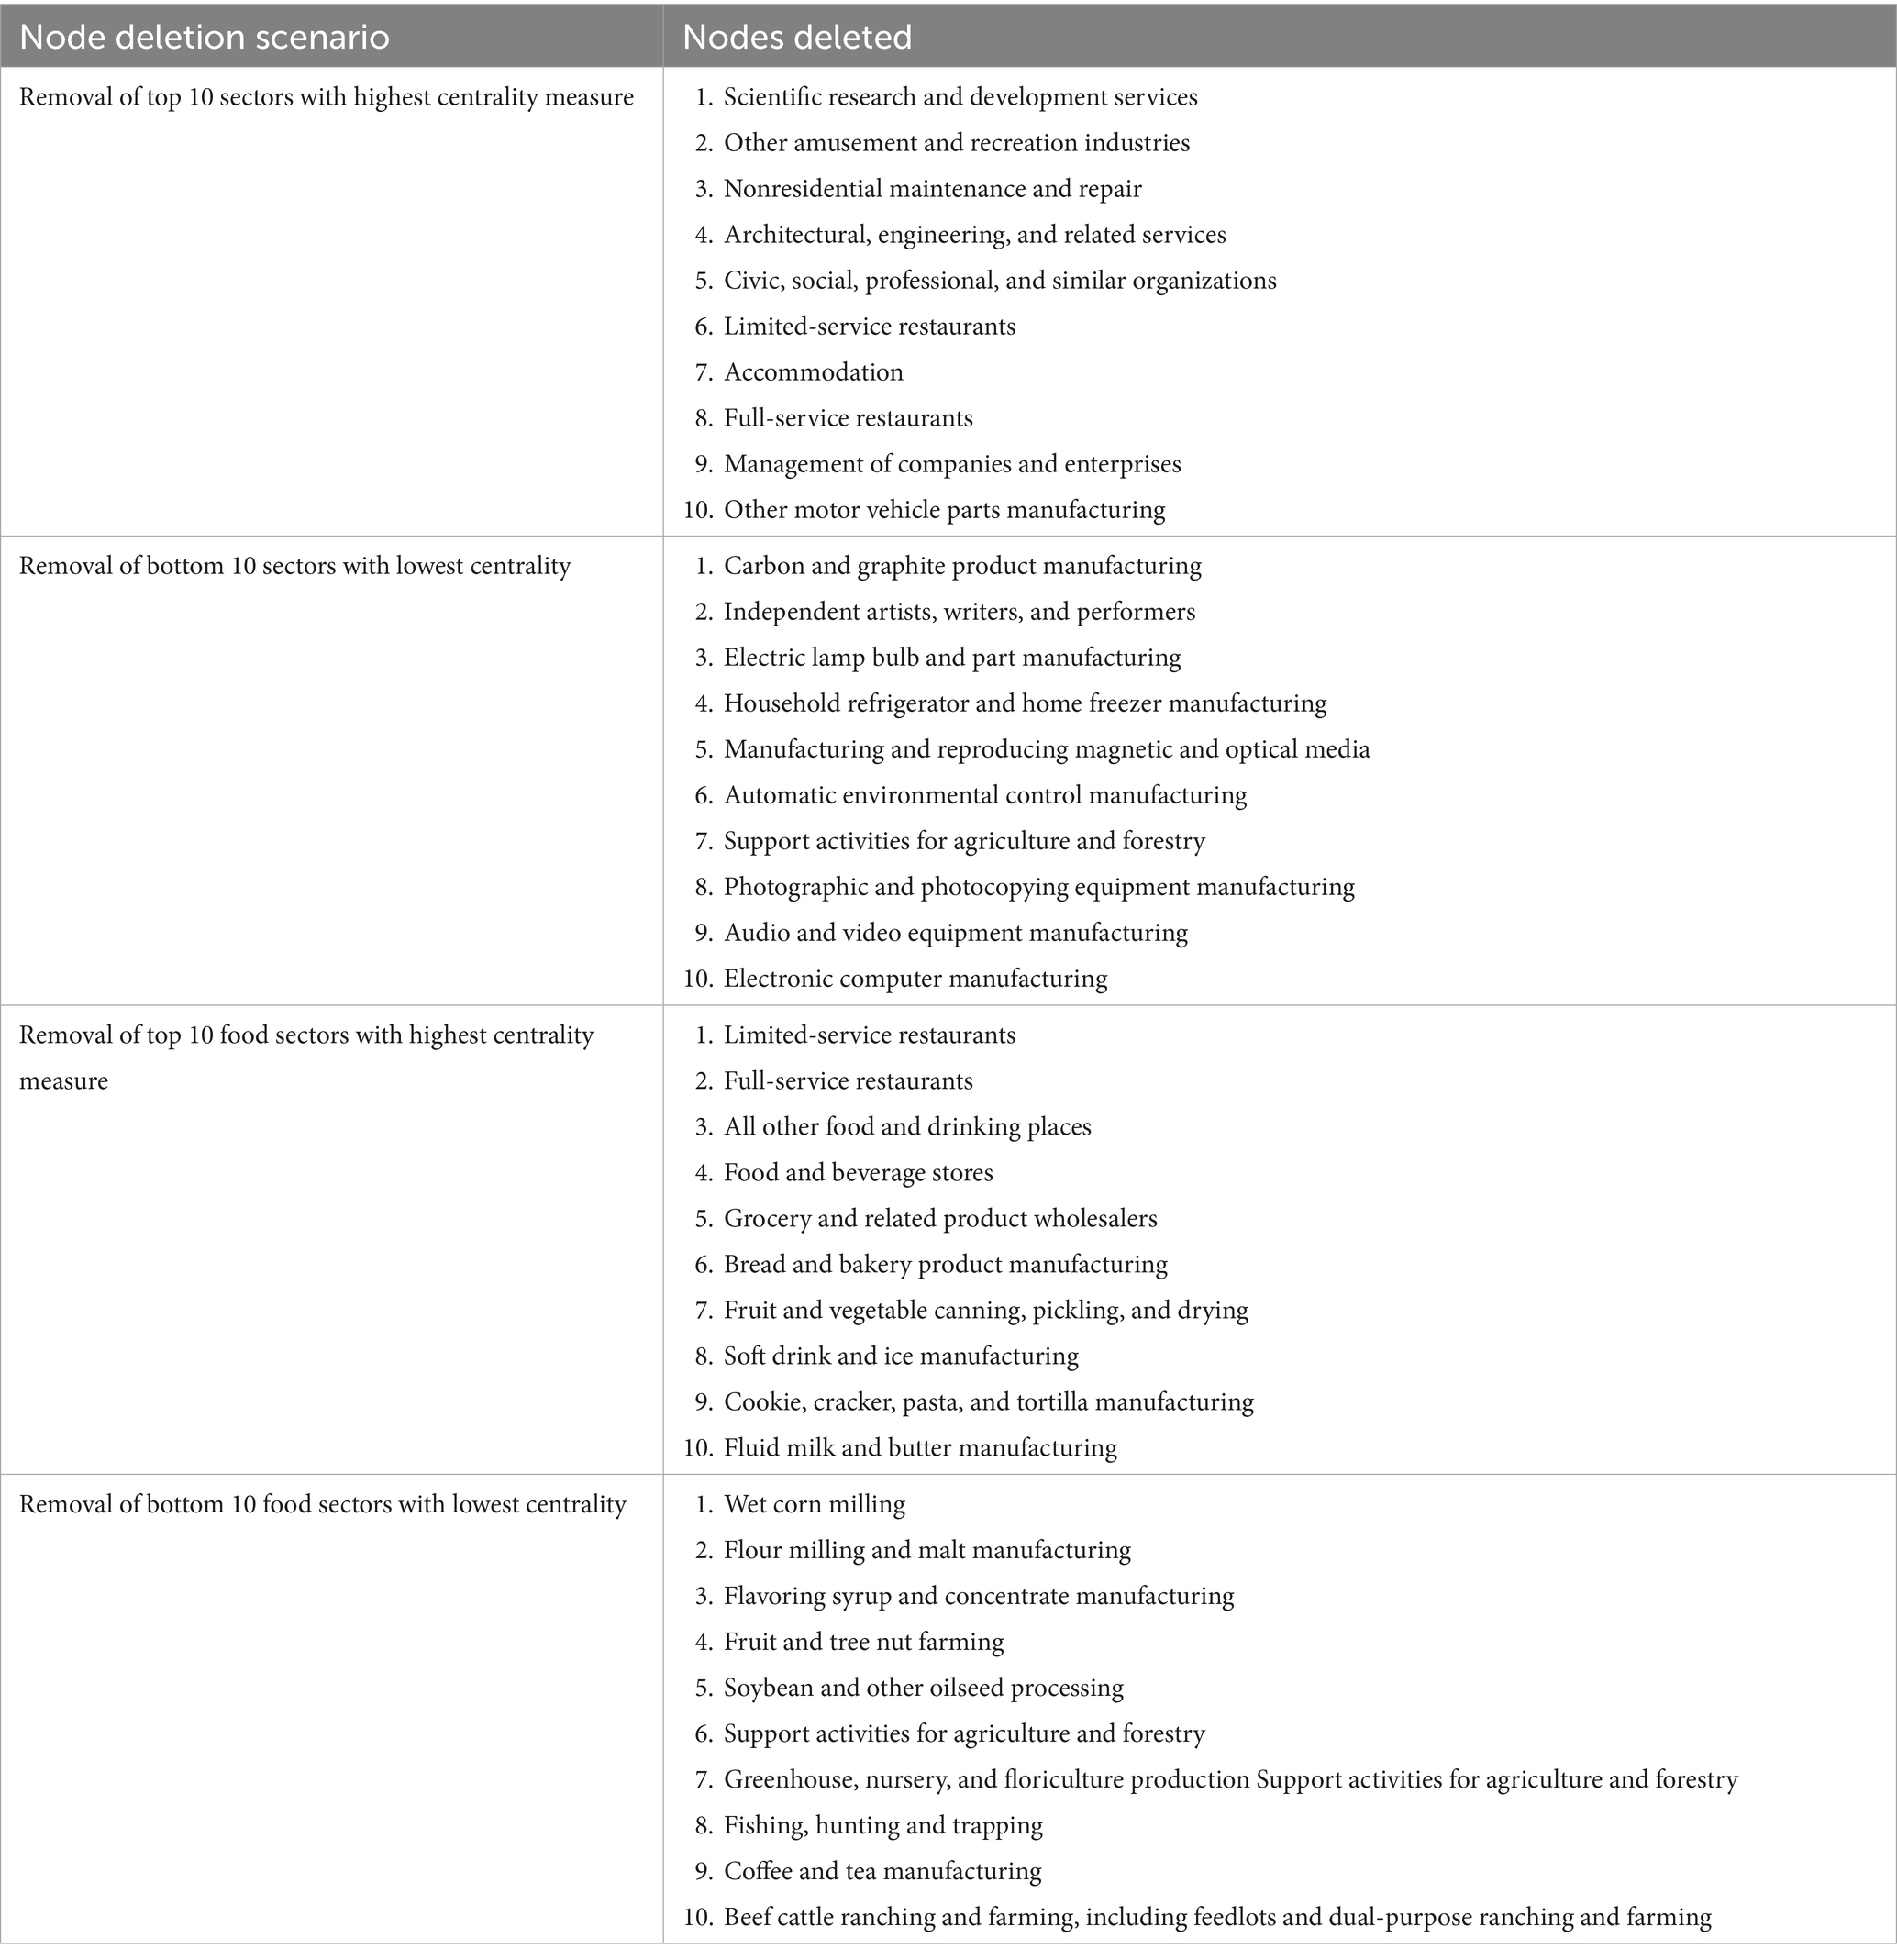
Table 1. List of scenarios and deleted nodes.
A brief description of network metrics in the analysis is provided in in Table 2. These metrics include betweenness centrality, clustering coefficient, density and total degree centrality.
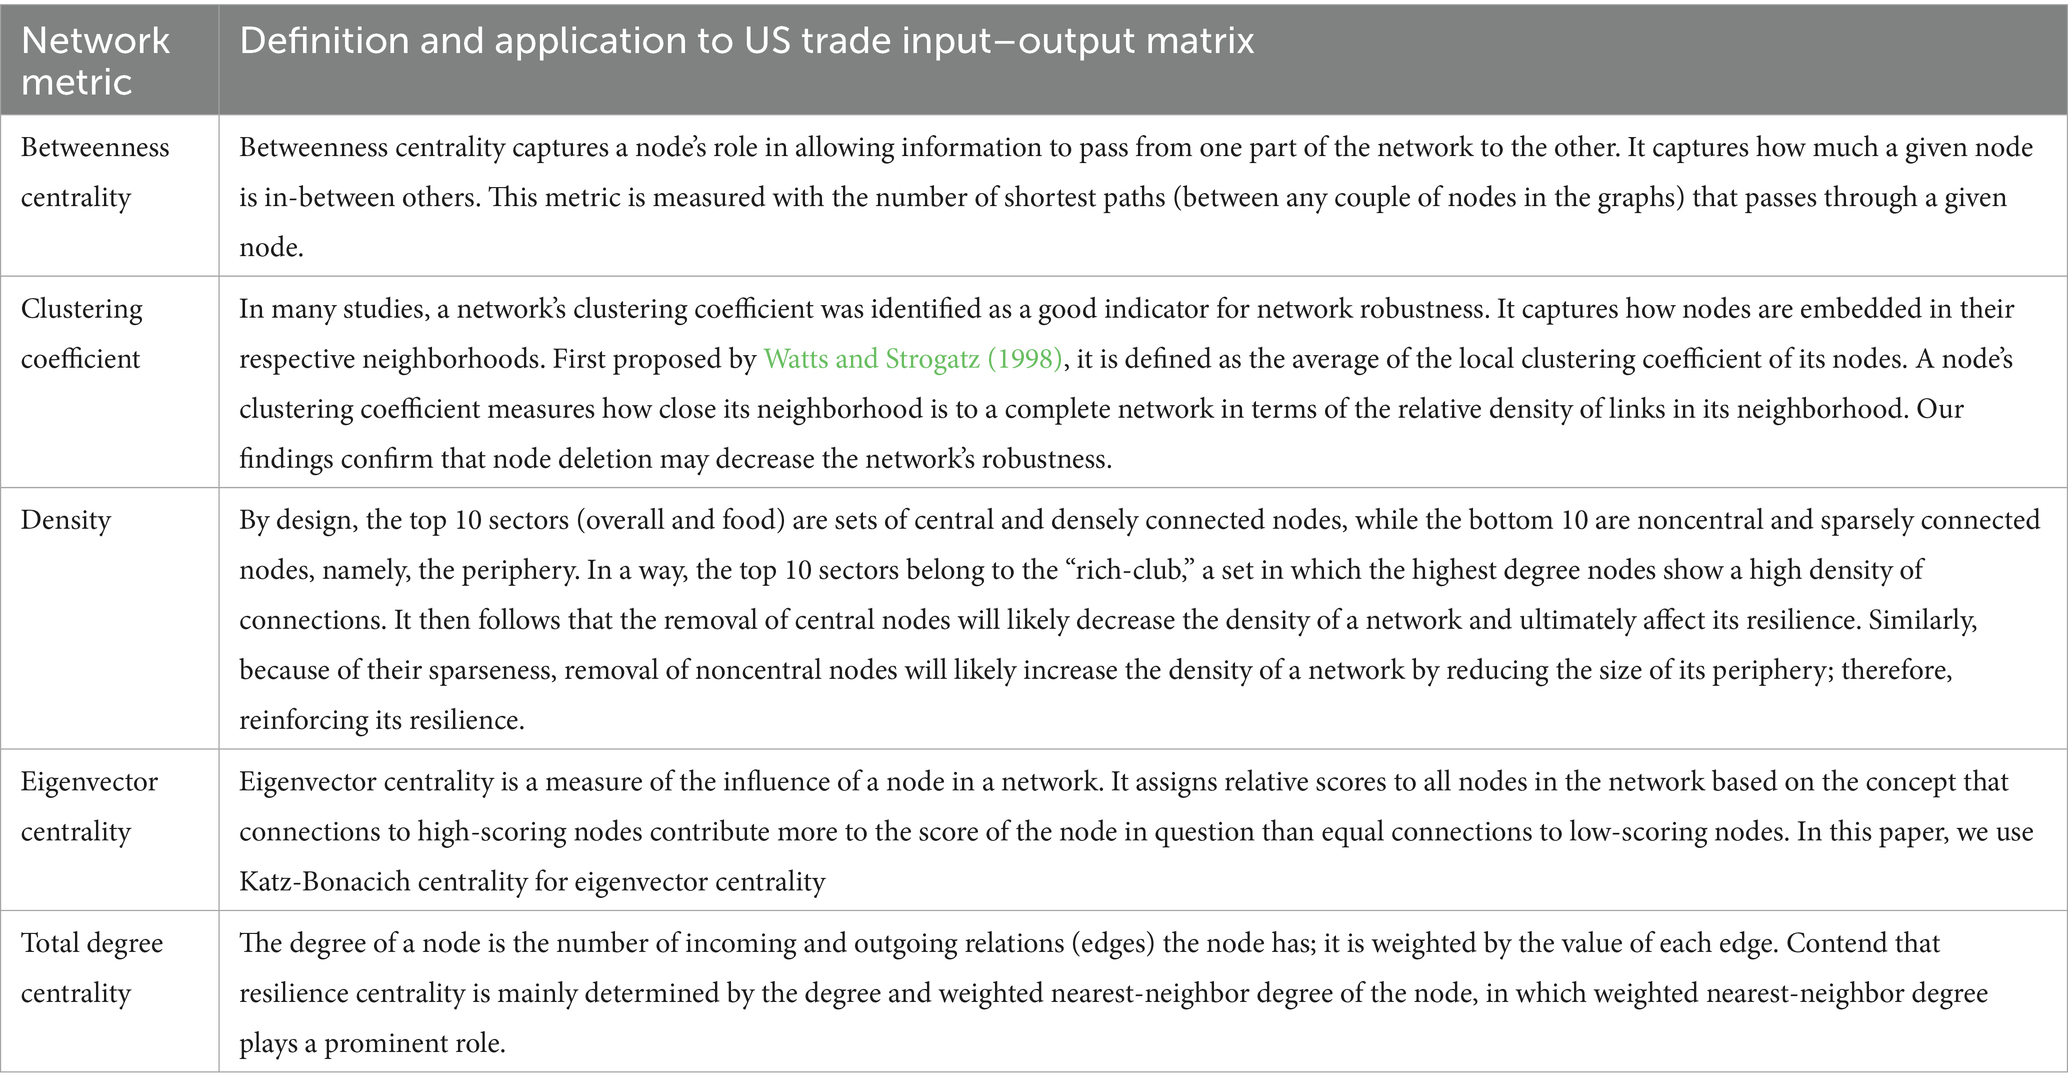
Table 2. Selected network metrics.
Results
Network centrality
We find that over the study period, the U.S. food system consolidated nearly twice as much as the overall economic system. In 2007, the US economic network had a density (the number of existing connections relative to the potential connections (PC3) of 0.332 compared to 0.328 in 2012; in other words, between the two periods, the US economy lost 1.6% of its edges and 1.2% of its density. The food subnetwork (Figure 1) also saw a reduction in density from 0.357 in 2007 to 0.346 in 2012, losing 3% of its edges and density over the two time points. Such consolidation can be protective against shock or give added exposure to shock depending on network realignments and dependencies, as we describe next.
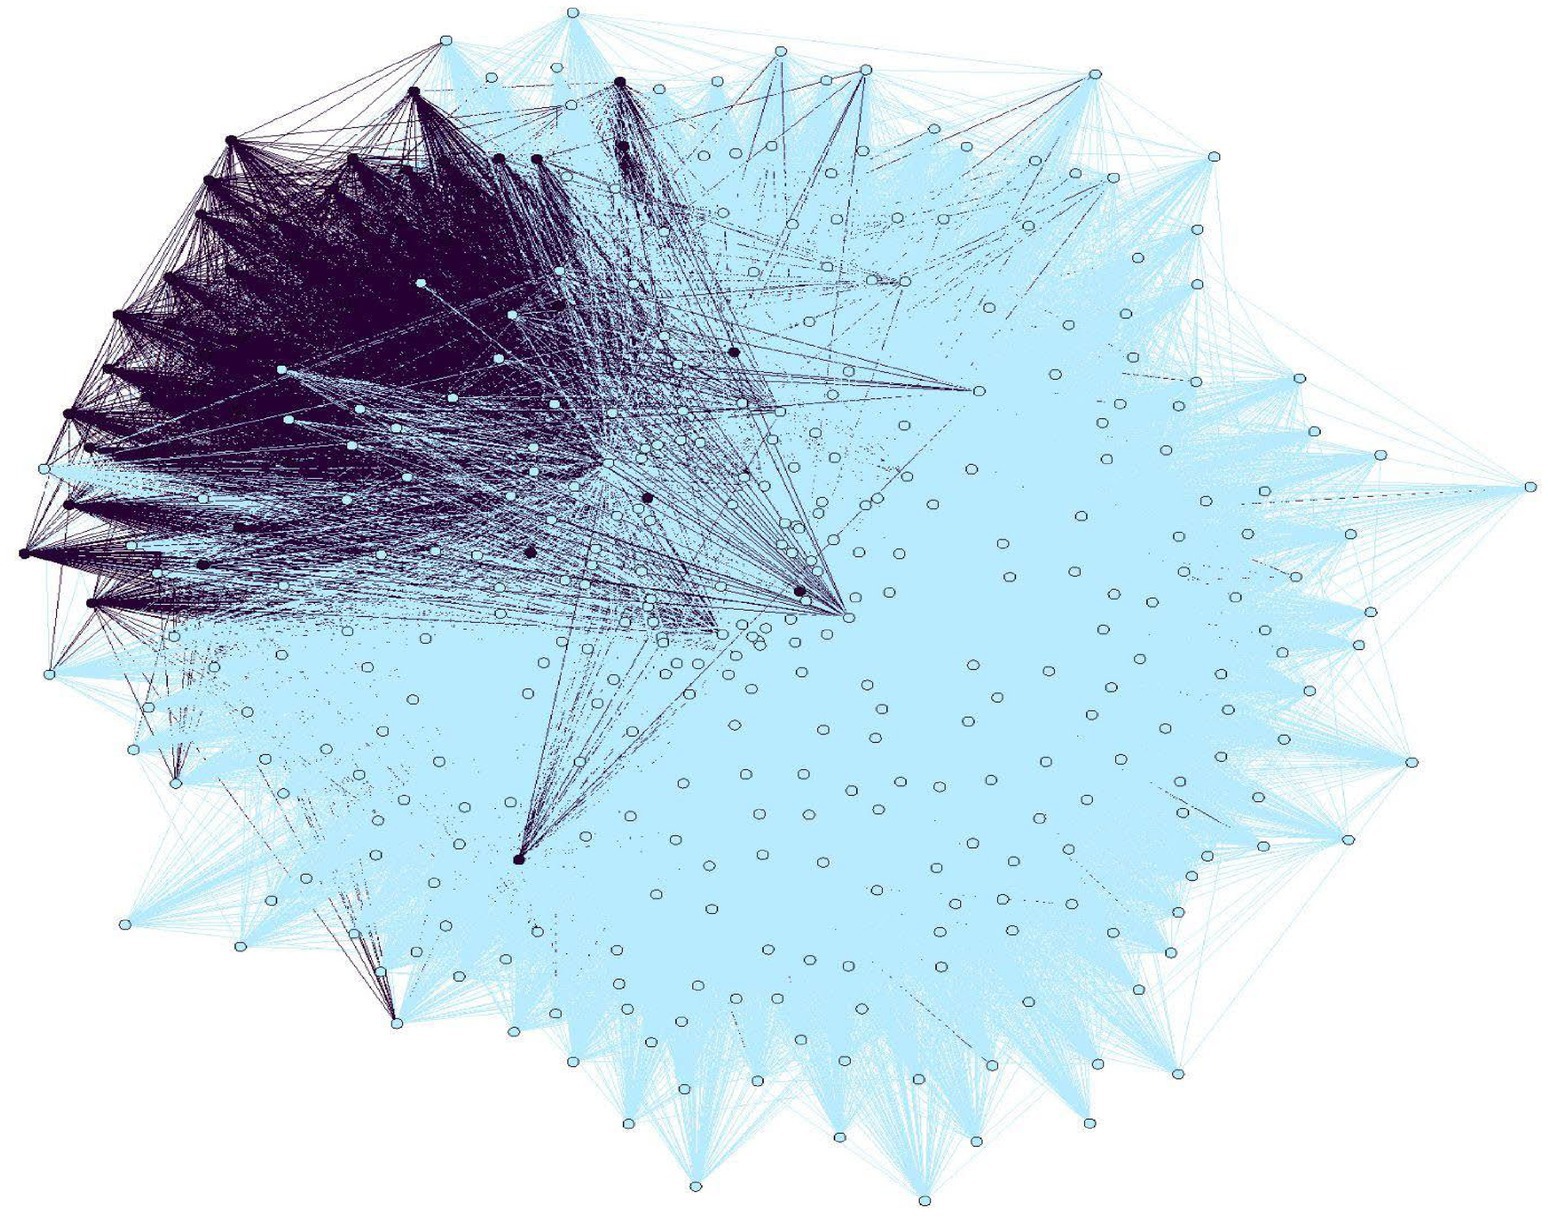
Figure 1. Network of the overall US economic system nodes and edges (light blue) with the food system nodes and edges (dark blue). Note that some more central nodes in the food system are also more central to the overall economic system (2007 I-O data).
We also observed significant shifts in the centrality rankings of sectors, providing insights into their relative systemic importance. Specifically, 58% of sectors increased in centrality, indicating that they became more embedded and influential within the economic network (Figures 2–5). In contrast, 37% of sectors experienced a decline in their centrality rankings, suggesting reduced integration or weakening connections to the rest of the economy. These changes highlight that sectors do not respond uniformly to shocks; instead, some become more dominant while others diminish in systemic relevance. For example, the “Internet publishing and broadcasting” sector rose by 92 ranks, while “Newspaper publishing” dropped 61 places, showing how the shock reshaped economic hierarchies. The maximum increase in ranking was 92 spots (“Internet publishing and broadcasting and Web search portals”) and the largest decrease was 96 rank spots (“Broadcast and wireless communications equipment”). Thus, “intersectoral dependencies” are not static—they evolve with macroeconomic events, and our centrality analysis captures that dynamic.
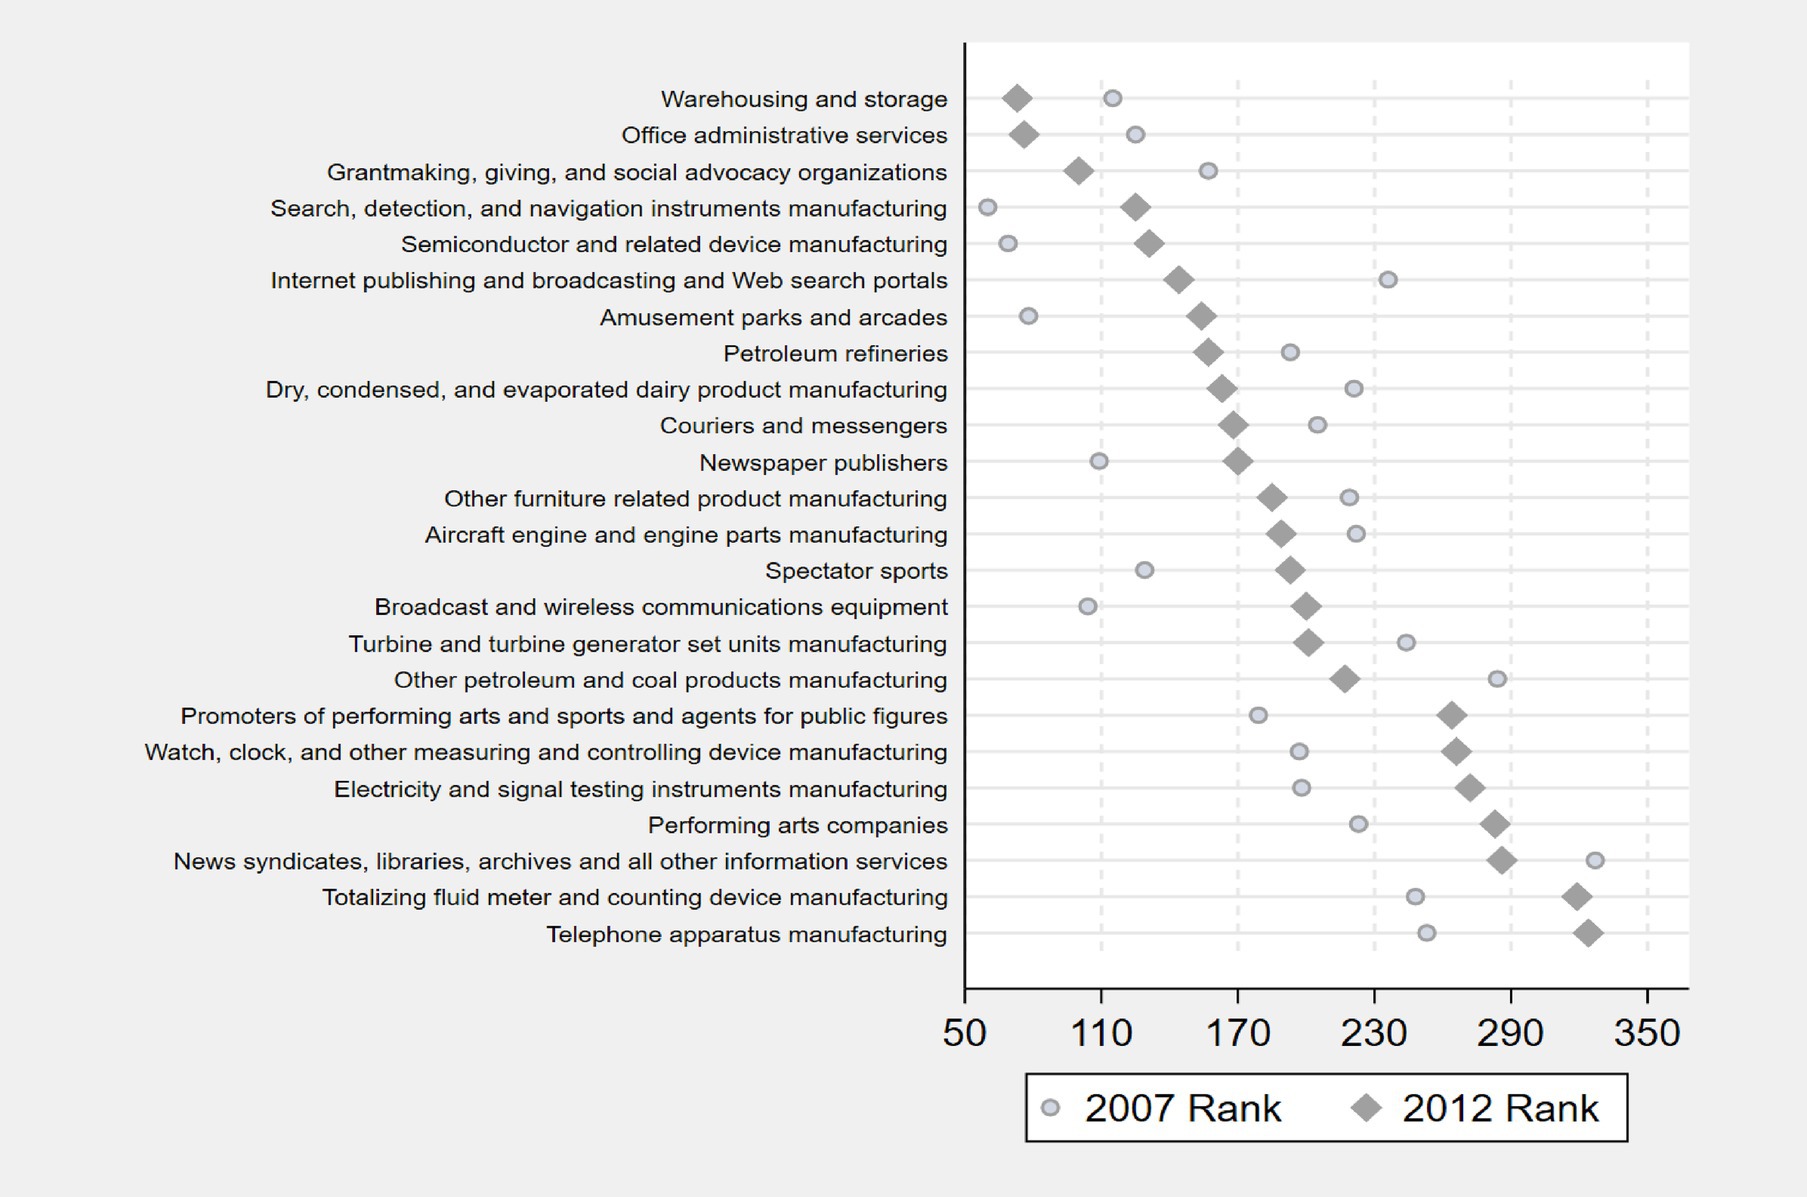
Figure 2. Sectors with the greatest rank change from 2007 to 2012.
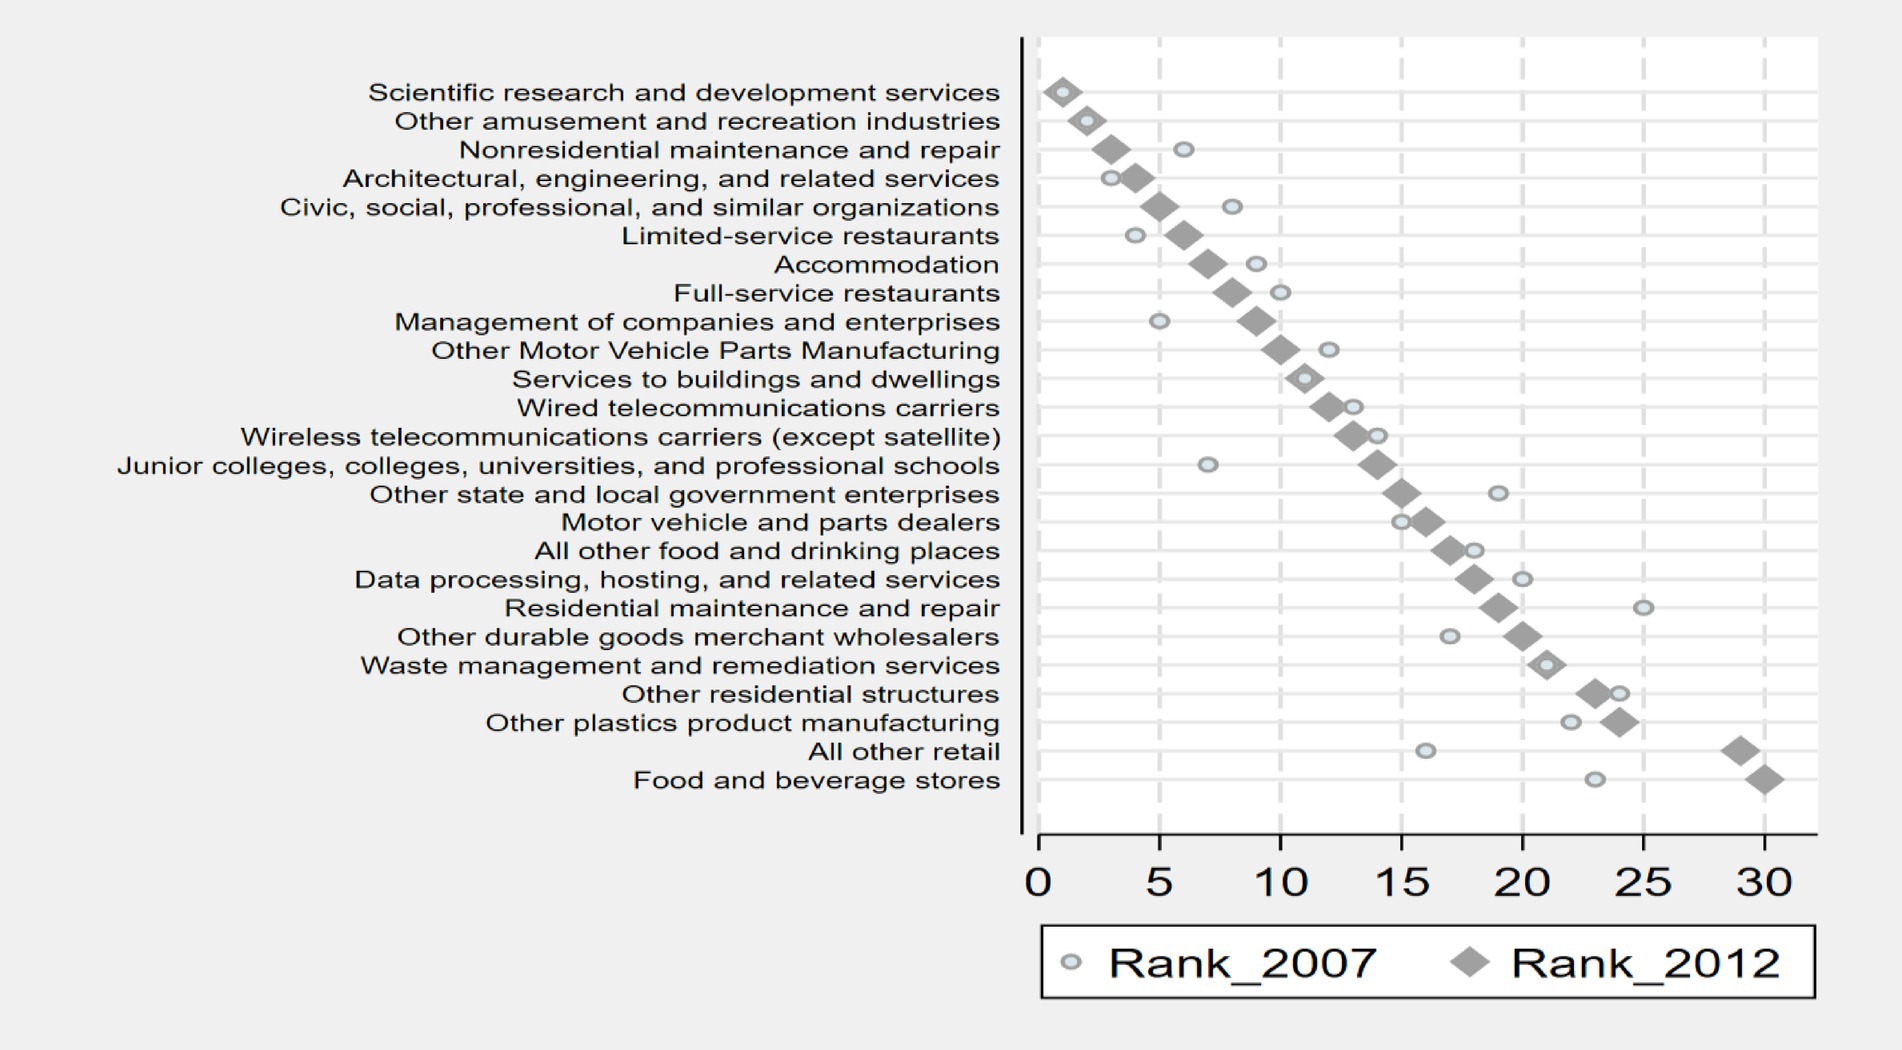
Figure 3. Change in ranking for the top 25 economic sectors between 2007 and 2012.
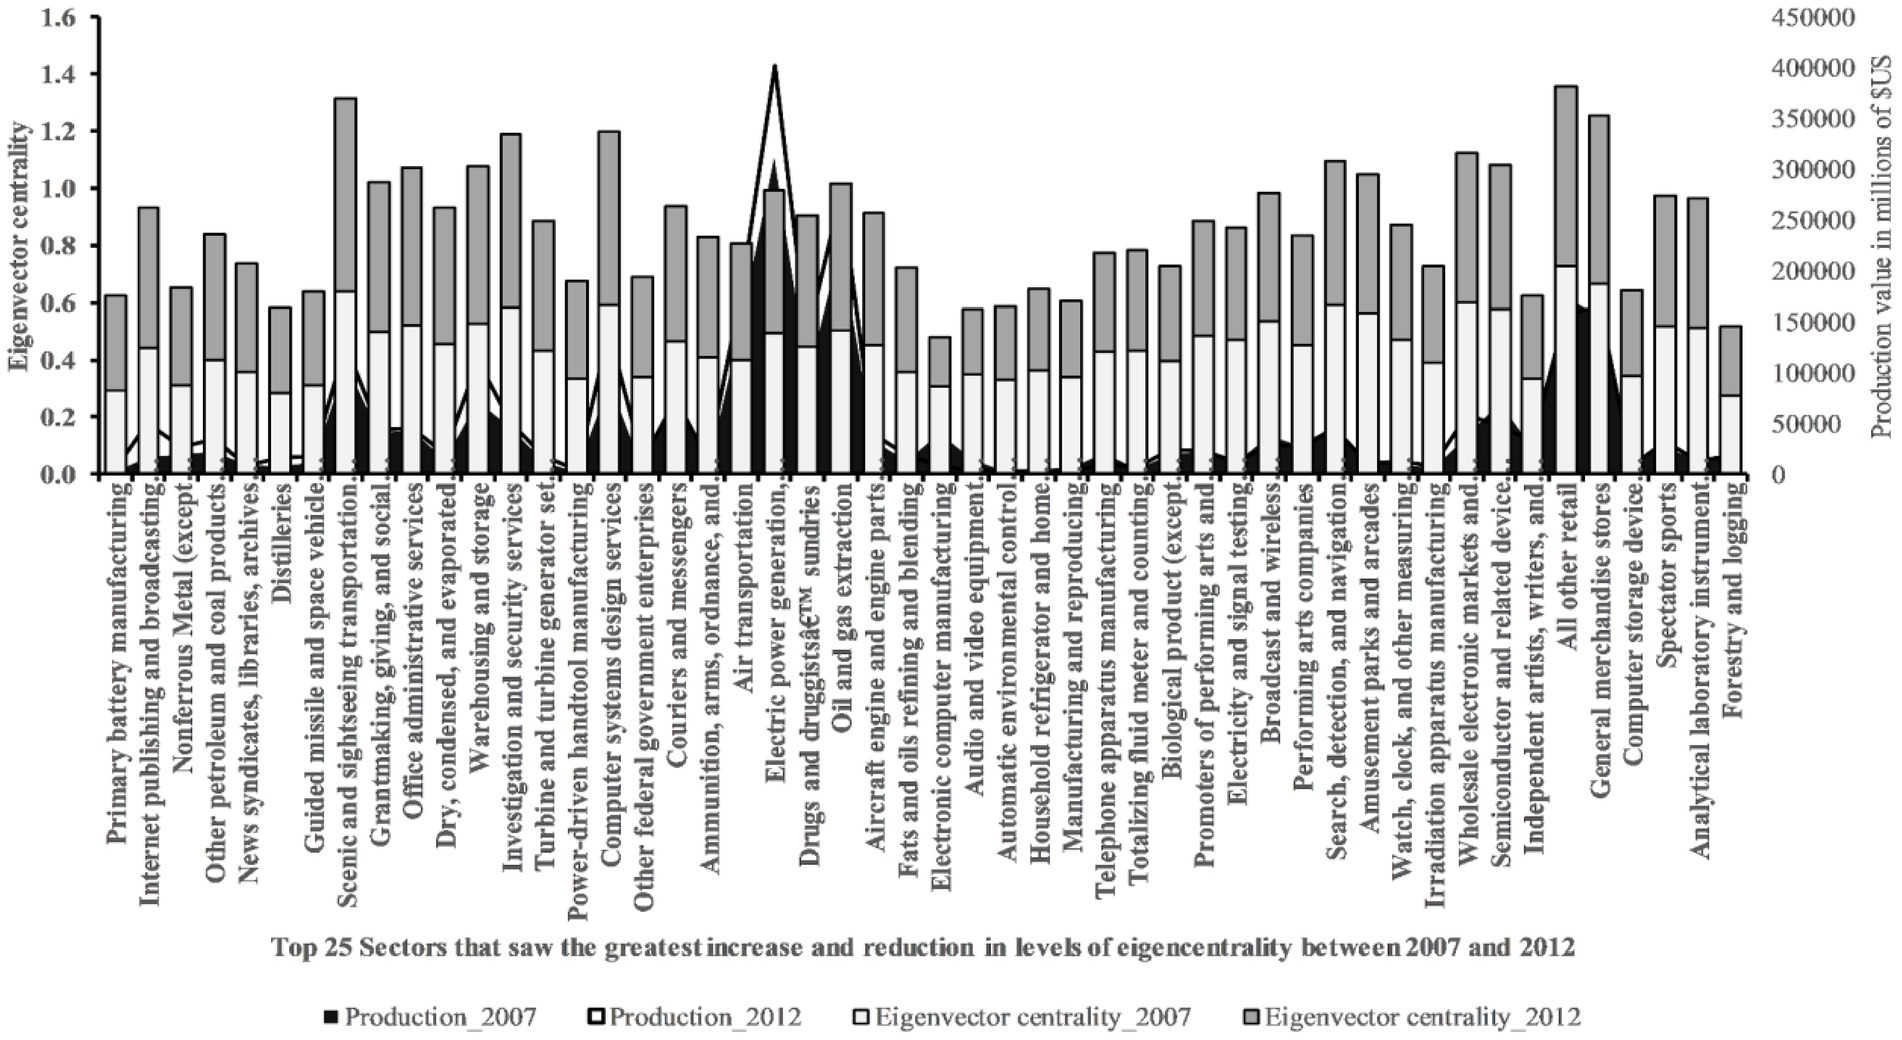
Figure 4. Economic sectors with the greatest increases (25 in total) and decreases (25 in total) in eigen centrality from 2007 to 2012.
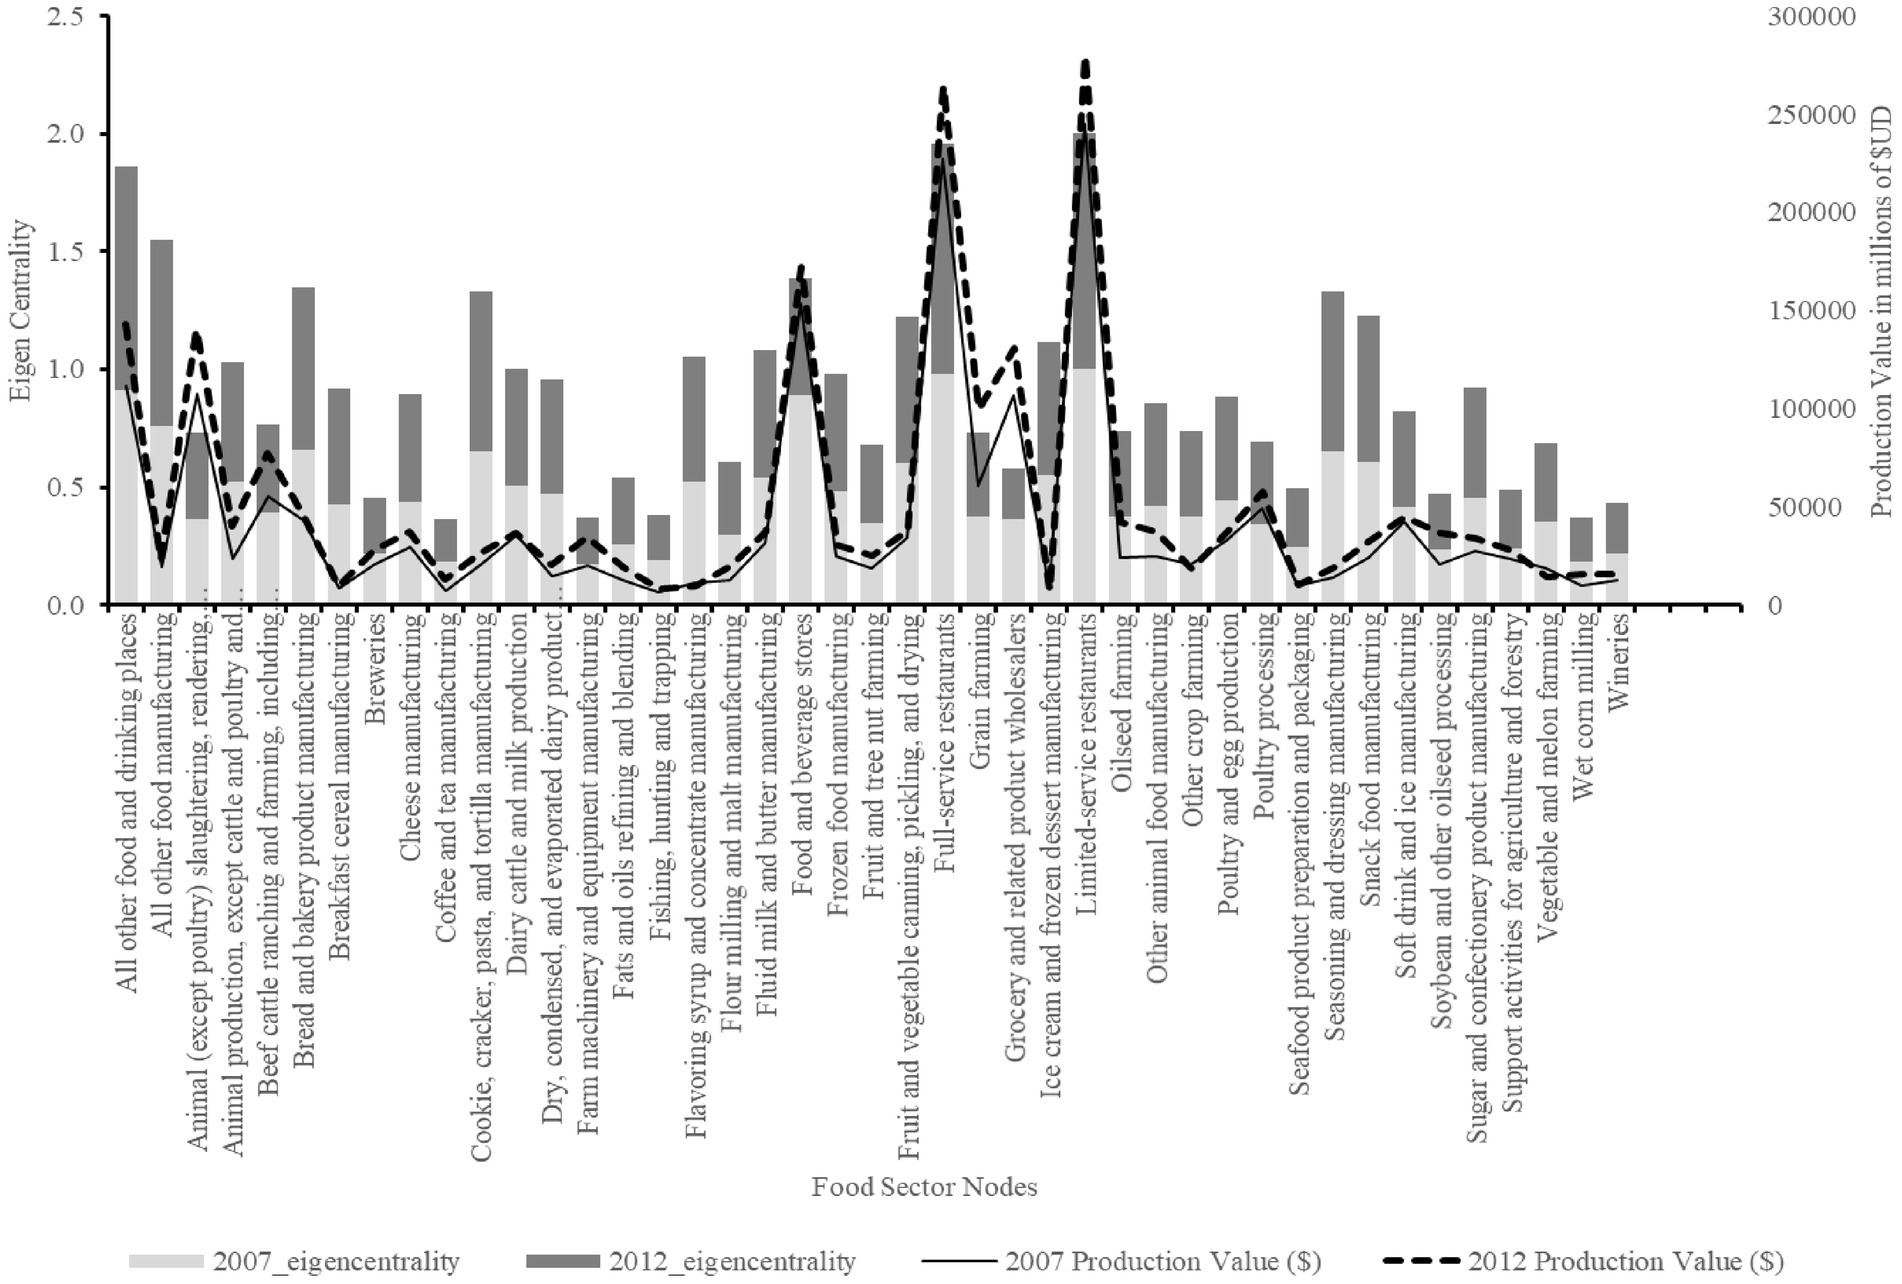
Figure 5. Change in eigen-centrality and production value in the food sector between 2007 and 2012.
Notably, the top 25 sectors in the economy did not experience a large degree of change in either rank or eigenvector centrality (Figure 4). The apparent stability of these top sectors in face of the 2008–2009 food and financial crisis may be a sign of the US economy capacity to absorb such shock. Only the “Scientific research and development services” sector remained unchanged and held onto its ranking as the most central sector in the economic system. Interestingly, despite the overall decline in eigen centrality, 62% of nodes in the economic system saw an increase in its production between 2007 and 2012.
Like the overall economic system, the food system experienced significant movement in ranking and centrality between 2007 and 2012 (Figure 6). Though unlike the economic system (Figure 4), the change in ranking among the food sectors was minor Figure 5). While 42% (18 nodes) of the food sector nodes experienced an increase in ranking (Figure 5), the range of rank increase was 3, followed by no change in ranking (32% of nodes), and only a quarter of nodes (11) experienced a decline in ranking. Again, the decline was relatively small compared to rank changes in the economic system (range of 10, Figures 2–4). Changes in rank are commensurate with changes in eigenvector centrality. Of the food sectors, “Breakfast cereal manufacturing” achieved the largest gain in eigen centrality, increasing 14.2% between 2007 and 2012 (Figure 5). In contrast, “food and beverage stores” sector saw the largest slump, dropping 44.3% in eigen centrality between 2007 and 2012 (Figure 5). Followed closely by the “grocery and related product wholesalers” sector experiencing a 41.9% reduction in their eigen centrality over the same period (Figure 5). With the financial crisis and less disposable income available, food purchasing and thereby sectors involved in food retail became less central to the economy (Figure 6 c-d). Despite these notable exceptions, 60% of the 43 food sector nodes increased in (eigen) centrality between 2007 and 2012 (Figures 5 and 6c-d) The production value 4 of 88% of the food sectors experienced an increase during the same period (Figures 5 and 6c-d). Between 2007 and 2012, 24 food sectors experienced an increase in both production value and in centrality (Figures 5 and 6c-d).
Overall, as shown in Figures 6a,b, we find a positive correlation between sector centrality and production as derived in Equation 13. This is an important feature as a negative shock that affects a central sector is likely to reduce its production and propagate the shockwave throughout the network by creating an aggregate disruption. As pointed out by Carvalho (2014), in a production network that stresses the role of input-supply linkages, “an idiosyncratic shock affecting a single sector will be transmitted to its downstream neighbors in the network and, via the latter, propagate further downstream to other production nodes which are only indirectly connected with the original sector” (p. 38). Hence, the resilience of a given food system is more likely to rest on the sectors that exhibit strong correlation between production and centrality.
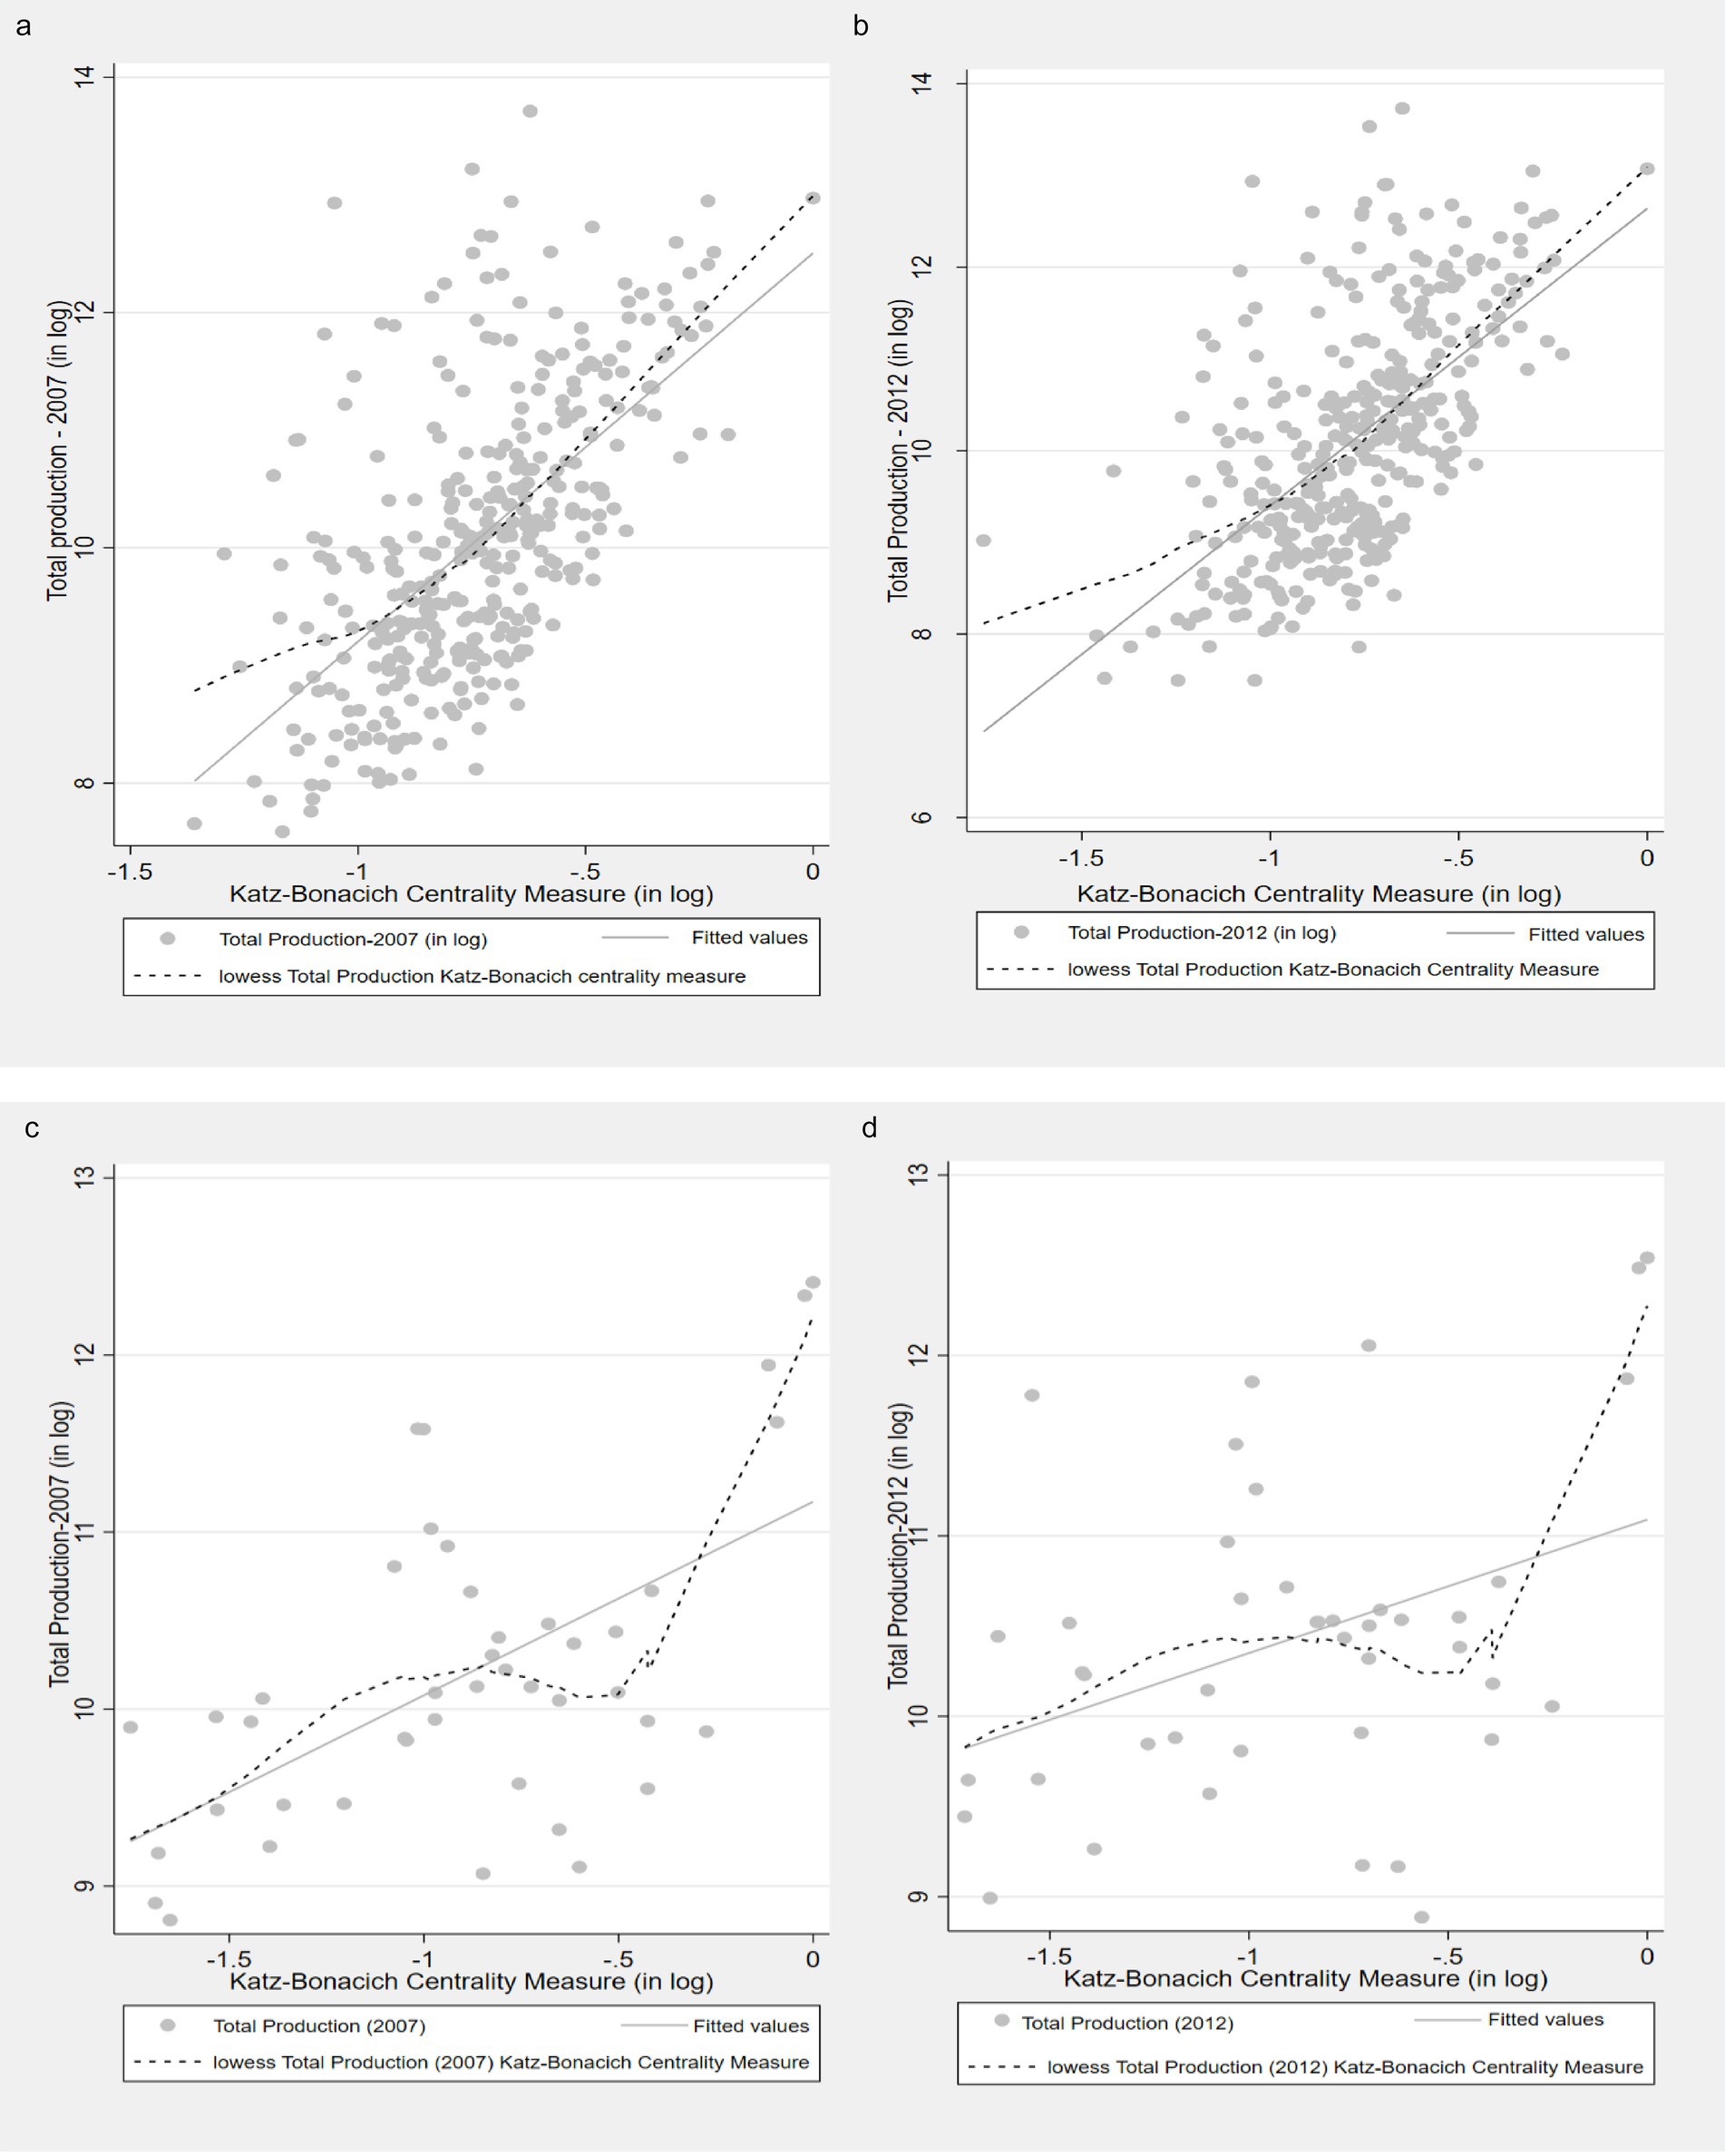
Figure 6. (a) Production and centrality for the overall economy in 2007. (b) Production and centrality for the overall economy in 2012. (c) Production and centrality for the food system in 2007. (d) Production and centrality for the food system in 2012.
Figure 7 presents the level of volatility5 with respect to centrality between the two periods. The results suggest that the volatility is much higher for the overall economic system compared to the food system. Given that the overall economic system has more nodes compared to the food system, the law of large numbers, where aggregate output becomes increasingly concentrated around a constant value, does not hold here. As pointed out by Gabaix (2011), when some sectors play a disproportionately important role (due to their much larger size relative to others), the standard central limit theorem no longer holds. As a result, aggregate fluctuations may result from sector-level (idiosyncratic) shocks (Acemoglu et al., 2017). Over time, though not significant, volatility was on average slightly lower in 2012 compared to 2007 which might be related to the recovery from the 2008–2009 crisis as mentioned earlier. It is probable that the higher volatility in both the networks in 2007 is indicative of the global financial crisis that preceded the 2008 crisis.
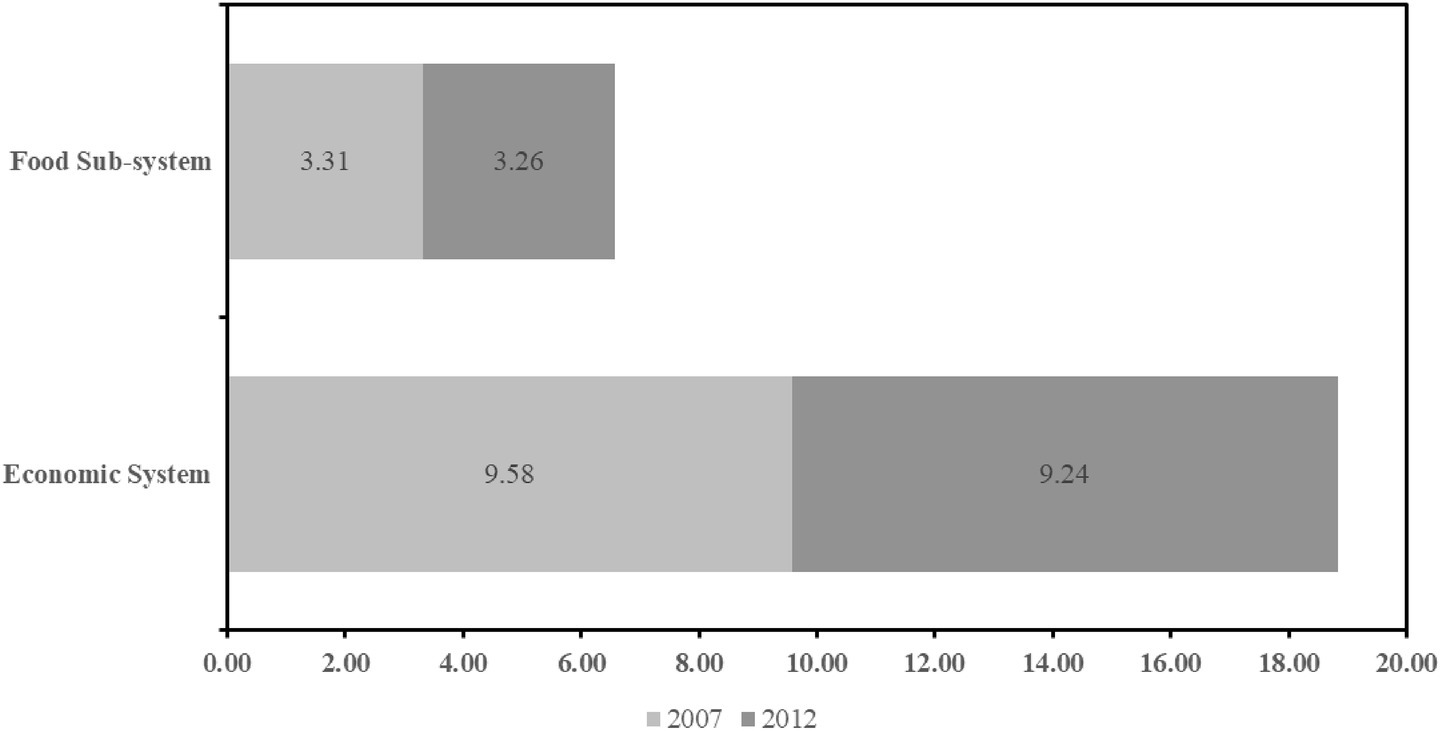
Figure 7. Volatility of food and overall economic systems between 2007 and 2012.
Sector failure scenarios
Highly centralized networks, like the U.S. economic system, rely heavily on the most central nodes for overall connectivity and functionality such that impacts on these nodes will have cascading effects across the network. We show that deletion of the bottom 10 economic and food nodes tends to boost density, clustering, degree, and weighted degree of the overall economic network (see Figures 8a–c). While deletion of the most central 10 economic nodes negatively impacts the same network characteristics.
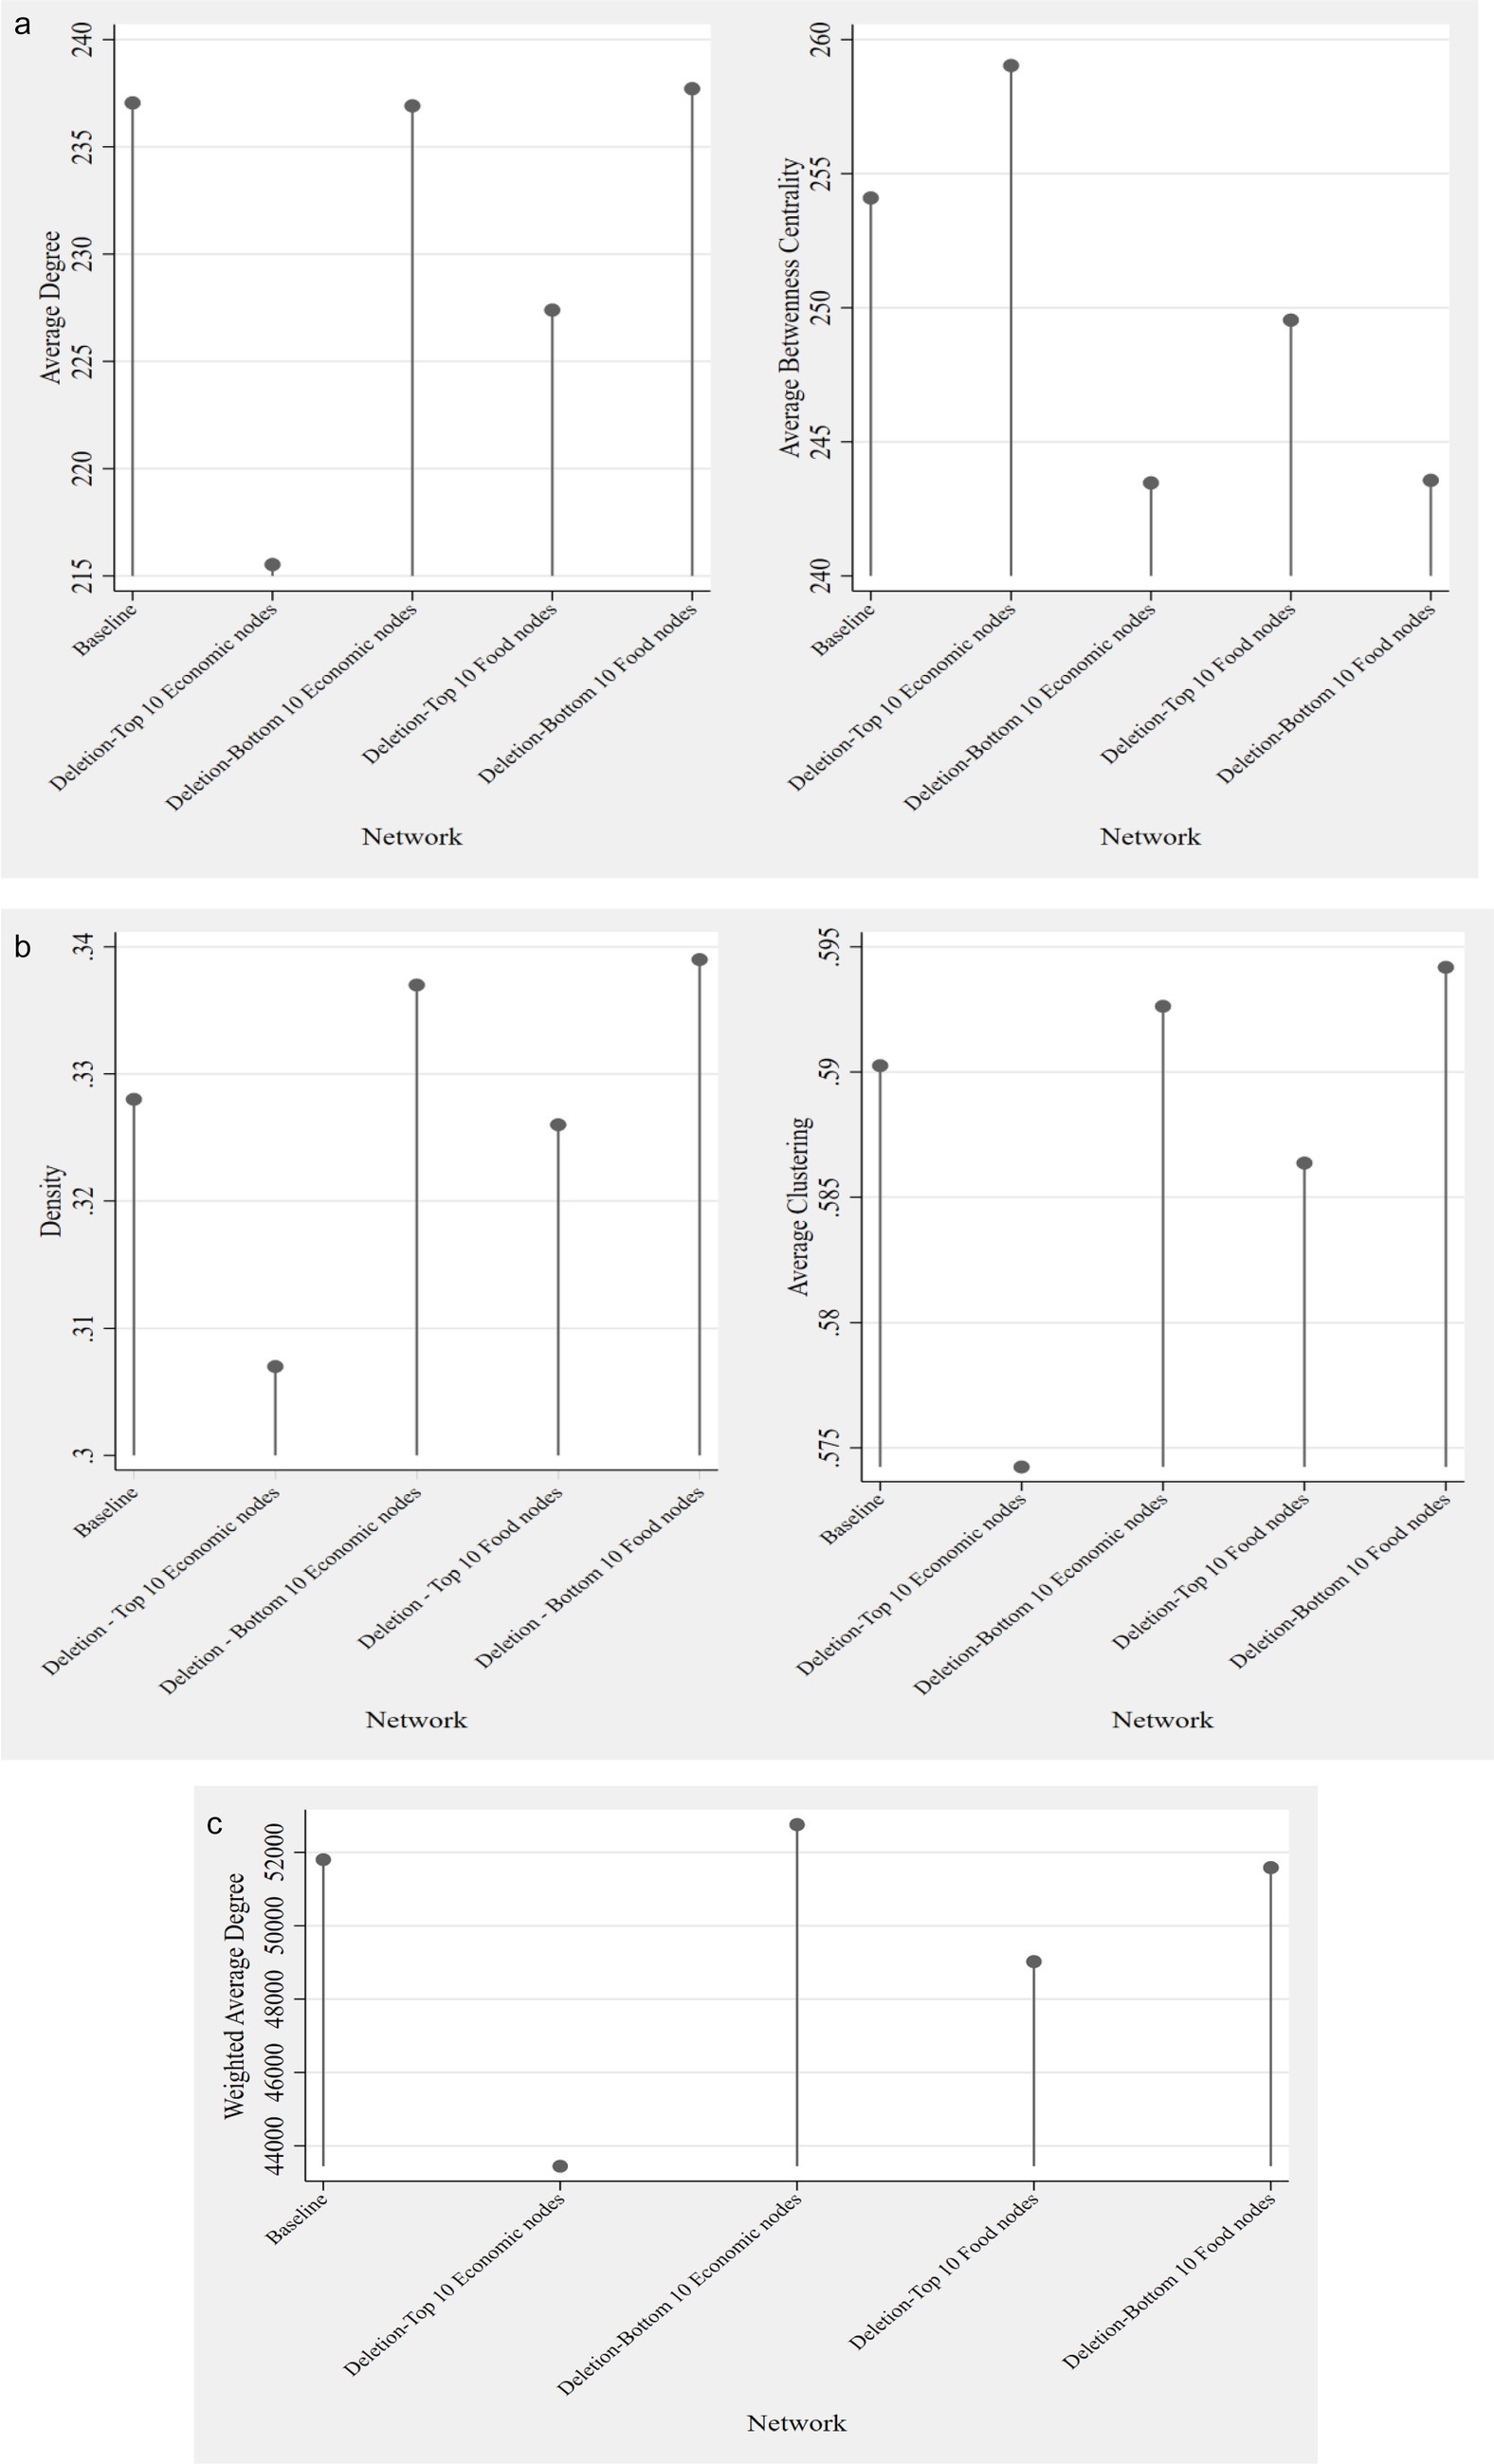
Figure 8. (a) Impact of node deletion on the average degree (left) and average betweenness centrality (right) of the overall economic network. (b) Impact of node deletion on the density(left) and average clustering (right) of the overall economic network. (c) Impact of node deletion on the average weighted degree of the overall economic network.
We also find that betweenness centrality is affected but has a reverse relationship with the node deletion scenarios described above indicating that influences on the many smaller sectors that act as bridges to other sectors are more likely result in cascading effects. Both deletion scenarios demonstrate different types of fragility in the overall food and total economic system. In general, we expect that the impact of a shock to a system defined by a network of interconnected nodes would not be linear as the direction of the impact clearly depends on the place of each node in the network. However, the larger point remains that a shock in the form of node deletion is likely to disrupt the system resilience and ultimately its outcome.
As presented in Table 3, overall, the results show that dropping a node (sector) is likely to decrease the system’s overall outcome (as measured in Equation 13). Compared to the baseline, deleting the bottom 10 economic nodes decreased the production outcome of the overall system by 0.9 percent. When considering only the food sectors, removing the top food nodes produced the largest drop in production outcome: 3.6% demonstrating the overall economic system’s reliance on the food system. In comparison, deletion of the bottom 10 food nodes led to a 0.75 percent decrease in the production outcome.
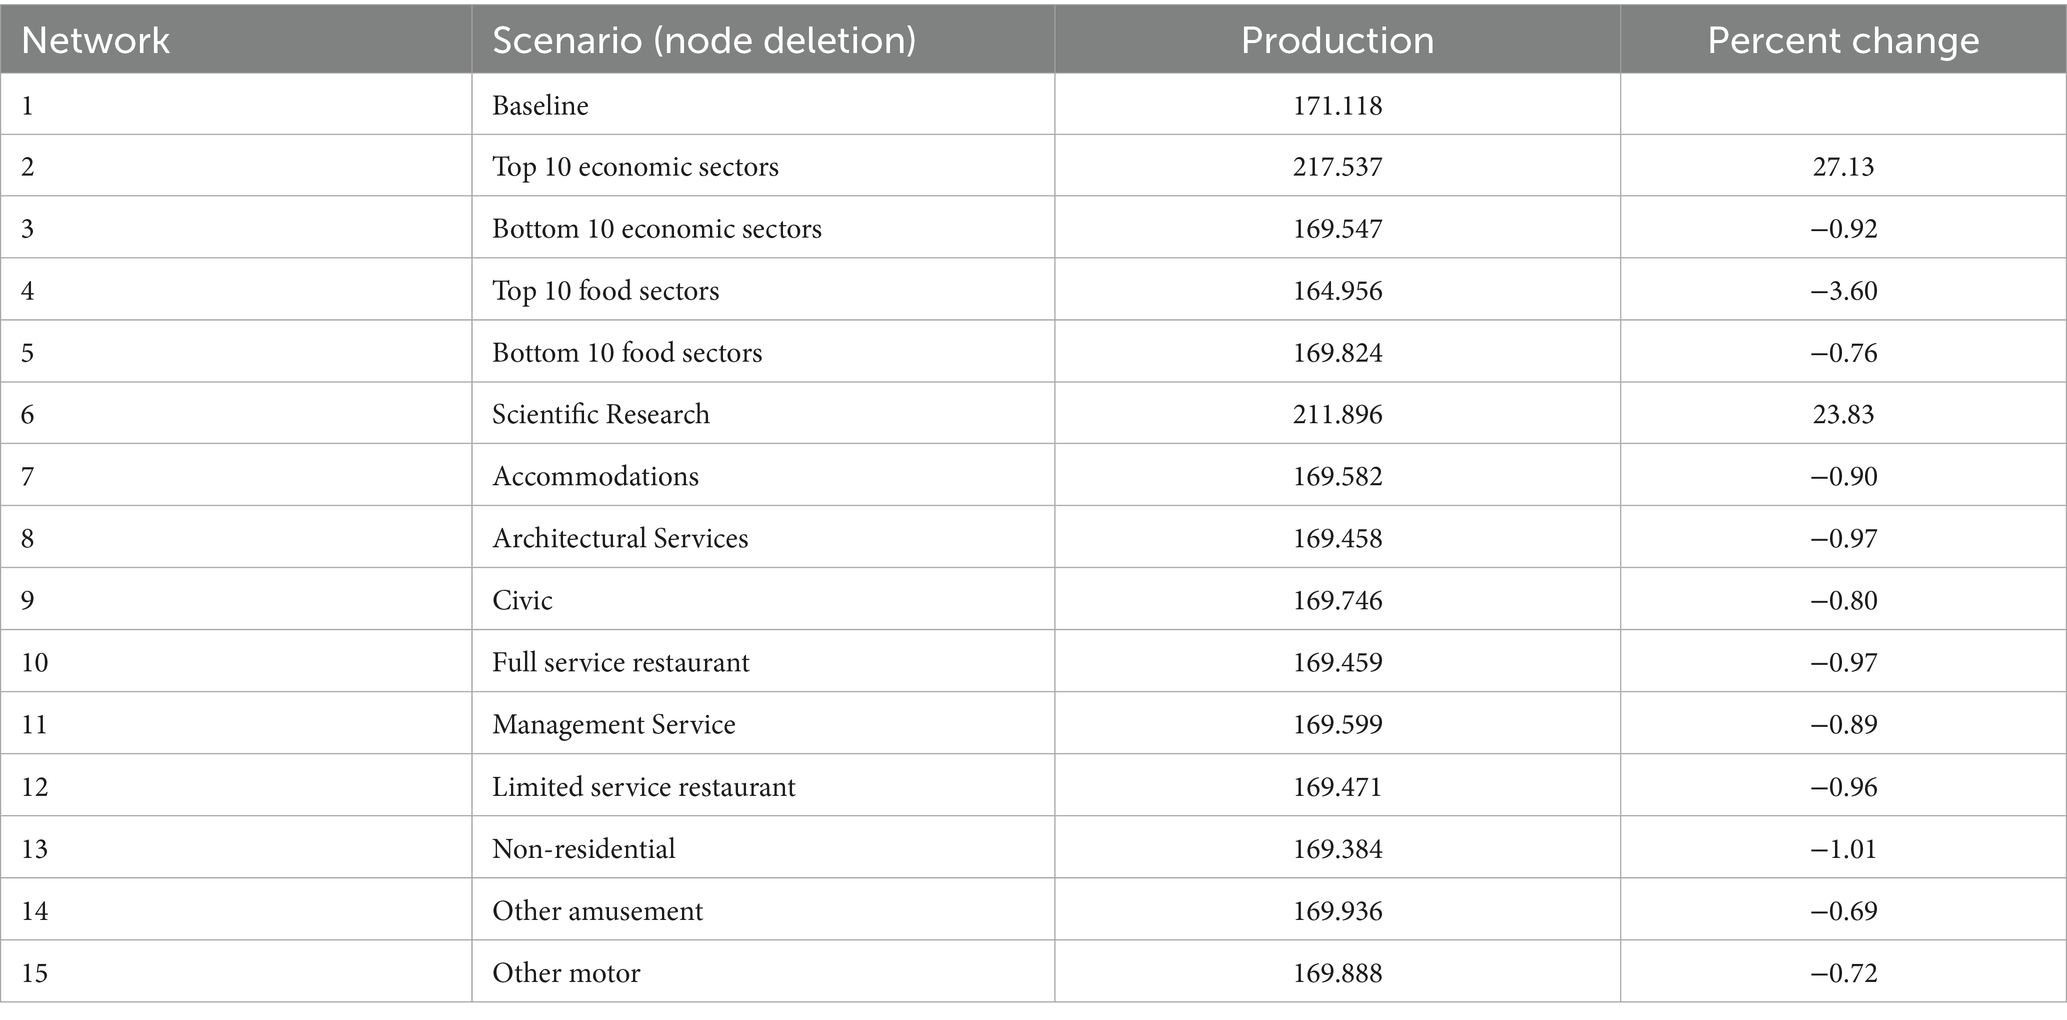
Table 3. Impact of nodes deletion on production of overall economic system.
Paradoxically, we also find that deleting the top 10 economic nodes increased production outcome of the overall network relative to baseline by 27% (Table 3). In disaggregating these sectors, we show that only the “Scientific research” sector is related to such increases in production, with a 24% increase. This sector is also the only top 10 sector whose outdegree value is higher than its indegree value, likely because relatively few “research and development” dollars can result in major innovation and economic returns. In this sense, “Scientific research” is an amplifier of economic returns for the entire system. In explanation, deleting central nodes in a network can disrupt the flow of funding, isolating sections of the network, and making them appear as though the remaining nodes are receiving more input and producing more output than before.
Impact of evaluating the food system in isolation
Next, we compare the impact of analyzing resilience based on a truncated food system to further demonstrate the value of considering food system dynamics more wholistically within the full economic system. We present the truncated food system in Table 4, showing the impact of removing non-food sectors from the economy. Using the US 2012 I-O table, truncation leads to a reduction of the weighted values of incoming and outgoing connections by 53.0 and 21.6%, respectively. This is a dramatic change in food system network functionality would render inaccurate any finding drawn from evaluating the food system in isolation of the rest of the economic system. The most affected sectors include “All other food and drinking places,” “Breweries,” “Farm machinery and equipment manufacturing,” “Food and beverage stores” and “Full-service restaurants”.
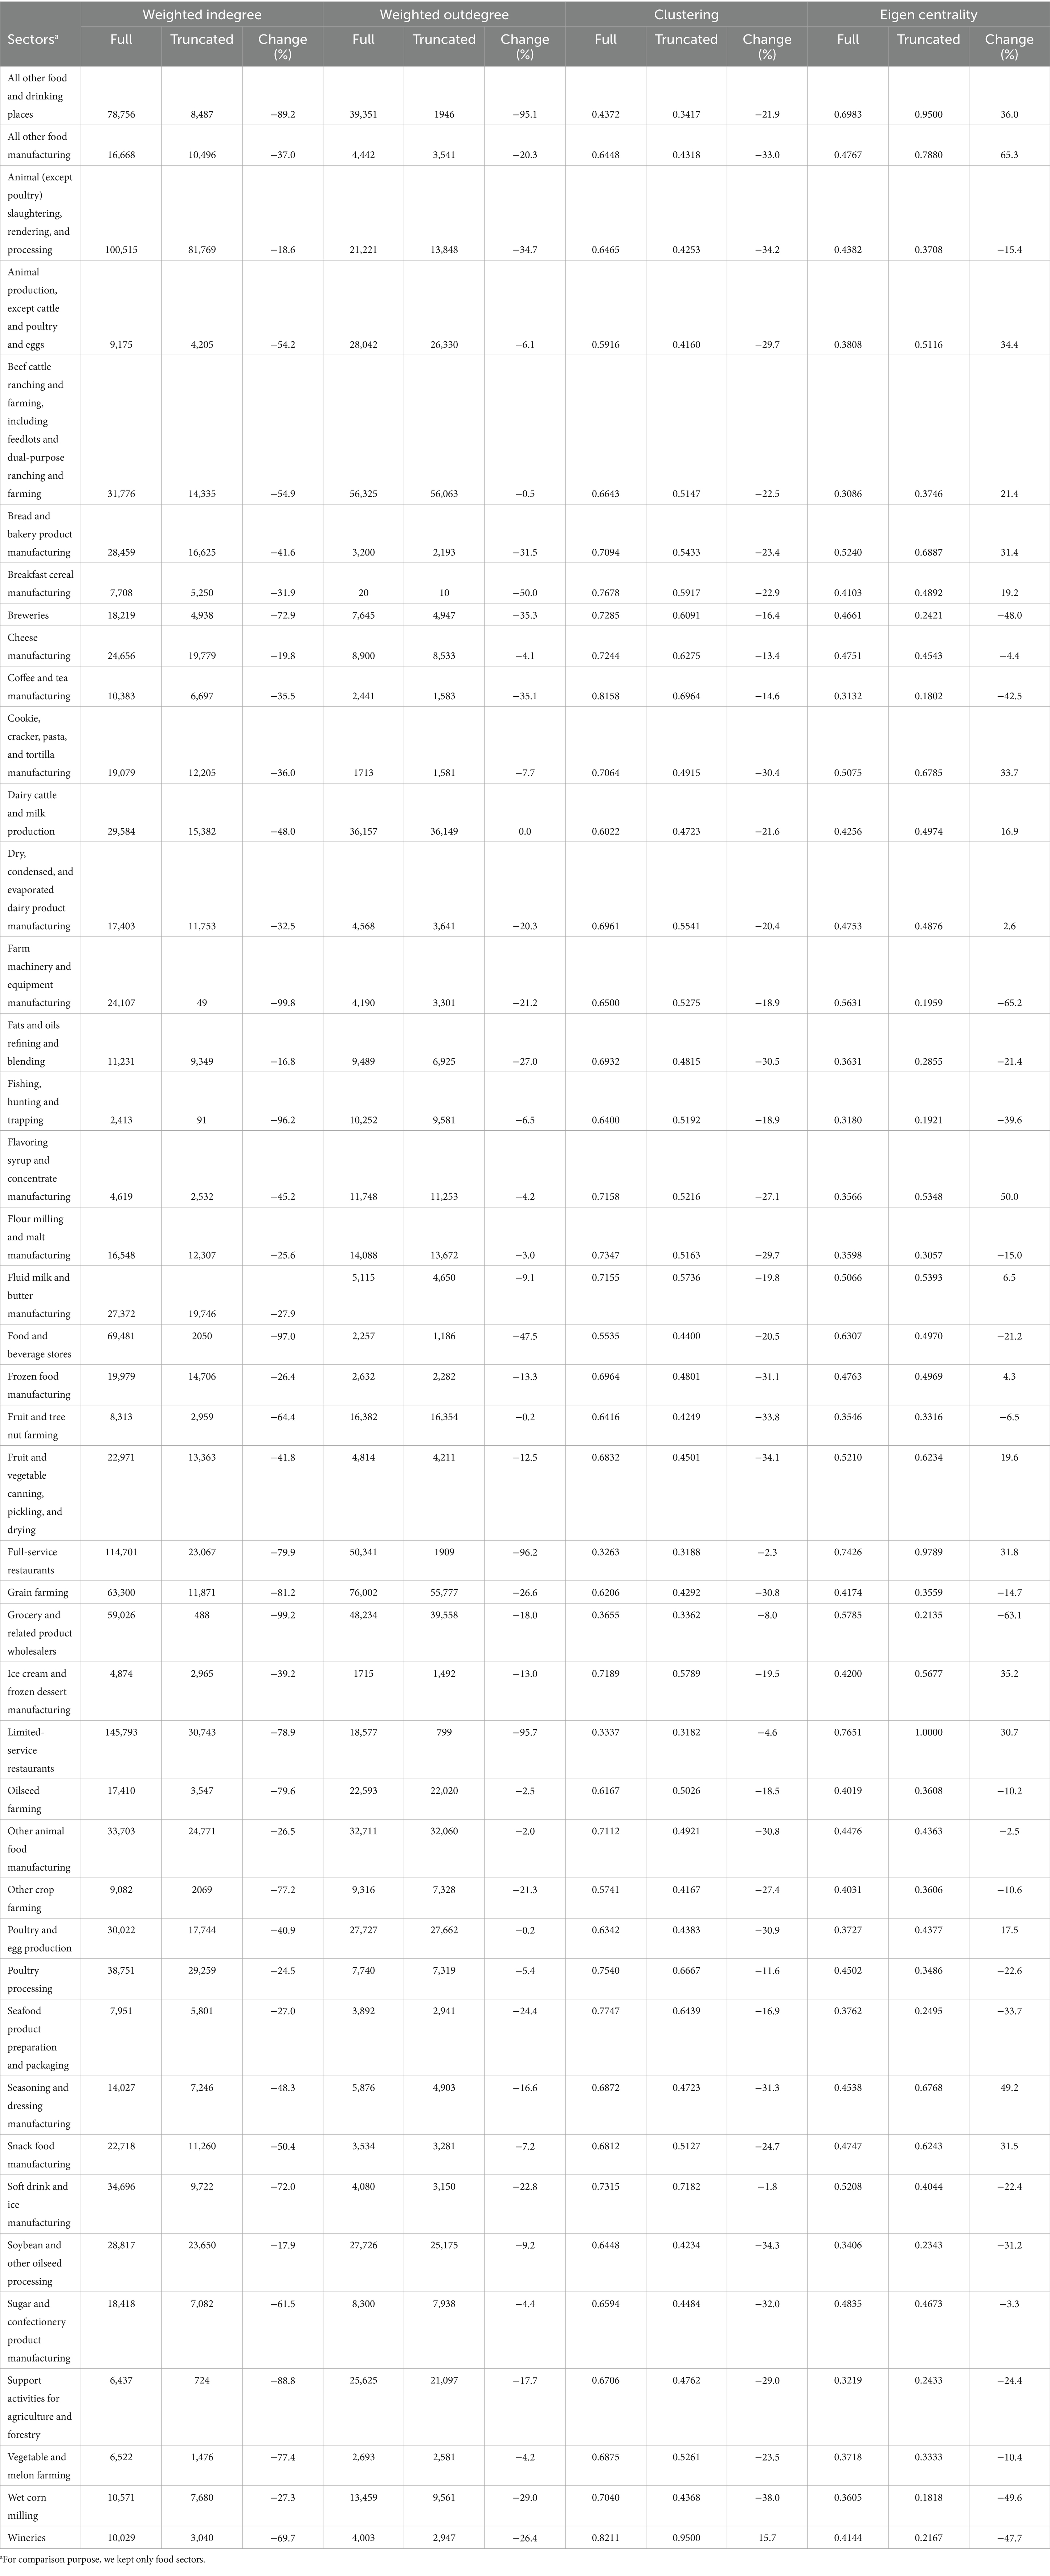
Table 4. Comparing 2012 food network measures between full and truncated food systems.
As expected, truncation also affects the clustering of the food system which is reduced by 22.5% on average. Except for “Wineries” whose clustering coefficient increases by 15.1%, all the other sectors experience reduction in their clustering coefficient. The top five sectors most affected include: “Fruit and tree nut farming” (−33.8%), “Fruit and vegetable canning, pickling, and drying” (−34.1%), “Animal (except poultry) slaughtering, rendering, and processing” (−34.2%), “Soybean and other oilseed processing” (−34.3%), and “Wet corn milling” (−38.0%). Such changes in clustering and centrality likely bias predictions of overall food system function when considering the food system as separate from the overall economic system.
The most striking effect of truncation is on centrality values. As discussed earlier, centrality is used to identify sectors which are critical for both the network performance and resilience. Table 4 shows how the ranking of sectors with respect to their central role in the network shifted as a result of truncation. Out of 43 food sectors, only 5 kept their central ranking (“Limited-service restaurants,” “Full-service restaurants,” “All other food and drinking places,” “Fluid milk and butter manufacturing,” and “Fishing, hunting and trapping”), 18 experienced a decrease in their rankings (for example, “Grocery and related product wholesalers” moved from 5th to 39th position), and 20 climbed in ranking (for example, “Flavoring syrup and concentrate manufacturing” moved from 37th to 12th position). In short, by considering only the food sector, centrality measures become unreliable in terms of capturing the key features and functionality of the food network—including measuring its resilience. These findings add caution to any interpreting the results of any study that uses an incomplete economic system to evaluate performance.
Discussion and conclusion
The primary objective of this research is to assess the resilience of the overall food system to cope with shocks in any of its sectors by considering the food system as nested within the broader network of the overall economic system. Our findings offer caution when interpreting findings from studies that analyze food system dynamics in isolation from the economic system. Specifically, we demonstrated that truncating the food system reduced the weighted values of incoming and outgoing connections by 53.0 and 21.6%, respectively. Moreover, the centrality rankings of food sectors shifted due to truncation, demonstrating that even centrality measures become unreliable when not considering the broader economic context. Such substantial changes render inaccurate any findings if the food system functionality is analyzed in isolation. Future research should take heed and construct models that connect the food system to the broader economic system.
We also draw the conclusion that the resilience of the food system enhances the resilience of the overall economic system based on several strands of empirical evidence. Most notably, between 2007 and 2012—a period that includes the global financial crisis—82.2% of food-related sectors increased in centrality. This indicates that food sectors became more influential and better connected within the broader economic network, suggesting their growing importance in sustaining intersectoral flows during a time of systemic stress. We also show that the volatility of the overall economic system was higher than that of the food system during the 2007–2008 financial crisis, indicating a buffering effect within the nested food system sectors. The lower volatility in the food system compared to the broader economy suggests that the U.S. food system is a stabilizing force in the overall economy. Rather than amplifying volatility, as some central sectors might, the food system appears to have acted as a buffer, helping to preserve the continuity of production across the economic network. Further supporting this conclusion is the simulation of node deletion scenarios. While the most central food sectors are unlikely to ever be fully removed from the economy in a real-world scenario, the simulated removal of the most central food-related sectors—those involved in food retail and processing, for example—generated a 3.6% decline in overall system output. This impact was significantly larger than the decline resulting from the removal of the least central food sectors (0.75%) or the bottom-ranked economic sectors more broadly (0.9%). The fact that the removal of key food sectors resulted in a more substantial systemic loss to the overall economic system underscores the food system’s structural importance and the extent to which other sectors depend on it for their own functioning. This finding is crucial for modeling food system resilience in other countries where economic contexts differ and reliance on food systems for core economic functions may be even greater.
Our findings imply that maintaining food system functionality during crises is not only essential for food security but also contributes to overall macroeconomic stability. Taken together, these findings offer robust evidence that the food system contributes positively to systemic resilience. Its rising centrality during a crisis, the disproportionate impact of its disruption, and its relative stability all point to its essential role not just in food security, but in safeguarding macroeconomic functionality during and after major shocks. Such findings support the prioritization of food system investments in economic recovery planning.
More broadly, our research also found a positive correlation between sector centrality and production, implying that shocks reducing the production of central sectors are likely to propagate and cause system-wide disruption. For example, we show that between 2007 and 2012, the network centrality measures of many sectors changed due to the financial shock; 37% (135) of economic sectors experienced a drop in centrality rankings, while 58% (211) saw an increase. For instance, the centrality increase of food sectors like “breakfast cereal manufacturing” post-2008 mirrors increased consumer demand for lower-cost staples during economic downturns. Conversely, the decline in centrality of retail nodes aligns with income constraints affecting food purchases. Interestingly, the top 25 sectors in the economy remained relatively stable in their centrality rankings, suggesting either the resilience of these core sectors or that they are foundational to the U.S. economy and were thus buffered from the shock. As various sectors within the food system and broader economy continued to consolidate (e.g., Hendrickson et al., 2001; Hendrickson et al., 2020; Howard, 2014; Howard, 2015), networked I-O modeling techniques like those we demonstrate in this research can help show where such centralization will be stabilizing or destabilizing under a variety of shock scenarios. Future studies can also assess how emergency policies that support essential sectors help mitigate shock propagation or further spur centralization and vulnerability.
To this end, our results confirm that the removal of nodes with high centrality measures leads to a decrease in network metrics such as density, clustering, degree, and weighted degree, emphasizing the importance of central nodes in maintaining overall system resilience. These findings underscore the often-overlooked role of natural systems, upon which the food system and economic system draws. Like many studies, this study did not incorporate the many unpriced natural sectors that underpin the overall food and economic system. Should our model be expanded to integrate natural systems into I-O models, the overall assessment could enhance the accuracy of resilience results and help to more accurately model environmental degradation externalities across economic sectors.
On the one hand, high-degree nodes might increase the resilience of a network because these nodes can disperse information or influence to many other nodes in the network. For example, a study by Albert et al. (2000) found that the Internet’s resilience to random failures was due to its scale-free topology, characterized by a few hubs with high outdegree values that can “pick up the slack” when other clusters of nodes fail. On the other hand, these nodes could also decrease network resilience if targeted themselves. If a node with a high outdegree fails or is removed, this could disrupt a significant proportion of the network, as many nodes might depend on the high outdegree node. This idea is supported by a study by Callaway et al. (2000), who found that removing high-degree nodes could cause a rapid disintegration of the network. Nodes with higher outdegree than indegree also play a crucial role in cascading failures. Further, a study by Motter and Lai (2002) demonstrated that the failure of a single node can lead to a cascade of failures in other nodes, particularly in scale-free networks with high-degree nodes. Finally, high out-degree nodes also have a substantial impact on the diffusion process in the network. For instance, Kempe et al. (2003) demonstrated how more central nodes significantly affect the speed and reach of diffusion in social networks. In sum, nodes with a higher outdegree value than an indegree value can both increase and decrease network resilience, depending on the context.
This study uncovered the critical role of “Scientific research” in both the overall economic system and the food system. This sector buffers from shocks in other sectors, but when deleted itself can result in a cascading failure. The finding that a simulated deletion of “Scientific research” results in an overall increase in economic productivity of 24% can be explained with an analogy. If one were to think of funding towards “Scientific research” as the budget for a maintenance department that takes care of a rental property, it is easy to understand how firing the maintenance staff would reduce costs and produce a higher return on investments. Yet, such a decision would ultimately devalue the assets and cut into long term costs. In this sense, as political budget-making leans towards austerity measures, cuts to higher education and similar research sectors may achieve greater economic outcomes, but with depreciation of both the value of the underlying system and its longer-term potential returns.
This research has important implications for economic policy and resilience planning. We demonstrate how policymakers could design strategies that enhance the resilience of both food and non-food sectors, recognizing their interdependence. Going forward, our nested food-economic systems model can aid predictive modeling to test the impacts of localized shocks. For instance, during the COVID-19 pandemic, labor shortages in U.S. meat packing houses likely impacted several other economic sectors. Using our model, such vulnerabilities could be anticipated and managed more effectively during crises. Investments in statistical systems are necessary to build such comprehensive databases that capture the full spectrum of participants and activities within the food system. Identifying vulnerable sectors, populations, and supply chain locations can help target interventions more effectively.
While the primary empirical focus of this study centers on the period surrounding the 2008 financial crisis, the nested food-economic system model is designed for broader application across a wide range of systemic disruptions. Recent events—such as the Ukraine war’s impact on global grain markets (FAO, 2024; Glauber and Laborde Debucquet, 2023), the 2023–2024 El Niño-induced agricultural volatility, and the Red Sea shipping crisis disrupting critical trade flows (Glauber and Mamun, 2024)—illustrate the continuing relevance of a network-based resilience framework. These shocks reinforce the importance of analyzing food system resilience within the broader economic structure, as disruptions in non-food sectors (e.g., shipping, energy, fertilizer) can propagate into food systems with severe consequences. Thus, the insights and simulations in this study are not only historically grounded but also have direct applicability for current and future crisis scenarios. Additionally, countries with significant informal economies likely rely on truncated economic models, leading to biased results similar to those demonstrated in our model of the truncated food system.
Data availability statement
The original contributions presented in the study are included in the article/supplementary material, further inquiries can be directed to the corresponding author.
Author contributions
CB: Conceptualization, Writing – review & editing, Funding acquisition, Writing – original draft, Supervision. JU: Conceptualization, Validation, Writing – original draft, Methodology. SR: Validation, Writing – review & editing, Methodology, Data curation, Visualization, Investigation, Conceptualization.
Funding
The author(s) declare that financial support was received for the research and/or publication of this article. CB and SR were supported by the National Science Foundation CAREER Award (#1750621), “Mapping pathways to food security and sustainable development.”
Conflict of interest
The authors declare that the research was conducted in the absence of any commercial or financial relationships that could be construed as a potential conflict of interest.
Generative AI statement
The authors declare that no Gen AI was used in the creation of this manuscript.
Any alternative text (alt text) provided alongside figures in this article has been generated by Frontiers with the support of artificial intelligence and reasonable efforts have been made to ensure accuracy, including review by the authors wherever possible. If you identify any issues, please contact us.
Publisher’s note
All claims expressed in this article are solely those of the authors and do not necessarily represent those of their affiliated organizations, or those of the publisher, the editors and the reviewers. Any product that may be evaluated in this article, or claim that may be made by its manufacturer, is not guaranteed or endorsed by the publisher.
Footnotes
1. ^This differs from traditional input–output technical coefficients, which normalize these flows by the total inputs or outputs of a sector. In contrast, we preserve the raw monetary transaction values to capture the true magnitude and strength of interdependencies in the economic network. These transaction-based weights are directly embedded in the adjacency matrix W, which is used throughout the analysis.
2. ^In constructing the input–output networks for 2007 and 2012 from the U.S. Bureau of Economic Analysis (BEA) detailed I-O tables (comprising 405 sectors), we undertook the following data cleaning steps:Removal of negative entries: Negative transaction values (arising from adjustments, returns, or imputed transactions in I-O tables) were excluded, as they can distort the representation of positive economic flows in a network model.Exclusion of isolated nodes: Nodes (sectors) that had no incoming or outgoing financial transactions (i.e., rows and columns with all zeros) were removed, as they represent non-participating sectors within the active economic network in the specified year.Food industry nodes: Using NAICS codes, we identified 43 nodes as food-system related in both 2007 and 2012 networks. This classification includes agricultural production, food processing, distribution, retail, and related services (e.g., restaurants).These steps ensure an analytically tractable and representative economic network where each node has economic activity. Removing inactive or anomalous nodes improves network robustness and the interpretability of results, especially under simulations like node deletion.
3. ^PC = n*(n−1)/2, where n is the number of nodes in the network.
4. ^Production value, is the total value of goods and services measured in USD.
5. ^Metric defined in Equation 14 assuming = 1 (see Supplementary material).
References
Acemoglu, D., Carvalho, V. M., Ozdaglar, A., and Tahbaz‐Salehi, A. (2017).“The network origins of aggregate fluctuations,” in The Oxford handbook of the economics of networks. eds. Y. Bramoullé, A. Galeotti, and B. Rogers (Oxford, UK: Oxford University Press). doi: 10.1093/oxfordhb/9780199948277.013.24
Acemoglu, D., Carvalho, V. M., Ozdaglar, A., and Tahbaz-Salehi, A. (2012). The network origins of aggregate fluctuations. Econometrica 80, 1977–2016. doi: 10.3982/ECTA9623
Acemoglu, D., and Guerrieri, V. (2008). Capital deepening and nonbalanced economic growth. J. Polit. Econ. 116, 467–498. doi: 10.1086/589523
Acemoglu, D., Ozdaglar, A., and Tahbaz-Salehi, A. Networks, shocks, and systemic risk. The Oxford Handbook of the Economics of Networks 568–608 (2016).
Albert, R., Jeong, H., and Barabási, A. L. (2000). Error and attack tolerance of complex networks. Nature 406, 378–382. doi: 10.1038/35019019
Avelino, A. F. T., and Hewings, G. J. D. (2019). The Challenge of Estimating the Impact of Disasters: Many Approaches, Many Limitations and a Compromise. Advances in Spatial and Economic Modeling of Disaster Impacts. Advances in Spatial Science. eds. Y. Okuyama and A. Rose (Cham: Springer). doi: 10.1007/978-3-030-16237-5_7
Brinkley, C., Ulimwengu, J., and Raj, S. Real and simulated shocks to the food system: a nested food-economic system model for assessing resilience using a networked Input-Output approach. Frontiers in Sustainable Food Systems, 9:1608981. doi: 10.3389/fsufs.2025.1608981
Burkholz, R., and Schweitzer, F. (2019). International crop trade networks: the impact of shocks and cascades. Environmental research letters, 14, 114013. doi: 10.1088/1748-9326/ab4864
Callaway, D. S., Newman, M. E., Strogatz, S. H., and Watts, D. J. (2000). Network robustness and fragility: percolation on random graphs. Phys. Rev. Lett. 85, 5468–5471. doi: 10.1103/PhysRevLett.85.5468
Carvalho, V. M. (2014). From micro to macro via production networks. J. Econ. Perspect. 28, 23–48. doi: 10.1257/jep.28.4.23
Carvalho, V., and Voigtländer, N. (2014). Input diffusion and the evolution of production networks. doi: 10.3386/w20025
Cohen, R., Erez, K., ben-Avraham, D., and Havlin, S. (2001). Breakdown of the internet under intentional attack. Phys. Rev. Lett. 86, 3682–3685. doi: 10.1103/PhysRevLett.86.3682
Contreras, M. G., and Fagiolo, G. (2014). Propagation of economic shocks in input-output networks: a cross-country analysis. Phys. Rev. E 90:062812. doi: 10.1103/PhysRevE.90.062812
Cottrell, R. S., Nash, K. L., Halpern, B. S., Remenyi, T. A., Corney, S. P., Fleming, A., et al. (2019). Food production shocks across land and sea. Nat Sustain 2, 130–137. doi: 10.1038/s41893-018-0210-1
Davis, K. F., Downs, S., and Gephart, J. A. (2021). Towards food supply chain resilience to environmental shocks. Nature Food 2, 54–65. doi: 10.1038/s43016-020-00196-3
Deng, K., Zhao, H., and Li, D. (2007). Effect of node deleting on network structure. Phys. A Stat. Mech. Appl. 379, 714–726. doi: 10.1016/j.physa.2007.02.039
Dietzenbacher, E., and Los, B. (1997). Structural decomposition techniques: sense and sensitivity. Econ. Syst. Res. 25, 307–323. doi: 10.1080/09535319800000023
Ericksen, P. J. (2008). Conceptualizing food systems for global environmental change research. Glob. Environ. Chang. 18, 234–245. doi: 10.1016/j.gloenvcha.2007.09.002
FAO (2024). The global report on food crises 2024. Global Report on Food Crises (GRFC) 2024 | World Food Programme
Finnoff, D., and Tschirhart, J. (2008). Linking dynamic economic and ecological general equilibrium models. Resour. Energy Econ. 30, 91–114. doi: 10.1016/j.reseneeco.2007.08.005
Gabaix, X. (2011). The granular origins of aggregate fluctuations. Econometrica 79, 733–772. doi: 10.3982/ECTA8769
Gephart, J. A., and Pace, M. L. (2015). Structure and evolution of the global seafood trade network. Environ. Res. Lett. 10:125014. doi: 10.1088/1748-9326/10/12/125014
Glauber, J., and Mamun, A. (2024) Impacts of Red Sea shipping disruptions on global food security. IFPRI blog: issue post. markets, trade, and institutions
Glauber, J. W., and Laborde Debucquet, D. (Eds.) (2023). The Russia-Ukraine conflict and global food security. Washington, DC: International Food Policy Research Institute (IFPRI).
Haimes, Y. Y. (2009). On the complex definition of risk: A systems‐based approach. Risk Analysis: An International Journal, 29, 1647–1654.
Hallegatte, S. (2008). An adaptive regional input-output model and its application to the assessment of the economic cost of Katrina. Risk Anal. 28, 779–799. doi: 10.1111/j.1539-6924.2008.01046.x
Hawkes, C. (2009). Identifying innovative interventions to promote healthy eating using consumption-oriented food supply chain analysis. J. Hunger Environ. Nutr. 4, 336–356. doi: 10.1080/19320240903321243
Headey, D. (2011). Rethinking the global food crisis: the role of trade shocks. Food Policy 36, 136–146. doi: 10.1016/j.foodpol.2010.10.003
Hendrickson, M., Heffernan, W. D., Howard, P. H., and Heffernan, J. B. (2001). Consolidation in food retailing and dairy. Br. Food J. 103, 715–728. doi: 10.1108/00070700110696742
Hendrickson, M. K., Howard, P. H., Miller, E. M., and Constance, D. H. (2020). The food system: Concentration and its impacts. A Special Report to the Family Farm Action Alliance, vol. 26, pp. 1–26.
Horowitz, K. J., and Planting, M. A. (2006) Concepts and methods of the us input-output accounts. No. 0066. Bureau of Economic Analysis.
Howard, P. H. (2015). Intellectual property and consolidation in the seed industry. Crop Sci. 55, 2489–2495. doi: 10.2135/cropsci2014.09.0669
Howard, P. H. (2014). “Too big to ale? Globalization and consolidation in the beer industry” in The geography of beer: Regions, environment, and societies. eds. M. Patterson and N. Hoalst-Pullen (Dordrecht: Springer Netherlands), 155–165. doi: 10.1007/978-94-007-7787-3_14
Howells, T. F. III, Morgan, E. T., and Ross, C. W. (2018). Improved Estimates of the Industry Economic Accounts: Results of the 2018 Comprehensive Update. Survey of Current Business, 98.
Huang, I. Y., Forero, O. A., Wagner-Medina, E. V., Florez Diaz, H., Tremma, O., Fargetton, X., et al. (2025). Resilience of food supply systems to sudden shocks: a global review and narrative synthesis. Glob. Food Secur. 44. doi: 10.1016/j.gfs.2025.100842
Inoue, H., and Todo, Y. (2019). Firm-level propagation of shocks through supply-chain networks. Nat. Sustain. 2, 841–847. doi: 10.1038/s41893-019-0351-x
Karakoc, D. B., and Konar, M. (2021). A complex network framework for the efficiency and resilience trade-off in global food trade. Environ. Res. Lett. 16:105003. doi: 10.1088/1748-9326/ac1a9b
Kempe, D., Kleinberg, J., and Tardos, É. (2003). Maximizing the spread of influence through a social network. In Proceedings of the ninth ACM SIGKDD international conference on Knowledge discovery and data mining (137–146).
Kinzig, A. P., Ryan, P., Etienne, M., Allison, H., Elmqvist, T., and Walker, B. H. (2006). Resilience and regime shifts: assessing cascading effects. Ecol. Soc. 11:20. doi: 10.5751/ES-01678-110120
Koks, E. E., and Thissen, M. (2016). A multiregional impact assessment model for disaster analysis. Econ. Syst. Res. 28, 429–449. doi: 10.1080/09535314.2016.1232701
Konar, M., Lin, X., Ruddell, B., and Sivapalan, M. (2018). Scaling properties of food flow networks. PLoS One 13:e0199498. doi: 10.1371/journal.pone.0199498
Laber, M., Klimek, P., and Bruckner, M. (2023). Shock propagation from the Russia–Ukraine conflict on international multilayer food production network determines global food availability. Nat Food 4, 508–517. doi: 10.1038/s43016-023-00771-4
Leontief, W. (1949). Structural matrices of national economies. Econometrica 17:273. doi: 10.2307/1907314
Lin, X., Dang, Q., and Konar, M. (2014). A network analysis of food flows within the United States of America. Environ. Sci. Technol. 48, 5439–5447. doi: 10.1021/es500471d
Lin, X., Ruess, P. J., Marston, L., and Konar, M. (2019). Food flows between counties in the United States. Environ. Res. Lett. 14:084011. doi: 10.1088/1748-9326/ab29ae
Magoni, D. (2003). Tearing down the internets. IEEE J. Sel. Areas Commun. 21, 949–960. doi: 10.1109/JSAC.2003.814364
Matson, P. A., Parton, W. J., Power, A. G., and Swift, M. J. (1997). Agricultural intensification and ecosystem properties. Science 277, 504–509. doi: 10.1126/science.277.5325.504
Miller, R. E., and Blair, P. D. (2009). Input-output analysis: foundations and extensions. Cambridge, UK: Cambridge University Press.
Motter, A. E., and Lai, Y. C. (2002). Cascade-based attacks on complex networks. Phys. Rev. E 66:065102. doi: 10.1103/PhysRevE.66.065102
Ouyang, M., and Dueñas-Osorio, L. (2012). Time-dependent resilience assessment and improvement of urban infrastructure systems. Chaos 22:033122. doi: 10.1063/1.4737204
Pingali, P., Alinovi, L., and Sutton, J. (2005). Food security in complex emergencies: enhancing food system resilience. Disasters 29, S5–S24. doi: 10.1111/j.0361-3666.2005.00282.x
Piters, B., Termeer, E., Bakker, D., Fonteijn, H., and Brouwer, H. (2021) Food system resilience towards a joint understanding and implications for policy. Wageningen economic research | policy paper
Revoredo-Giha, C., and Dogbe, W. (2023). A resilience analysis of the contraction of the accommodation and food service sector on the Scottish food industry. Front. Sustain. Food Syst. 7. doi: 10.3389/fsufs.2023.1095153
Rocha Aponte, F. (2024). Economic interdependencies and sectoral impacts: an input–output analysis of the Norwegian fisheries and aquaculture sector amidst COVID 19. Fish. Res. 281:107247. doi: 10.1016/j.fishres.2024.107247
Soane, I. D., Scolozzi, R., Gretter, A., and Hubacek, K. (2012). Exploring panarchy in alpine grasslands: an application of adaptive cycle concepts to the conservation of a cultural landscape. Ecol. Soc. 17. doi: 10.5751/ES-05085-170318
Sobal, J., Kettel Khan, L., and Bisogni, C. (1998). A conceptual model of the food and nutrition system. Soc. Sci. Med. 47, 853–863. doi: 10.1016/S0277-9536(98)00104-X
Taschereau-Dumouchel, M. (2019). Cascades and fluctuations in an economy with an endogenous production network. The Review of Economic Studies, 2025:rdaf036. doi: 10.1093/restud/rdaf036
Tendall, D. M., Joerin, J., Kopainsky, B., Edwards, P., Shreck, A., Le, Q. B., et al. (2015). Food system resilience: defining the concept. Glob. Food Secur. 6, 17–23. doi: 10.1016/j.gfs.2015.08.001
Tu, C., Suweis, S., and D’Odorico, P. (2019). Impact of globalization on the resilience and sustainability of natural resources. Nat. Sustain. 2, 283–289. doi: 10.1038/s41893-019-0260-z
Van Apeldoorn, D. F., Kok, K., Sonneveld, M. P. W., and Veldkamp, T. A. (2011). Panarchy rules: rethinking resilience of agroecosystems, evidence from Dutch dairy-farming. Ecol. Soc. 16. Avaliable online at: https://www.jstor.org/stable/26268873
Walker, B., Vo, I. D., Beecher, M., and Clancy, C. (2009) A demonstration of the mesh test wireless testbed. 5th International Conference on Testbeds and Research Infrastructures for the Development of Networks & Communities and Workshops, Washington, DC, USA, pp. 1.
Watson, P., Cooke, S., Kay, D., Alward, G., and Morales, A. (2017). A method for evaluating the economic contribution of a local food system. J. Agric. Resour. Econ. 42, 180–194. Available online at: https://www.jstor.org/stable/44329749
Keywords: food system resilience, networked input–output, nested food-economic resilience model, economic shock, complex systems
Citation: Brinkley C, Ulimwengu J and Raj S (2025) Real and simulated shocks to the food system: a nested food-economic system model for assessing resilience using a networked input–output approach. Front. Sustain. Food Syst. 9:1608981. doi: 10.3389/fsufs.2025.1608981
Edited by:
Ze Wang, Capital Normal University, ChinaReviewed by:
Nanfei Jia, Beijing Technology and Business University, ChinaJunjie Li, Institute of Agricultural Resources and Regional Planning (CAAS), China
Copyright © 2025 Brinkley, Ulimwengu and Raj. This is an open-access article distributed under the terms of the Creative Commons Attribution License (CC BY). The use, distribution or reproduction in other forums is permitted, provided the original author(s) and the copyright owner(s) are credited and that the original publication in this journal is cited, in accordance with accepted academic practice. No use, distribution or reproduction is permitted which does not comply with these terms.
*Correspondence: Catherine Brinkley, Y2ticmlua2xleUB1Y2RhdmlzLmVkdQ==