 Ying Zhang
 Muhammad Irshad Ahmad
 Qiong Shen
 Muhammad Waseem Boota
 Cuiping Zhao
 Hengyun Ma
- 1College of Economics and Management, Henan Agricultural University, Zhengzhou, China
- 2School of Politics and Public Administration, Zhengzhou University, Zhengzhou, China
- 3Business School, Zhengzhou University, Zhengzhou, China
- 4College of Geography and Environmental Science, Henan University, Kaifeng, China
A corrigendum on
Unveiling the environmental impact of corn production in China: evidence from panel ARDL approach
by Zhang, Y., Ahmad, M. I., Shen, Q., Boota, M. W., Zhao, C., and Ma, H. (2025). Front. Sustain. Food Syst. 8:1492262. doi: 10.3389/fsufs.2024.1492262
In the published article, there was an error in Figure 6 [Figure 6. Patterns of pesticide, fertilizer, and agricultural water consumption from 1990 to 2022 (source: authors calculation)] and Figure 7 [Figure 7. Patterns of agricultural GDP, agricultural credit and temperature from 1990 to 2022 (source: authors calculation)] as published, where Jiangsu and Anhui provinces were mistakenly included in these figures which were not part of our study. The corrected Figures 6, 7 and their captions appear below.

Figure 6. Patterns of pesticide use, fertilizer use, and agricultural water consumption in major agricultural provinces of China from 1990 to 2022. The red color represents the annual pesticide use (tons), the green color represents the annual fertilizer use (ten thousand tons), and the purple color represents the annual agricultural water use (hundred million cubic meters). Darker shades indicate higher levels of use in each category across three periods: 1990–2000, 2001–2010, and 2011–2022.
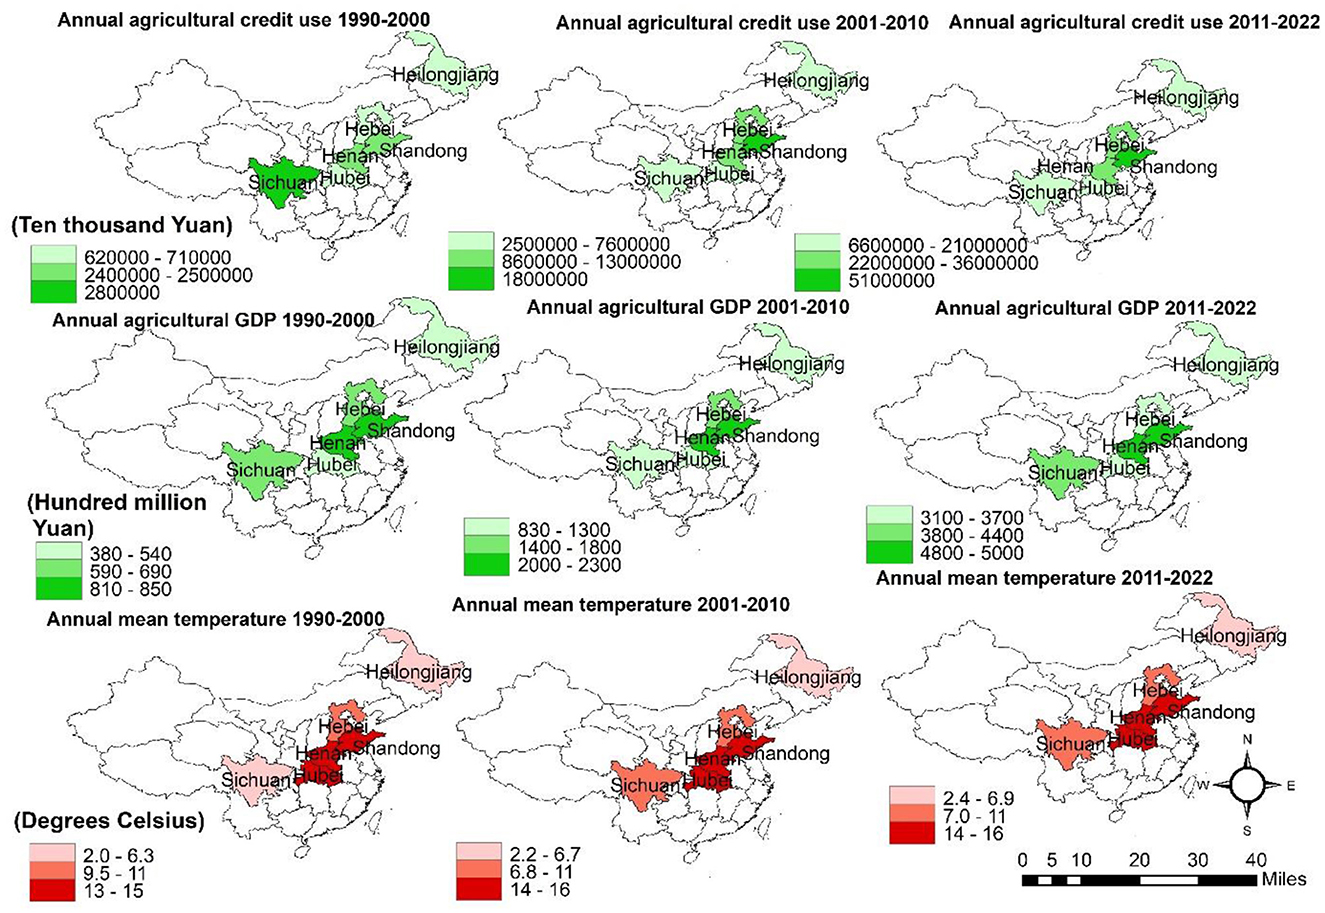
Figure 7. Patterns of agricultural credit use, agricultural GDP, and annual mean temperature in major agricultural provinces of China from 1990 to 2022. The green color represents the annual agricultural credit use (Ten Thousand Yuan) and agricultural GDP (Hundred million Yuan), while the red color represents the annual mean temperature (degrees Celsius). Darker shades indicate higher values of credit, GDP, and temperature across three periods: 1990–2000, 2001–2010, and 2011–2022.
The authors apologize for this error and state that this does not change the scientific conclusions of the article in any way. The original article has been updated.
Publisher's note
All claims expressed in this article are solely those of the authors and do not necessarily represent those of their affiliated organizations, or those of the publisher, the editors and the reviewers. Any product that may be evaluated in this article, or claim that may be made by its manufacturer, is not guaranteed or endorsed by the publisher.
Keywords: agricultural credit, agricultural input, carbon emissions, climate change, corn production
Citation: Zhang Y, Ahmad MI, Shen Q, Boota MW, Zhao C and Ma H (2025) Corrigendum: Unveiling the environmental impact of corn production in China: evidence from panel ARDL approach. Front. Sustain. Food Syst. 9:1610031. doi: 10.3389/fsufs.2025.1610031
Received: 11 April 2025; Accepted: 28 April 2025;
Published: 14 May 2025.
Edited and reviewed by: Rajiv Kumar Srivastava, Texas A and M University, United States
Copyright © 2025 Zhang, Ahmad, Shen, Boota, Zhao and Ma. This is an open-access article distributed under the terms of the Creative Commons Attribution License (CC BY). The use, distribution or reproduction in other forums is permitted, provided the original author(s) and the copyright owner(s) are credited and that the original publication in this journal is cited, in accordance with accepted academic practice. No use, distribution or reproduction is permitted which does not comply with these terms.
*Correspondence: Muhammad Irshad Ahmad, bWlhaG1hZEB6enUuZWR1LmNu