 Yongqing Ben
 Yu'e Zhang3
- 1College of Agriculture, Yangzhou University, Yangzhou, Jiangsu, China
- 2School of Law, Yangzhou University, Yangzhou, Jiangsu, China
- 3School of Business, Yangzhou University, Yangzhou, Jiangsu, China
Introduction: Reconciling food security with economic development amid rapid industrialization and urbanization presents a critical global challenge. This study investigates the spatiotemporal dynamics of grain production and its spatial interaction with economic development in Jiangsu Province, China—an economically advanced region exemplifying this tension.
Methods: We integrate the Gini coefficient, concentration index, standard deviational ellipse, spatial exploratory analysis (global/local Moran's I), and a Spatial Durbin Model (SDM) to quantify spatial differentiation patterns and spillover effects.
Results: (1) Pronounced spatial polarization emerged: Northern Jiangsu consolidated as a High-High grain production cluster, while Southern Jiangsu evolved into a Low-Low cluster. The spatial divergence between economic and grain production centroids expanded to 125.4 km. (2) Spatial econometrics confirmed localized suppression of grain output by economic development, alongside positive spillovers to neighboring regions—validating core-periphery complementarity. Urbanization drove sown area contraction via labor migration and cropland conversion. (3) Cultivated land endowment and rural labor were fundamental pillars of food security. Industrial restructuring indirectly enhanced production through land efficiency gains.
Discussion: The findings validate core-periphery theory and reveal complex spatial spillovers. Policy prescriptions include: spatial governance mechanisms coordinating regional specialization; industrial feedback systems reinvesting economic gains into agriculture; a Technology-Driven Resource Breakthrough strategy; and institutional safeguards for cropland. This establishes a replicable paradigm for food security-economic growth synergies in developing economies.
1 Introduction
1.1 Research background
Amid the global waves of industrialization and urbanization, balancing the strategic imperative of national grain security against the expansion of economic territories has become a critical challenge testing the development resilience of nations worldwide. China, as the world's second-largest economy, achieved an economic growth miracle averaging over 9% annually, following its WTO accession in 2001. However, this was accompanied by a sharp decline in arable land resources (a national reduction of 8.33 million hectares from 2001 to 2024) and a pronounced trend of “northward shift and central expansion” in grain production (Liu et al., 2010). During this process, the traditional “South-to-North Grain Transfer” pattern has gradually been replaced by “North-to-South Grain Transfer” (Cheng and Zhang, 2005), reflecting a dynamic restructuring of regional comparative advantages. Yet, it also exposes the risk of spatial fragmentation between zones of economic agglomeration and core grain-producing areas. Resolving the conflict between these “economic highlands” and “grain production lowlands” to achieve spatial synergy has thus emerged as a vital issue for the nation's sustainable development.
Jiangsu Province, embodying dual roles as a major economic powerhouse and a significant grain-producing region in China, offers unique research value for addressing this issue: (1) It exhibits a distinct internal economic gradient. In 2024, the per capita gross domestic product (GDP) of Southern Jiangsu, Central Jiangsu, and Northern Jiangsu reached CNY 217,000, CNY 162,000, and CNY 104,000 respectively. Conversely, the share of provincial grain production exhibited an inverse distribution (Northern Jiangsu accounting for over 60%; Jiangsu Provincial Bureau of Statistics (2024), forming a natural “Core-Periphery” experimental field; (2) Despite pressure from an average annual expansion of construction land by 2.1% and an urbanization rate exceeding 73% (Long and Zou, 2010), it maintained stability as the fifth-largest grain producer nationally. Its coordination mechanisms hold significant reference value for developing countries. However, existing research predominantly focuses on single driving factors or static analyses (Wang and Xu, 2012), lacking a systematic examination of the spatial interaction mechanisms between economic development and grain production, particularly overlooking spatial spillover effects and regional synergy pathways. This gap results in “spatial blindness” within policy design.
1.2 Theoretical foundations of food security–regional economy nexus
The spatial decoupling of economic agglomeration zones (core) and grain-producing hinterlands (periphery) embodies critical theoretical dynamics in regional development. This phenomenon is grounded in structural transformation theory (Kuznets, 1966), wherein economic growth drives labor migration from agriculture to industry/services, reducing agriculture's GDP share and inducing “agricultural miniaturization” that concentrates grain production in low-opportunity-cost regions. Lewis' dual economy model (1954) further explains how unlimited labor supply from traditional agriculture fuels industrial expansion in core zones, though prolonged labor drain undermines peripheral agricultural productivity. Friedmann's core-periphery theory (1966) reveals how market forces exacerbate regional inequalities through capital/labor siphoning, creating prosperous cores and dependent peripheries. To counter this polarization, that industrial profits must feed back into agriculture during intermediate development stages via subsidies, R&D, and land conservation—rectifying historical exploitation (e.g., price scissors) while safeguarding food security during urbanization. Ultimately, Schultz's traditional agriculture transformation framework (1964) contends that agricultural modernization requires injecting technology, capital, and human capital into peripheries, leveraging efficiency gains from industrial spillovers (e.g., precision farming) to achieve productivity leaps without spatial expansion.
Existing research on the evolution of grain production patterns can be categorized into three perspectives: (1) The resource constraint theory emphasizes the rigid constraints imposed by arable land reduction (Wang and Liu, 2009) and water resource distribution (Yang and Lu, 2008) on grain production. (2) The economic driver theory focuses on the crowding-out effects on agricultural labor caused by non-agricultural employment (Chen, 2007) and urbanization (Ge et al., 2018). (3) The policy response theory explores the regulatory effects of grain subsidies (Liu et al., 2020) and arable land protection systems (Kong et al., 2022). Nevertheless, existing studies suffer from two key limitations: first, methodologically, they often rely on traditional econometric models, neglecting geographical spatial correlations, which can lead to estimation bias (Fu, 2009). Second, theoretically, they simplistically pit economic development against food security, lacking a deconstruction of their synergistic mechanisms (Li and Bian, 2008), making it difficult to explain the “economic-grain” dual-win phenomenon observed in regions such as Jiangsu.
Recent advances in spatial econometrics provide a new pathway to address these bottlenecks. Parent and Lesage (2008) utilized Spatial Durbin Models (SDMs) to reveal the geographical boundaries of knowledge spillovers, and Chen et al. (2022) validated the spatial dependence of soybean production. However, current studies often rely on single adjacency matrices, failing to capture the multidimensional interactions inherent in economic geography (Wang and Ni, 2016). Furthermore, quantitative validation of the “Core-Periphery” structure remains underdeveloped, constraining the explanatory power of the theory against complex realities.
Using Jiangsu Province as a representative case, this study aims to answer three core questions: (1) How does economic agglomeration drive the spatiotemporal differentiation of grain production patterns? (2) Do factors such as urbanization and industrial structure exhibit cross-regional spatial spillovers? (3) Can a compensatory mechanism for synergistic “economic-grain” development be constructed? Potential innovations include:
Theoretical contribution: extending the “Core-Periphery” model to the realm of food security to reveal the spatial complementarity between economic agglomeration zones and core grain-producing areas, challenging traditional “conflict theory” perspectives.
Methodological contribution: constructing a multidimensional spatial weights system incorporating adjacency, economic distance, and nested matrices, and employing effect decomposition to quantify the direct/indirect impacts of driving factors, overcoming limitations of traditional unidimensional analyses.
Policy contribution: proposing a cross-regional eco-compensation scheme featuring “Grain Production in Northern Jiangsu-Replenishment from Southern Jiangsu,” offering a replicable pathway for developing nations to coordinate food security with economic growth.
1.3 Geographic and socioeconomic zoning of Jiangsu Province
1.3.1 Geographic profile
Jiangsu Province is situated in the core area of the Yangtze River Delta on China's eastern coast. Its geographic coordinates span 116°21′-121°56′ East longitude and 30°45′-35°08′ North latitude. Bordered by the Yellow Sea to the east, it straddles the basins of both the Yangtze and Huai Rivers, making it the only province possessing major river estuaries while also lying within a transitional climate zone between North and South China. Dominated by plains (86.89%), Jiangsu has a high water coverage (16.9%) and boasts China's highest river network density (6.4 km/km2).
1.3.2 Socioeconomic divisions and characteristics
1.3.2.1 Challenges for regional coordinated development
North-South gradient disparity: the per capita GDP ratio between Southern and Northern Jiangsu reached 2.19:1 (2022), while the grain production ratio showed an inverse pattern of 1:3.35, reflecting the spatial contest between “economic highlands” and “grain production lowlands” (Table 1).
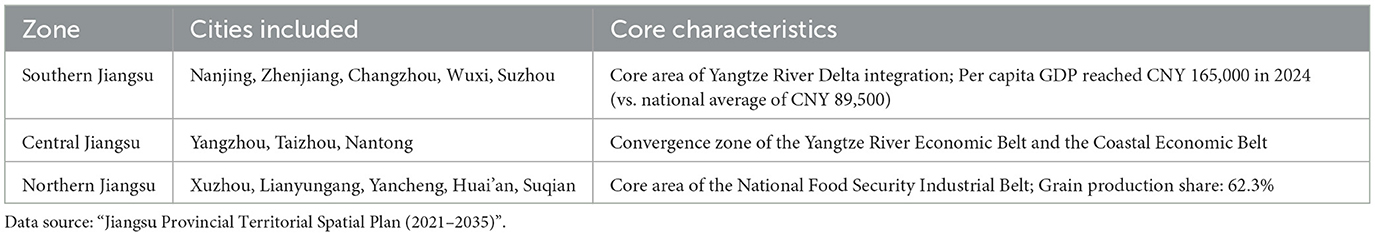
Table 1. Socioeconomic zoning and key characteristics of Jiangsu Province.
Eco-compensation mechanism: leveraging the “Jiangsu Ecological Protection Compensation Ordinance” (implemented in 2023), a cross-regional transaction market for the “balance of occupation and compensation of arable land” based on the “Southern Jiangsu Purchasing-Northern Jiangsu Supplying” principle was established, reaching a transaction volume of 8,000 hectares in 2022.
Land-sea integration strategy: through the “Development Plan for Jiangsu Coastal Areas (2021–2025),” efforts are underway to build Yancheng and Lianyungang into national grain storage bases and new energy industrial belts, seeking to balance ecological protection with food security.
2 Data and methods
2.1 Data
This study leverages panel data from 13 prefecture-level cities in Jiangsu Province, constructing a four-dimensional database that encompasses economic, social, resource, and geospatial indicators to analyze the critical period of economic transition and food security policy evolution following China's WTO accession. Economic and social data were systematically extracted from the China Statistical Yearbook, Jiangsu Statistical Yearbook, and municipal socioeconomic development bulletins, ensuring unified statistical standards across all observational units. Geospatial information was sourced from the National Geomatics Center's 1:4,000,000 vector database, with spatial resolution optimized for provincial-scale analysis. Missing values were addressed through dual imputation techniques to minimize potential bias. To eliminate scale disparities and satisfy the normality assumptions of spatial econometric models, all variables underwent natural logarithmic transformation, effectively mitigating extreme value influences while preserving the distributional integrity of the data.
2.2 Methods
2.2.1 Gini coefficient
Within regional economics, the Locational Gini Index is widely employed to quantify the degree of industrial agglomeration. Its value ranges from 0 to 1. A value approaching 0 indicates a highly uniform spatial distribution of the industry with no significant clustering, while a value approaching 1 signifies high concentration within a single or few core agglomeration zones. The formula is:
where:
G represents the Gini coefficient.
Si,Sj: Share of grain-sown area in total provincial area for regions i and j, respectively.
: Average share of grain-sown area across all regions.
n: Number of regions (n = 13 for Jiangsu's prefecture-level cities).
2.2.2 Concentration ratio (CRn)
To enhance the reliability of the analysis regarding the geographical concentration of grain production in Jiangsu, the industry concentration index (CRn) is introduced. This metric measures the cumulative share of a specific indicator (e.g., grain-sown area, yield) held by the top n regions:
Where:
CRn: concentration ratio for the top n regions.
Si: share of indicator i in the total provincial indicator.
Following the methodology of Ding and Xiao (2018), n is set to 5.
2.2.3 Standard deviational ellipse
The Standard Deviational Ellipse, a classic spatial statistics method (Lefever, 1926), quantifies the directional trend, dispersion, and dynamic evolution of geographic feature distributions. It visually identifies the primary directional spread and centroid migration path of spatial elements. The geometric center of the ellipse represents the centroid location of Jiangsu's grain production. The major axis indicates the dominant orientation of grain production distribution. The minor axis reflects the distributional range. A larger difference between the major and minor axis lengths (i.e., ellipse ellipticity) signifies a stronger directional pattern in grain production (Jiao et al., 2022).
2.2.4 Exploratory spatial data analysis
ESDA is a core methodology for identifying spatial dependence and heterogeneity in geographical phenomena (Anselin, 1995). This study employs Global and Local Moran's I indices to reveal the spatial association patterns of grain production in Jiangsu.
2.2.4.1 Global Moran's I
This index quantifies spatial autocorrelation at the global scale:
where:
I: global Moran's I index.
n: number of cities (13).
Si, Sj: grain-sown area in cities i and j.
: mean grain-sown area across all cities.
wij: element of the spatial weights matrix (adjacency/economic distance/nested).
S0: normalization factor equal to /sum_i /sum_j w_{ij}.
I values range from −1 to 1. I > 0 indicates positive spatial autocorrelation (clustering), I < 0 indicates negative autocorrelation (dispersion), and I ≈ 0 suggests spatial randomness (Fu, 2009).
2.2.4.2 Local Moran's I
This index identifies significant local spatial clusters and classifies their type:
where Ii σ2 is the variance of grain-sown area. Significant clusters (p < 0.05) are classified into four types:
HH: High-High (high value surrounded by high neighbors).
LL: Low-Low (low value surrounded by low neighbors).
HL: High-Low (high value surrounded by low neighbors).
LH: Low-High (low value surrounded by high neighbors).
2.2.4.3 Moran scatter plot visualization
Cities are plotted on a scatter plot with the standardized grain-sown area (Si–S) on the x-axis and the spatial lag (∑wijSj) on the y-axis. This visualization places cities into four quadrants, directly corresponding to the four spatial association types. Combined with LISA cluster maps, this identifies spatial differentiation such as HH contiguity in Northern Jiangsu and LL polarization in Southern Jiangsu.
2.2.5 Spatial weight matrix
Spatial weights matrices define the interconnections and their intensity between units of analysis in spatial panel models. Based on established literature, three primary types are utilized.
2.2.5.1 Adjacency matrix (W1)
Based on geographical contiguity (Wang and Ni, 2016). A binary contiguity matrix was constructed for the 13 cities:
2.2.5.2 Economic distance matrix (W2)
Weight inversely proportional to the economic distance between regions i and j:
where yi and yj represent regional economic development levels (GDP per capita), assigning greater weight to regions with smaller economic disparities (Hu and Liu, 2009; Du and Jin, 2020; Cheng and Wang, 2021).
2.2.5.3 Nested matrix (W3)
Integrates geographical proximity and economic similarity dimensions:
where:
Geographical weight (binary adjacency: 1 if regions share a border, 0 otherwise).
yi, yj = Economic attribute (mean GDP per capita for regions i and j over 2001–2024).
max(ym)2 = Normalization term (squared maximum GDP per capita in the system).
This specification follows Parent and Lesage's (2008) dual-attribute framework, where the multiplicative term max(ym)2 scales geographical connectivity by economic similarity, assigning higher weights to adjacent regions with comparable development levels.
3 Analysis of spatiotemporal evolution characteristics of grain production patterns in Jiangsu Province
3.1 Temporal evolution characteristics
Analysis of six benchmark years (2001, 2005, 2010, 2015, 2020, and 2024) revealed significant temporal shifts in Jiangsu's grain production patterns through Gini coefficient and concentration ratio calculations (Table 2). The Gini coefficient increased from 0.27 in 2001 to 0.40 in 2024 (a 48.1% growth), signaling a transition from relative spatial equilibrium to pronounced agglomeration. Meanwhile, the concentration ratio of the top five production regions (CR5) rose from 58.9% to 66.96% (+16.68%). This dual trajectory reflects intensified spatial polarization and consolidation of Northern Jiangsu's dominance, with the grain corridor centered on Yancheng, Xuzhou, Huai'an, and Suqian strengthening systematically—evidenced by Northern cities occupying four of the top five positions by 2024 compared to three in 2001. Concurrently, Central Jiangsu retained only Nantong in the lower rankings, and Southern regions exited the top producers completely, illustrating Jiangsu's strategic spatial division: prioritizing economic efficiency in the South while consolidating grain security in the North. This “northward consolidation–central decline” pattern substantiates the emerging “North-to-South Grain Flow” paradigm within regional functional specialization frameworks.
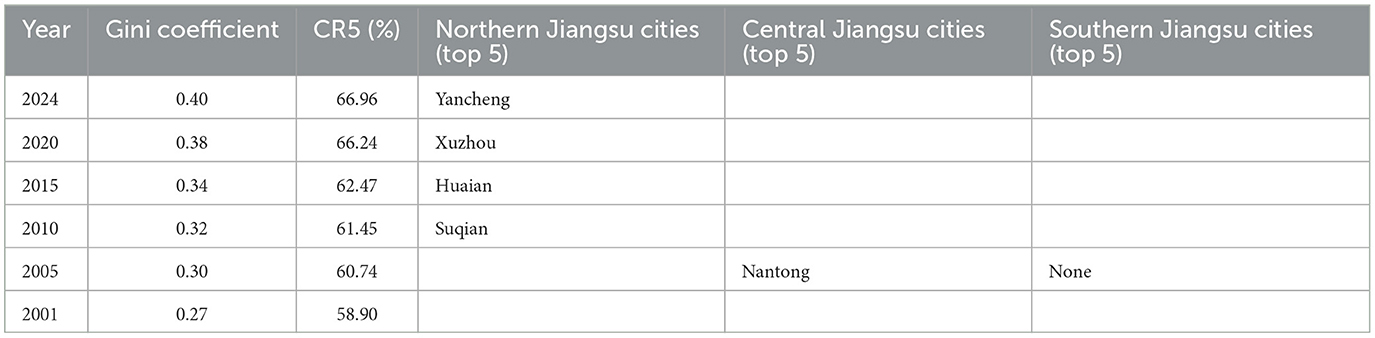
Table 2. Gini coefficient and Concentration Ratio (CR5) of grain-sown area in Jiangsu Province (2001–2024).
3.2 Spatial evolution characteristics
3.2.1 Global Moran's I analysis
This study employed three spatial weight matrices—adjacency, economic distance, and nested configurations—to assess global spatial autocorrelation for grain sown area and GDP across Jiangsu Province from 2001 to 2024 (Table 3). The results demonstrate persistent positive spatial dependence in grain sown area, with Moran's I exhibiting monotonic increases across all matrices: adjacency weights (0.415 to 0.497), economic distance (0.492 to 0.660), and nested matrices (0.094 to 0.160). This trajectory signifies intensifying polarization of high-high and low-low clustering patterns, indicating progressive spatial agglomeration. Critically, the consistently higher Moran's I under economic distance weights (p < 0.01) identifies interregional economic disparities as the primary driver of spatial linkages in grain production. This is corroborated by empirical observations of Northern Jiangsu leveraging low-cost land and policy incentives to establish agricultural production clusters (>60% provincial grain output), while Southern regions undergo a functional transition toward high-value industries through regional specialization.
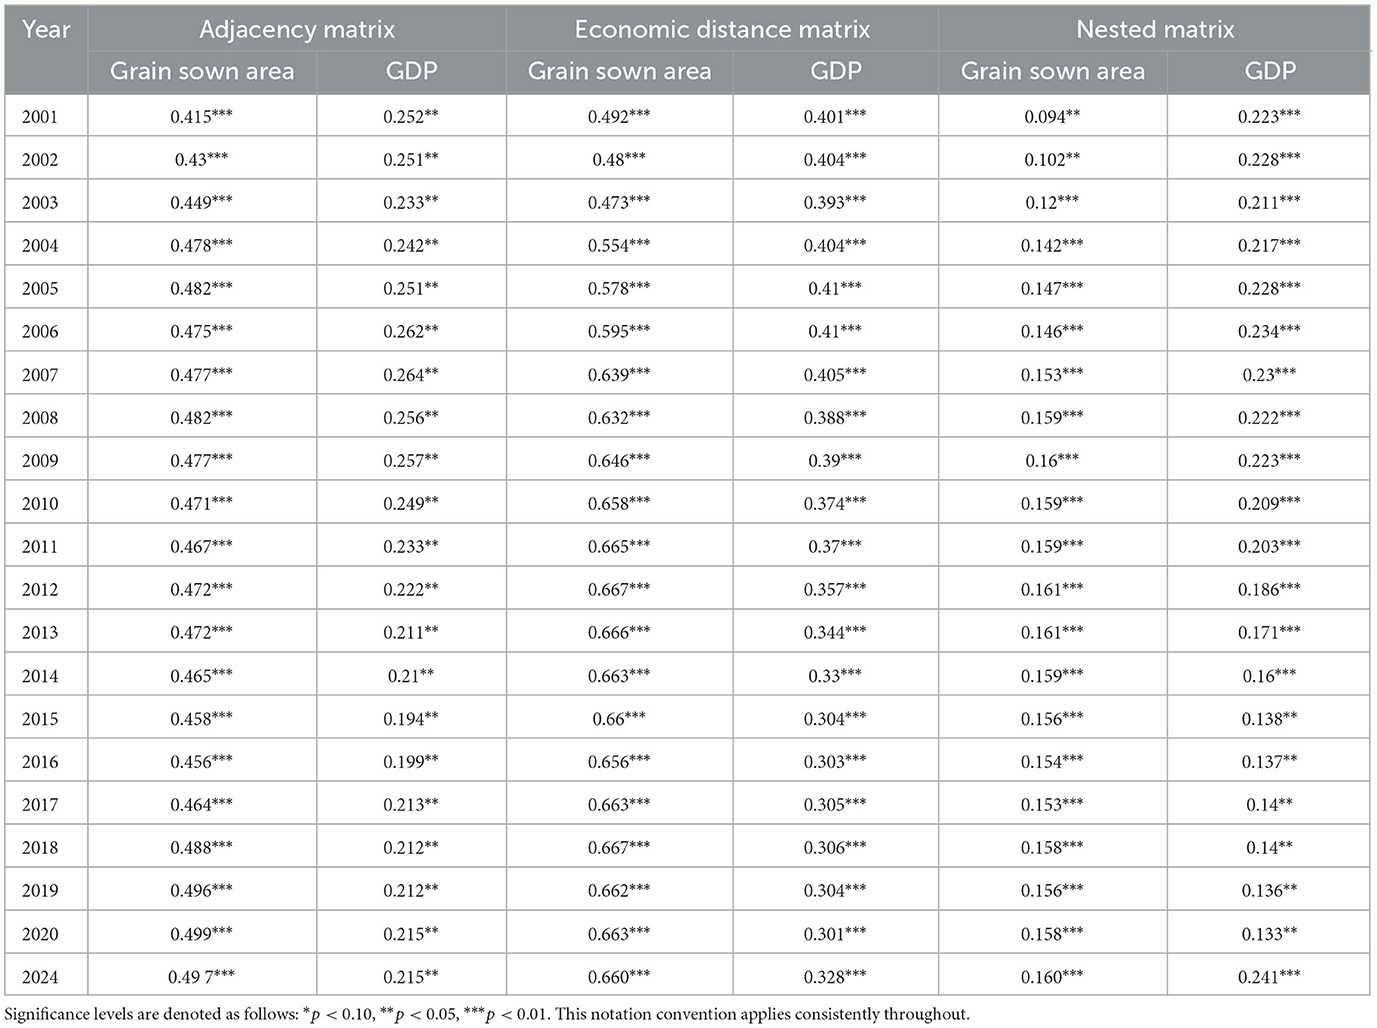
Table 3. Global Moran's I for grain sown area and GDP in Jiangsu Province (2001–2024).
3.2.2 Local Moran's I analysis
Building upon Chen et al.'s (2022) matrix selection methodology, the economic distance matrix was adopted as the benchmark specification for subsequent spatial econometric analysis due to its superior performance in generating higher Global Moran's I values for both grain sown area and GDP compared to alternative matrices. This matrix served as the primary analytical framework, while the adjacency and nested matrices were employed for robustness validation (Li and Zhou, 2021).
Local spatial autocorrelation analysis for six benchmark years (2001, 2005, 2010, 2015, 2020, and 2024) revealed persistent spatial clustering dynamics across Jiangsu Province, visualized through Moran scatterplots (Figure 1). The results demonstrate pronounced spatial lock-in effects coupled with functional restructuring.
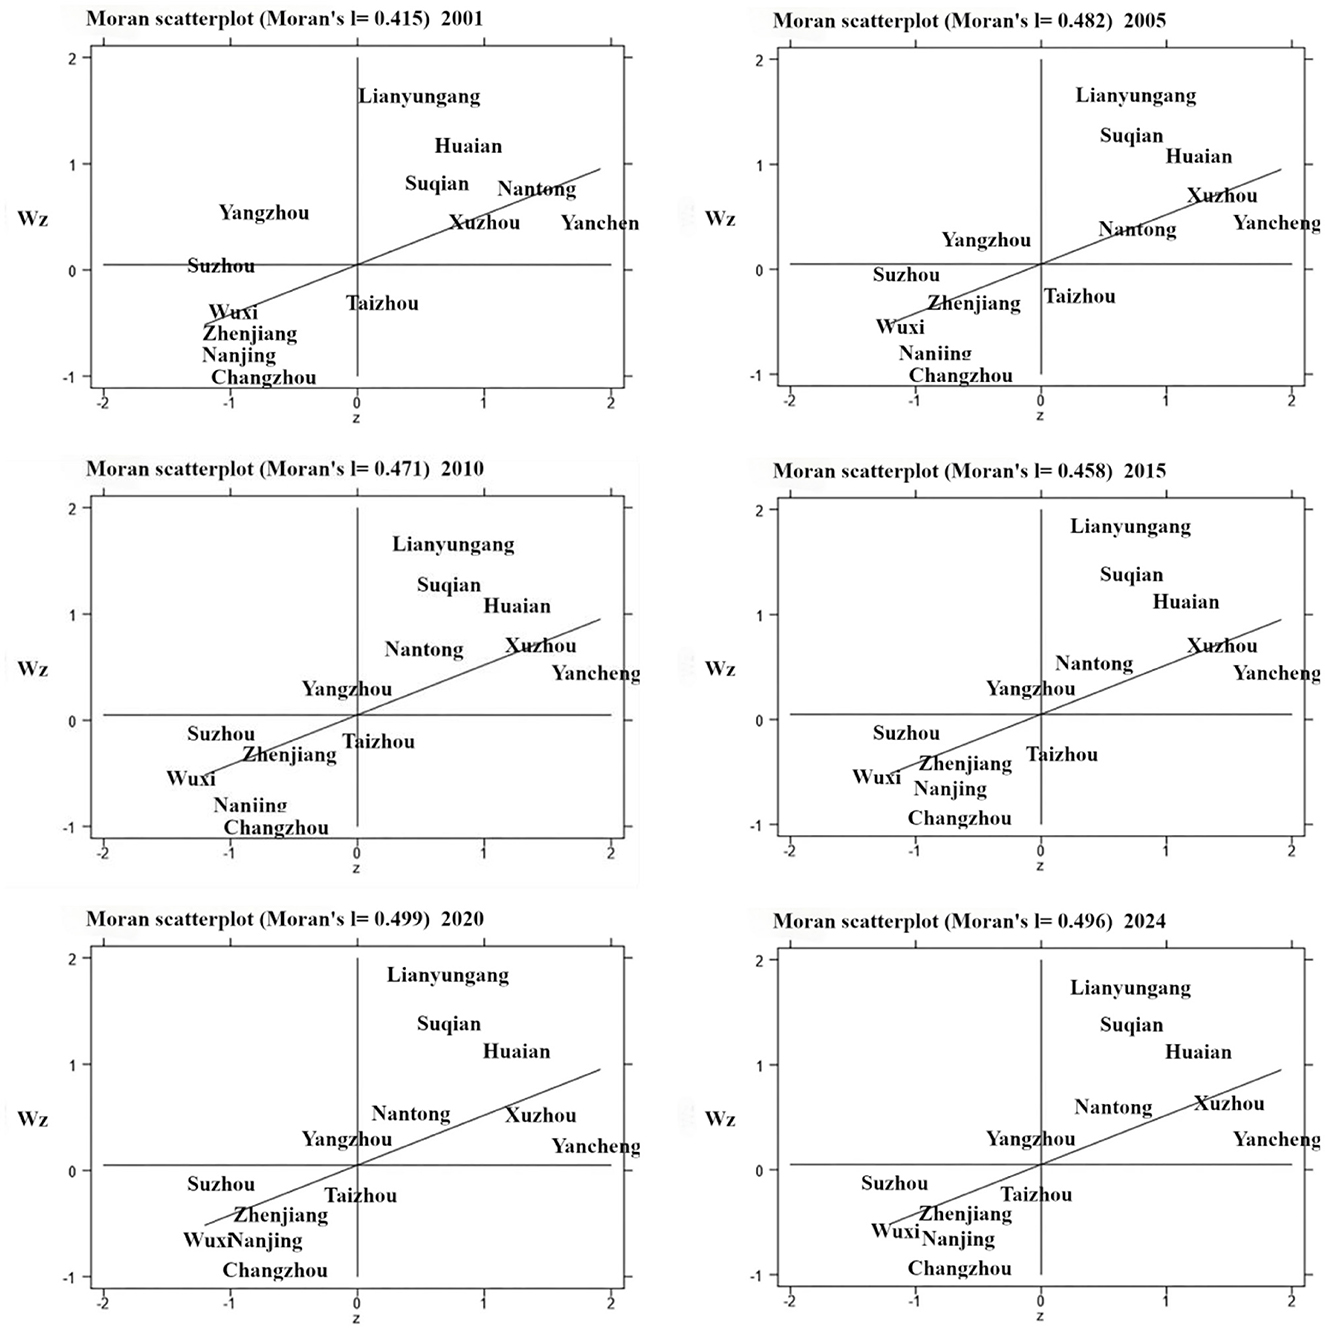
Figure 1. Moran scatterplots of grain sown area in Jiangsu Province (2001–2024).
A stable high-high (HH) cluster emerged in Northern Jiangsu, encompassing Yancheng, Xuzhou, Huai'an, Suqian, Nantong, and Lianyungang (all p < 0.01). By 2024, this contiguous production core contributed ~70% of the province's grain sown area, characterized by a significantly higher arable land abundance index (2.5 vs. the provincial mean of 1.8) and a greater agricultural labor share (35% vs. 27% provincial average), confirming dual-path dependency on natural resources and human capital. Conversely, Southern Jiangsu formed a consolidated low-low (LL) pole (Nanjing, Wuxi, Changzhou, and Zhenjiang; p < 0.05) where grain sown area proportion declined from 12.4% (2001) to 8.5% (2024), reflecting progressive urban encroachment effects driven by rapid urbanization (annual rate: 2.3%).
Spatial spillover dynamics revealed that capital and technology transfers from Southern Jiangsu enhanced agricultural productivity in the North, while simultaneously triggering deagrarianization in Central Jiangsu. This is exemplified by Nantong's decline from second to fifth in grain production rankings. Additionally, labor siphonage undermined regional agricultural resilience, ultimately establishing a self-reinforcing chain-collapse reaction across the production system.
3.2.3 Standard deviational ellipse analysis
Utilizing the Standard Deviational Ellipse (SDE) methodology within ArcGIS 10.8, this study quantified the centrality and directional evolution of grain production spatial patterns in Jiangsu Province (Figure 2). Results demonstrate a persistent northwest-southeast orientation of the ellipse's major axis from 2001 to 2024, aligning closely with the agricultural corridor spanning the Lixiahe Plain and Coastal Plain, thereby confirming fundamental physiographic constraints on production distribution.
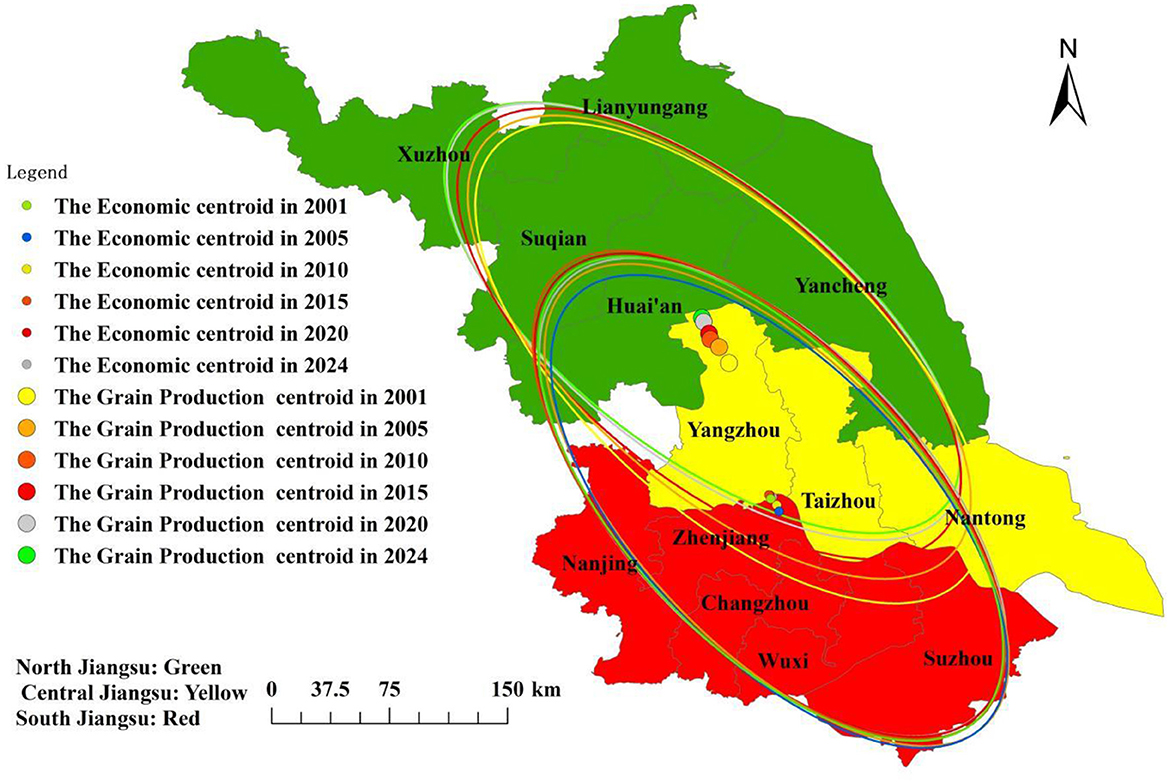
Figure 2. Centroid (grain and economic) and standard deviational ellipse in Jiangsu Province (2001–2024).
The grain production centroid migrated systematically northwestward from Jiangdu District, Yangzhou (119.49°E, 33.07°N) in 2001 to Jinhu County, Huai'an (119.40°E, 33.40°N) in 2024, traversing 37.55 km total displacement at an annual mean rate of 1.56 km/year (Table 4). Concurrently, spatial divergence between economic and grain production centroids increased from 89.38 km (2001) to 125.40 km (2024), highlighting intensified core-periphery segregation characterized by a consolidated Southern economic center and Northern agricultural periphery under regional functional specialization.
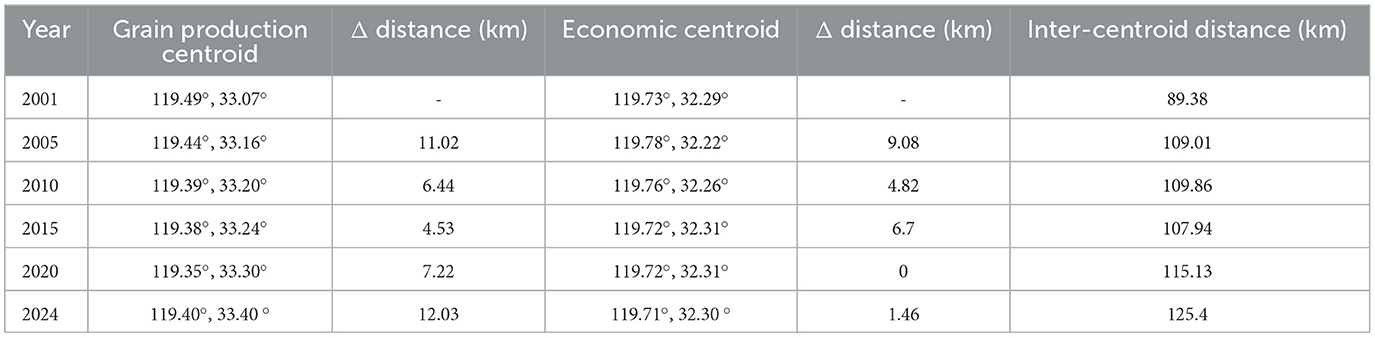
Table 4. Centroid coordinates and separation dynamics (2001–2024).
4 Empirical analysis with spatial econometric models
4.1 Spatial econometric model
Spatial econometric models are categorized into three primary classes based on spatial interaction patterns: Spatial Lag Models (SLM), Spatial Error Models (SEM), and Spatial Durbin Models (SDM). SLM captures endogenous interactions through spatial lags of the dependent variable, SEM addresses unobserved spatial spillovers via error term autocorrelation, while SDM comprehensively incorporates both the spatial lagged dependent variable and spatially weighted independent variables to model multifaceted spatial spillovers (Chen et al., 2022). Building on this framework, this study adopts the Spatial Durbin Model (SDM) to analyze determinants of grain sown area in Jiangsu Province, formally expressed as:
where y denotes the dependent variable (grain sown area), Wy represents its spatial lag term, X contains explanatory variables, Wx specifies their spatial lags, and ε~N(0, σ2I) denotes normally distributed errors. Crucially, parameter restrictions govern model degeneracy: when θ = 0 and λ=0 (where λ denotes spatial error autocorrelation), SDM reduces to a Spatial Autoregressive model (SAR); if ρ = 0 and θ = 0, it simplifies to SEM; unrestricted SDM (ρ≠0, θ≠0) remains operative otherwise. Following Elhorst (2014), Wald and Likelihood Ratio (LR) tests were subsequently applied to statistically confirm SDM's optimality against SAR and SEM alternatives, ensuring robust specification of spatial interaction mechanisms.
4.2 Variable selection and theoretical basis
The evolution of grain production spatial patterns arises from the interaction of natural reproduction and economic reproduction (Marx, 1867), characterized by multidimensional drivers and spatial heterogeneity. Utilizing the Pressure-State-Response (PSR) framework (OECD, 1993), this study constructs a variable system incorporating three dimensions: natural base, economic disturbance, and societal response. Eight indicators were selected to analyze the spatial differentiation mechanism of grain production in Jiangsu Province. Descriptive statistics for these variables are provided in Table 5.
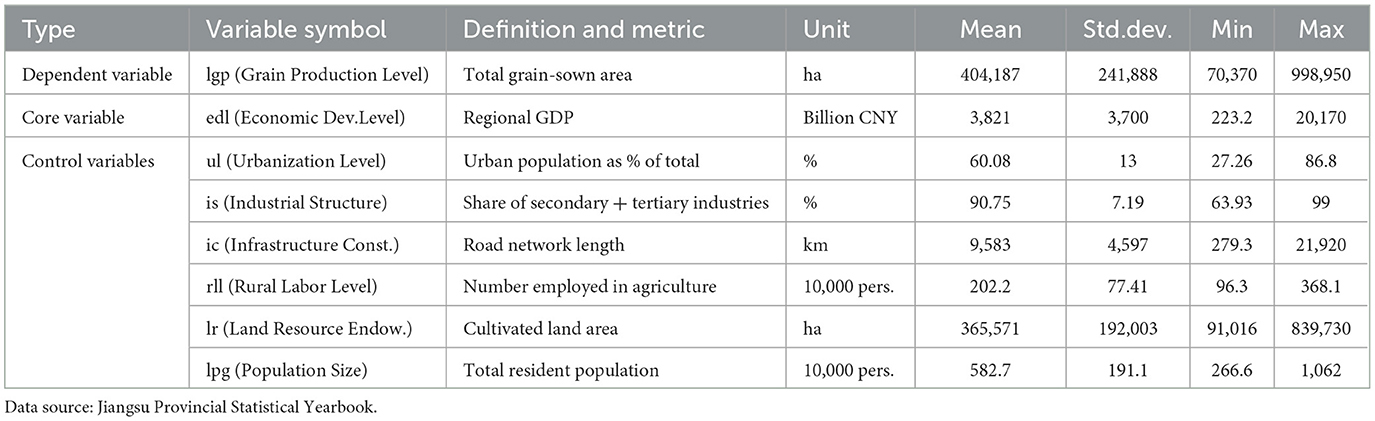
Table 5. Variable definitions, metrics, and descriptive statistics.
4.2.1 Economic disturbance dimension
4.2.1.1 Economic development level (edl)
Rooted in Ricardo's land resource competition theory (Ricardo, 1817), economic expansion triggers “production marginalization” by converting farmland into non-agricultural uses. Represented by regional GDP, the expected sign is negative.
4.2.1.2 Urbanization level (ul)
Lee's push-pull theory (Lee, 1966) posits that urbanization constrains agriculture through labor migration and farmland fragmentation. Measured as urban population share (%) and standardized, the expected sign is negative.
4.2.1.3 Industrial structure adjustment (is)
The Petty-Clark Theorem (Petty, 1690; Clark, 1940) reveals that industrial upgrading impacts land allocation efficiency via factor reallocation. Represented by the combined share of secondary and tertiary industry value-added (%), the expected sign is positive. Moving beyond simplistic non-agriculturalization metrics (Liu et al., 2010), the “secondary-tertiary share” captures the potential for land intensification fostered by industrial upgrading (e.g., land-saving technology diffusion in industrial parks).
4.2.2 Natural endowment dimension
4.2.2.1 Cultivated land resource endowment (lr)
Von Thünen's agricultural location theory emphasizes the fundamental constraint of land quantity and quality on production (Thünen, 1826). Measured as regional arable land area, the expected sign is positive.
4.2.3 Societal response dimension
4.2.3.1 Rural labor force level (rll)
Number of employees in agriculture, forestry, animal husbandry, and fishery, reflecting the scale of production agents. Expected sign: positive.
4.2.3.2 Infrastructure construction (ic)
Road mileage as a proxy for spatial accessibility. The expected sign is debated: positive (enhanced market connectivity) vs. negative (farmland conversion).
4.2.3.3 Population size (lpg)
Total resident population (10,000 persons), representing demand-side pressure. Expected sign: positive.
4.2.4 Dependent variable
4.2.4.1 Grain production level (lgp)
Moving beyond traditional “output-oriented” metrics (Xia et al., 2018), sown area is employed to mitigate the confounding influence of technological progress (Kong et al., 2022), providing a more accurate reflection of the spatial locking effect of production scale.
4.3 Spatial effect identification and model selection
Moran's I tests confirmed significant spatial dependence (p < 0.01) between grain production and economic development in Jiangsu Province (Table 3), necessitating further identification of spatial effect types through Lagrange Multiplier (LM) diagnostics, as documented in Table 6. The LM-Error tests demonstrated consistent statistical significance across weight matrices (p < 0.05; LM = 7.44–12.08), with robust LM-Error tests showing stronger significance (p < 0.01; LM = 7.12–12.92). Meanwhile, robust LM-Lag tests achieved significance specifically under adjacency (p < 0.05; LM = 1.42) and economic distance matrices, collectively indicating the coexistence of spatial error correlation and spatial autocorrelation effects within the sample (Xu and Deng, 2012). Given the Spatial Durbin Model's (SDM) distinctive capacity to simultaneously capture endogenous spatial lag effects of the dependent variable and spatial interaction effects among explanatory variables (Lesage and Pace, 2009), SDM was prioritized as the benchmark econometric specification to comprehensively account for these dual spatial dynamics while controlling unobserved heterogeneity evidenced by Hausman test significance (χ2 = 49.97; p < 0.01 under nested matrix).
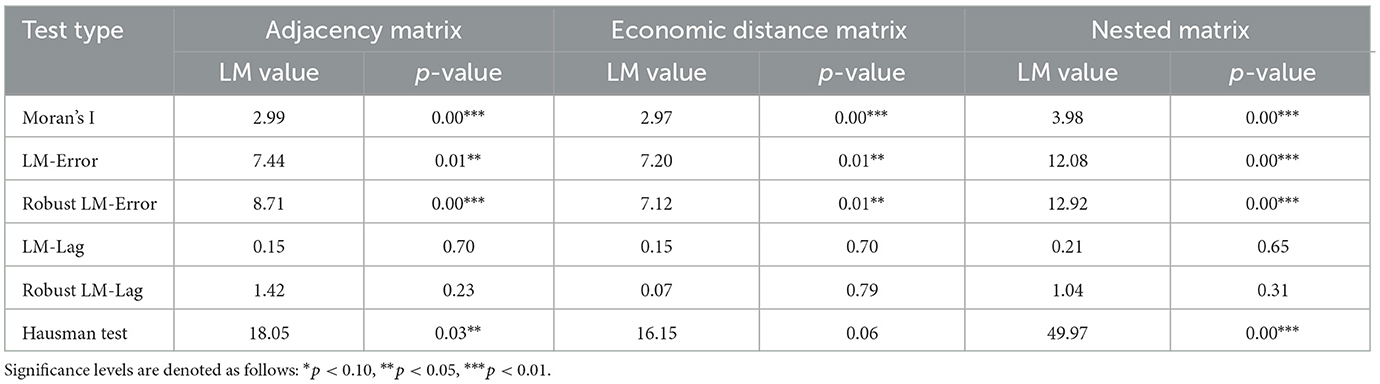
Table 6. Spatial correlation test results.
4.4 Model specification determination
Likelihood ratio (LR) tests were conducted to assess potential degeneracy of the Spatial Durbin Model (SDM) specification, with results documented in Tables 7, 8. Both LR-SEM (LR = 82.74, p < 0.001) and LR-SAR (LR = 86.11, p < 0.001) tests significantly rejected their respective null hypotheses at the 1% significance level, confirming that the SDM specification delivers superior explanatory power compared to Spatial Autoregressive (SAR) and Spatial Error (SEM) model alternatives. The Hausman test (χ2 = 21.94, p = 0.009) further supported the adoption of fixed-effects estimation to account for unobserved heterogeneity. Subsequent validation of two-way fixed effects through SDM (ind; LR = 53.90, p < 0.001) and SDM (time; LR = 209.68, p < 0.001) tests demonstrated that the spatiotemporal fixed effects model (SDM-stF) effectively controls both cross-sectional individual heterogeneity and temporal variation in the panel data, establishing SDM-stF as the statistically preferred specification for capturing complex spatial interactions while minimizing omitted variable bias.
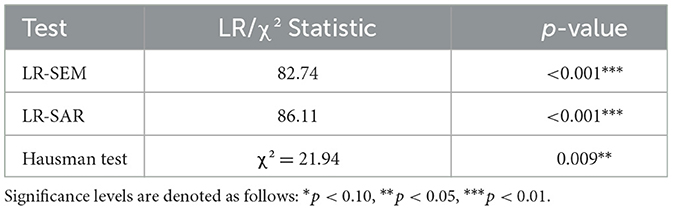
Table 7. Model selection tests.
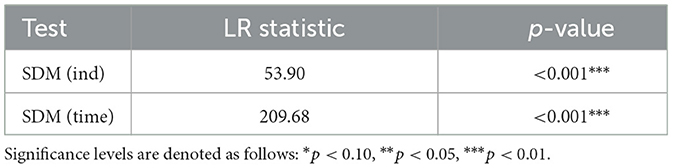
Table 8. Two-way fixed effects validation.
4.5 Robustness validation
To address potential spatial weight matrix exogeneity bias, we implemented a triple-matrix validation strategy as documented in Table 9. Results demonstrate consistent coefficient directionality across all spatial weight specifications with < 15% fluctuation in the absolute magnitude of β values (|β|) for statistically significant predictors, confirming directional stability among core variables. Control variables similarly exhibited robustness with elasticity coefficient variations remaining below 10% across specifications, while model explanatory power consistently exceeded R2 > 0.75. These findings collectively validate strong model robustness (Wang et al., 2020), confirming that our Spatial Durbin Model with spatiotemporal fixed effects (SDM-stF) specifications maintain statistical reliability against spatial heterogeneity concerns.
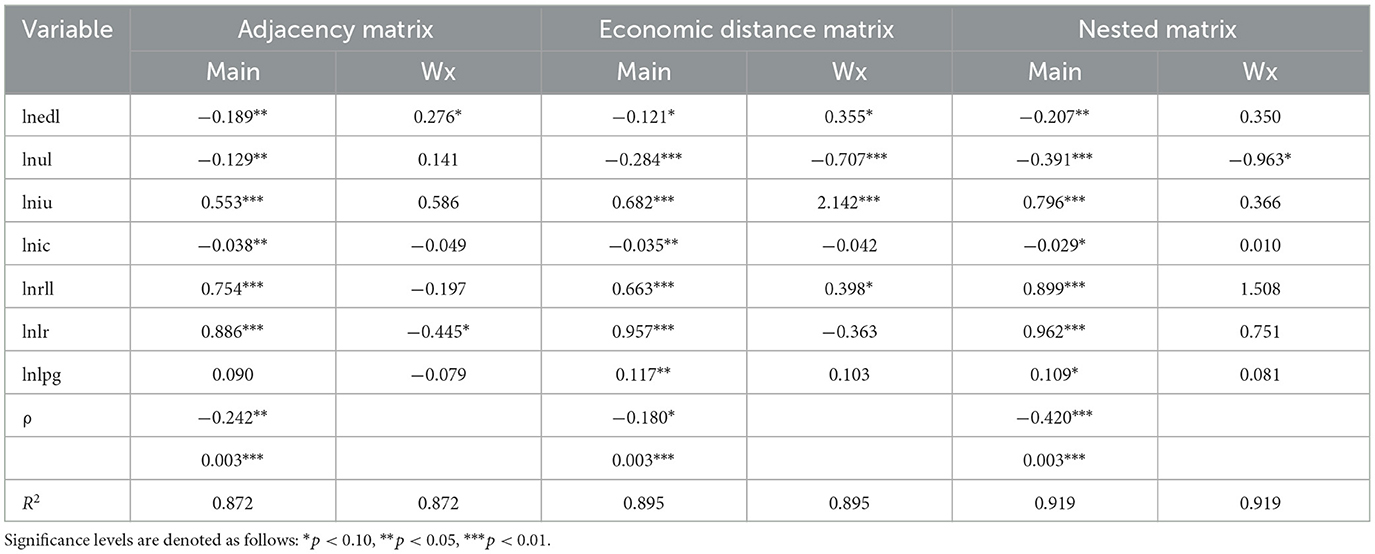
Table 9. Regression results across spatial weight matrices.
4.6 Result analysis
Spatial Durbin Model (SDM) estimates demonstrate that the evolution of grain sown area in Jiangsu Province stems from dual drivers of localized determinants and spatial spillovers, as evidenced by effect decomposition in Table 10. The analysis reveals four interconnected mechanisms: first, economic development exhibits significant local crowding-out effects (direct effect = −0.136*) through farmland conversion, yet generates positive spatial spillovers (indirect effect = +0.340**) via capital transfers from Southern economic hubs to Northern agricultural regions, confirming Krugman's (1991) core-periphery compensation thesis. Simultaneously, industrial restructuring drives local land intensification (direct effect = +0.603***) while facilitating interregional technology diffusion (indirect effect = +1.830***) that enhances land-use efficiency.
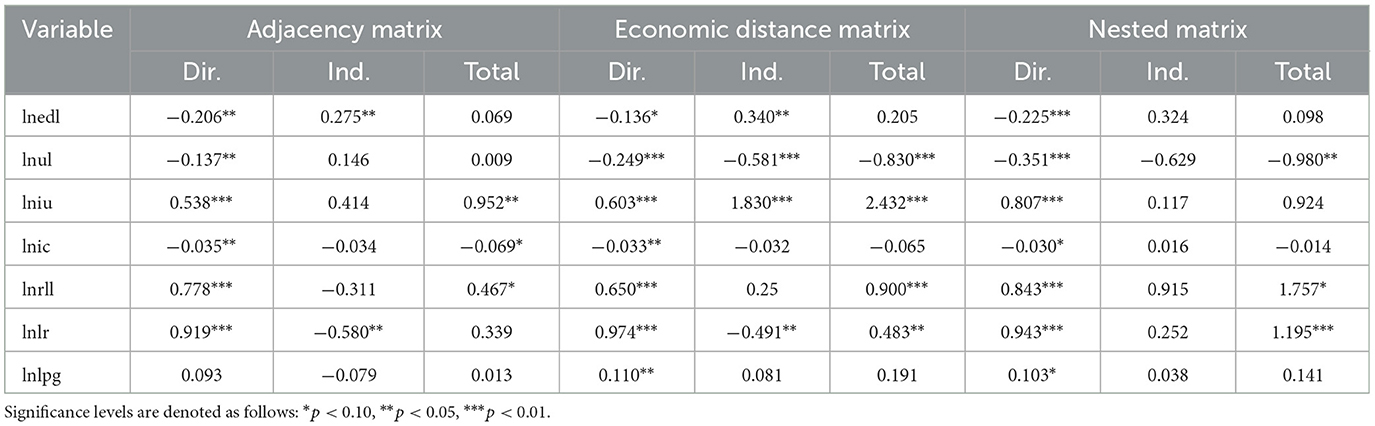
Table 10. Spatial effect decomposition.
Second, arable land endowment demonstrates robust local elasticity (direct effect = +0.974***), validating Thünen's (1826) agricultural location theory through practices such as tidal flat reclamation in Yancheng, while its negative spatial spillover (−0.491) reflects policy-induced interregional trade-offs within Jiangsu's farmland quota trading system where Southern development rights purchases subsidize Northern grain production. Third, sociodemographic transitions yield multidimensional impacts: rural labor underpins traditional cultivation (direct effect = +0.650***), particularly in Northern Jiangsu where agricultural labor participation (58%) significantly exceeds Southern levels (22%), whereas urbanization simultaneously triggers local farmland contraction (direct effect = −0.249***) and regional labor drain (indirect effect = −0.581***), causing chain-collapse effects in Central Jiangsu. Concurrently, population growth exerts demand-pull expansion (direct effect = +0.110**). Fourth, infrastructure development presents trade-offs, with road construction directly reducing sown area (−0.033**) yet potentially accelerating production polarization through enhanced factor mobility. Collectively, these dynamics establish a spatially integrated framework reconciling Jiangsu's dual trajectory of economic agglomeration and grain security consolidation.
5 Discussion
This study addresses the critical global challenge of spatial divergence between economic agglomeration cores and grain-producing peripheries, exemplified by Jiangsu's 125.4 km displacement between economic and grain production centroids. While prior literature predominantly framed this relationship as a zero-sum conflict (Li and Bian, 2008; Wang and Xu, 2012), our results resolve a fundamental theoretical paradox (Cheng and Zhang, 2005) by demonstrating that local economic development suppresses grain output while generating compensatory spatial spillovers through capital and technology transfers to peripheral regions. This finding validates Krugman's (1991) compensation thesis while refuting Friedmann's (1966) unidirectional exploitation model. Importantly, we reconcile Schultz's (1964) traditional input dependence with Huang's industrial feedback theory, showing how industrial restructuring enhances local land efficiency while driving cross-regional productivity spillovers—thereby addressing Lewis's (1954) labor competition concerns within Thünen's (1826) spatial constraints. This issue bears urgent relevance for food security during rapid urbanization, particularly for developing economies facing the “middle-income food trap.”
To overcome the limitation of conventional spatial analyses relying on single adjacency matrices (Fu, 2009; Wang and Ni, 2016), which fail to capture economically mediated interactions, we pioneered a novel tripartite spatial weights system integrating geographic adjacency, economic distance, and nested matrices (accounting for geography and comparable development levels). Coupled with Spatial Durbin Model (SDM) effect decomposition, this framework uniquely revealed hidden dynamics undetectable via OLS or spatial lag models: (1) Economic distance dominated spatial dependence, confirming core-periphery linkages are economically structured; (2) SDM decomposition quantified how urbanization's local suppression coexists with industrial upgrading's positive spatial spillovers; (3) Nested matrices resolved Parent and Lesage's (2008) critique by revealing amplified spillovers between adjacent regions with comparable development levels. This approach enables a spatially nuanced analysis of complex regional interdependencies.
Rigorous validation confirmed the credibility and generalizability of our findings. Triple-matrix robustness checks (geographic, economic distance, and nested), spatiotemporal fixed effects controls, and centroid trajectory tracking consistently supported Jiangsu's “compensated core-periphery” model. This model, operationalized through institutionalized spatial synergies, such as the “Southern Purchase-Northern Supply” eco-compensation scheme and industrial enclave economies, directly counters classic development pitfalls: “New Farmer Cultivation” mitigates Lewis's labor drain, saline-alkali smart farming transforms Schultz's traditional inputs, and “twin-indicator trading” internalizes spillovers. The empirically validated framework provides a generalizable solution for developing economies, offering a Pareto-optimal pathway for regions such as Vietnam (Mekong Delta vs. Ho Chi Minh City), India (Punjab vs. Gujarat), and Brazil (Cerrado vs. São Paulo) to escape the “middle-income food trap” through institutionalized spatial synergies.
6 Policy implications
This study empirically validates the spatial coupling between regional economic development and food security. Based on these findings, the study proposes several policy implications. First, innovative spatial governance implements a “dual-core zoning governance” model. This establishes a gradient synergistic development system with a dynamic “core-periphery” compensation mechanism, explicitly defining grain responsibility compensation standards for high-economic-density zones through functional zoning. Economic core zones adopt a “grain responsibility transfer mechanism,” allocating fiscal funds based on economic growth increments for cross-regional grain production compensation. Grain security zones link “cultivated land protection to economic returns,” rewarding grain surplus regions with construction land quotas and tax rebates. The model innovates with “enclave economies,” where developed regions co-establish industrial parks to channel industrial profits back to major grain-producing areas, forming a closed-loop “industrial transfer–grain replenishment” system. Second, an industrial feedback system creates mechanisms for secondary and tertiary sectors to support agriculture. This involves developing “agriculture + digital economy” through e-commerce platforms and cold-chain logistics to extend value chains, enhance grain processing value-added, and upgrade the agricultural value chain. A labor replenishment program, including the “New Farmer Cultivation Initiative,” counteracts labor losses from urbanization and rejuvenates the farming workforce. Third, a technology-driven resource breakthrough strategy promotes saline-alkali land remediation technologies (e.g., from Northern Jiangsu) and smart agriculture systems to overcome land constraints, achieving a Pareto improvement in both economic growth and grain production capacity. Finally, strengthened institutional constraints refine the “dual-control system.” This includes strictly enforcing cultivated land protection, implementing rigorous approval and compensation for land conversion, and establishing a “twin-indicator trading” system that allows grain-producing regions to marketize surplus land quotas to economically dense areas for optimal resource allocation.
Evidence from Jiangsu Province demonstrates that synergistic coupling between regional economic development and food security is achievable, enabling sustainable co-development. This model holds a universal reference value for middle-to-high-income economies globally. Developing countries are advised to adopt a three-phase strategy—spatial functional restructuring → industrial value chain upgrading → smart technology integration—to progressively escape the “middle-income food trap” and attain a Pareto optimum for economy and food security.
Data availability statement
The datasets analyzed in this study are publicly available through CNKI Statistical Yearbooks. Access details are as follows: 中国统计年鉴 (China Statistical Yearbook) Repository URL: https://data.cnki.net/yearBook/single?nav=统计年鉴&id=N2024110295&pinyinCode=YINFN 统计年鉴 (Jiangsu Statistical Yearbook) Repository URL: https://data.cnki.net/statisticalData/index?isSubcribe=0&ky=江苏
Author contributions
YB: Writing – original draft. YZ: Writing – review & editing. JX: Writing – review & editing.
Funding
The author(s) declare that financial support was received for the research and/or publication of this article. This work was funded by National Natural Science Foundation of China Youth Project (72103177), Major Project of Jiangsu Institute of Engineering Technology Development Strategy (JS2019-ZDOI), General Project of Philosophy and Social Sciences Research of Jiangsu Universities (2022SJYB2095), Humanities and Social Sciences Fund Project of Yangzhou University (xj2021-42), and Soft Science Project of Yangzhou Science and Technology Bureau (YZ2019202).
Conflict of interest
The authors declare that the research was conducted in the absence of any commercial or financial relationships that could be construed as a potential conflict of interest.
Generative AI statement
The author(s) declare that no Gen AI was used in the creation of this manuscript.
Publisher's note
All claims expressed in this article are solely those of the authors and do not necessarily represent those of their affiliated organizations, or those of the publisher, the editors and the reviewers. Any product that may be evaluated in this article, or claim that may be made by its manufacturer, is not guaranteed or endorsed by the publisher.
References
Anselin, L. (1995). Local indicators of spatial association—LISA. Geogr. Anal. 27, 93–115. doi: 10.1111/j.1538-4632.1995.tb00338.x
Chen, J. (2007). Rapid urbanization in China: a real challenge to soil protection and food security. Catena 69, 1–15. doi: 10.1016/j.catena.2006.04.019
Chen, Y. S., Jiang, Y. F., and Zhang, Y. (2022). Changes in China's soybean production pattern and its influencing factors. Econ. Geogr. 42, 87–94. doi: 10.15957/j.cnki.jjdl.2022.03.009
Cheng, D. Z., and Wang, M. C. (2021). The impact of financial agglomeration in the Yellow River Basin on regional high-quality development. Chin. Popul. Resour. Environ. 31, 137–147. doi: 10.12062/cpre.20210628
Cheng, Y. Q., and Zhang, P. Y. (2005). Changes in regional pattern of grain production in China and the response of Northeast China commercial grain base. Geogr. Sci. 25, 513–519. doi: 10.3969/j.issn.1000-0690.2005.05.001
Ding, C. Z., and Xiao, H. F. (2018). Analysis of the characteristics of temporal and spatial evolution of China's mutton industry. J. Huazhong Agric. Univ. 58–64+158–159. doi: 10.13300/j.cnki.hnwkxb.2018.01.007
Du, C. Z., and Jin, H. W. (2020). Research on the impact of urbanization and industrialization coupling on regional independent innovation capability—Based on the perspective of spatial spillover effect. Economic Problem Exploration 4, 85–97.
Elhorst, J. P. (2014). Matlab software for spatial panels. Int. Reg. Sci. Rev. 37, 389–405. doi: 10.1177/0160017612452429
Friedmann, J. (1966). Regional Development Policy: A Case Study of Venezuela. Cambridge, MA: MIT Press.
Fu, M. (2009). Geographic distance and technological spillover effects: a spatial econometric explanation of technological and economic agglomeration phenomena. Economics 8, 1549–1566.
Ge, D. Z., Long, H. L., Li, Y. R., Zhang, Y. N., and Tu, S. S. (2018). Spatio-temporal pattern of multifunctional transition of grain production system in China's urbanization process: a case study of the Huang-Huai-Hai region. Econ. Geogr. 38, 147–156, 182. doi: 10.15957/j.cnki.jjdl.2018.04.018
Hu, A. G., and Liu, S. L. (2009). Transportation, economic growth and spillover effects: results of spatial economic measurement based on provincial data in China. China Ind. Econ. 5−14. doi: 10.1007/s11459-010-0009-0
Jiangsu Provincial Bureau of Statistics (2024). Jiangsu Statistical Yearbook 2024. China Statistics Press.
Jiao, S., Wu, S. S., Han, Z. W., and Peng, K. (2022). Spatiotemporal evolution and correlation mechanism of industrial agglomeration and water pollution degree in Hunan's “one lake and four rivers”. Econ. Geogr. 42, 132–140. doi: 10.15957/j.cnki.jjdl.2022.04.015
Kong, X. B., Chen, W. G., and Wen, L. Y. (2022). Building the foundation of food security for a big country with the three security of cultivated land resources. Agric. Econ. Manag. 1–12. doi: 10.3969/j.issn.1674-9189.2022.03.001
Krugman, P. (1991). Increasing returns and economic geography. J. Polit. Econ. 99, 483–499. doi: 10.1086/261763
Kuznets, S. (1966). Modern Economic Growth: Rate, Structure and Spread. New Haven: Yale University Press.
Lefever, D. W. (1926). Measuring geographic concentration by means of the standard deviational ellipse. Am. J. Sociol. 32, 88–94. doi: 10.1086/214027
Lesage, J. P., and Pace, R. K. (2009). Introduction to Spatial Econometrics. Boca Raton, FL: CRC Press.
Lewis, W. A. (1954). Economic development with unlimited supplies of labour. Manch. Sch. 22, 139–191. doi: 10.1111/j.1467-9957.1954.tb00021.x
Li, C. M., and Zhou, Y. (2021). Research on the impact of digital inclusive finance on rural consumption: based on spatial econometric model. Econ. Geogr. 41, 177–186. doi: 10.15957/j.cnki.jjdl.2021.12.019
Li, Y. R., and Bian, X. M. (2008). Study on the changes of regional pattern of grain production in Jiangsu Province. Reg. Res. Dev. 27, 113–117.
Liu, Y., Ren, Y. M., and Pan, Y. C. (2020). Detection of spatial heterogeneity of grain production in counties in the Huang-Huai-Hai region and its influencing factors. J. Peking Univ. 56, 315–323. doi: 10.13209/j.0479-8023.2019.130
Liu, Y. S., Wang, J. Y., and Guo, L. Y. (2010). Spatio-temporal dynamics of grain production and cultivated land change in China. Sci. Agric. Sin. 42, 4269–4274. doi: 10.3864/j.issn.0578-1752.2009.12.018
Long, H. L., and Zou, J. (2010). Cultivated land use transformation and food security in China. Geogr. Res. 29, 791–800. doi: 10.3969/j.issn.1674-764x.2010.01.008
Parent, O., and Lesage, J. P. (2008). Using the variance structure of the conditional autoregressive spatial specification to model knowledge spillovers. J. Appl. Econom. 23, 235–256. doi: 10.1002/jae.981
Thünen, J. H. von. (1826). Der Isolierte Staat in Beziehung auf Landwirtschaft und Nationalökonomie. Hamburg: Perthes.
Wang, H. Y., Wen, H. M., and Du, L. (2020). Analysis of spatial spillover effects of fertilizer input on grain output: based on provincial panel data from 1978 to 2016. Agric. Econ. Manag. 4, 52–64.
Wang, J. Y., and Liu, Y. S. (2009). The evolution pattern and driving mechanism of China's grain production center from 1990 to 2005. Resour. Sci. 31, 1188–1194. doi: 10.3321/j.issn:1007-7588.2009.07.014
Wang, X. C., and Xu, F. (2012). Regional variation characteristics of grain production in China and policy recommendations. Finance Econ. 80−88. doi: 10.3969/j.issn.1000-8306.2012.04.010
Wang, Y. F., and Ni, P. F. (2016). Economic growth spillover and regional spatial optimization under the influence of high-speed railways. China Ind. Econ. 21–36. doi: 10.19581/j.cnki.ciejournal.2016.02.003
Xia, S. Y., Zhao, Y., and Xu, X. (2018). Spatiotemporal pattern of grain production and its driving factors in Jiangsu Province. Econ. Geogr. 38, 166–175. doi: 10.15957/j.cnki.jjdl.2018.12.021
Xu, H. L., and Deng, Y. P. (2012). Economic growth, FDI and environmental pollution: a spatial heterogeneity model study. Financ. Sci. 57–64.
Keywords: food security, regional economy, core-periphery structure, spatial durbin model, spatial spillovers
Citation: Ben Y, Zhang Y and Xu J (2025) Spatial coupling mechanisms of food security and regional economies: empirical examination of core-periphery dynamics in Jiangsu Province (2001–2024). Front. Sustain. Food Syst. 9:1614887. doi: 10.3389/fsufs.2025.1614887
Received: 20 April 2025; Accepted: 26 June 2025;
Published: 30 July 2025.
Edited by:
Viswanathan Pozhamkandath Karthiayani, Amrita Vishwa Vidyapeetham (Amritapuri Campus), IndiaReviewed by:
Amod Mani Dixit, Universal Engineering and Science College (UESC), NepalLirong Xing, Shandong University of Technology, China
Copyright © 2025 Ben, Zhang and Xu. This is an open-access article distributed under the terms of the Creative Commons Attribution License (CC BY). The use, distribution or reproduction in other forums is permitted, provided the original author(s) and the copyright owner(s) are credited and that the original publication in this journal is cited, in accordance with accepted academic practice. No use, distribution or reproduction is permitted which does not comply with these terms.
*Correspondence: Jinhai Xu, NzYyODk2NzRAcXEuY29t