 Ghada Alturif
 Alaa A. El-Bary
 Radwa Ahmed Osman
- 1Department of Social Work, College of Humanities and Social Sciences, Princess Nourah bint Abdulrahman University, Riyadh, Saudi Arabia
- 2Arab Academy for Science, Technology and Maritime Transport, Alexandria, Egypt
- 3National Committee for Mathematics, Academy of Scientific Research and Technology, Cairo, Egypt
- 4Council of Future Studies and Risk Management, Academy of Scientific Research and Technology, Cairo, Egypt
Purpose: The goal of this study is to predict how well five countries the US, Saudi Arabia, China, Egypt, and Sweden will do in terms of Sustainable Development Goal 2 (SDG 2), particularly the hunger index scores, between 2025 and 2030.
Methods: Historical agricultural, nutritional, and socioeconomic data from 2000 to 2022 were analyses and temporal patterns were extracted using a one-dimensional Convolutional Neural Network (1D-CNN). To guarantee precise and believable predictions, the model was trained and verified using historical data. To represent realistic development trajectories toward SDG 2 targets, forecasts were limited to a range of 0 to 100.
Results: By identifying minor temporal trends in line with patterns of world development, the 1D-CNN model showed great accuracy in forecasting changes in hunger index scores. The predictions point to possible advancements in the nations under study in terms of lowering hunger and enhancing food security.
Conclusions: Policymakers, international organizations, and sustainability advocates may all benefit from the insightful data that the suggested forecasting technique offers. These forecasts encourage more focused initiatives and efficient use of resources, which will eventually speed up efforts to meet SDG 2 (Zero Hunger).
1 Introduction
A common vision for a sustainable future that prioritizes social justice, economic prosperity, and environmental stewardship was established in 2015 when all member states of the United Nations accepted the 2030 Agenda for Sustainable Development (Yumnam et al., 2024). The 17 Sustainable Development Goals (SDGs), which are represented in Figure 1, represent this agenda, and together they tackle important global issues such as eradicating poverty, improving health and education, lowering inequality, fostering economic growth, halting climate change, and protecting the environment. Because the SDGs are purposefully linked, there are trade-offs and synergies between their objectives (Bennich et al., 2023). The structure of the global food system and these intricate relationships contribute to the explanation of the substantial influence that world events have had—and still have—on the advancement of SDG 2, which is concerned with hunger and food security.
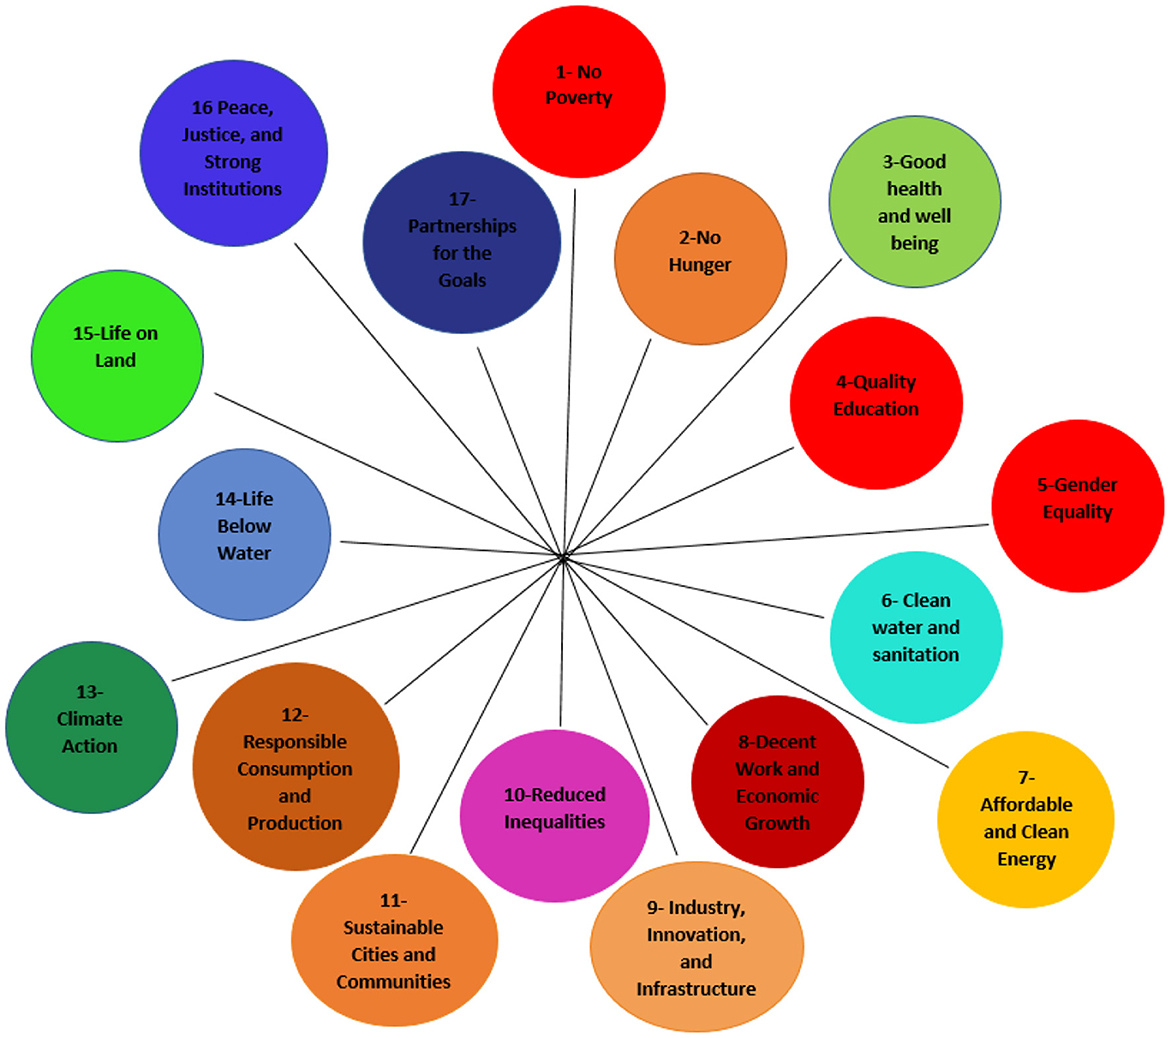
Figure 1. Sustainable Development Goals (SDGs).
It is still very difficult to achieve the SDGs by 2030, especially when it comes to SDG 2's objectives for food security and nutrition. Recent global crises, including the COVID-19 pandemic, economic instability, and continuing geopolitical conflicts, have slowed or even reversed progress toward numerous SDGs, according to the UN Sustainable Development Report 2022 (Giourgali and Poulaki, 2024; Husaini and Sohail, 2024). In addition to impeding attempts to end hunger and advance sustainable agriculture, these interruptions have made food insecurity worse. With its strong ties to social, economic, and environmental aspects, food security is central to the SDGs, particularly SDG 2, which seeks to eradicate hunger by 2030 (Ghufran et al., 2025; Chishti et al., 2023). Despite unequal success, the SDGs continue to provide a potential framework for long-term solutions to food insecurity. However, despite modest gains in certain areas, the number of people experiencing extreme food insecurity is once again increasing globally, mainly as a result of ongoing armed conflicts (Vos et al., 2023).
Artificial intelligence (AI) has the potential to revolutionize society, but there are many obstacles and compromises in its development. These include concerns about data privacy and cybersecurity, the expensive cost of infrastructure improvements, skill shortages in the workforce and the digital divide, increasing living costs, and the possibility of societal prejudices and discriminatory decision-making being reinforced (Sharifi et al., 2024; Wolniak and Stecuła, 2024). By advocating for international norms and legal frameworks that guarantee that AI is created and used responsibly, the United Nations can play a crucial role in resolving these issues (Singh et al., 2023). But even with continuous international efforts to further the Sustainable Development Goals (SDGs), not enough has been accomplished to reach the 2030 objectives. This presents significant questions regarding the viability of accomplishing these objectives globally (Shayan et al., 2022). At the regional, national, and sub-national levels, ongoing monitoring and assessment of SDG performance are crucial to resolving this problem. These evaluations assist governments in recognizing important development gaps and comprehending differences in national progress (Wang and Yang, 2025).
Beyond improving global benchmarking, predicting SDG outcomes across regions aids in prioritizing areas for strategic intervention (Adegoke et al., 2025; Alturif et al., 2024) and aids in the development of tailored policy measures (Charles and Emrouznejad, 2024). Accordingly, SDG indicators function as all-encompassing standards for gauging a nation's progress and advancement (Khan et al., 2025). This study uses an advanced prediction model based on one-dimensional Convolutional Neural Networks (1D-CNN) to estimate the consequences of SDG 2 (Zero Hunger). This study offers important insights into the efficacy of agricultural development and food security programs in various contexts by assessing SDG 2 scores in China, Egypt, Saudi Arabia, Sweden, and the US. In a rapidly expanding economy, China's significant investments in agricultural innovation and rural development demonstrate progress toward SDG 2 (Liu and Yuan, 2023). Egypt's emphasis on water management and sustainable agriculture emphasizes the necessity of resource-efficient techniques in arid areas (Hegazy and Tohlob, 2024). Saudi Arabia's Vision 2030 programs for food self-sufficiency and agricultural modernization show how the country is in line with the global SDG 2 aims (Qwaider et al., 2023). Sweden provides an example for combining environmental stewardship and sustainable food systems (Krantz and Gustafsson, 2023), while the US uses international collaborations and technology advancements to advance food security both at home and abroad (Mangukiya and Sklarew, 2023).
The main research question of this project is: can a 1D Convolutional Neural Network (1D-CNN) learn from past food security indicators across nations with different socioeconomic profiles to accurately predict SDG 2 (Zero Hunger) results from 2025 to 2030? A cross-regional viewpoint that is currently under-represented in the literature is provided by this study, which is among the first to use a 1D-CNN deep learning technique to predict SDG 2 scores for various countries—China, Egypt, Saudi Arabia, Sweden, and the USA—to the best of our knowledge. These forecasts are valid for 2025–2030. Because of its capacity to analyze temporal data, 1D Convolutional Neural Networks (1D-CNNs) are especially well-suited for this investigation. 1D-CNNs, in contrast to conventional convolutional networks made for image processing, are especially tailored to analyze sequential data, such time series. Historical socioeconomic data from 2000 to 2022 is used to train the model. This research presents several novel contributions to the forecasting of SDG indicators. Initially, we put forth a multi-output 1D Convolutional Neural Network (1D-CNN) architecture designed to predict all 17 SDG goals at once, with a particular emphasis on SDG 2 as a primary use case. This approach is more effective at capturing inter-goal dependencies and temporal dynamics than traditional univariate forecasting methods. Secondly, the research utilizes this model across a varied collection of five countries—China, the USA, Egypt, Saudi Arabia, and Sweden—chosen for their unique economic and agricultural characteristics. Third, we employ a 3-year historical window for temporal forecasting, offering insights into SDG trajectories for the 2025–2030 period. Finally, a comprehensive evaluation framework that encompasses various error metrics, tests for statistical significance, and confidence intervals is presented. This framework is designed to guarantee the robustness and dependability of our predictions.
2 Related work
Research on forecasting the Sustainable Development Goals (SDG)—more especially, the attainment of sustainable agriculture and food security—has grown in importance. Different approaches are being used to anticipate future results and analyze patterns. These methods may be roughly divided into a number of important strategies. For instance, SDG 2 indicators like agricultural production and food security levels have been linked to a number of predictor factors using traditional regression models. These models, which include linear regression, frequently forecast future changes in food availability, nutrition, and agricultural sustainability using past data. Though these models offer a fundamental foundation for forecasting, they frequently prove inadequate in handling the intricate, non-linear correlations present in SDG data. Chenary et al. (2024) projected SDG scores by 2030 by combining AI-relevant predictors with ARIMAX and Linear Regression with Holt-Winters' smoothing. Sub-Saharan Africa and the Middle East/North Africa may fall behind in terms of SDG performance, while the OECD and Eastern Europe/Central Asia are anticipated to dominate. Additionally, Chang et al. (2024) discovered that the ICT sector's financial performance prediction was enhanced by SDG adoption, with the best accurate projections coming from artificial neural networks. Stakeholder participation and KPIs connected to the SDGs are important components.
Furthermore, Taweesan et al. (2024) modeled the effect of inadequate sanitation on diarrhoeal illnesses in Asia and Africa using machine learning. A classification tree (J48) demonstrated 70–73% accuracy in predicting infection risks using data from 1,000 homes (2017–2021). Higher infection rates were closely associated with poor hygiene and insufficient sanitary facilities, underscoring the necessity of safe sanitation in order to meet SDG objectives. In addition, in Khan et al. (2024), a high-resolution machine learning model (ML-LUTO Spatial) was created to estimate land-use futures in Australia that are consistent with the SDGs with 95% accuracy. It draws attention to the dominance of agriculture and the increasing demand for environmental and carbon plantings in order to achieve sustainability goals. Also, Gawdiya et al. (2024) focused on 29 plant attributes and using ensemble machine learning to forecast wheat yield in India. By improving food security forecasts, the random forest and neural network model together reached 98% accuracy, achieving SDG 2. Moreover, by integrating climate factors and remote sensing indices, Haseeb et al. (2025) employs machine learning to forecast wheat yield in Pakistan. The best-performing RF model in peak seasonal forecasts were obtained, included GNDVI, SPEI, windspeed, and soil moisture. The results highlight how machine learning may enhance food security and agricultural output forecasts.
A hybrid power/freshwater generating system utilizing an ANN in conjunction with a pelican algorithm (PA) was suggested by Alsoruji et al. (2024). A thermoelectric cooler, desalination machine, solar dish and Stirling engine were all part of the system. With reduced errors in water yield, power, and efficiency estimates, the ANN-PA model performed better than the traditional ANN. Furthermore, Zhu et al. (2023) optimized the conversion of wet waste into energy and carbon-neutral goods through pyrolysis and hydrothermal carbonization (HTC) using machine learning. In a case study of wet food waste, the method significantly increased the Carbon Stability Index (CSI) and Return on Energy Investment (REI). The model's promise for sustainable waste-to-energy solutions in line with SDGs 7 and 15 was supported by its outstanding predictive performance. Additionally, Talaat et al. (2024) created a method to forecast wind speed and maximize wind turbine power using machine learning and deep learning. The technology improved turbine efficiency and power recommendations by estimating 15-day power production with 94% accuracy and 6% inaccuracy. Additionally, Sadeghi et al. (2024) investigated how peer-to-peer trading on blockchain technology can improve energy resilience. Using energy data from Texas, a decision-making algorithm demonstrated increased efficiency and decreased usage. In order to promote the role of blockchain-based smart grids in more robust and efficient energy systems, it presents the SARIMA algorithm for predicting energy demand.
This research highlights the need for more sophisticated systems that can handle these issues by pointing out a number of significant shortcomings in the forecasting techniques currently used for SDG 2, notably those pertaining to hunger and food security. Traditional models frequently struggle to reflect the intricate temporal patterns and dynamic relationships that affect hunger levels. Conventional approaches offer advantages, but they might not be sophisticated enough to completely comprehend the complex linkages and time-dependent elements present in food security data. This article presents a unique strategy utilizing a 1D Convolutional Neural Network (1D-CNN) to get around these restrictions. Because it can identify and extract patterns across time, the 1D-CNN is especially well-suited for analyzing hunger-related sequential and time-series data. The 1D-CNN offers a more sophisticated forecasting technique than previous models, which could oversimplify or ignore the complex dynamics of hunger patterns. It does this by using its deep learning capabilities to collect and analyze the complex temporal linkages that affect food security.
3 Proposed model
This section outlines the steps used to develop the prediction model for predicting the results of SDG 2 (Zero Hunger). SDG 2 (Zero Hunger) is the subject of this study, which makes use of the following particular dataset indicators: Prevalence of undernourishment, Prevalence of moderate or severe food insecurity, Prevalence of stunting among children under five, and Cereal yield per hectare. These metrics were chosen because they provide direct measurements of agricultural production, nutrition, and food access—all of which are essential components of SDG 2. A wide variety of economic, geographical, and agricultural situations are represented by the five countries that were chosen: China, Egypt, Saudi Arabia, Sweden, and the United States. These countries were selected due to the completeness of their SDG 2 data and their applicability in demonstrating various policy stances on sustainable agriculture and food security. All of the crucial processes are well explained, including the training procedure, the one-dimensional Convolutional Neural Network (1D-CNN) architecture, and data preparation. The method uses sophisticated machine learning algorithms to find intricate connections and time trends in nutrition, hunger, and food insecurity data. By using these strategies, the model is able to produce precise projections that accurately represent each nation's progress toward attaining food security and better nutritional outcomes in line with SDG 2.
3.1 Data collection and preprocessing
The “Sustainable Development Report” Kaggle dataset, which aggregates nation-level SDG scores from 2000 to 2022, provided the data utilized in this analysis (Sazid, 2023). An extensive overview of national and global progress toward the 17 Sustainable Development Goals (SDGs) put out by the UN is provided by this extensive dataset. It includes a broad range of metrics that represent different social, economic, and environmental aspects. The dataset covers the period from 2000 to 2022 and contains Sustainable Development Goal (SDG) scores for five countries: the United States, China, Saudi Arabia, Sweden, and Egypt. The yearly records include the SDG index score and the individual scores for each of the 17 SDG goals, culminating in a total of 1,955 entries across various countries and years. A two-step approach was used to handle missing values in order to guarantee data quality. For brief gaps (1 to 2 years), linear interpolation was employed to keep the time series continuous, whereas forward-filling was used for longer sequences. To ensure data dependability, countries with more than 20% missing values for any of the SDG 2 indicators were excluded from the study. To comprehend the distribution of each indicator, descriptive statistics including mean, standard deviation, and range were calculated. To ensure a consistent scale and enhance the training efficiency of machine learning models, all numerical features were normalized through Min-Max scaling. This research has a strong emphasis on SDG 2 (Zero Hunger), paying particular attention to metrics pertaining to access to wholesome food, agricultural production, food security, and malnutrition. Finding patterns and trends in this information will help illuminate the difficulties and advancements in accomplishing SDG 2. In order to produce precise predictions of future hunger-related outcomes and facilitate evidence-based decision-making, the study makes use of sophisticated machine learning techniques, such as the one-dimensional Convolutional Neural Network (1D-CNN), by utilizing this vast and varied data.
The data shows yearly and national progress toward SDG 2 (Zero Hunger) using calculated scores. A number of factors related to food security and nutritional development are evaluated by specific indicators, such as the incidence of undernourishment, rates of child malnutrition, agricultural production, availability of wholesome food, and encouragement of sustainable farming methods. Each nation's SDG Index score is determined by combining these variables, providing a thorough assessment of how well it is performing in respect to the global goals for eradicating hunger. To get the data ready for sequential modeling, a number of preprocessing procedures were carried out before to training the one-dimensional Convolutional Neural Network (1D-CNN) model. SDG ratings in the dataset differ between nations and objectives. All SDG scores, including the SDG 2-specific indicators and the overall SDG Index, were normalized into a range between 0 and 1 using MinMax scaling in order to enhance model performance and guarantee uniformity. This change promotes quicker convergence during training by ensuring that characteristics with wider numerical ranges do not disproportionately affect learning. The MinMaxScaler function from the sklearn package was used to implement the normalization procedure. This scaling strategy lowers the danger of overshadowing smaller-magnitude characteristics and improves learning by balancing the contribution of each SDG objective and the total SDG Index score during training. In the end, this preprocessing step makes the prediction model more robust, allowing for more precise evaluations of international initiatives to end hunger and provide food security.
3.2 Feature selection
The whole dataset which includes all 17 Sustainable Development Goals (SDGs) as well as individual and index scores for SDG 2 (Zero Hunger) were used in this study. This extensive dataset is an essential tool for assessing and projecting advancement toward the SDG framework of the UN, particularly when it comes to tackling pressing issues like hunger, food insecurity, and malnutrition. The dataset is arranged into a number of important columns, each of which offers useful data for analysis:
• Country code: to enable dependable data management and effective cross-country comparisons, each nation is given a distinct alphanumeric identification. Maintaining data consistency is crucial, especially when combining data from several sources for more extensive regional or international analysis.
• Country: to assist researchers in placing the data into particular geographic and cultural contexts, this column provides a list of the names of the nations included in the dataset. Interpreting differences in country approaches to preventing hunger and attaining food security requires this kind of background.
• Year: time-series analysis requires the incorporation of a temporal component. By indicating the year that each data relates to, this column makes it possible to analyze trends and assess how measures connected to hunger have changed over time. Additionally, it enables scholars to evaluate how certain policies, crises, or interventions affect a country's advancement toward SDG 2.
• SDG index score: a nation's overall performance in relation to all 17 SDGs is reflected in this composite score. In order to assist determine which nations are making progress or falling behind in their efforts at sustainable development, including programs to eradicate hunger, it acts as a single indicator to make comparisons easier both within and across nations.
• SDG 2 (Zero Hunger) score: this score particularly evaluates a nation's advancement toward SDG 2 (Zero Hunger). Numerous statistics pertaining to food availability, rates of malnutrition, agricultural production, and systems that promote sustainable agriculture are included. This score's level of detail allows for a thorough assessment of national hunger-eradication initiatives, identifying both their strong points and places for development.
The need to comprehend both the more general and more focused aspects of sustainable development is the driving force behind the use of both the SDG Index scores and individual target scores for SDG 2 (Zero Hunger). While the individual SDG 2 ratings offer a more thorough analysis of important indicators pertaining to food security, malnutrition, and agricultural sustainability, the SDG Index score allows academics to rapidly evaluate the overall progress made by a country toward sustainable development. A targeted examination of the particular difficulties and successes related to hunger reduction initiatives in various geographical and socioeconomic situations is made possible by these detailed measures.
Furthermore, examining the interactions between different SDG 2 targets and other objectives can highlight significant trade-offs and synergies, which are crucial for creating comprehensive and successful hunger reduction strategies. The time-series character of the dataset is essential for predictive modeling. The model may predict future SDG 2 results by detecting long-term trends and historical patterns, providing stakeholders and policymakers working toward the 2030 objective of eliminating hunger with important insight. In the end, this dataset is a strategic tool for well-informed policy formation and decision-making, in addition to being a potent tool for assessing progress toward SDG 2. By eliminating hunger and advancing universal food security, it advances the larger goal of attaining sustainable development.
3.3 Model architecture
In order to predict scores associated with Sustainable Development SDG 2 (Zero Hunger), this study used a one-dimensional Convolutional Neural Network (1D-CNN) model with sequential data. The model forecasts future SDG 2 index scores and individual goal scores using historical data, providing insightful information about new trends and supporting policymakers in the strategic design of food security and hunger reduction programs. A sliding window forecasting method was utilized, employing data from the previous 3 years to forecast the following year. The model, for instance, employs data from the years 2019 to 2021 in order to forecast the SDG 2 score for 2022. This rolling strategy recursively predicts values on an annual basis until 2030. Convolutional layers, pooling layers, and fully linked dense layers make up the model architecture, as shown in Figure 2. A random search approach was used to adjust hyperparameters such the number of filters, learning rate, batch size, and kernel size. The configuration that produced the least amount of validation loss was chosen. In order to reduce overfitting, validation loss was used to track model performance even though regularization strategies and early stopping were not used in this investigation. Sufficient generalization was shown by the consistency of training and validation performance. All of these layers are designed to analyze and learn from time-series data. We go into great depth about each part of the architecture and how it contributes to the forecasting process as a whole below.
1. Input layer: the model is fed input sequences in the form of (None, 377, 1), where 377 is the number of time steps and the single feature dimension is time-series data pertaining to indicators of hunger like agricultural productivity, food insecurity, and malnutrition rates.
2. To allow the model to capture fine-grained temporal correlations in each individual feature without adding needless feature interactions, a kernel size of 1 was selected for the Conv1D layers. When working with time series data, where each input characteristic changes over time individually, this works very well.
3. First convolutional layer: using the Rectified Linear Unit (ReLU) activation function, the first layer (Conv1D_6) is a one-dimensional convolutional layer with 64 filters. It looks for local patterns in the data, like changes in crop yield trends or changes in food access, by scanning across the time axis. The output structure that results is (None, 375, 64), with the time steps being somewhat shortened according to the kernel size.
4. Second convolutional layer: by using 128 filters, the second convolutional layer (Conv1D_7) expands the model's comprehension. As a result, more abstract and high-level temporal variables related to long-term hunger reduction patterns may be extracted by the model. The form of its output is (None, 185, 128).
5. Pooling layers: to lower the computational cost and temporal resolution, a MaxPooling1D layer (max_pooling1d_6 and max_pooling1d_7) is applied after each convolutional layer. It preserves the most crucial elements by choosing the highest value inside each window. For instance, to enable quick processing without losing important information, the sequence length is cut in half, from 375 to 187 and then further to 92.
6. Flattening layer: a flatten layer (flatten_3) is used to flatten the output tensor of shape (None, 92, 128) into a one-dimensional vector with 11,776 elements. This change connects the dense prediction layers and convolutional feature extraction.
7. Dense layers: to understand intricate correlations between the retrieved characteristics and discover important elements impacting hunger patterns, a dense (completely connected) layer (dense_6) with 128 neurons and ReLU activation is employed. By randomly turning off a portion of neurons during training, a Dropout layer (dropout_1) with a rate of 0.5 is created to improve generalization and avoid overfitting.
8. Output layer: 17 neurons make up the output layer, with each one representing the predicted score for one of the 17 SDG goals. Thanks to this structure, the model can perform multi-output regression and predict all SDG scores for a given year at the same time. Each of the 17 neurons in the last layer (dense_7), which has linear activity, represents the expected score for one of the SDG 2 objectives, such as the prevalence of undernourishment, the availability of food, or sustainable agriculture. The model's simultaneous prediction of several variables linked to SDG 2 (Zero Hunger) is shown in the output form (None, 17).
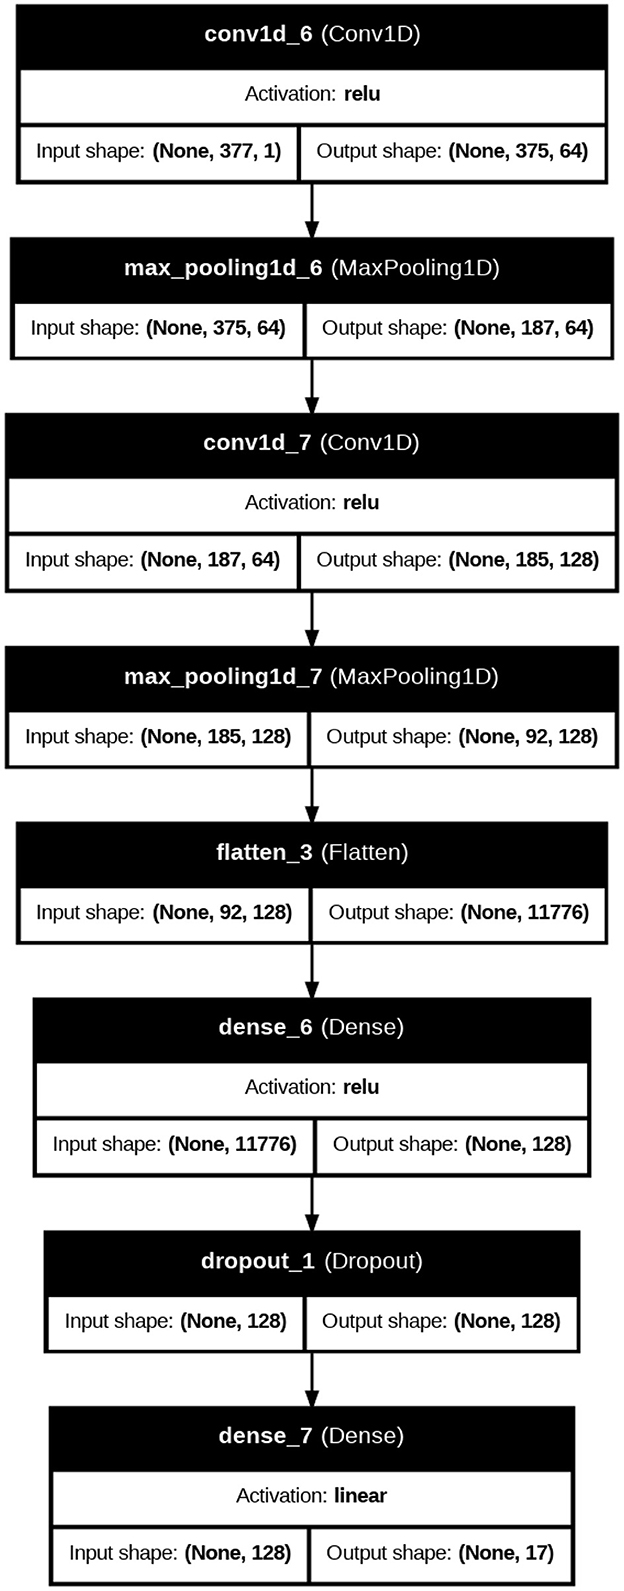
Figure 2. Proposed deep learning model.
Eighty percent of the dataset was used for training and the remaining 20 percent was reserved for validation in order to develop the model for predicting SDG 2 (Zero Hunger) indicators. In addition to ensuring that the model learns from a significant amount of the data—capturing trends in hunger, food security, and agricultural productivity—this division also makes it possible to assess the model's performance on data that hasn't been seen before. During training, the data was divided into smaller groups using batch processing. By introducing helpful randomness (stochasticity), this method speeds up training by assisting the model in escaping local minima in the loss landscape and encouraging more steady convergence. With Mean Absolute Error (MAE) as the loss function Mean Squared Error (MSE) and Root Mean Squared Error (RMSE) as an extra performance indicator, the suggested model makes use of the Adaptive Moment Estimation (Adam) optimizer. Adam is ideally suited for time-series prediction as it dynamically modifies learning rates throughout training. By using the square root of the average squared differences, RMSE gives information about the size of prediction errors, whereas MAE calculates the average absolute difference between actual and predicted hunger-related data. Coefficient of Determination (R2) quantifies the degree of accuracy with which the model's predictions reflect the real data. It shows the ratio of variance in the dependent variable that can be predicted from the independent variables. Additionally, Mean Absolute Percentage Error (MAPE) expresses the precision of predictions in percentage terms, showing the average absolute error relative to actual values. These measures are essential for assessing how well the model predicts SDG 2 goal scores. These can be stated as follows:
where n is the total number of data points that were recorded, yj is the actual value, and xj is the predicted value. The tests carried out to create, verify, and assess the suggested model for predicting SDG 2 (Zero Hunger) indicators are described in the section that follows.
A randomized grid search method was used to tune hyperparameters, ensuring optimal model performance and avoiding arbitrary choices. This included establishing a set of values for essential parameters such as learning rate [0.0001, 0.001, 0.01], dropout rate [0.2, 0.3, 0.5], batch size [32, 64, 128], and the number of units in hidden layers [32, 64, 128]. 5-fold cross-validation was used to evaluate each configuration, with performance assessed through validation loss and accuracy. The configuration that performed best, chosen on the basis of average validation MAE, was used for the final model training. Thanks to this systematic approach, the final hyperparameters shown in Table 1 were not chosen at random; rather, they were validated empirically for robustness and generalization. In order to minimize the danger of overfitting and enable the model to detect complex patterns in the data, we employed 200 epochs during the training phase. The training dataset was fully traversed throughout each epoch, allowing the model to modify its weights in order to lower the loss function. We kept a careful eye on both training and validation losses to make sure the model maintained its capacity to generalize efficiently, increasing prediction accuracy on unknown data. The model was particularly created to forecast SDG 2 scores for the years 2025 to 2030, in line with the UN's 2030 deadline for accomplishing the Sustainable Development Goals, using historical data from the previous 3 years as the time step. The model can account for continuous trends and variations in the endeavors to eradicate hunger and attain food security because of the 3-year time step. The model finds trends and changes that could affect future results by examining the data from the previous 3 years. This strategy gives stakeholders the ability to focus policy changes and resource distribution on regions where efforts to reduce hunger are falling short, offering insightful information for well-informed decision-making. Additionally, the model's output makes it possible to assess how well-suited current policies and initiatives are to achieving SDG 2, which will ultimately lead to more targeted and significant initiatives to end hunger in a sustainable manner.
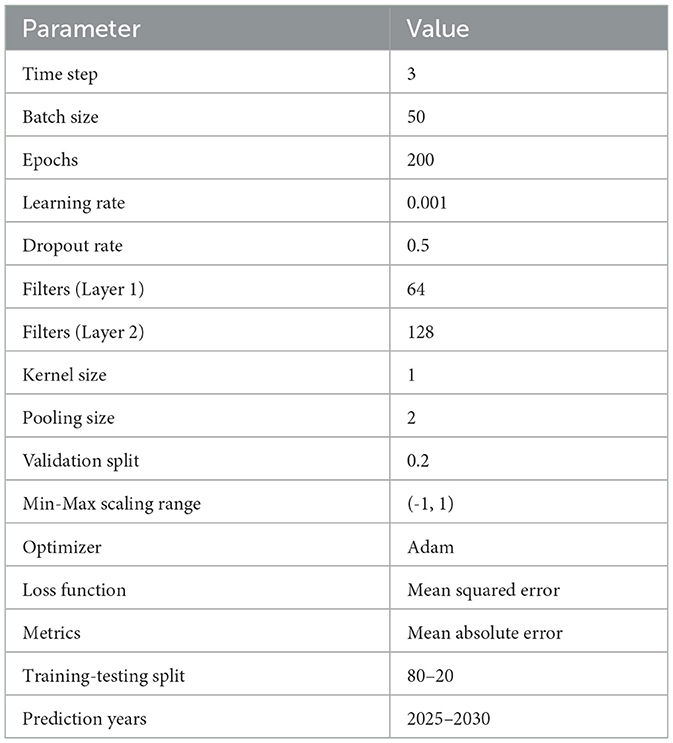
Table 1. 1D-CNN model parameters for SDG forecasting.
4 Results and discussion
The outcomes of the one-dimensional convolutional neural network (1D-CNN) model that was used to forecast future SDG 2 scores are shown in this section. Both training and validation datasets are used to assess the model's performance, with an emphasis on its capacity to predict hunger-related outcomes for the years 2025–2030 and to generalize findings. We go over the model's main conclusions, evaluate how these predictions could affect upcoming sustainable development projects, and contrast the anticipated SDG 2 scores with historical patterns. The findings are placed in the context of practical uses, highlighting how the model's predictions might influence strategic planning and policy choices in the battle against hunger. We also provide a connection chart that illustrates how SDG 2 results relate to other pertinent measures. The correlation coefficients measure the direction and intensity of the linear correlations between variables, as seen in Figure 3. Strong positive connections between SDG 2 and a number of other SDGs are seen in the correlation matrix, highlighting the connection between reducing hunger and more general development objectives. These findings may be used by policymakers to create plans that concurrently address many SDGs. Intriguing linkages that want more research to fully comprehend the underlying causes of these links are also shown by the correlation matrix.
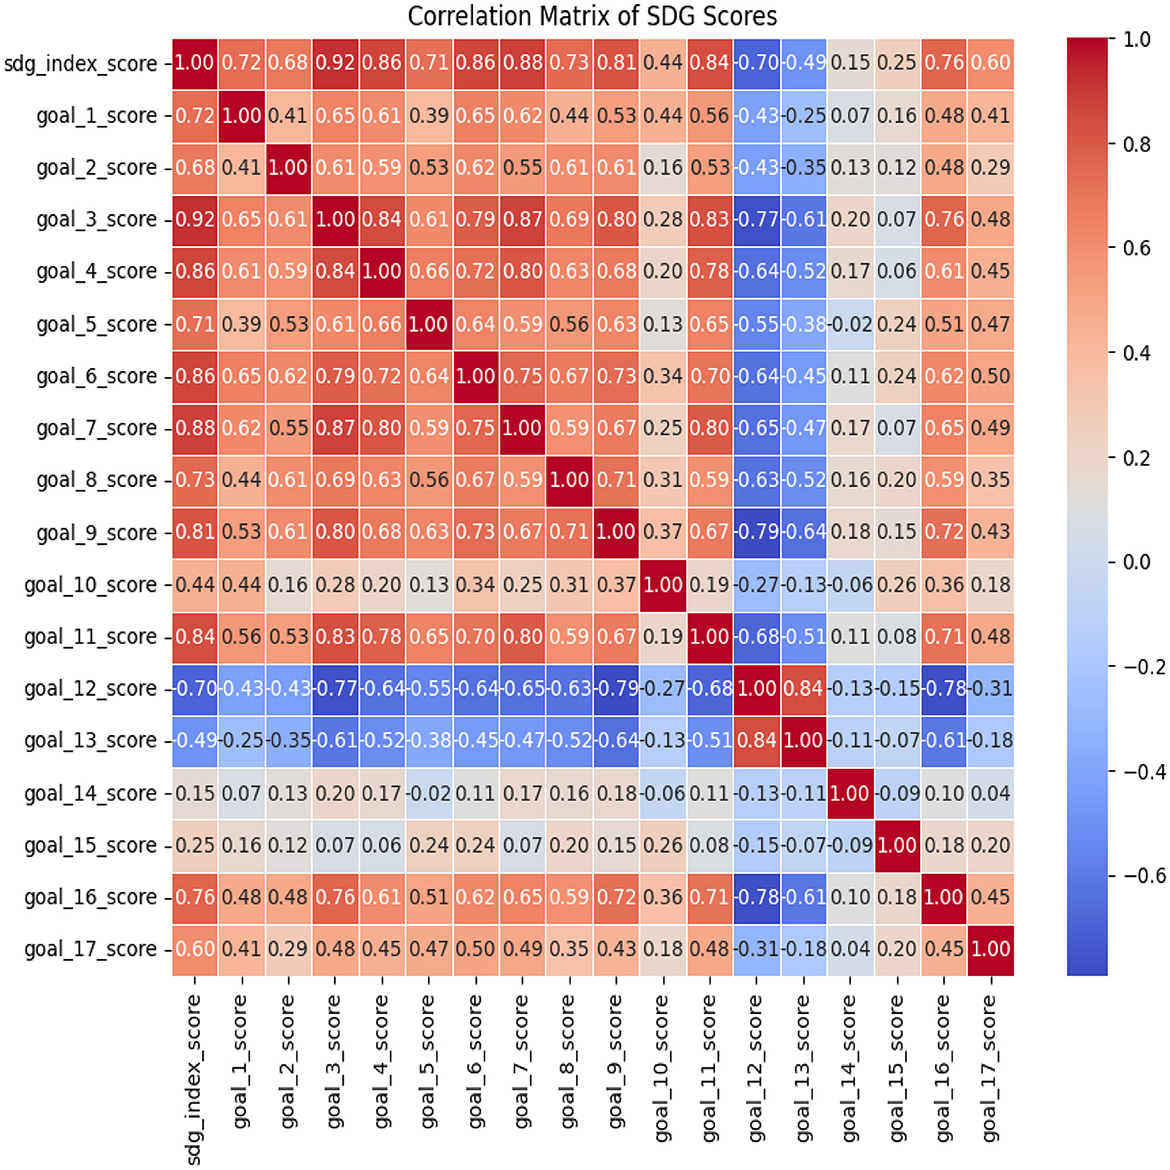
Figure 3. Correlation coefficients between the various SDG scores.
The 1D-CNN model's training and validation loss curves, shown in Figure 4, are essential for assessing the model's functionality and spotting any problems like overfitting. The orange curve shows the model's performance on the validation data, which is not used for training and is used to evaluate generalization, whereas the blue curve shows the model's performance on the training data. Effective learning of the model is shown by a discernible drop in training and validation loss over the first epochs. Despite a steady decline in training loss, the validation loss may plateau or even increase as the number of epochs rises, indicating that the model may be beginning to overfit to the training data. The curves' forms indicate that the model has attained an ideal training level without suffering from extreme overfitting because the validation loss does not considerably rise in comparison to the training loss. The 1D-CNN algorithm shows potential in forecasting future SDG 2 (Zero Hunger) scores based on these loss curves. The model's capacity to generalize is demonstrated by the rather consistent validation loss, which demonstrates that it can apply the information learnt from the training data to previously unknown data. However, additional validation using a separate test dataset is required in order to completely evaluate the model's overall efficacy. Even though the loss curves show that the model is doing a good job of forecasting SDG 2 results, more testing and enhancements are required to guarantee its resilience and pinpoint possible areas for future research.
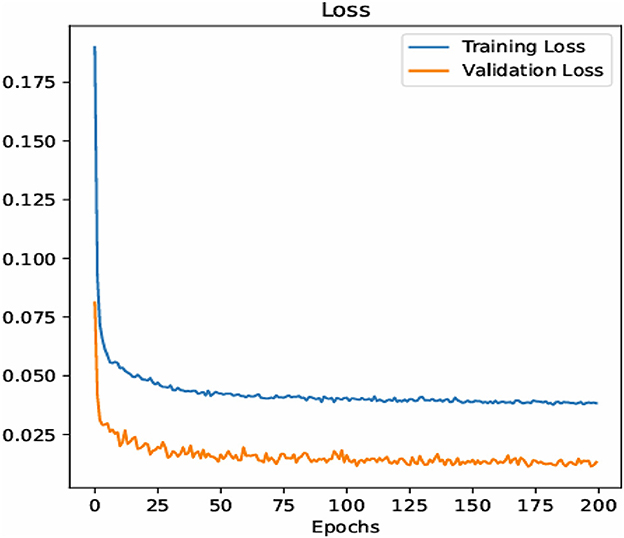
Figure 4. The training and validation loss curves for a 1D-CNN model.
The efficiency of the suggested technique is demonstrated by the predicting results for Sustainable Development Goal 2 (SDG 2) scores, which are shown in Figure 5. The actual (historical) SDG 2 scores and the expected scores across different time steps are contrasted in each subplot. Both predicted future years and previous training years may be included in these time periods. On the y-axis, each SDG 2 score is shown, usually normalized within a predetermined range (e.g., 0 to 1). The blue line displays the actual SDG 2 scores, which either reflect historical data or serves as a baseline for the forecasts, while the red line displays the expected SDG 2 scores determined by the 1D-CNN model. The blue (actual) and red (predicted) lines closely overlap, indicating that the model does a good job of forecasting future events. The model's tight tracking of the actual scores demonstrates its capacity to identify underlying trends and patterns in the SDG 2 time series. Even if there are some noticeable differences, they are small and point to sporadic difficulties in forecasting certain numbers. Nonetheless, the majority of subplots show excellent performance, with no discrepancy between the expected and actual values. Because the model use historical data to efficiently detect previous linkages and apply them to future forecasts, the results emphasize the significance of taking time-dependent patterns into account. Overall, the figure shows how well the model predicts SDG 2 scores, with most subplots displaying a high degree of agreement between predicted and actual values. Even if certain variations point to areas that need more work, these insights can help stakeholders and policymakers make well-informed, data-driven decisions to prepare for future actions in alleviating hunger.
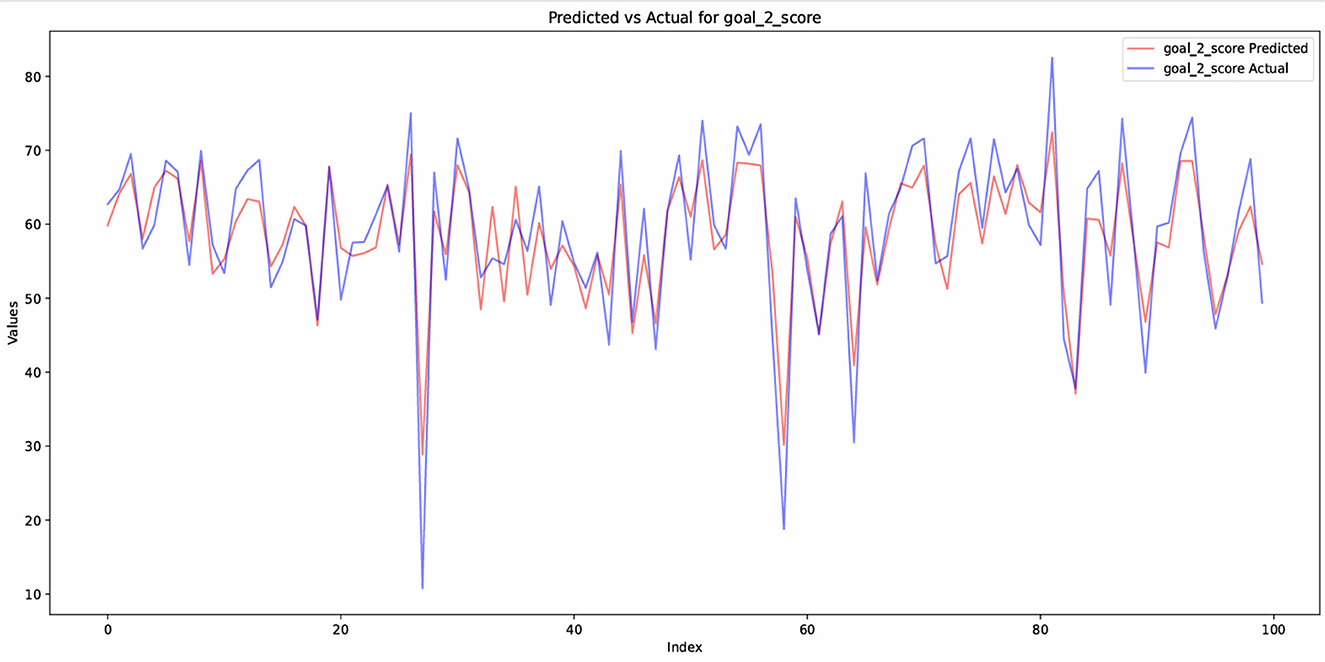
Figure 5. Comparison of actual and predicted SDG2 scores.
Five major nations—China, the United States, Sweden, Saudi Arabia, and Egypt—are shown in this section with their Sustainable Development Goal (SDG) 2 ratings for the years 2024–2030. Due to their distinct development plans, varied socioeconomic situations, and varied approaches to combating hunger, these countries were chosen. This research aims to give a thorough knowledge of international efforts to fight hunger by looking at nations from various geographical locations and economic development levels. In an effort to guarantee food access for its people, China, whose economy is expanding quickly, has made significant investments in agricultural and food security. The US offers a distinctive viewpoint on addressing food insecurity among marginalized populations because of its emphasis on community-driven initiatives and cutting-edge technical solutions. Sweden, a country renowned for its strong welfare system and high standard of living, has effective regulations that support sustainable food production and fair resource distribution, especially for disadvantaged groups. By diversifying its economy and enhancing social services like food security and nutritional programs, Saudi Arabia is attempting to accomplish SDG 2 through its Vision 2030 plan. In the meanwhile, Egypt, a developing country, is aggressively pursuing reforms aimed at enhancing economic inclusion and expanding access to important services, both of which are critical to lowering hunger and enhancing food systems.
Figure 6 shows the estimated Sustainable Development Goal (SDG) 2 Index Scores for the United States, Saudi Arabia, Sweden, Egypt, and China from 2025 to 2030. With ratings that are continuously over 80%, Sweden is in the lead, demonstrating its sophisticated approaches to sustainable agriculture, food security, and fair access to nutrition. With scores ranging from 75% to 80%, the United States continues to make progress toward reducing hunger and improving food security, especially through agricultural innovation and food assistance programs, despite obstacles like regional disparities and food distribution in some areas. China, Saudi Arabia, and Egypt all show comparable patterns, with scores ranging from 65% to 75%. By employing a range of strategies, including economic diversification, poverty alleviation measures, and agricultural reforms, these nations are making significant progress against hunger. They exhibit consistent progress in important areas including expanding food availability, boosting nutritional access, and strengthening agricultural sustainability, even if their ratings are marginally lower than those of Sweden and the US. The disparities in the global advancement of SDG 2 are shown by this graphical comparison. It offers insightful information on regional potential and difficulties, emphasizing the necessity of specialized approaches to end hunger by 2030 that are based on the particular goals and circumstances of each nation.
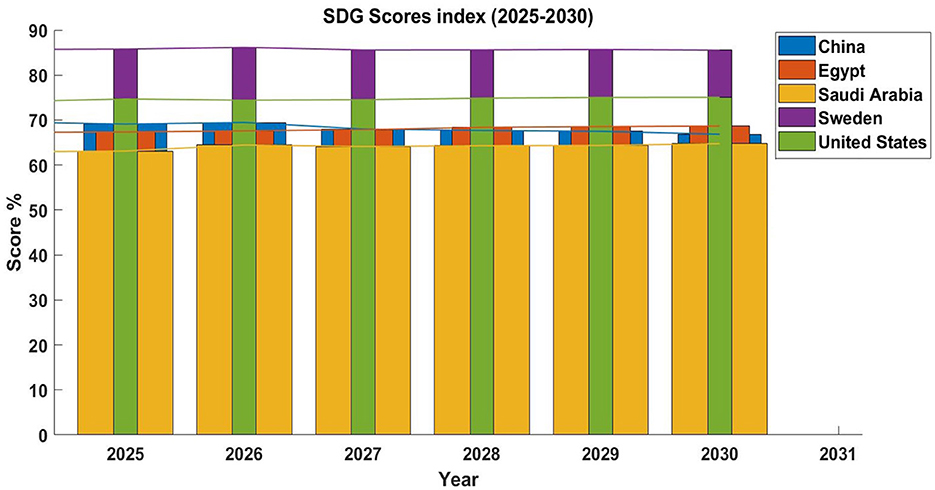
Figure 6. Predicted SDG index scores (2025–2030).
Figure 7 shows the expected results for five countries (China, Egypt, Saudi Arabia, Sweden, and the United States) with respect to Sustainable Development Goal 2 (SDG 2), “SDG 2 (Zero Hunger),” from 2024 to 2030. The predicted scores for each nation are shown on the graph's y-axis, and they probably represent how far along they are in ending hunger and attaining food security. The 2024–2030 timeline provided by the x-axis makes it easy to evaluate how far each nation has come in achieving SDG 2. It is feasible to compare the anticipated future results for any country by looking at the patterns in the graph. Indicating that they are on pace to reach or perhaps surpass the SDG 2 objectives, Sweden and the US are expected to sustain high and steady scores over the course of the time. Sweden's well-established social welfare programs, sustainable farming methods, and efficient food delivery networks are responsible for the country's progress in increasing food security and decreasing hunger. Similar to this, the US is anticipated to keep making consistent improvement because of its strong food aid programs, agricultural technological advancements, and continuous initiatives to alleviate food insecurity in populations that are particularly susceptible. China and Egypt, on the other hand, exhibit a trend of steady progress throughout time. Even while both nations are making great progress, their ratings show that there are still issues, especially when it comes to resolving the differences in food access between rural and urban areas. Although China has seen success with its emphasis on social welfare programs, agricultural modernization, and poverty reduction, the country still confronts challenges including environmental variables and rural-urban disparity. Although Egypt has made headway in increasing agricultural sustainability and food availability via legislative changes, the country still confronts challenges with resource allocation and political instability that might impede further advancement. Saudi Arabia's predicted ratings are mostly unchanged, indicating that although efforts are being made, SDG 2 development might not be as rapid as would be ideal. The nation's dependence on food imports and the requirement for more effective agricultural systems provide obstacles to its success, even with significant expenditures made in food security and economic diversification as part of Vision 2030. All things considered, Figure 7 shows how these five nations have progressed differently toward SDG 2. China and Egypt have the ability to gradually improve, Saudi Arabia's route to reaching “SDG 2 (Zero Hunger)” confronts some obstacles, while Sweden and the US are on track for ongoing progress. In the battle against hunger, these forecasts highlight the need of customized approaches that take into account the particular possibilities and problems faced by each nation.
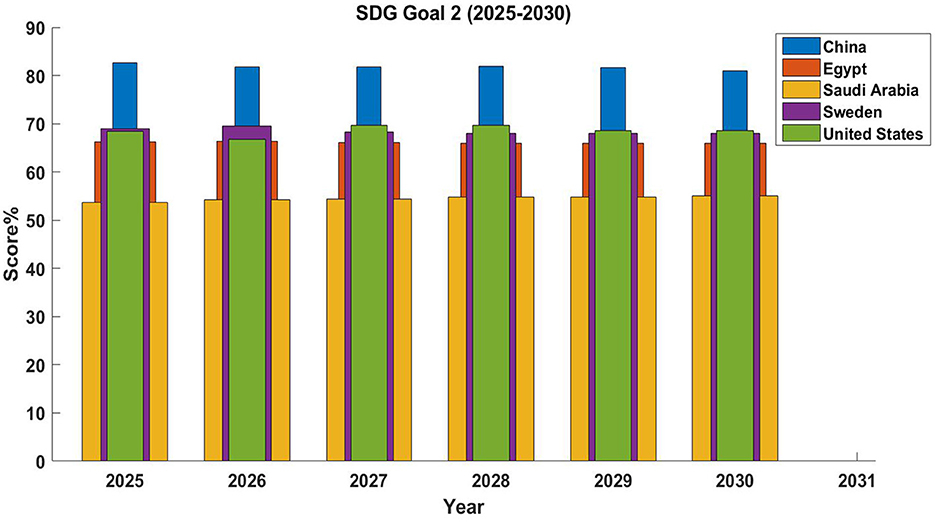
Figure 7. SDG SDG 2 (Zero Hunger) (2025–2030).
To improve the interpretability of our findings, we include illustrative country-level examples and statistical measurements that illustrate the model's performance. For example, Sweden's consistently high SDG 2 estimates (over 80%) reflect the country's long-standing investment in sustainable agriculture and social welfare measures, which have effectively reduced hunger. In contrast, Egypt's progressive rise in expected ratings reflects the impact of recent economic and agricultural measures targeted at improving food security. Furthermore, the model's accuracy is confirmed by low Mean Absolute Error (MAE) and Root Mean Square Error (RMSE), Mean Absolute Percentage Error (MAPE) values, as well as significant positive correlation coefficients between actual and projected scores (for example, r > 0.9 in most nations). These quantitative findings support the model's dependability and the relevance of the insights derived for strategic planning.
A comparative analysis of three neural architectures—1D Convolutional Neural Network (1D-CNN), Long Short-Term Memory (LSTM), and Gated Recurrent Unit (GRU) was performed—to evaluate the performance of the proposed models as shown in Table 2. The same dataset, preprocessing steps, and early stopping criteria were used to train and evaluate all models under consistent conditions. Across all performance metrics, the 1D-CNN model surpassed both LSTM and GRU. In particular, it obtained a Mean Squared Error (MSE) of 54.2489, a Mean Absolute Error (MAE) of 6.21, and a Mean Absolute Percentage Error (MAPE) of 16.46%, all of which are the lowest values recorded, while its coefficient of determination (R2) reached an unprecedented high of 0.8383. Conversely, the LSTM and GRU models demonstrated significantly higher error rates, with LSTM achieving a MAPE of 51.73% and GRU attaining 46.98%. The 1D-CNN model's effectiveness in extracting localized temporal features from the input sequences likely accounts for its robustness and suitability for this forecasting task, as demonstrated by these findings.
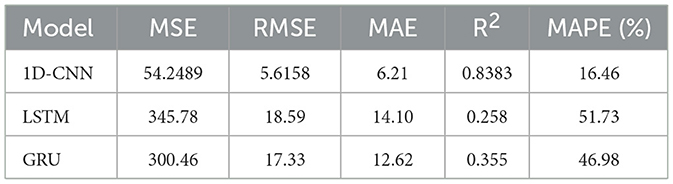
Table 2. Performance comparison of 1D-CNN, LSTM, and GRU models.
Furtermore, The Wilcoxon signed-rank test, which is a non-parametric alternative suitable when the normality assumption is not guaranteed, is used to assess the statistical significance of the differences between the actual and predicted SDG 2 scores. With a statistic of 46,620,696 and a p-value < 0.001, the test results indicate a statistically significant difference between the predicted and actual values. This indicates that the model shows a consistent estimation trend, which, despite being statistically significant, is acceptable within practical error margins, as demonstrated by low MAE and MAPE values. Moreover, bootstrapping is used to calculate the 95% confidence interval for the predicted SDG 2 scores. The interval produced, [62.09, 62.78], indicates a narrow and stable prediction range, highlighting the reliability and stability of the proposed model.
It is critical to acknowledge that physical environmental elements have a substantial impact on food security results in addition to the temporal forecasting of SDG 2 scores. Factors including soil health, the frequency of extreme weather events, and climatic variables (such as rainfall patterns and temperature swings) have a direct impact on agricultural output and, consequently, the efficacy of hunger mitigation measures. Crop yields, food availability, and distribution networks are all impacted by these environmental processes and circumstances, which also pose risks and uncertainties that have an impact on achieving SDG 2 objectives. Although the present 1D-CNN model mostly uses historical socioeconomic and development data relevant to the SDGs, further research might improve prediction accuracy by including environmental information and agro-climatic model simulation outputs. These elements would enable a more thorough evaluation and proactive reduction of the hazards associated with environmental unpredictability, eventually promoting more robust and flexible food security regulations. Although the loss curves indicate that the model is effectively predicting SDG 2 outcomes, more testing and improvements are necessary to ensure its robustness and identify potential research topics.
The 1D-CNN model's predictions provide crucial direction for decision-makers. These findings may be used to modify food security plans in countries that are predicted to have stasis or deterioration in SDG 2 performance, such as those impacted by economic crises or climatic variability. For example, governments can think about increasing funding for resilient farming methods, enhancing rural infrastructure, or extending the reach of social safety nets. Furthermore, the model's capacity to recognize temporal trends enables decision-makers to foresee future difficulties and take preventative measures, like preparing for drought or modifying food subsidies. Countries may better connect their efforts with the 2030 Agenda and guarantee that no population is left behind in the goal of SDG 2 (Zero Hunger) by incorporating data-driven projections into their national development plans.
5 Conclusion
To precisely estimate the advancement of Sustainable Development Goal SDG 2 (Zero Hunger) scores between 2025 and 2030, the current study makes use of a reliable time series forecasting model built on a one-dimensional Convolutional Neural Network (1D-CNN). The main subjects of this investigation are China, Saudi Arabia, Egypt, Sweden, and the United States. Using deep learning techniques, the model effectively projects each nation's progress toward sustainable agriculture and food security by identifying temporal trends in historical data from 2000 to 2022. The results demonstrate the model's effectiveness in identifying and assessing patterns related to the reduction of hunger, while also generating accurate forecasts that align with international sustainable development criteria. With estimates limited to a realistic range of 0 to 100, the technique guarantees that the forecasts are based on the dynamics of past performance related to food security and agricultural development. In addition to improving our knowledge of the many routes to SDG 2 (Zero Hunger), this study offers insightful information to governments, stakeholders, and international organizations working to advance food security programs. The model is an essential tool for decision-makers, enabling nations to make well-informed decisions on the distribution of resources and the strategic measures necessary to accomplish SDG 2. Future studies might improve these results by investigating different modeling approaches and adding more variables, such economic circumstances or climate change. This could lead to a more sophisticated comprehension of the obstacles and possibilities involved in eradicating hunger worldwide.
Data availability statement
The original contributions presented in the study are included in the article/supplementary material, further inquiries can be directed to the corresponding author.
Author contributions
GA: Funding acquisition, Writing – review & editing, Supervision, Project administration. AE: Project administration, Writing – review & editing, Formal analysis, Supervision. RO: Resources, Validation, Conceptualization, Writing – review & editing, Data curation, Methodology, Formal analysis, Writing – original draft, Software, Investigation, Visualization.
Funding
The author(s) declare that financial support was received for the research and/or publication of this article. This research is funded by Princess Nourah bint Abdulrahman University Researchers, with grant number PNURSP2025R705.
Acknowledgments
The authors extend their appreciation to Princess Nourah bint Abdulrahman University Researchers Supporting Project number (PNURSP2025R705), Princess Nourah bint Abdulrahman University, Riyadh, Saudi Arabia.
Conflict of interest
The authors declare that the research was conducted in the absence of any commercial or financial relationships that could be construed as a potential conflict of interest.
Generative AI statement
The author(s) declare that no Gen AI was used in the creation of this manuscript.
Publisher's note
All claims expressed in this article are solely those of the authors and do not necessarily represent those of their affiliated organizations, or those of the publisher, the editors and the reviewers. Any product that may be evaluated in this article, or claim that may be made by its manufacturer, is not guaranteed or endorsed by the publisher.
References
Adegoke, Y., Mbonigaba, J., and George, G. (2025). Sustainable development goals (SDGs), public health expenditures, and maternal and child mortality in selected African countries: forecasting modelling. Int. J. Environ. Res. Public Health 22:482. doi: 10.3390/ijerph22040482
Alsoruji, G., Basem, A., Abd-Elaziem, W., Moustafa, E. B., Abdelghaffar, M., Mourad, A.-H. I., et al. (2024). Modeling of a hybrid stirling engine/desalination system using an advanced machine learning approach. Case Stud. Therm. Eng. 60:104645. doi: 10.1016/j.csite.2024.104645
Alturif, G., Saleh, W., El-Bary, A. A., and Osman, R. A. (2024). Using artificial intelligence tools to predict and alleviate poverty. J. Entrep. Sustain. Issues 12, 400–413. doi: 10.9770/b8436764898
Bennich, T., Persson, A., Beaussart, R., Allen, C., and Malekpour, S. (2023). Recurring patterns of SDG interlinkages and how they can advance the 2030 agenda. One Earth 6, 1465–1476. doi: 10.1016/j.oneear.2023.10.008
Chang, A., Lee, T.-S., and Lee, H.-M. (2024). Applying sustainable development goals in financial forecasting using machine learning techniques. Corp. Soc. Responsib. Environ. Manag. 31, 2277–2289. doi: 10.1002/csr.2694
Charles, V., and Emrouznejad, A. (2024). DEA-based index systems for addressing the united nations' SDGs. Environ. Sci. Policy 162:103950. doi: 10.1016/j.envsci.2024.103950
Chenary, K., Kalat, O. P., and Sharifi, A. (2024). Forecasting sustainable development goals scores by 2030 using machine learning models. Sustain. Dev. 32, 6520–6538. doi: 10.1002/sd.3037
Chishti, M. Z., Khalid, A. A., and Sana, M. (2023). Conflict vs sustainability of global energy, agricultural and metal markets: a lesson from Ukraine-Russia war. Resour. Policy 84:103775. doi: 10.1016/j.resourpol.2023.103775
Gawdiya, S., Kumar, D., Ahmed, B., Sharma, R. K., Das, P., Choudhary, M., et al. (2024). Field scale wheat yield prediction using ensemble machine learning techniques. Smart Agric. Technol. 9:100543. doi: 10.1016/j.atech.2024.100543
Ghufran, M., Aldieri, L., Pyka, A., Ali, S., Bimonte, G., Senatore, L., et al. (2025). Food security assessment in the light of sustainable development goals: a post-paris agreement era. Environ. Dev. Sustain. 27, 4541–4569. doi: 10.1007/s10668-023-04089-w
Giourgali, A., and Poulaki, I. (2024). “Current crises and sustainable development goals—a regional approach,” in Digital Economy and Green Growth: Opportunities and Challenges for Urban and Regional Ecosystems (Springer Nature Switzerland, Cham), 193–213. doi: 10.1007/978-3-031-66669-8_11
Haseeb, M., Tahir, Z., Mahmood, S. A., and Tariq, A. (2025). Winter wheat yield prediction using linear and nonlinear machine learning algorithms based on climatological and remote sensing data. Inf. Process. Agric. doi: 10.1016/j.inpa.2025.02.004
Hegazy, I. R., and Tohlob, A. A. (2024). Strategic environmental assessment and sdg integration: enhancing sustainable development in Egypt. J. Umm Al-Qura Univ. Eng. Archit. 15, 340–354. doi: 10.1007/s43995-024-00062-4
Husaini, A. M., and Sohail, M. (2024). Agrochemical-free genetically modified and genome-edited crops-towards a ‘greener' green revolution and achieving the united nation's sustainable development goals. J. Biotechnol. doi: 10.1016/j.jbiotec.2024.04.015
Khan, F., Abbass, K., and Qun, W. (2025). Charting the path to sustainable development: insights from a review of land use efficiency research and total factor productivity in achieving SDGs. J. Knowl. Econ. 1–24. doi: 10.1007/s13132-024-02358-1
Khan, M. S., Moallemi, E. A., Thiruvady, D., Nazari, A., and Bryan, B. A. (2024). Machine learning-based surrogate modelling of a robust, sustainable development goal (SDG)-compliant land-use future for Australia at high spatial resolution. J. Environ. Manag. 363:121296. doi: 10.1016/j.jenvman.2024.121296
Krantz, V., and Gustafsson, S. (2023). Regional collaboration for the sustainable development goals: experiences from developing a multi-actor platform in Sweden. Sustain. Dev. 31, 4007–4018. doi: 10.1002/sd.2580
Liu, X., and Yuan, M. (2023). Assessing progress towards achieving the transport dimension of the SDGs in China. Sci. Total Environ. 858:159752. doi: 10.1016/j.scitotenv.2022.159752
Mangukiya, R. D., and Sklarew, D. M. (2023). Analyzing three pillars of sustainable development goals at sub-national scales within the USA. World Dev. Sustain. 2:100058. doi: 10.1016/j.wds.2023.100058
Qwaider, S., Al-Ramadan, B., Shafiullah, M., Islam, A., and Worku, M. Y. (2023). GIS-based progress monitoring of SDGs towards achieving Saudi vision 2030. Remote Sens. 15:5770. doi: 10.3390/rs15245770
Sadeghi, R., Sadeghi, S., Memari, A., Rezaeinejad, S., and Hajian, A. (2024). A peer-to-peer trading model to enhance resilience: a blockchain-based smart grids with machine learning analysis towards sustainable development goals. J. Clean. Prod. 450:141880. doi: 10.1016/j.jclepro.2024.141880
Sazid, A. (2023). Sustainable Development Report. Available online at: https://www.kaggle.com/datasets/sazidthe1/sustainable-development-report
Sharifi, A., Allam, Z., Elias, S., and Khavarian-garmsir, A. R. (2024). Smart cities and sustainable development goals (SDGs): a systematic literature review of co-benefits and trade-offs. Cities 146:104659. doi: 10.1016/j.cities.2023.104659
Shayan, N. F., Mohabbati-Kalejahi, N., Alavi, S., and Zahed, M. A. (2022). Sustainable development goals (SDGs) as a framework for corporate social responsibility (CSR). Sustainability 14:1222. doi: 10.3390/su14031222
Singh, A., Kanaujia, A., Singh, V. K., and Vinuesa, R. (2023). Artificial intelligence for sustainable development goals: bibliometric patterns and concept evolution trajectories. Sustain. Dev. 32, 724–754. doi: 10.1002/sd.2706
Talaat, F. M., Kabeel, A. E., and Shaban, W. M. (2024). The role of utilizing artificial intelligence and renewable energy in reaching sustainable development goals. Renew. Energy 235:121311. doi: 10.1016/j.renene.2024.121311
Taweesan, A., Koottatep, T., Kanabkaew, T., and Polprasert, C. (2024). Application of machine learning in sanitation management prediction: approaches for achieving sustainable development goals. Environ. Sustain. Indic. 22:100374. doi: 10.1016/j.indic.2024.100374
Vos, R., Husain, A., Greb, F., and Läderach, P. Rice, B. (2023). “Food crisis risk monitoring: early warning for early action,” in Global Food Policy Report 2023: Rethinking Food Crisis Responses (International Food Policy Research Institute (IFPRI)), 20–35.
Wang, H., and Yang, Y. (2025). Measuring and monitoring provincial sustainable development goals in China. Soc. Indic. Res. 176, 415–472. doi: 10.1007/s11205-024-03457-x
Wolniak, R., and Stecuła, K. (2024). Artificial intelligence in smart cities—applications, barriers, and future directions: a review. Smart Cities 7, 1346–1389. doi: 10.3390/smartcities7030057
Yumnam, G., Gyanendra, Y., and Singh, C. I. (2024). A systematic bibliometric review of the global research dynamics of united nations sustainable development goals 2030. Sustain. Futures. 7:100192. doi: 10.1016/j.sftr.2024.100192
Keywords: Sustainable Development Goals (SDGs), one-dimensional convolutional neural network, SDGs index score, deep learning, SDG2 (Zero Hunger)
Citation: Alturif G, El-Bary AA and Osman RA (2025) Applying 1D convolutional neural networks to advance food security in support of SDG 2. Front. Sustain. Food Syst. 9:1615998. doi: 10.3389/fsufs.2025.1615998
Received: 22 April 2025; Accepted: 17 June 2025;
Published: 16 July 2025.
Edited by:
Nicolás Oscar Soto-Cruz, TecNM-Instituto Tecnológico de Durango, MexicoReviewed by:
Poonam Singh, LaserLeap Technologies, PortugalSandeep Gawdiya, Indian Agricultural Research Institute (ICAR), India
Zainab Tahir, University of the Punjab, Lahore, Pakistan
Copyright © 2025 Alturif, El-Bary and Osman. This is an open-access article distributed under the terms of the Creative Commons Attribution License (CC BY). The use, distribution or reproduction in other forums is permitted, provided the original author(s) and the copyright owner(s) are credited and that the original publication in this journal is cited, in accordance with accepted academic practice. No use, distribution or reproduction is permitted which does not comply with these terms.
*Correspondence: Radwa Ahmed Osman, cmFkd2EuYWhtZWRAYWFzdC5lZHU=