 Yanwei Li1†
 Wenjie Ma
 Liang Luo
- 1Human Resources and Social Security Bureau of Gangcheng District, Shandong, Jinan, China
- 2College of Agriculture, Guangxi University, Nanning, China
- 3Fruit Production Technical Guidance Station, Guangxi, Baise, China
- 4College of Smart Human Settlements Industry, Guangxi Arts University, Nanning, China
The coupled and coordinated interaction between digital economy and cultivated land use efficiency (CLUE) is of great practical significance for guaranteeing national food security. Therefore, this study constructed the evaluation index system from two aspects of digital economy and CLUE, and used the coupling coordination degree (CCD) model to measure the level of their coordination and interaction, and then analyzed the spatial and temporal evolution of the CCD. At the same time, the Tobit model is introduced to explore the driving factors and make recommendations accordingly. The study shows that: (1) Both the CLUE and the digital economy show an upward trend during the study period, but there are obvious spatial differences, and the development level of CLUE is better than that of the digital economy. (2) The CCD has steadily risen, regional differences have been narrowing, and the overall level has risen from mild disorder to benign coordination over the study period. Spatially, high value areas are mainly clustered in the eastern region and part of the central region. (3) The CCD has the stability of maintaining the original level state, and the dynamic evolution is a gradual process. There is a positive synergy effect when the level of neighboring regions is the same as its own level. (4) The Tobit model shows that economic, technical innovation and urbanization promote the CCD, while the urban–rural development gap and industrial structure inhibit the CCD.
1 Introduction
According to the Global Report on Food Crises, over 280 million people worldwide experienced severe food insecurity in 2023 (World Food Programme, 2024), influenced by factors such as international political instability and public health crises. The urgency of addressing food security has intensified, given its direct association with national stability and socioeconomic development. Cultivated land represents the essential natural basis for ensuring a nation’s food security. Although China supports approximately 22% of the world’s population, its cultivated land accounts for only 7.8% of the global total. The contradiction of “more people, less land” is becoming increasingly prominent. Traditional production models that depend heavily on excessive agricultural inputs and inefficient labor practices have contributed to environmental degradation, including soil pollution (Yang et al., 2024). These challenges present significant barriers to the sustainable use of cultivated land, thereby jeopardizing national food security and impeding high-quality economic and social development. In this context, a significant issue today is how to enhance agricultural productivity with scarce land resources, decrease the escalation of conflict among people and land, and promote environmental monitoring while improving cultivated land use efficiency (CLUE).
Since the Chinese government first proposed the goal of “strengthening and expanding the digital economy” in 2016, efforts have been made to integrate digital technologies into agricultural land management through a range of policy initiatives and infrastructure investments. These initiatives have created opportunities to enhance the efficiency of cultivated land use. By optimizing land resource allocation, supported by precise surveying and real-time monitoring technologies, intensive land use can be promoted while reducing resource waste and environmental degradation. However, the process of digital transformation still faces challenges, including regional disparities in development and inadequate infrastructure (Xu et al., 2023). Therefore, establishing a framework for the coordinated development of the digital economy and CLUE is essential to ensuring food security, optimizing regional land resources, and achieving both ecological sustainability and agricultural modernization.
The remainder of this paper is structured as follows: Sections 2 and 3 review the existing literature and explain the theoretical mechanism underlying the coupling coordination between the digital economy and CLUE. Section 4 presents the data sources and research methodology. Section 5 analyzes the spatiotemporal evolution of the coupling coordination degree (CCD) and identifies its driving factors. Section 6 summarizes the main findings, offers policy recommendations, discusses research limitations, and outlines directions for future research.
2 Literature review
2.1 Digital economy
The term “digital economy” refers to economic activities that generate communication and create value through digital technologies such as the Internet, cloud computing, and big data (Miao, 2021). With the rapid advancement of digital technologies, the digital economy has gradually become a key driver of global economic growth. Current research primarily focuses on measuring the digital economy and examining its economic and societal impacts (Subkhan et al., 2025; Zhang et al., 2024; Jiang and Sun, 2020). More recently, research has extended into the agricultural sector, seeking to uncover the underlying mechanisms through which the digital economy promotes agricultural development.
First, the digital economy utilizes technologies such as the Internet of Things (IoT) to convert relevant agricultural information into data, which is then integrated as a key production factor within agricultural systems (Hua et al., 2024). This process strengthens traditional production factors and improves the efficiency of resource allocation, including labor, capital, land, and information. As a result, total factor productivity is enhanced, accelerating the digital transformation of agriculture (Jia et al., 2025). Second, the digital economy has fostered innovations in industrial efficiency, introduced new business models, and optimized development pathways (Wang et al., 2024). These advancements have transformed agricultural production and rural livelihoods, continuously promoting the shift from extensive to high-quality agricultural development.
2.2 Cultivated land use efficiency
Cultivated land use has long been a topic of significant academic interest, resulting in a substantial body of research. Common methods for calculating CLUE include Principal Component Analysis (PCA) (Wu et al., 2024), Data Envelopment Analysis (DEA) (Xiang et al., 2023), Stochastic Frontier Analysis (SFA) (Chen et al., 2025), and Directional Distance Function (DDF) (Khataza et al., 2019) models. More recently, researchers have begun to examine the negative impacts of diesel, herbicides, and fertilizers on cultivated land yields (Chen et al., 2020; Zhu et al., 2022). Consequently, some scholars have developed the Super-SBM model to incorporate these unexpected outputs, such as fertilizer non-point source pollution and carbon dioxide emissions (Zhang et al., 2024; Pei and Chen, 2024; Huang et al., 2024). In analyzing the factors influencing CLUE, commonly used analytical methods include the Tobit model (Tian et al., 2023), Spatial Durbin model (Luo et al., 2024), and multiple linear regression model (Kaiyong and Pengyan, 2013). The factors influencing CLUE can generally be classified into two levels: macro-level factors and micro-level factors. Micro-level factors include household income characteristics (Yu et al., 2022), average years of education (Zhang et al., 2025), and farmers land value (Zhang et al., 2017). Macro-level factors include the level of economic development (Gui et al., 2021), urbanization (Fu and Xue, 2025), and the natural ecosystem (Lyu et al., 2024). In addition, growing scholarly attention has been paid to the coupling relationship between cultivated land use intensity and economic development, as well as the correlation between cultivated land area and regional economic growth (Xiang et al., 2023; Han and Zhang, 2020).
2.3 Research on the digital economy and cultivated land use efficiency
The impact of the digital economy on the allocation of land, capital, and labor resources has been widely studied. Existing research on its relationship with land use indicates that the digital economy, characterized by low cost and high penetration, can be integrated with traditional production factors such as land (Huang and Huang, 2024). This integration helps mitigate land scarcity constraints and promotes the digital transformation of land use. Moreover, the rapid growth of the digital economy has influenced the scale, structure, and spatial patterns of land resources, thereby improving the efficiency of land resource allocation (Wu et al., 2024).
Currently, scholars have conducted extensive research on the relationship between the digital economy and cultivated land use systems. By applying the Super-SBM model and entropy method to measure agricultural land use efficiency and digital economic development, respectively, and using the Tobit model to assess the impact of the digital economy, studies have found that digital development significantly enhances agricultural land utilization efficiency. Improvements in economic development, reductions in the urban–rural income gap, and strengthened irrigation capacity have also been shown to promote land use efficiency (Li et al., 2025). Additionally, methods such as multi-period difference-in-differences, triple difference models, and threshold models have been used to evaluate the effect of digital economy development on urban land green use efficiency. These studies confirm that the digital economy positively influences urban land use, mainly through technological integration and environmental innovation (Fan et al., 2023). Despite this progress, existing literature still has limitations. While prior studies have discussed the impact of the digital economy on cultivated land use systems, relatively little attention has been given to the underlying impact mechanisms within cultivated land use ecosystems. Further exploration of these mechanisms would provide valuable scientific insights for promoting the effective integration of the digital economy and CLUE.
Therefore, drawing on panel data from 30 provinces in China spanning the period from 2014 to 2022, this study employs multiple analytical methods to examine the relationship between the digital economy and CLUE. Compared with the existing literature, the marginal contributions of this paper are threefold. First, it systematically clarifies the internal mechanisms underlying the coupling and coordination between China’s digital economy and CLUE. Second, it applies coupling coordination models, Gini coefficients, Moran indices, and Markov chain analysis to quantitatively characterize the geospatial correlation and coupling relationship across regions. Third, it further investigates the driving factors that influence the interaction between the digital economy and CLUE.
3 Theoretical framework
The digital economy and CLUE function as independent systems while achieving synergistic evolution through circular interaction. As shown in Figure 1, the digital economy comprises three key components: digital infrastructure, digital industries, and digital innovation. It relies on advanced technologies such as cloud computing, artificial intelligence, and big data to transcend traditional industrial boundaries, deeply integrate the manufacturing, service, and information sectors, promote the development of the tertiary industry, accelerate the upgrading of traditionally extensive industries, reduce undesirable outputs, and improve ecological outcomes.
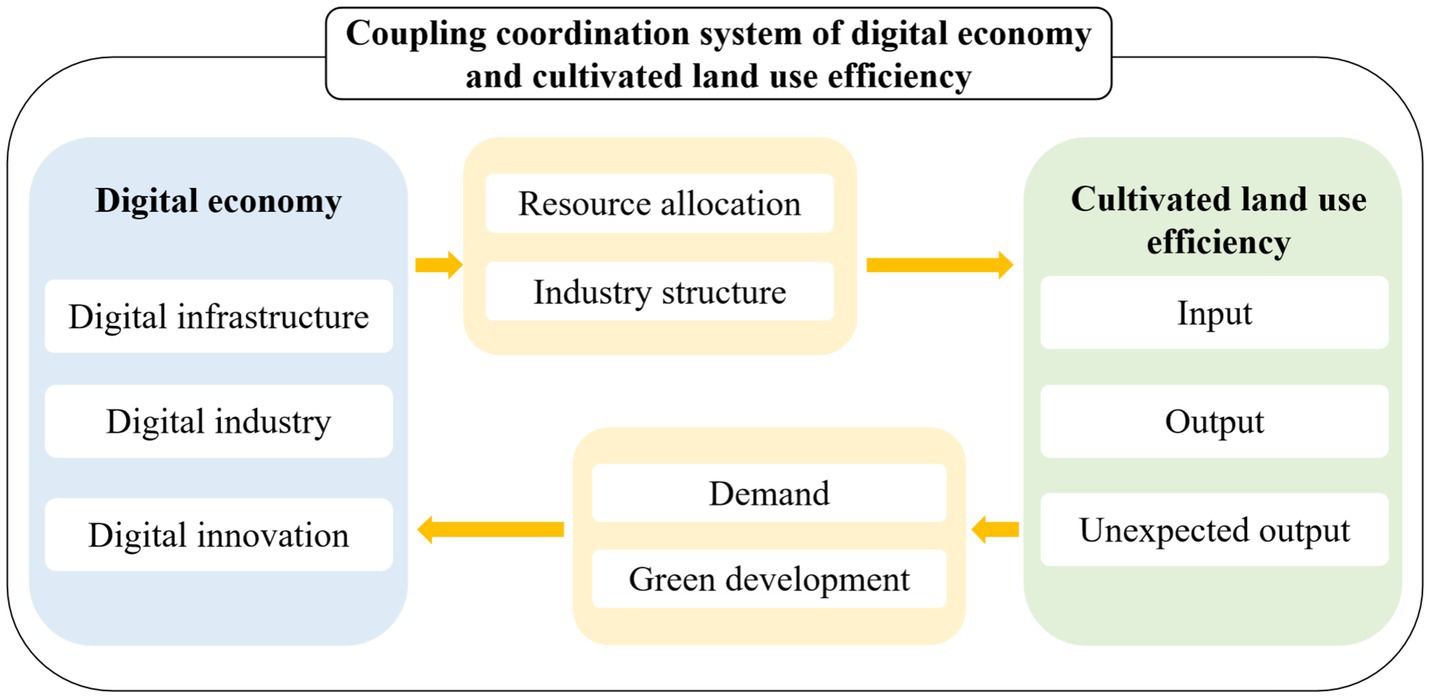
Figure 1. Coordination mechanism framework between the digital economy and cultivated land use efficiency.
In addition, the digital economy improves resource allocation efficiency, reduces land resource waste, and facilitates the integration of fragmented cultivated land into virtually contiguous digital farms. This process enables both economies of scale and precision management. In turn, improvements in CLUE contribute to the development of the digital economy. On one hand, enhanced land use efficiency creates new market demand, encouraging the digital industry to expand its service scope and fostering deeper segmentation within the agricultural digital service sector. On the other hand, more efficient farmland use promotes green development, supports the digital transformation of energy-intensive and polluting industries, improves resource utilization, accelerates technological innovation and factor upgrading, and advances sustainable development. These outcomes further stimulate digital economic growth and enhance its overall development level. The two systems will form a virtuous cycle of mutual promotion and development.
4 Data sources and research methods
4.1 Data sources
The research sample for this study is data from 30 provinces (municipalities and autonomous areas) in mainland China between 2014 and 2022 (Taiwan, Hong Kong, Macau, and Tibet are not included in the study owing to data restrictions). The 30 provinces are categorized into three research regions: Eastern,1 Central,2 and Western3 China. The sample data is derived mostly from the China Statistical Yearbook, China Environmental Yearbook, China Science and Technology Statistical Yearbook, and the National Economic and Social Development Statistical Yearbook (2015–2023).
4.2 Indicator system construction
4.2.1 Digital economy
An assessment system for the digital economy was created by following data availability and scientific rigor guidelines, using the earlier research framework and previous studies as references (Wang et al., 2025; Li et al., 2024). A total of 11 indicators were selected, which primarily reflect the overall level of digital development across regions and indirectly influence agricultural digitalization. The weights of each indicator were calculated using the entropy method, with details provided in Table 1.
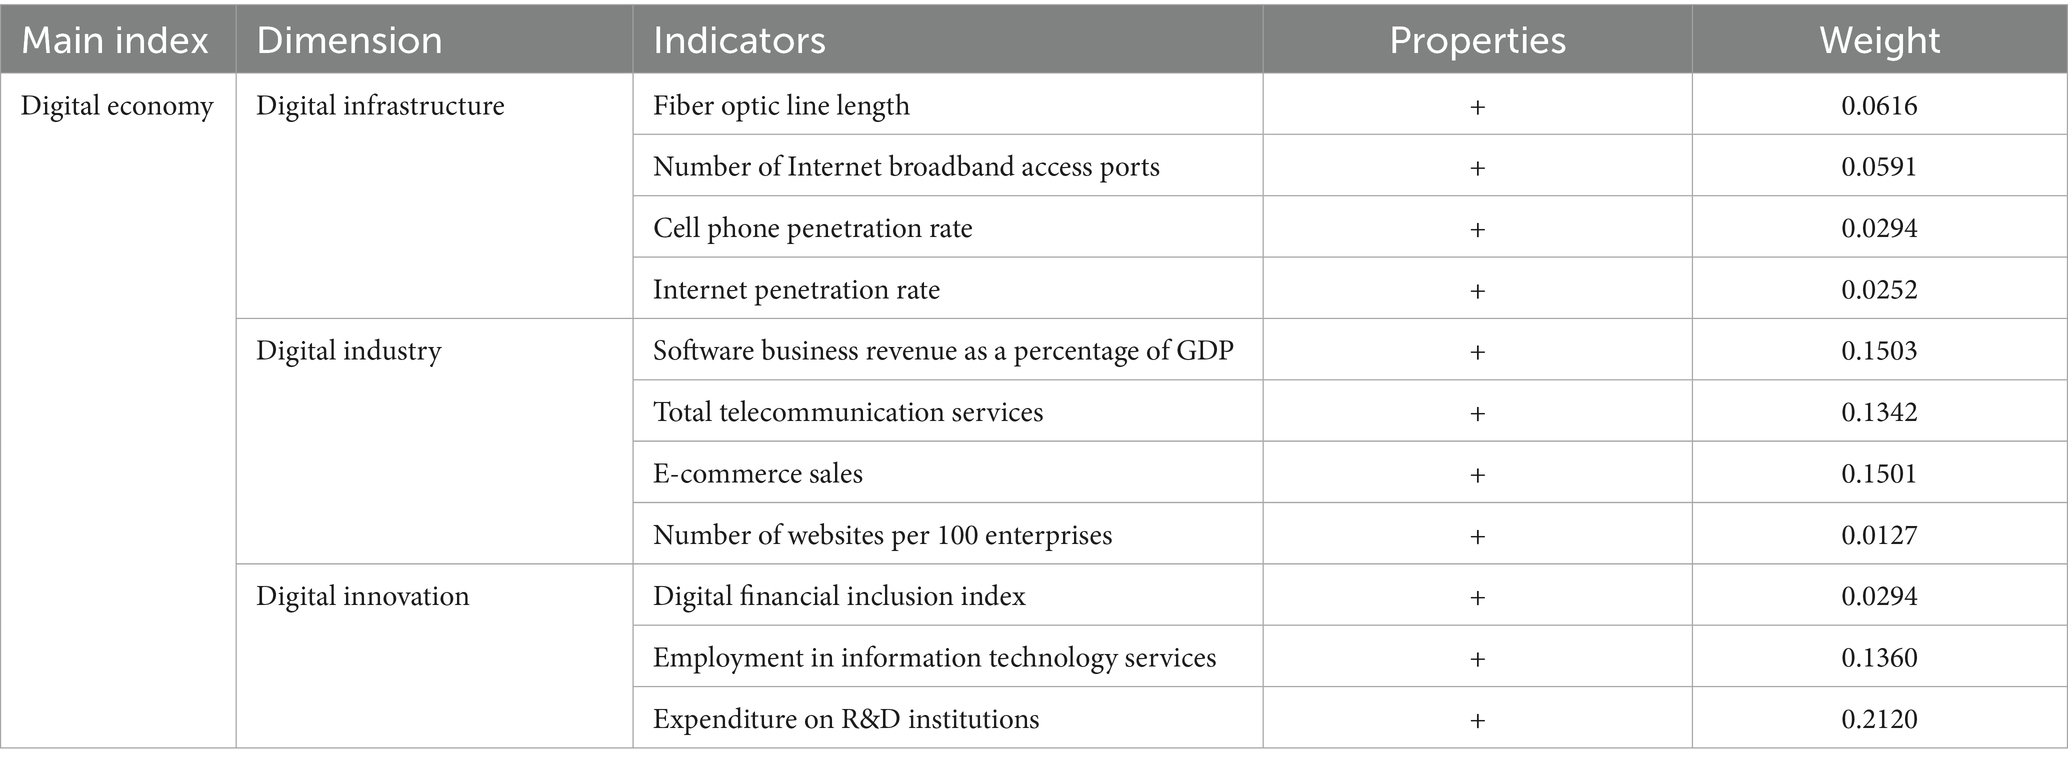
Table 1. Digital economy evaluation indicator system.
4.2.2 Cultivated land use efficiency
Drawing on existing research (Zou et al., 2024; Ma et al., 2024; Tan et al., 2024), this study constructs an evaluation indicator system for CLUE, focusing on input, expected output, and unexpected output. Table 2 lists the 11 indicators that were chosen in total.
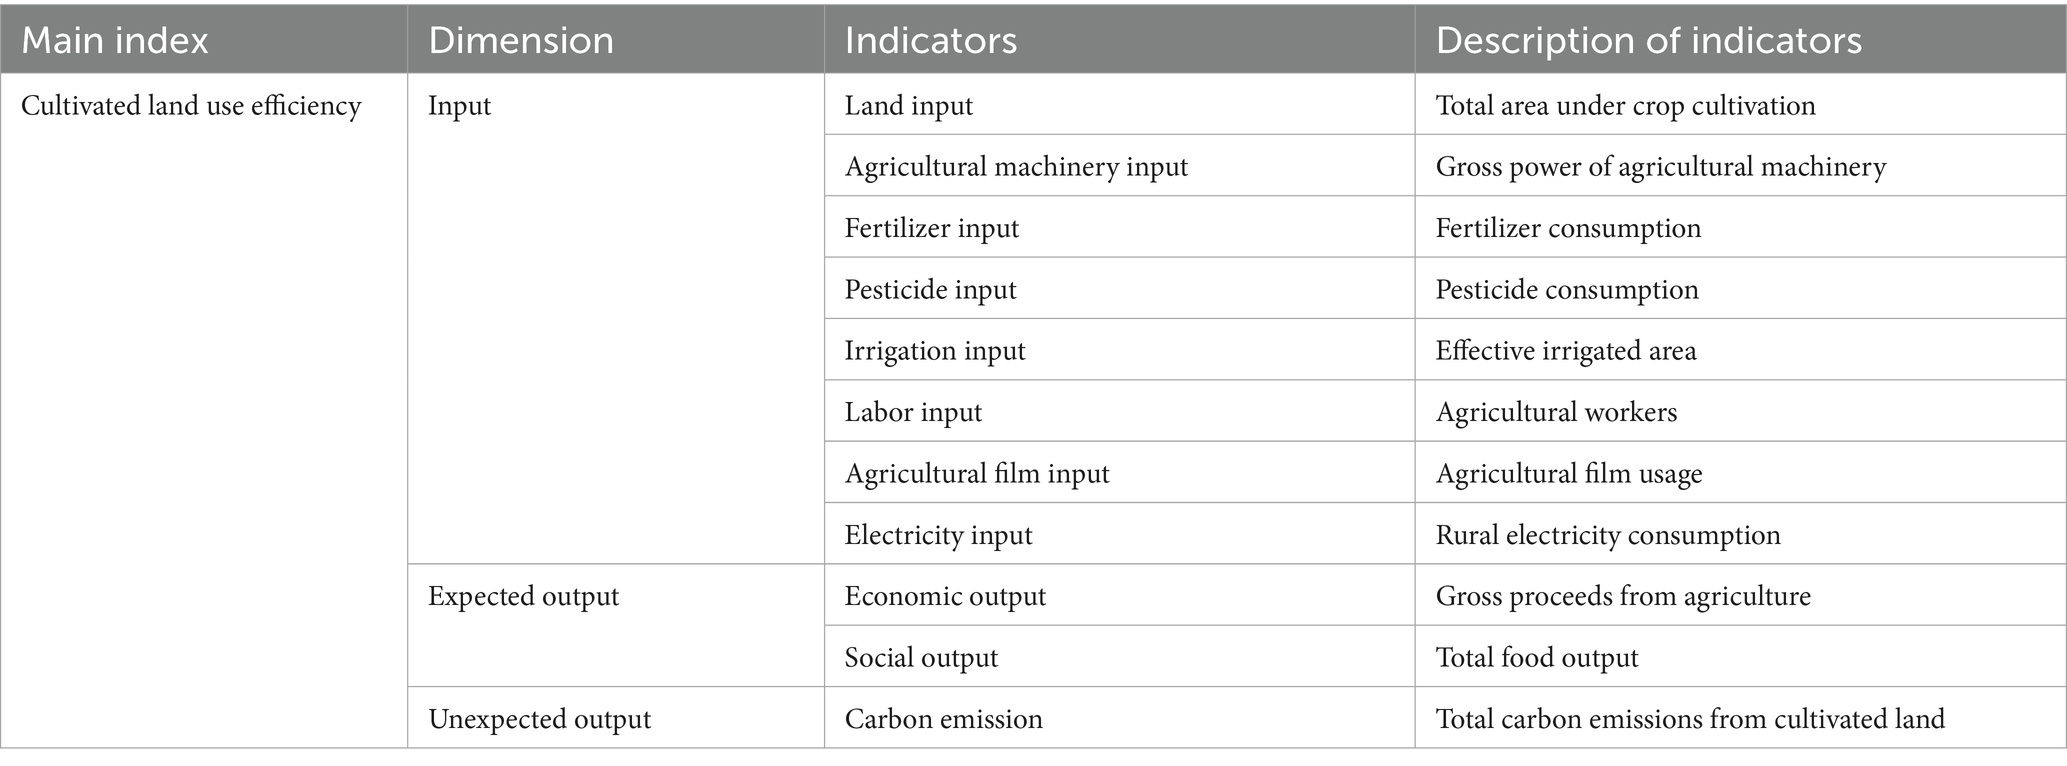
Table 2. Cultivated land use efficiency evaluation indicator system.
4.3 Research methods
The relationship among the methods and models employed in this study is illustrated in Figure 2. First, the development levels of China’s digital economy and CLUE were measured using the entropy method and the super-efficiency SBM model of unexpected output, respectively. Second, the CCD was calculated using the coupling coordination model based on the measured development levels. Third, Third, the Dagum Gini coefficient, spatial correlation test (Moran index), and Markov chain were applied to analyze regional disparities, assess spatial dependence, and predict transitions in coordination states. Finally, the Tobit model was used to examine the driving factors influencing the CCD.
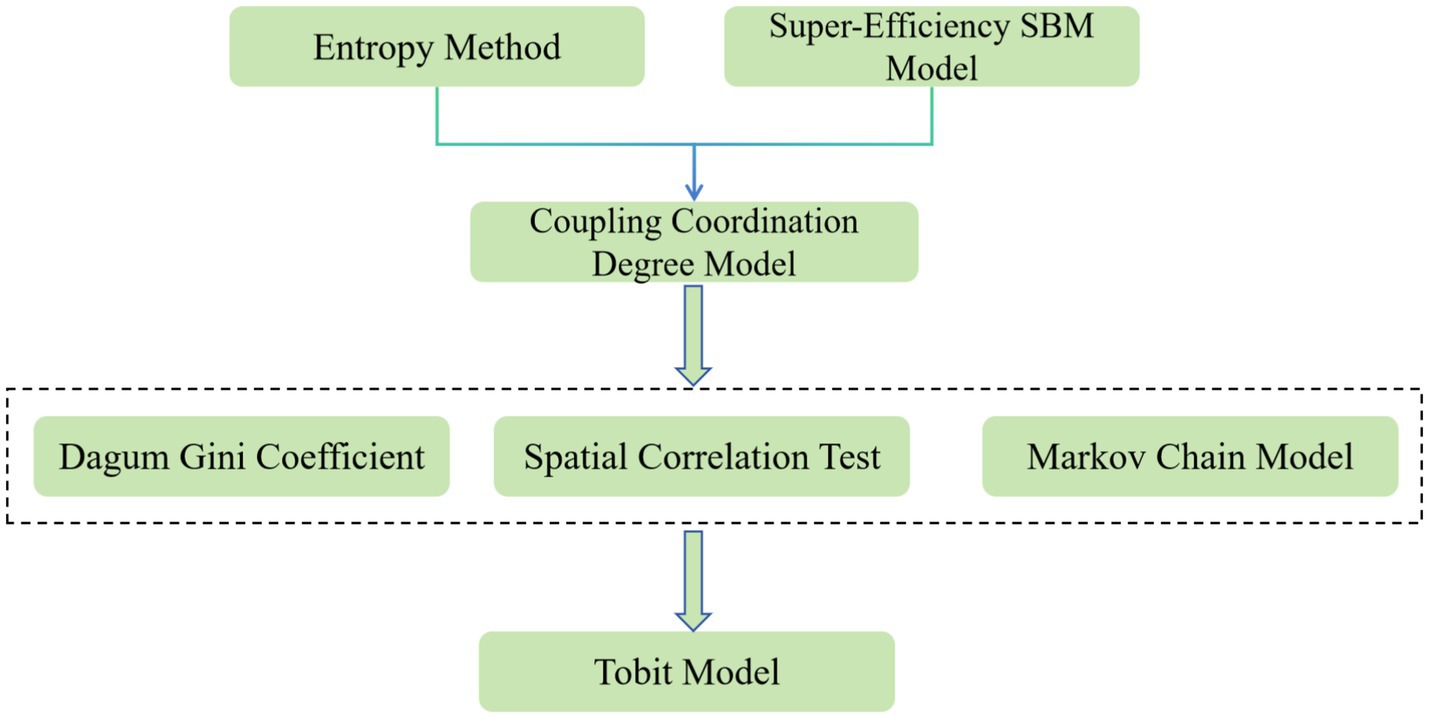
Figure 2. Research framework diagram.
4.3.1 Entropy method
The entropy technique circumvents the drawbacks of subjective weighing by using an objective methodology that determines weights based on the fluctuation in indicator data (Chen, 2019). Entropy is the method tested in this work to provide weights to the digital economy’s indicators and conduct a thorough evaluation of China’s level of growth in this area. Main calculation stages as in Equations 1–6:
The first step, the standardization of the raw data, the standardized data values for the positive indicators and negative indicators are as follows:
The second step, calculate the information entropy:
The third step, calculate the weight of each indicator:
The fourth step, calculate the Digital Economy Development Index:
4.3.2 Super-efficiency SBM model
This investigation used the super-efficiency SBM model. The efficient decision-making units are further broken down and ranked, and unexpected outcomes are included in the efficiency level assessment, improving the precision and applicability of efficiency assessments (Wu and Wen, 2025). The expression is as follows:
In Equation 7, each province represents a decision-making unit. denotes the input for each decision-making unit, represents the expected output, represents the unexpected output, and , , represent the slack variables for input, expected output, and unexpected output, respectively. , , represent the input, expected output, and unexpected output vectors of the decision-making unit, respectively. X, Y, B represent the input, expected output, and unexpected output matrices, respectively, and denotes the weight vector.
4.3.3 Coupling coordination degree model
The two parts of the Coupling Coordination Degree Model are the coupling and coordination degrees. The coupling degree denotes the level of interaction among various systems, whereas the coordination degree indicates the developmental status of diverse systems according to a uniform measuring standard (Qindong et al., 2025). The CCD between the digital economy and CLUE is calculated in this study using the coupling coordination degree model. The following is the calculating formula:
In Equations 8–10: represents the coupling degree, represents the coordination degree, and represents the CCD, with a value range of [0, 1]. The closer is to 1, the greater the coordination between the two systems. and are the system weights, with their sum equal to 1. Based on existing research, the CCD is divided into five levels, as shown in Table 3.

Table 3. Coupling coordination degree level classification.
4.3.4 Dagum Gini coefficient
Dagum (1997) suggested a decomposition method for the Gini coefficient that overcomes the drawbacks of current approaches to measuring regional differences. This approach makes finding the causes of regional discrepancies easier (Liu et al., 2025). This approach makes finding the causes of regional discrepancies easier. This study uses the Dagum Gini coefficient and its decomposition approach to thoroughly examine the general variations and causes of variations in the degree of coupling coordination regarding China’s digital economy and CLUE. The calculation formulas for the overall Gini coefficient , intra-regional Gini coefficient , and inter-regional Gini coefficient are detailed in Equations 11–13:
Further, in Equations 14–16, the Gini coefficient is decomposed into the contributions of regional differences , inter-regional differences , and super-density contributions :
4.3.5 Spatial correlation test
Adjacent regions exhibit some form of spatial interaction and dependence. This work uses Moran’s I index for spatial autocorrelation analysis to make measuring their correlation easier. While the local Moran’s I index is used to examine the precise locations and extent of the aggregation, the global Moran’s I index is used to determine if spatial aggregation occurs within the region (Zhang et al., 2025). Equations 17,18 are used to calculate the global and local Moran’s I indices:
is the global Moran’s I index. When > 0, it indicates a positive spatial correlation in the distribution of the variable, the larger the value, the stronger the spatial correlation. When < 0, it indicates a negative spatial correlation, and the smaller the value, the greater the spatial disparity. When = 0, it indicates no spatial correlation of the variable. represents the local Moran’s I index.
4.3.6 Markov chain model
This research uses the classic Markov chain and spatial Markov chain analysis methods to determine the transition probability matrix under various scenarios (Abhinav and Rajesh, 2025). The calculation formulas are as follows:
In Equations 19,20, represents the transition probability, denotes the spatial lag value, represents the observed value, and denotes the spatial weight matrix.
4.3.7 Tobit model
This model selects the CCD as the dependent variable, which has a range of values between 0 and 1, making it a limited dependent variable (Zhu et al., 2025). The influence of driving factors on the CCD may not be well reflected in the skewed regression findings that arise from using OLS to estimate a constrained dependent variable. To do regression on the driving factors, this study uses the Tobit model, which has the following formula:
In Equation 21: is the dependent variable, represents the driving factors, is the constant term, is the regression coefficient, and is the random error term.
5 Empirical results and analysis
5.1 Measurement of digital economy and cultivated land utilization efficiency
5.1.1 Digital economy
This study applies the entropy method to construct China’s digital economy development index from 2014 to 2022. As shown in Figure 3, the national index exhibited a fluctuating upward trend, rising from 0.0859 to 0.1998 over the study period. Regionally, the eastern area experienced rapid growth, with its index increasing from 0.1459 to 0.3156, significantly outpacing other regions. The central region’s index rose from 0.0573 to 0.1476, while the western region, starting from a lower base, increased steadily from 0.0467 to 0.1219. In 2014, most provinces had a digital economy development index between 0.05 and 0.10. By 2022, the index had grown substantially, particularly in the eastern region, where most provinces recorded values between 0.20 and 0.40. Notably, Beijing and Guangdong exceeded 0.50, indicating leading positions in digital economic development.
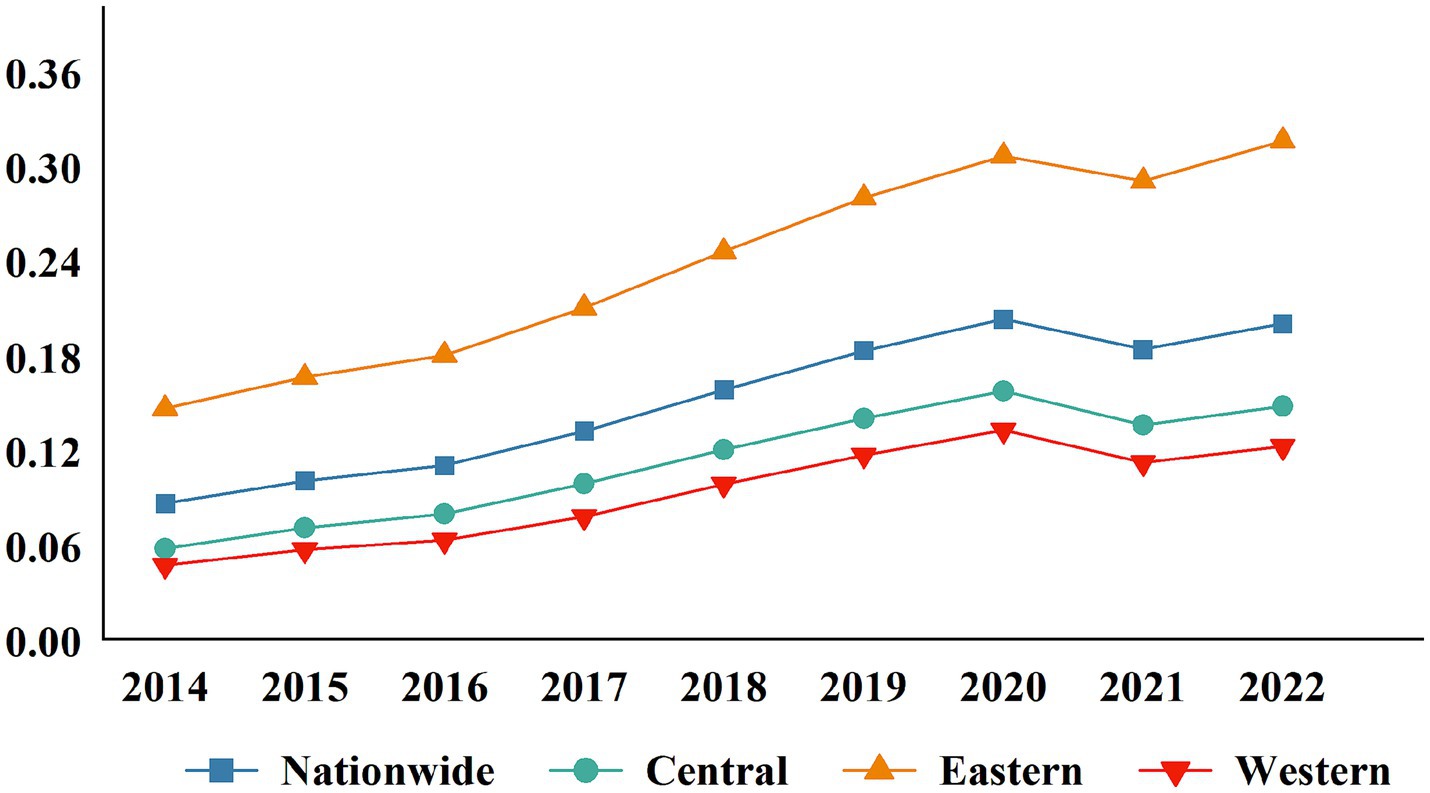
Figure 3. Digital economy development levels in China and three major regions from 2014 to 2022.
In summary, the growth of China’s digital economy exhibits significant regional variation. The eastern region consistently leads due to its strong technological innovation capacity and robust economic foundation. Although the central and western regions have shown positive momentum and some advantages as late developers, they continue to face challenges related to uneven development and structural constraints.
5.1.2 Cultivated land use efficiency
To assess CLUE in China from 2014 to 2022, the study employed the super-efficient SBM model based on unexpected output. As shown in Table 4, both national and regional CLUE demonstrated a consistent upward trend during the study period. At the national level, efficiency increased from 0.4881 to 0.8736. The central region began with a relatively high efficiency score of 0.5377 but exhibited slower growth, reaching 0.7534 by 2022. In contrast, the western region experienced the most rapid improvement, with efficiency rising from 0.4599 to 0.9214. Notably, most provinces in the western region recorded efficiency values exceeding 1.0. Although the overall efficiency in the central region remains lower than in the west, provinces such as Jilin, Hubei, and Heilongjiang surpassed the 1.0 threshold.
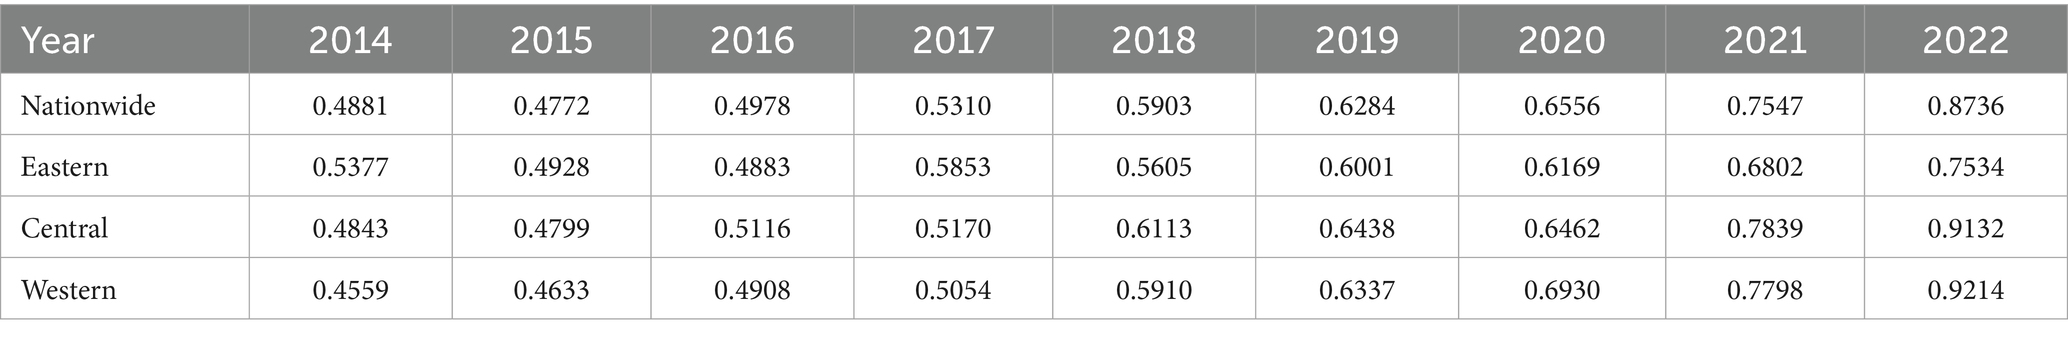
Table 4. Cultivated land use efficiency in China and three major regions from 2014 to 2022.
The steady increase in CLUE across the country and within regions can be attributed to the implementation of China’s cultivated land conservation system, strict controls on converting cultivated land to construction land, and reinforcement of the balance between cultivated land occupation and compensation. However, substantial regional disparities persist. The eastern and western regions have outperformed the central region, primarily due to advances in agricultural technology, improvements in farm management practices, and stronger policy support.
5.2 Temporal evolution law of coupling coordination degree
5.2.1 Trends in the change of coupling coordination degree
Table 5 presents a shift from mild disorder to benign coordination in the national CCD between the digital economy and CLUE, rising from 0.341 in 2014 to 0.621 in 2022. The eastern region has always been at the forefront, with the CCD increasing from 0.404 to 0.723, indicating a transition from imminent disorder to benign coordination. This sustained advantage suggests that the eastern region is better positioned to integrate and coordinate the development of the digital economy and CLUE due to its strong infrastructure and technological foundation.
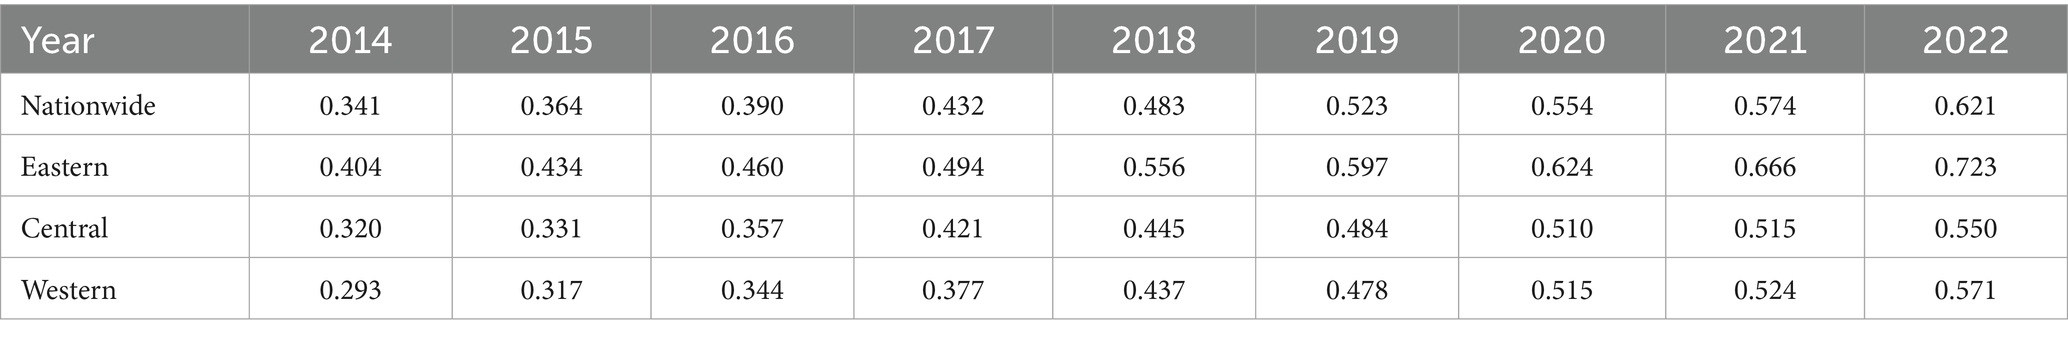
Table 5. Coupling coordination degree of China and three major regions from 2014 to 2022.
In 2014, most provinces in China had relatively low CCD, primarily between 0.3 and 0.4, corresponding to the mild disorder category. By 2018, the eastern region’s coordination levels had improved further, with all provinces exceeding 0.4. Notably, coordination degrees in Shanghai, Guangdong, and Jiangsu surpassed 0.6. During the same period, the central and western regions also showed improvement, with values increasing from 0.35 to 0.50. By 2022, the CCD had significantly increased across all regions, although notable regional differences remained. In the central region, most provinces had coordination values between 0.4 and 0.6. In the western region, values ranged from 0.5 to 0.7. In the eastern region, most provinces recorded values between 0.6 and 0.9.
5.2.2 Characteristics of coupling coordination degree type changes
As shown in Figure 4, the relationship between the digital economy and CLUE in China exhibited a steady and positive growth trend from 2014 to 2022. Based on CCD levels, the study period can be divided into two distinct stages. In the first stage, from 2014 to 2018, the CCD rose from 0.341 to 0.483, progressing from the mild disorder stage to the imminent disorder stage. A key characteristic of this phase was a marked decline in the proportion of serious disorder, the initial emergence of benign coordination, and a gradual increase in the share of basic coordination. However, overall coordination remained limited, largely due to underdeveloped digital infrastructure and a shortage of skilled digital technology professionals during the early development phase. In the second stage, from 2019 to 2022, the CCD increased significantly from 0.523 to 0.621, reaching the benign coordination stage. During this period, serious disorder was eliminated, mild disorder declined sharply, and benign coordination became the dominant state. This transformation can be attributed to the Chinese government’s 2020 policy to accelerate digital development, promote the construction of a digital China, and advance smart agriculture and digital rural development. In this context, the digital transformation and upgrading of traditional agricultural sectors, along with the widespread adoption of agricultural machinery, significantly enhanced productivity and further improved the coupling coordination between the digital economy and CLUE.
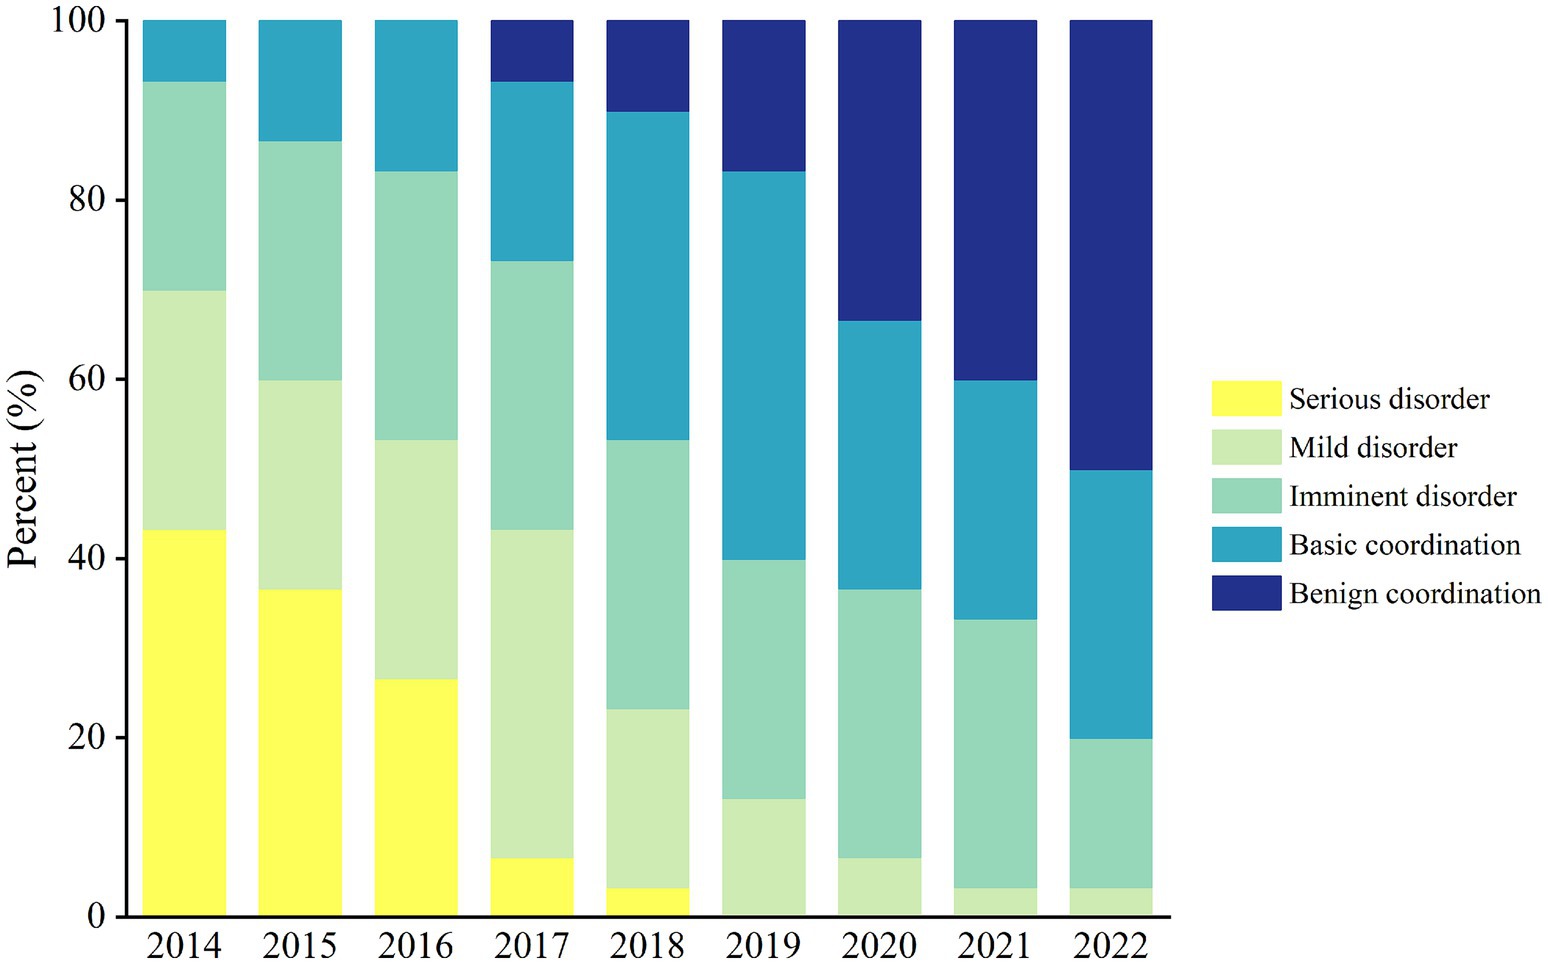
Figure 4. The coupling coordination degree type proportion relationship of China from 2014 to 2022.
5.3 Spatial distribution pattern of coupling coordination degree
5.3.1 Spatial distribution characteristics
From the temporal variation of the CCD, it is evident that in 2014, 2018, and 2022, China as a whole was in different stages of coordinated development. These years were selected as characteristic points for visualization analysis using ArcGIS 10.8.1, as shown in Figure 5. Throughout the study period, a distinct spatial differentiation pattern was visible in the CCD between China’s digital economy and CLUE. In 2018, a “multi-core” growth pole, centered around Guangdong, Shanghai, and Jiangsu—three provinces with benign coordination—radiated outward, driving the expansion of the coastal eastern region toward the inland central region. This ultimately formed a development pattern of “eastern lead, central moderate, and western rise.” Even though the coordination in the west and center of the country got better across the research, these areas still faced problems like uneven policy support, limited benefits from technological advancements, and basic industrial setups. As a result, the digital economy and CLUE failed to interact benignly, and a gap remained compared to the eastern region. Although regional disparities remained, the nation’s overall CCD had significantly improved by 2022. The eastern and some central areas were home to the majority of the high-coordination provinces. In 2014, 57.8% of provinces in the central and western regions were in a state of serious disorder. By 2022, the coordination types in these areas gradually shifted to basic coordination, with provinces such as Sichuan, Henan, Hubei, Guizhou, Chongqing, and Shaanxi improving to a benign coordination state.
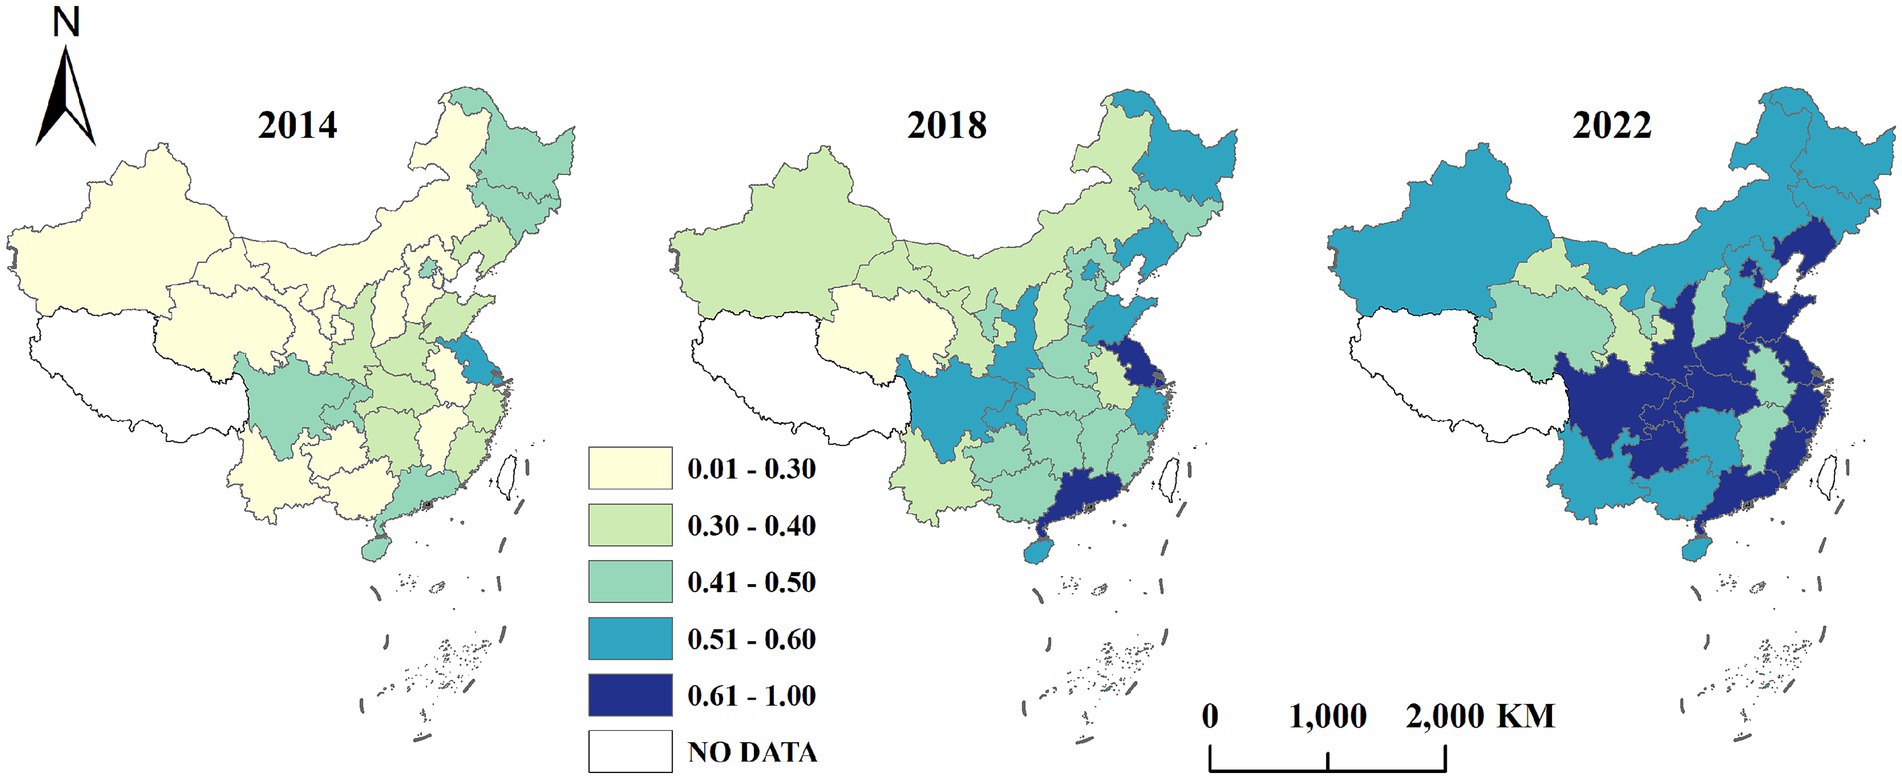
Figure 5. Spatial distribution characteristics of coupling coordination degree in 2014, 2018, and 2022.
5.3.2 Spatial agglomeration characteristics
This study uses Stata 17.0 to calculate the global Moran’s index of the CCD for the period from 2014 to 2022. As shown in Table 6, all estimated values of the Moran’s index are positive. In 2018, the p-value is greater than 0.05, indicating that the result is not statistically significant. In contrast, the p-values for the other years are all less than 0.05, suggesting statistically significant spatial autocorrelation. These results indicate that provinces with similar levels of coupling coordination, whether high or low, tend to cluster spatially. Moreover, the global Moran’s index follows a generally upward trend, rising from 0.0960 in 2014 to 0.1418 in 2022. This pattern shows that the spatial agglomeration of the CCD has gradually intensified over time.
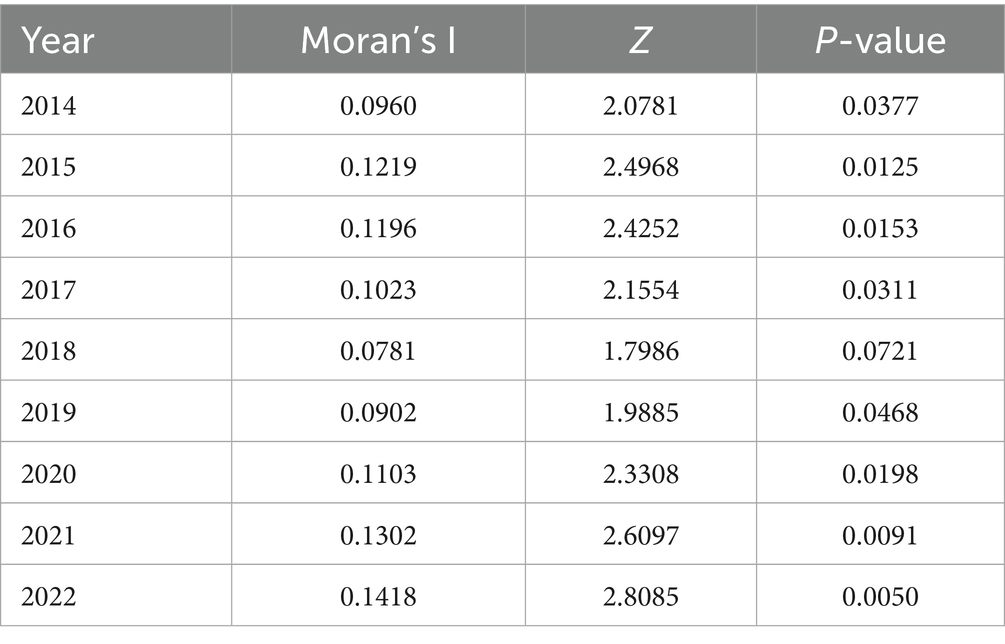
Table 6. Moran’s index from 2014 to 2022.
Using the economic geographic distance matrix, the local Moran index for 2014 and 2022 was calculated, and the local Moran scatter plots for these key years were generated. As illustrated in Figure 6, the “high-high” (HH) areas in the first quadrant and the “low-low” (LL) areas in the third quadrant are the main patterns of how the digital economy and CLUE are connected, and this connection remains fairly stable over time. The “High-High” (HH) type agglomeration areas in the first quadrant are mainly concentrated in the central and eastern regions, indicating that the provinces in these areas have strong spillover effects and act as important growth poles driving coordinated development in other regions. On the other hand, provinces in the western regions mostly appear in the “Low-Low” (LL) type agglomeration areas in the third quadrant. The number of provinces exhibiting the “Low-High” (LH) and “High-Low” (HL) clustering patterns is small and dispersed across different regions, suggesting weaker spatial heterogeneity in these areas. Ultimately, a spatial association pattern with “homogeneous features as the main characteristic and heterogeneous features as the supplementary” is formed. However, among the four spatial correlation patterns, the majority of provinces fall under the “Low-Low” (LL) type homogeneous agglomeration pattern in the third quadrant.
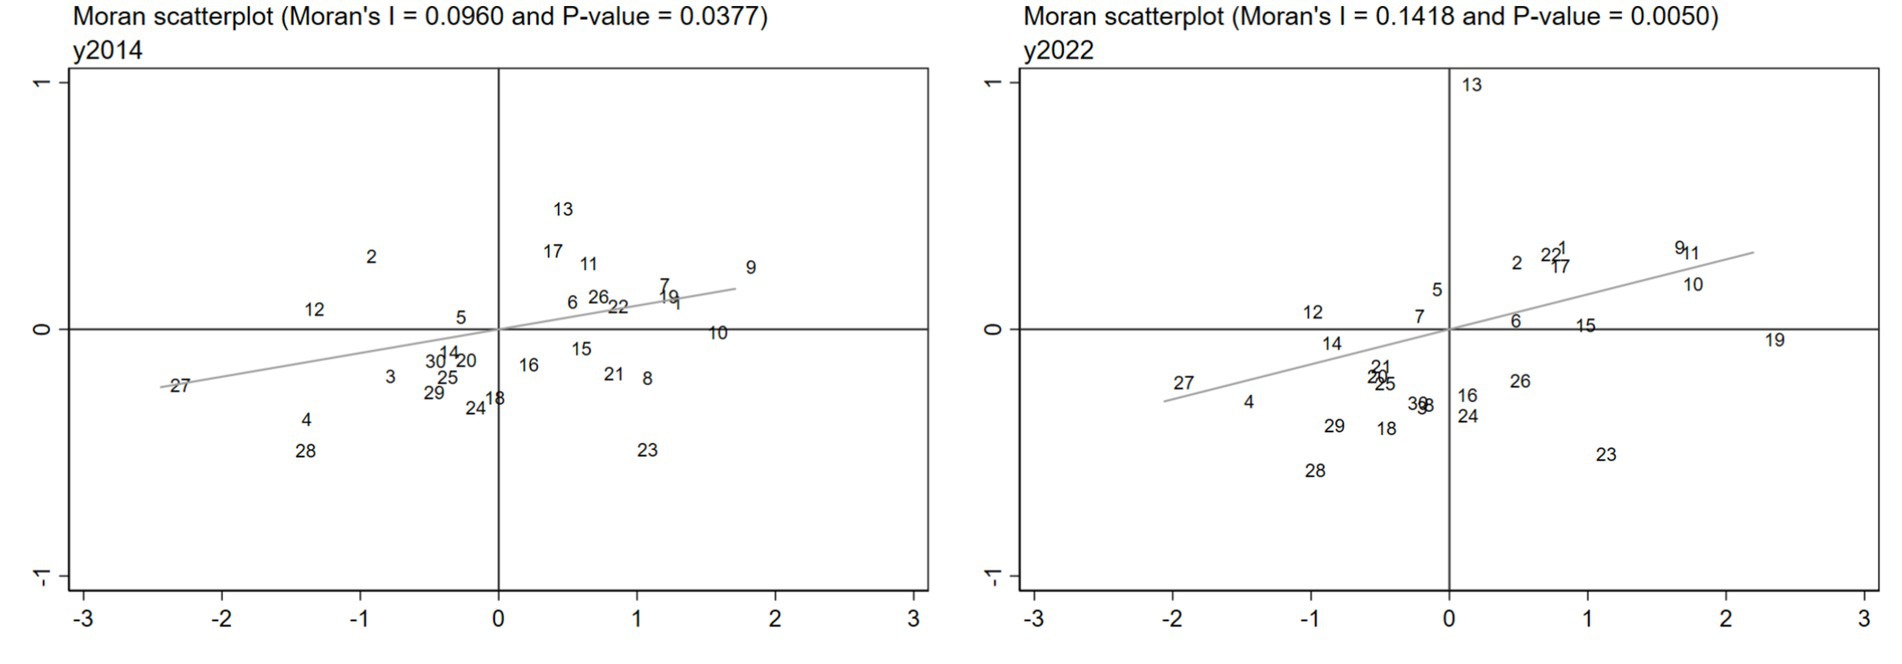
Figure 6. 2014 and 2022 local Moran scatter plots. Eastern: 1, 4, 7, 10, 12, 15, 17, 19, 20, 24, 26. Central: 5, 9, 11, 16, 18, 21, 22, 30. Western: 2, 3, 6, 8, 13, 14, 23, 25, 27, 28, 29.
5.4 Spatial differences in coupling coordination degree
5.4.1 Intra-regional differences
Figure 7a illustrates that from 2014 to 2022, the Gini coefficient of regional coupling coordination exhibited a declining trend, indicating that disparities in internal coupling coordination levels across regions have gradually narrowed. The average Gini coefficient in the central region was lower than that in the eastern region, which in turn was lower than that in the western region. This suggests that the central provinces exhibited less variation in coordination development than the eastern region, while the western region showed the most pronounced disparities. Notably, the central region experienced the largest decrease in intra-regional differences, with its Gini coefficient declining from 0.173 in 2014 to 0.076 in 2022, marking a 56.07 percent reduction.
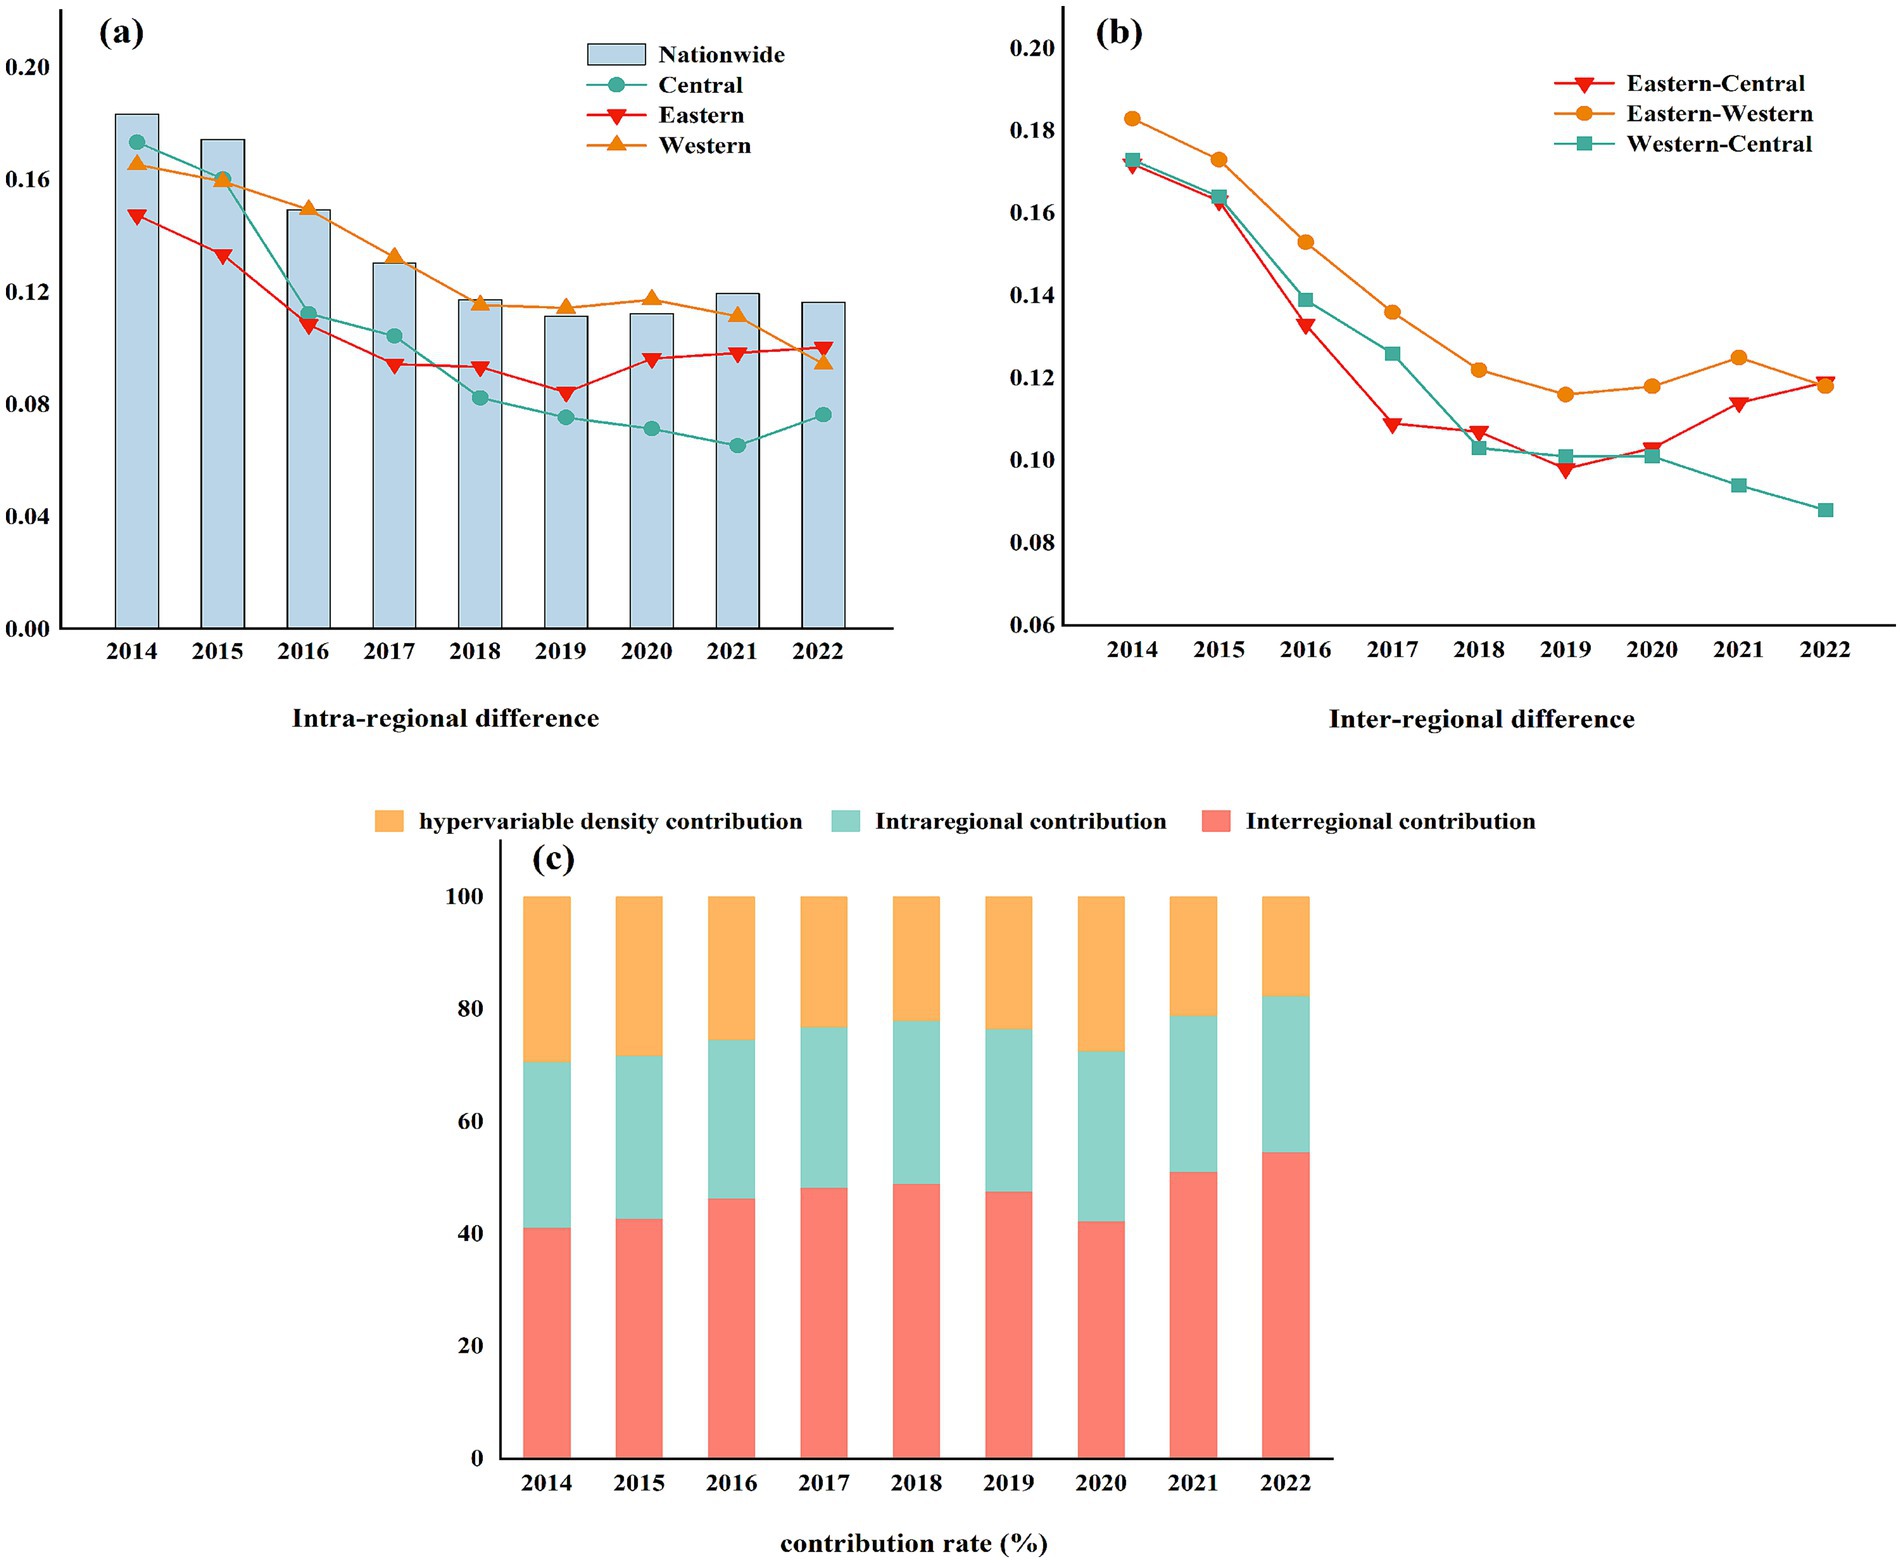
Figure 7. Intra-regional differences, inter-regional differences, and their contribution rates for each region from 2014 to 2022. (a)–(b) merely sorts the images and has no special.
These differences reflect imbalances in technological innovation, economic development, and other structural factors among provinces during the promotion of the digital economy and the enhancement of CLUE. The implementation of the Central Region Revitalization Plan in 2016 provided targeted policy support, leading to industrial upgrading, improved infrastructure connectivity, and the integration of underdeveloped areas into broader regional economic systems. These initiatives significantly fostered coordinated development across eastern, central, and western regions, thereby narrowing the internal development gap within the central region.
5.4.2 Inter-regional differences
As illustrated in Figure 7b, inter-regional differences generally declined over time; however, disparities between the eastern and western regions have gradually widened since 2019. The average Gini coefficient between the eastern and western regions is 0.138, which is higher than the national average and thus warrants special attention. These differences may stem from uneven development in economic capacity, capital accumulation, and technological progress. The eastern region benefits from geographic advantages such as flat terrain and access to international trade through major ports, making it a hub for industrial clustering and global commerce. Foreign investment and advanced technologies are highly concentrated in this region, enabling the transformation of western natural resources into high value-added products through technological upgrading. This dynamic has created a pattern of “resource transfer westward, profit flow eastward,” which has also contributed to labor siphoning from the west to the east. As a result, technological talent has continuously migrated eastward, slowing the western region’s progress in digital economy development and CLUE.
5.4.3 Sources and contributions of differences
Figure 7c reveals that inter-regional differences have consistently contributed the most to the total Gini coefficient, maintaining a dominant share of approximately 47%. In contrast, intra-regional differences remain relatively stable, typically ranging between 27 and 30%. Additionally, the declining contribution rate of hypervariable density suggests that developmental disparities among provinces are gradually narrowing. Given that inter-regional discrepancies represent the largest share of overall inequality, future efforts to address spatial imbalances in the coupling coordination between the digital economy and CLUE should prioritize narrowing regional gaps.
5.5 Dynamic evolution trend of coupling coordination degree
Spatial correlation analysis reveals a significant spatial relationship in the evolution of the CCD between the digital economy and CLUE. To further investigate the dynamic evolution of CCD under spatial interactions, this study constructs a spatial Markov chain model. Based on the classification criteria previously presented (Table 3), CCD is divided into five categories: severe disorder (0.0–0.3), mild disorder (0.3–0.4), imminent disorder (0.4–0.5), basic coordination (0.5–0.6), and benign coordination (0.6–1). These five states are denoted by k = 1, 2, 3, 4, 5, where a higher value of k indicates a higher level of coupling coordination (Liu et al., 2018).
Excluding spatial factors, the dynamic evolution of the CCD between the digital economy and CLUE is presented in Table 7. The analysis reveals the following key characteristics: First, the CCD exhibits a strong “state-locking” effect, as the diagonal elements in the transition matrix are consistently higher than the off-diagonal elements. This indicates a high probability that regions will remain in their current coordination state. The highest retention probabilities are observed in the categories of severe disorder (62.86%), basic coordination (68.42%), and benign coordination (100%), reflecting a tendency for stability in these states. Moreover, the CCD shows a clear upward convergence trend, consistent with the “club convergence” phenomenon, where regions tend to cluster at higher coordination levels. Second, upward transitions are more likely than downward ones, as evidenced by the higher probabilities above the diagonal. This pattern underscores the positive momentum in the coordinated development of CLUE and the digital economy in China. Finally, all transitions occur between adjacent states, with no observed leapfrog transitions across non-adjacent categories. This indicates that the progression in coupling coordination occurs gradually rather than through abrupt shifts.
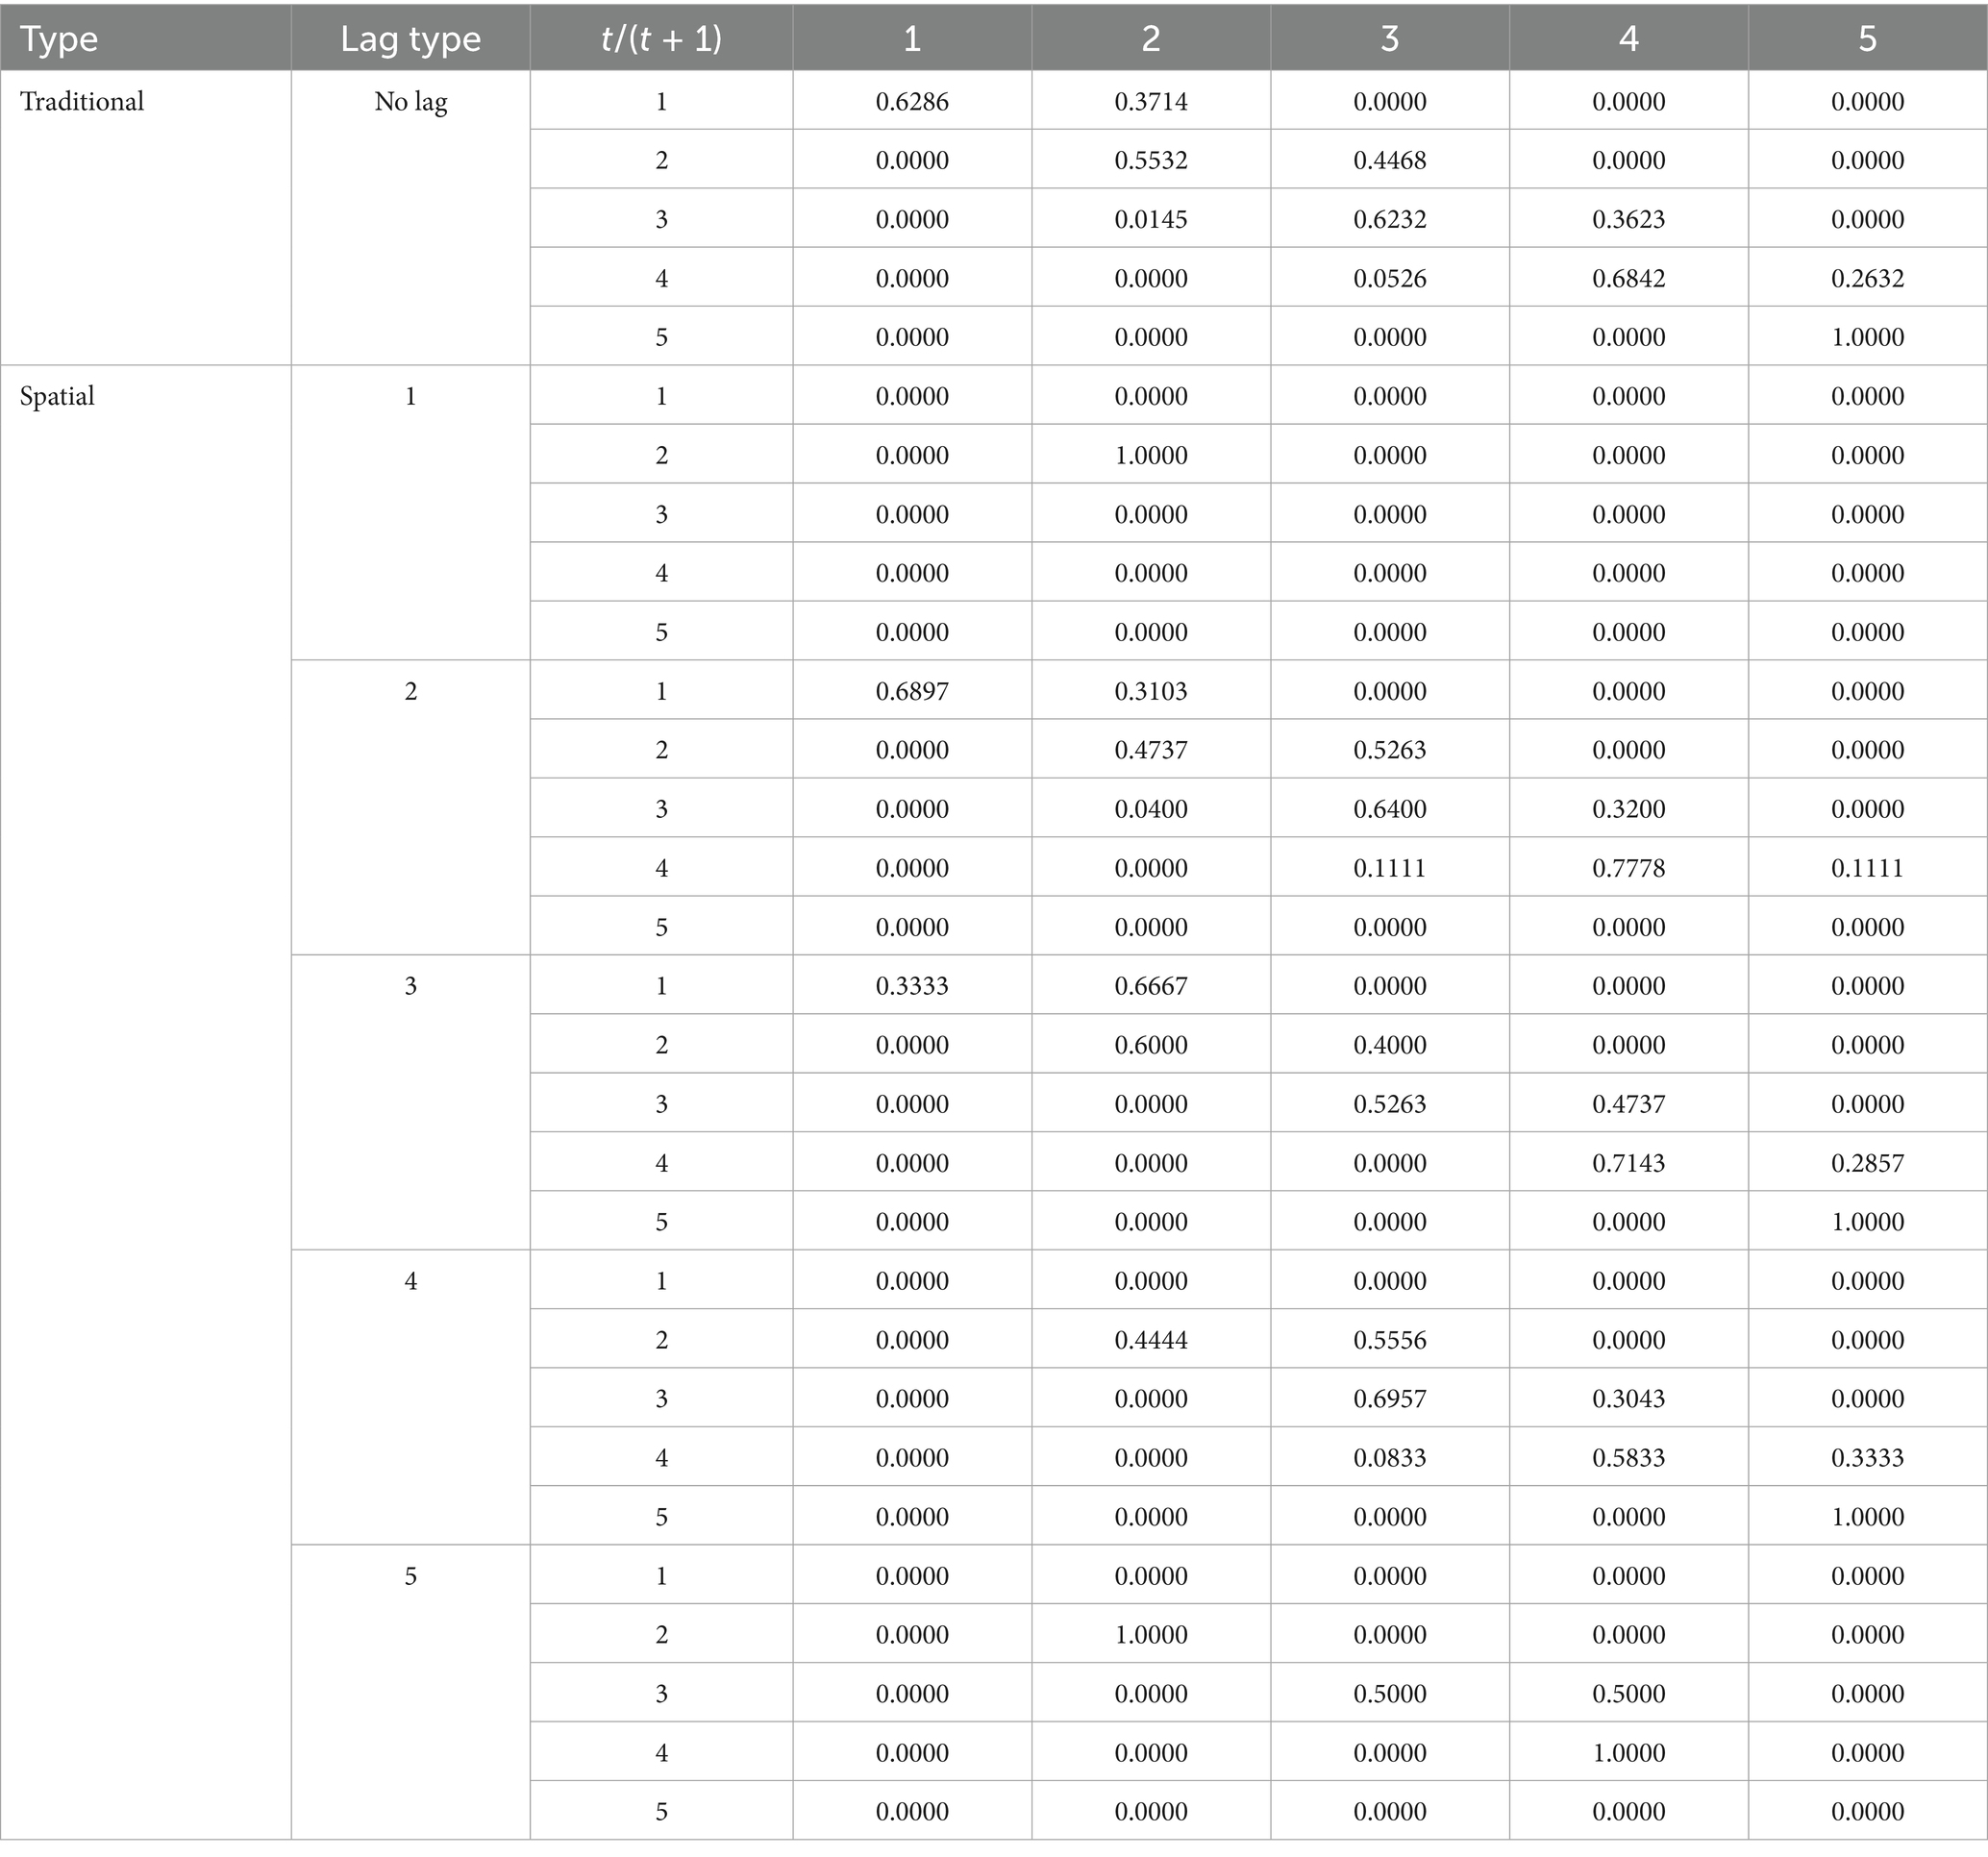
Table 7. 2014–2022 coupling coordination degree transition probability matrix.
Considering Spatial Factors, as shown in Table 7: First, under varying spatial lag types, the spatial Markov transition probabilities differ, suggesting that dynamic transitions in CCD are influenced by the coordination levels of neighboring regions. Second, the positive spatial spillover effects from adjacent regions are conditional. Specifically, when a region shares the same coordination level as its neighbors, the probability of transitioning to a higher state increases compared to scenarios without spatial considerations. This indicates that homogeneous regions are more likely to form effective collaborative networks, whereas heterogeneous regions may require tailored policy interventions. Consequently, inter-regional connectivity should be enhanced to facilitate the diffusion of best practices and technological innovations from more developed regions to less developed ones. Establishing a development framework where advanced regions support lagging areas can foster coordinated regional progress.
5.6 Analysis of the driving factors of coupling coordination degree
5.6.1 Selection of driving factors
Several elements influence the degree of cooperation between China’s digital economy and the efficiency of cultivated land use. Based on relevant studies, this paper takes the CCD as the dependent variable and analyzes the impact of five factors as independent variables: urbanization, economic level, industry structure, technological innovation level, and urban–rural development gap, with the variable definitions provided in Table 8. A multicollinearity test is performed on the driving factors to guarantee the independence of each variable and the dependability of the regression findings (De La Puente Pacheco et al., 2025). Further analysis may be carried out as there is no multicollinearity among the variables, as indicated by the VIF of all driving factors being less than 10.
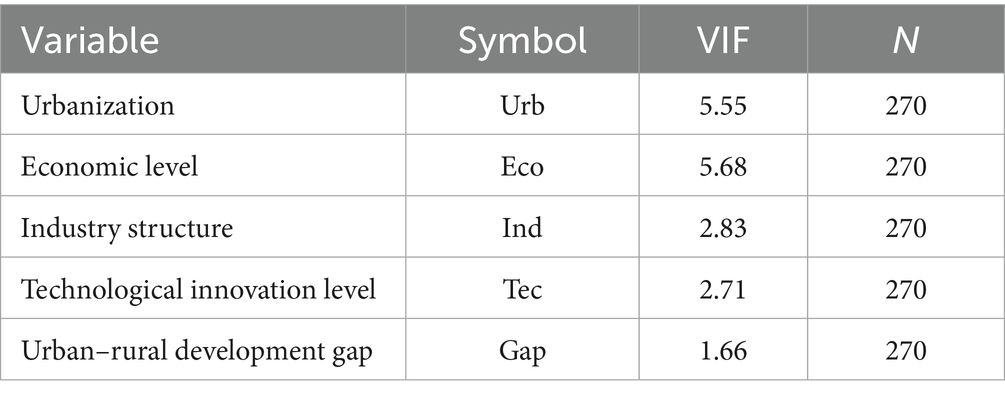
Table 8. The driving factors of coupling coordination degree.
5.6.2 Analysis of the driving factors
The driving factors of the CCD from 2014 to 2022 were examined by including the degree of coordination between China’s digital economy and CLUE into a Tobit regression model with random effects panel using StataMP 17 software. The regression results are shown in Table 9. As seen from Table 2, there are significant differences among the various driving factors, with the degree of impact ranked as follows: urbanization > technological innovation level > economic level > urban–rural development gap > industry structure.
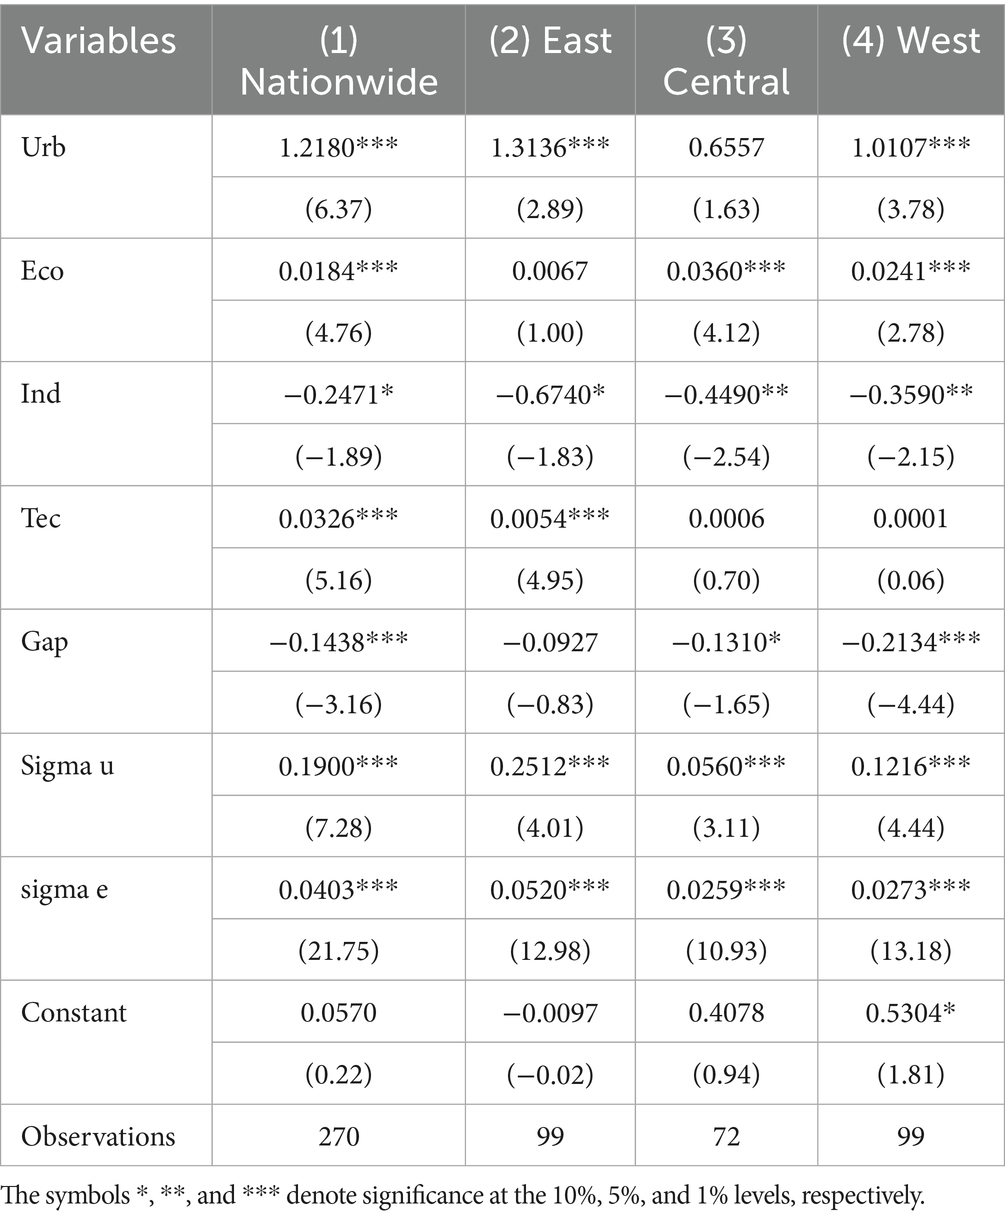
Table 9. Regression results of driving factors.
Economic development, technological innovation, and urbanization have a positive impact on the coordination between China’s digital economy and CLUE. The spatial concentration of population, capital, and technology during urbanization accelerates the spread of digital technologies into agriculture, promoting a shift from scattered to intensive land use. Around cities, cultivated land is consolidated into contiguous farming areas through reclamation and restoration efforts. This aggregation of production factors improves land use efficiency, reduces the cost of technology adoption, and promotes the widespread application of digital tools such as land monitoring systems and intelligent irrigation technologies. Technological innovation is the fundamental driving force. The development of smart agricultural equipment and the integration of digital technologies enhance the precision of land resource management. Agricultural big data platforms combine meteorological, soil, and market information to optimize crop rotation plans, reduce pollution from fertilizers and pesticides, improve soil quality, and increase land use efficiency. These improvements help resolve the traditional conflict between agricultural efficiency and environmental protection. Economic development provides the material foundation for digital research and application. Economically developed regions are more likely to invest in digital infrastructure and promote green technologies, thereby supporting the intensive and ecological transformation of cultivated land and facilitating the integration of digital technologies with land resources.
In contrast, the urban–rural development gap and industrial structure negatively affect coordination. To enhance the synergy between the digital economy and land use efficiency, it is necessary to adjust the industrial structure and narrow urban–rural disparities. The government should focus on guiding industries toward high value-added activities that enable the diffusion of digital capabilities into the agricultural sector, reshaping cultivated land use models. If the urban–rural gap remains large, it may lead to the outflow of rural labor and capital, widen the technological divide, and concentrate public resources in urban areas. As a result, rural areas may become overly reliant on intensive land development to compensate for economic disadvantages, increasing ecological pressure and weakening ecosystems. Addressing these imbalances, promoting integrated urban and rural development, and improving the coordination between the digital economy and land use efficiency are essential for sustainable progress.
5.6.3 Heterogeneity analysis
The driving characteristics of the CCD between the digital economy and CLUE in various areas are analyzed. Table 9 columns (2) through (4) display the findings. First, with values of −0.6740, −0.4490, and −0.3590, respectively, the industry structure coefficients in the eastern, central, and western areas all passed the significance test, suggesting that the influence of industry structure varies by region. Second, urbanization has a significant impact on the eastern and western regions. This shows that urbanization promotes the efficient integration of the digital economy and agricultural resources through the concentration of population, capital, and technology in cities, thereby improving CLUE. Third, economic levels have a positive impact on the central and western regions. Economic growth can drive the development of the digital economy, thereby creating conditions for improving CLUE. Fourth, the urban–rural development gap has a negative impact on central and western regions. The urban–rural development gap leads to a long-term one-way flow of capital, technology, and talent toward cities, creating a digital divide. Rural areas lack digital infrastructure and talent, weakening the synergistic potential between the digital economy and farmland efficiency. Finally, technological innovation has a significant positive effect on the eastern region, but not on other regions. This shows that the eastern region may be more likely to convert science and technology into productivity and improve CLUE due to its high level of science and technology transformation. In contrast, the digital infrastructure level in the central and western regions is relatively backward, and the cost of technology diffusion is too high, thereby inhibiting and offsetting the promotional effect that technological innovation should have on the CCD.
6 Conclusion and recommendations
6.1 Conclusion
The conclusions of this paper are as follows: (1) The development of the digital economy shows significant regional imbalance. The gap between the eastern region and the central and western regions continues to widen. In contrast, the improvement in CLUE is more obvious, with significant increases in CLUE values in all regions. Although there are still differences between regions, the overall situation is better than that of the digital economy. (2) The CCD between the digital economy and CLUE has steadily increased, but regional development imbalances remain significant. Provinces with high coordination are mainly concentrated in the eastern region and parts of the central region. For example, Guangdong, Shanghai, Hubei, and other provinces have surpassed Gansu, Qinghai, and other provinces in terms of development level. (3) The difference in the CCD between the digital economy and CLUE continues to narrow, with significant reductions in both intra-regional and inter-regional differences, but inter-regional differences remain the main source of regional differences. (4) The CCD aggregation characteristics are statistically significant. High-high aggregation areas are mainly concentrated in the eastern and central regions, while low-low aggregation areas are mainly in the western region. The local spatial correlation pattern is dominated by low-low aggregation, and the degree of aggregation is further increasing. (5) The coordination relationship between the digital economy and CLUE exhibits club convergence characteristics. Spatial Markov chains supplement the conclusions of traditional Markov analysis, indicating that changes in coordination status are also influenced by neighboring areas. (6) Urbanization, technological innovation, economic development, urban–rural development gaps, and industrial structure have a significant impact on the CCD. Among these, economic development, technological innovation, and urbanization have a positive impact, while industrial structure and urban–rural development have a negative impact. From the perspective of regional heterogeneity, industrial structure is always an important factor affecting the coordinated development of coupling, while the impact of other factors on the CCD varies across different regions.
6.2 Recommendations
Based on the study’s findings, the following measures are proposed to promote the coordinated development of China’s digital economy and CLUE.
First, the “Classified Guidance, Gradient Advancement” regional development strategy should be implemented. The eastern region should prioritize technological innovation in the digital economy and the aggregation of high-end factors, while the central and western regions need to strengthen investments in digital infrastructure. Efforts should focus on expanding the coverage of foundational technologies such as the Agricultural Internet of Things (IoT) and remote sensing monitoring, exploring the integration of “digital technology + specialty agriculture,” and guiding the east-to-west diffusion of digital technologies to mitigate the geographical attenuation of technological spillovers.
Second, a digital agriculture collaborative development fund should be established to support the joint development of digital agriculture demonstration zones. This initiative should facilitate cross-regional flows of technology, capital, and land resources. High-coordination provinces should be encouraged to support low-coordination areas through technical hosting and talent exchange programs to reduce regional development disparities.
Third, adjustments and upgrades to the industrial structure should be promoted. Enterprises should be guided toward high-value-added emerging industries, shifting away from excessive land resource consumption and alleviating the ecological pressures associated with rapid industrialization and economic growth. Finally, the mutually reinforcing relationship between the digital economy and CLUE should be fully leveraged. The transition from traditional agriculture to digital agriculture and integrated sectors such as eco-agriculture and agri-tourism should be supported, fostering a virtuous cycle of “advancing agriculture through digitalization and enhancing digitalization through agriculture.”
6.3 Limitations and outlook
This study has several limitations, despite offering valuable insights into the coupling and coordination between China’s digital economy and CLUE.
First, although a range of statistical methods was employed, the construction of the indicator system involved numerous variables, making data collection challenging. To prevent data gaps from influencing the results, the analysis was limited to the period from 2014 to 2022. Future studies could extend the time span to enable more comprehensive evaluations.
Second, the study primarily relied on large-scale statistical data to assess the degree of synergy between the digital economy and CLUE. However, such data may not fully capture subtle interactions and underlying mechanisms. Future research could benefit from incorporating case studies and micro-level survey data.
Third, with the continued evolution of the digital economy, emerging technologies such as blockchain, artificial intelligence, and big data analytics may significantly reshape the relationship between digitalization and land use. Future studies should explore how these technological trends influence sustainable land use and agricultural modernization.
Finally, the current digital economy indicator system lacks agriculture-specific metrics. Future research should integrate agricultural digitalization indicators to more accurately analyze the relationship between agricultural digital transformation and land use efficiency.
Data availability statement
The raw data supporting the conclusions of this article will be made available by the authors, without undue reservation.
Author contributions
YaL: Writing – review & editing, Methodology, Conceptualization, Funding acquisition. WM: Writing – original draft. YeL: Data curation, Writing – original draft. LL: Writing – review & editing. YP: Writing – review & editing, Data curation, Supervision, Validation. JW: Writing – review & editing. YC: Funding acquisition, Writing – review & editing.
Funding
The author(s) declare that no financial support was received for the research and/or publication of this article.
Conflict of interest
The authors declare that the research was conducted in the absence of any commercial or financial relationships that could be construed as a potential conflict of interest.
Generative AI statement
The authors declare that no Gen AI was used in the creation of this manuscript.
Publisher’s note
All claims expressed in this article are solely those of the authors and do not necessarily represent those of their affiliated organizations, or those of the publisher, the editors and the reviewers. Any product that may be evaluated in this article, or claim that may be made by its manufacturer, is not guaranteed or endorsed by the publisher.
Footnotes
1. ^Shanghai, Beijing, Tianjin, Shandong, Guangdong, Jiangsu, Hebei, Zhejiang, Hainan, Fujian, Liaoning.
2. ^Jilin, Anhui, Shanxi, Jiangxi, Henan, Hubei, Hunan, Heilongjiang.
3. ^Yunnan, Inner Mongolia, Sichuan, Ningxia, Guangxi, Xinjiang, Gansu, Guizhou, Chongqing, Shaanxi, Qinghai.
References
Abhinav, P., and Rajesh, R. (2025). Forecasting sustainability performances of firms using grey theory and Markov models. Benchmarking Int. J. doi: 10.1108/BIJ-12-2023-0856
Chen, P. (2019). Effects of normalization on the entropy-based TOPSIS method. Expert Syst. Appl. 136, 33–41. doi: 10.1016/j.eswa.2019.06.035
Chen, Y., Li, S., and Cheng, L. (2020). Evaluation of cultivated land use efficiency with environmental constraints in the Dongting Lake eco-economic zone of Hunan Province, China. Land 9:440. doi: 10.3390/land9110440
Chen, L., Zhao, N., Zhang, Z., Zhang, Y., Zuo, W., Wang, Y., et al. (2025). Population shrinkage and spatio-temporal changes in cultivated land use efficiency in China’s agro-pastoral ecotone. Land 14:63. doi: 10.3390/land14010063
Dagum, C. (1997). Decomposition and interpretation of gini and the generalized entropy inequality measures. Statistica. 57, 295–308.
De La Puente Pacheco, M. A., Torres, J., and Guzmán Murillo, H. J. (2025). Economic factors influencing political advertising in Colombian cities. J. Polit. Mark., 1–14.
Fan, X., Lu, X., and Liu, J. (2023). Effects of digital economy development on the urban land green use effects of digital economy development on the urban land green use. Chin. Land Sci. 37, 79–89.
Fu, Z., and Xue, Q. (2025). Analysis of the influence factors of cultivated land transfer in Guangdong coastal important agricultural areas based on geodetectors. Front. Sustain. Food. Syst. 9:1529750. doi: 10.3389/fsufs.2025.1529750
Gui, Z., Ran, Y., Yan, Q., Lanlan, L., and Song, Z. (2021). Analysis of cultivated land use efficiency and influencing factors in the Yangtze River Delta. J. Sichuan Agric. Univ. 39, 843–849.
Han, H., and Zhang, X. (2020). Static and dynamic cultivated land use efficiency in China: a minimum distance to strong efficient frontier approach. J. Clean. Prod. 246:119002. doi: 10.1016/j.jclepro.2019.119002
Hua, J., Yu, J., Song, Y., Xue, Q., and Zhou, Y. (2024). The enabling effect of digital economy on high-quality agricultural development-evidence from China. Sustain. For. 16:3859. doi: 10.3390/su16093859
Huang, D., and Huang, C. (2024). The impact of digital economy development on improving the ecological environment—an empirical analysis based on data from 30 provinces in China from 2012 to 2021. Sustain. For. 16:7176. doi: 10.3390/su16167176
Huang, K., Tang, W., and Zhou, F. (2024). Agricultural productive services and ecological efficiency of cultivated land use: evidence from Hunan Province, China. Pol. J. Environ. Stud. 33, 5127–5140. doi: 10.15244/pjoes/182907
Jia, X., Yang, M., and Zhu, T. (2025). How can the digital economy enable sustainable agricultural development: insights from China’s factor input efficiency. Sustain. For. 17:4372. doi: 10.3390/su17104372
Jiang, S., and Sun, Y. (2020). An empirical study on the effect of digital economy on real economy. Sci. Res. Manag. 41, 32–39.
Kaiyong, W., and Pengyan, Z. (2013). The research on impact factors and characteristic of cultivated land resources use efficiency---take Henan Province, China as a case study. IERI Proc. 5, 2–9. doi: 10.1016/j.ieri.2013.11.062
Khataza, R. R. B., Hailu, A., Doole, G. J., Kragt, M. E., and Alene, A. D. (2019). Examining the relationship between farm size and productive efficiency: a Bayesian directional distance function approach. Agric. Econ. 50, 237–246. doi: 10.1111/agec.12480
Li, W., Cui, W., and Yi, P. (2024). Digital economy evaluation, regional differences and spatio-temporal evolution: case study of Yangtze River economic belt in China. Sustain. Cities Soc. 113:105685. doi: 10.1016/j.scs.2024.105685
Li, J., Yang, S., Luo, Z., and Qi, Y. (2025). The impact of digital economy development on agricultural land utilization efficiency in Sichuan province. Chin. J. Agricult. Resour. Reg. Plan.
Liu, F., Ke, C., and Wen, Y. (2025). Dynamic evolution and regional differences in ecological welfare performance: insights from Guangdong Province, China. Pol. J. Environ. Stud. 34, 735–754. doi: 10.15244/pjoes/186436
Liu, N., Liu, C., Xia, Y., and Da, B. (2018). Examining the coordination between urbanization and eco-environment using coupling and spatial analyses: a case study in China. Ecol. Indic. 93, 1163–1175. doi: 10.1016/j.ecolind.2018.06.013
Luo, L., Nie, Q., Jiang, Y., Luo, F., Wei, J., and Cui, Y. (2024). Spatiotemporal dynamics and spatial spillover effects of resilience in China’s agricultural economy. Agriculture 14:1522. doi: 10.3390/agriculture14091522
Lyu, T., Fu, S., Hu, H., and Geng, C. (2024). Spatiotemporal differentiation characteristics and spatial effects of ecological efficiency of cultivated land use based on the constraints of agricultural green transformation. Res. Soil Water Conserv. 31, 269–279, 289.
Ma, Y., Wang, X., and Zhong, C. (2024). Spatial and temporal differences and influencing factors of eco-efficiency of cultivated land use in main grain-producing areas of China. Sustain. For. 16:5734. doi: 10.3390/su16135734
Miao, Z. (2021). Digital economy value chain: concept, model structure, and mechanism. Appl. Econ. 53, 4342–4357. doi: 10.1080/00036846.2021.1899121
Pei, B., and Chen, S. (2024). The spatio-temporal variations of cultivated land compensation efficiency and its influencing factors in mainland China. Ecol. Indic. 166:112596. doi: 10.1016/j.ecolind.2024.112596
Qindong, F., Zhang, Y., Wei, G., and Huang, X. (2025). Coupling coordination analysis of urban social vulnerability and human activity intensity. Environ. Res. Commun. 7:035009. doi: 10.1088/2515-7620/adb9c1
Subkhan, F., Maarif, M. S., Rochman, N. T., and Nugraha, Y. (2025). Orchestrating digital economy to foster economic resilience of smart cities: the soft system approach. Etikonomi 24, 315–334. doi: 10.15408/etk.v24i1.39224
Tan, S., Tong, B., Zhang, J., and Zhang, B. (2024). Impact of digital financial inclusion on cultivated land use efficiency: based on the empirical analysis of Central China from 2011 to 2020. China Land Sci. 38, 78–89.
Tian, Y., Wang, R., Yin, M., and Zhang, H. (2023). Study on the measurement and influencing factors of rural energy carbon emission efficiency in China: evidence using the provincial panel data. Agriculture 13:441. doi: 10.3390/agriculture13020441
Wang, Q. J., Li, W. Z., Gong, Z. Y., and Fu, J. Y. (2025). The coupling and coordination between digital economy and green economy: evidence from China. Emerg. Mark. Financ. Trade 61, 562–578. doi: 10.1080/1540496X.2024.2399555
Wang, F., Wang, H., and Xiong, L. (2024). Does the digital economy exhibit multiplier effects? A case study on the optimization of agricultural production structure in rural digital economy. Int. J. Agric. Sustain. 22:2386821. doi: 10.1080/14735903.2024.2386821
World Food Programme. (2024). Global report on food crises (GRFC) 2024. Available online at: https://www.fsinplatform.org/grfc2024 (Accessed March 28, 2025).
Wu, Z., Fan, Q., Li, W., and Zhou, Y. (2024). The spatial–temporal evolution and impact mechanism of cultivated land use in the mountainous areas of Southwest Hubei Province, China. Land 13:1946. doi: 10.3390/land13111946
Wu, S., Tang, J., Li, M., and Xiao, J. (2024). Digital economy, binary factor mismatch and sustainable economic development of coastal areas in China. Heliyon 10:e26453. doi: 10.1016/j.heliyon.2024.e26453
Wu, H., and Wen, X. (2025). Research on the efficiency and synergistic effect of industrial green innovation development in the Beijing–Tianjin–Hebei urban agglomeration. Sustain. For. 17:1244. doi: 10.3390/su17031244
Xiang, J., Han, P., and Chen, W. (2023). Coordinated development efficiency between cultivated land spatial morphology and agricultural economy in underdeveloped areas in China: evidence from western Hubei province. J. Geogr. Sci. 33, 801–822. doi: 10.1007/s11442-023-2107-9
Xu, J., Yu, Y., Zhang, M., and Zhang, J. Z. (2023). Impacts of digital transformation on eco-innovation and sustainable performance: evidence from Chinese manufacturing companies. J. Clean. Prod. 393:136278. doi: 10.1016/j.jclepro.2023.136278
Yang, Y., Xie, Z., Wu, H., and Wang, L. (2024). Ecological degradation and green development at crossroads: incorporating the sustainable development goals into the regional green transformation and reform. Environ. Dev. Sustain. doi: 10.1007/s10668-024-05544-y
Yu, Y., Lin, J., Zhou, P., Zheng, S., and Li, Z. (2022). Cultivated land input behavior of different types of rural households and its impact on cultivated land-use efficiency: a case study of the Yimeng Mountain area, China. Int. J. Environ. Res. Public Health 19:14870. doi: 10.3390/ijerph192214870
Zhang, Y., Chen, Y., Liu, Y., and Lu, Z. (2017). The influence of farmersland values on the cultivated land utilization efficiency. J. Arid Land Resour. Environ. 31, 19–25.
Zhang, C., Lv, W., Liu, G., and Wang, Y. (2025). Multidimensional spatiotemporal autocorrelation analysis theory based on multi-observation spatiotemporal Moran’s I and its application in resource allocation. Earth Sci. Inform. 18:36. doi: 10.1007/s12145-024-01598-8
Zhang, S., Mu, X., Chen, X., and Li, M. (2024). Research on the integration of China’s digital economy and real economy: from the perspective of social reproduction process. China Soft Sci., 35–45.
Zhang, J., Zhang, P., Liu, Y., Lu, S., and Wu, G. (2024). An analysis of the spatiotemporal evolution and driving force of cultivated land green utilization in karst region of Southwest China. J. Clean. Prod. 434:140002. doi: 10.1016/j.jclepro.2023.140002
Zhang, J., Zhang, P., Lu, S., and Wu, G. (2025). Exploring the impact of rural labor mobility on cultivated land green utilization efficiency: case study of the karst region of Southwest China. Agriculture 15:226. doi: 10.3390/agriculture15030226
Zhu, J., Li, X., Zeng, X., Zhong, K., and Xu, Y. (2022). Cultivated land-use benefit evaluation and obstacle factor identification: empirical evidence from northern Hubei, China. Land 11:1386. doi: 10.3390/land11091386
Zhu, T., Liu, J., and Zhu, G. (2025). Technological progress and scale efficiency changes in China’s energy industry: a comparison of new and traditional energy under the DEA-Malmquist-Tobit model. Sustain. For. 17:662. doi: 10.3390/su17020662
Keywords: digital economy, cultivated land use efficiency, coupling coordination degree model, driving factors, spatial differences, spatial autocorrelation
Citation: Li Y, Ma W, Li Y, Luo L, Pan Y, Wei J and Cui Y (2025) The evolutionary characteristics and driving factors of the coupling coordination degree of digital economy and cultivated land use efficiency in China. Front. Sustain. Food Syst. 9:1617727. doi: 10.3389/fsufs.2025.1617727
Edited by:
Sukoluhle Mazwane, University of Mpumalanga, South AfricaReviewed by:
Yunxian Yan, Jilin Agriculture University, ChinaYifan Tang, Hunan Agricultural University, China
Copyright © 2025 Li, Ma, Li, Luo, Pan, Wei and Cui. This is an open-access article distributed under the terms of the Creative Commons Attribution License (CC BY). The use, distribution or reproduction in other forums is permitted, provided the original author(s) and the copyright owner(s) are credited and that the original publication in this journal is cited, in accordance with accepted academic practice. No use, distribution or reproduction is permitted which does not comply with these terms.
*Correspondence: Jie Wei, amlld2VpQGd4dS5lZHUuY24=; Yong Cui, MjAyMDAxMTRAZ3hhdS5lZHUuY24=
†These authors share first authorship