 Xieqihua Liu
 Yi Zhu1†
 Tao Zhang
- 1Faculty of Humanities and Social Sciences, Macao Polytechnic University, Macao, China
- 2University of Malaya, Kuala Lumpur, Malaysia
- 3School of Marxism, East China Jiaotong University, Nanchang, China
Promoting the improvement of agricultural ecological efficiency (AEE) under the “dual carbon” goals is an important way to drive the high-quality development of the Yangtze River Economic Belt (YEB). This study, based on panel data from 11 provinces and cities along the YEB from 2008 to 2023, first accounts for agricultural carbon sources and sinks, then incorporates them into a non-desired output super-efficiency SBM model to measure the AEE of the YEB, and finally uses the Tobit model to analyze the factors influencing AEE. The study found that (1) the net agricultural carbon sink of the YEB increased from 108.160 million tons in 2008 to 142.890 million tons in 2023, and the net agricultural carbon sinks of Anhui, Jiangsu, and Sichuan ranked among the top three in the basin. (2) The AEE of the YEB gradually increases from 0.625 in 2008 to 1.024 in 2023, and the AEE accelerates after 2020; In 2008, most provinces and cities were primarily located in areas characterized by low surplus and low efficiency, but by 2023, they had predominantly transitioned to areas with high surplus and high efficiency, along with some remaining in low-surplus, high-efficiency zones. In terms of the type of AEE, in 2008, provinces and municipalities were mainly concentrated in low-surplus low-efficiency zones, low-surplus low-efficiency zones, and high-surplus low-efficiency zones, while in 2023, provinces and municipalities were primarily focused in high-surplus high-efficiency zones and low-surplus high-efficiency zones. (3) In terms of influencing factors, the living standard of farmers, the level of financial support for agriculture, and the level of agricultural marketization will promote the improvement of AEE, while the level of farmland water conservancy facilities, the rate of disaster, and the level of urbanization will hinder the improvement of AEE. Therefore, this paper proposes optimizing the structure of agricultural production factors, implementing differentiated low-carbon agricultural development strategies, and strengthening governmental collaborative governance. This study aims to offer a fresh viewpoint on how to better assess AEE, provide a Chinese approach to achieving agricultural carbon neutrality in global river basins, and suggest practical steps to reach the “Carbon Peak and Carbon Neutrality” goal in the YEB.
1 Introduction
Global climate change and resource constraints have emerged as significant challenges to the sustainable development of human society, while the proposal of the “carbon peak and carbon neutral” goal represents a crucial step toward facilitating a green and low-carbon transition for all countries worldwide. As the world’s largest developing country and carbon emitter, China’s realization of the dual-carbon goal is not only related to its own sustainable development but also a significant contribution to global climate governance. The agricultural industry is not only the foundation of the national economy but also an important source of greenhouse gas emissions. China has made world-renowned achievements in agriculture recently, providing strong support for promoting rural revitalization (Deng and Gibson, 2019). However, the development model of high input, pollution and low efficiency in traditional agricultural production (Liu et al., 2020) has exacerbated ecological problems such as soil degradation and water pollution (Bernard et al., 2023; Zhang et al., 2024), which has seriously constrained the sustainable development of agriculture.
Against this background, “eco-efficiency,” as a core concept for measuring the environmental friendliness of economic activities, has gradually attracted the attention of academics and policymakers. The concept was first proposed by Schaltegger and Sturm, who defined it as the ratio of economic growth to environmental impacts, emphasizing the improvement of economic output by reducing resource inputs and environmental burdens (Schaltegger and Sturm, 1990). In agriculture, AEE has been further expanded as the ability of agricultural production to maximize economic output with given inputs while minimizing resource consumption and environmental pollution (Orea and Wall, 2017). The term provides a scientific basis for measuring the economic and environmental benefits of agricultural activities and is an important tool for realizing green and low-carbon agricultural development.
As an important engine of China’s economic growth, the YEB has shown vigorous agricultural development, with its labor productivity, land output rate, mechanization and facilitation levels leading the country and contributing as much as 43% of agricultural value added with 33% of the country’s arable land (Jin et al., 2018). However, the rapid economic growth has also inevitably triggered problems such as environmental pollution and ecological damage, leading to a worrying ecological and environmental situation (Chen et al., 2019). In the context of strengthening the agro-ecological environmental protection of the YEB, systematically measuring the AEE of the YEB, analyzing its changing characteristics, and dissecting its key factors are of great value for improving the AEE of the YEB and alleviating the pressure of economic growth and ecological environmental protection. To this end, this paper focuses on the following core questions: What are the characteristics of agricultural carbon emissions, carbon sinks, and net carbon sinks development in the YEB? What are the differences in the levels of AEE in the YEB under the three assessment frameworks of “traditional,” “low-carbon,” and “green”? What are the characteristics of the spatial and temporal evolution of AEE in the YEB, and what are their regional differences? What factors lead to changes in AEE in the YEB?
1.1 Literature review
Research on AEE has predominantly focused on three key areas: first, the evaluation methods for AEE. Early techniques focused primarily on the ratio between economic value and environmental impact. Although the ratio method indicates the environmental impact of economic development to some extent, it overlooks the input side and fails to comprehensively represent the entire agricultural production process. As a result, this method gradually fell out of favor. Stochastic frontier analysis (Farrell, 1957) and the life-cycle approach (Pan et al., 2013) each have limitations in addressing multi-output problems or cross-regional comparisons, despite their distinctiveness. Currently, Data Envelopment Analysis is widely used for its objectivity, effectively avoiding the advantages of subjective setting of weight settings (Huang et al., 2018; Xiong et al., 2020). The integrated benefits of ecosystems and unexpected outputs in agricultural production, however, are not fully taken into account by the traditional DEA model. To overcome this shortcoming, Tone (2001) proposed the SBM model of undesired outputs, which significantly improves the scientific validity and objectivity of the assessment results by incorporating negative externality outputs (e.g., carbon emissions).
Second, the evaluation of constructing an AEE indicator system: a reasonable indicator system is the basis of AEE assessment. Several aspects, such as input indicators, output indicators, and externality indicators, contribute to the construction of the AEE indicator system (Andersen and Petersen, 1993; Quah, 1993). In choosing input indicators, researchers usually look at small inputs like fertilizers, pesticides, and agricultural films, while also taking into account larger factors, such as the number of machines used, average income, how much agriculture is commercialized, the rate of disasters, and the level of financial support for farming. In the selection of desired and non-desired output indicators, scholars differ in their research focus. Many studies utilize provincial panel data, identifying agricultural carbon emissions or agricultural surface pollution as non-desired outputs (Pishgar-Komleh et al., 2021; Ji and Hoti, 2022; Wu et al., 2022; Zhuang et al., 2021; Cecchini et al., 2018). In contrast, only a few studies have examined positive externalities of agricultural production beyond economic outputs (Rosano Peña et al., 2018; Wang et al., 2022), and even fewer focus specifically on agricultural carbon sinks. However, indicator systems that only consider negative environmental externalities reduce the comprehensiveness and accuracy of agricultural efficiency assessments (Cui et al., 2022).
Third, we investigate the factors that influence AEE. Analyzing the driving factors of AEE can effectively and scientifically explore pathways to improve agricultural economic efficiency (Xie et al., 2018). In analyzing the driving factors of AEE, panel data regression models are often employed, incorporating various factors, such as technological innovation, policy support, and environmental changes. People widely use the Tobit model due to its capacity to manage limited dependent variables. For example, Chen et al. (2023) used the Tobit model to analyze the impact of China’s urbanization composite index and indicators on AEE in 30 provinces and cities from 2009 to 2018, and proposed targeted measures to solve the problem.
The existing studies have achieved rich results, but there are still some shortcomings. (1) Most existing studies focus on the national (Gancone et al., 2017; Workneh and Kumar, 2023), provincial (Yan et al., 2020), or municipal (Rosano-Peña et al., 2020; Yang et al., 2021) levels, with fewer exploring the differential characteristics of AEE in specific regional contexts; (2) Agricultural production possesses dual attributes as both a carbon source and a carbon sink, yet most existing literature only considers the negative impact of agricultural carbon emissions while neglecting the significant value of positive ecological externalities in assessing AEE. (2) Agricultural production has the dual attributes of carbon source and sink, and most of the existing literature only considers the negative role of agricultural carbon emissions, ignoring the key value of positive ecological externality outputs in assessing AEE.
1.2 Research purpose and contribution
In view of this, this paper takes China’s YEB as the research object, and based on the panel data of each province and city from 2008 to 2023, based on the measurement of agricultural carbon sources and sinks and the revelation of the carbon balance characteristics of agricultural production, it adopts the Super-SBM model to accurately measure AEE and compare the traditional AEE, low-carbon AEE and green AEE, and to reveal the characteristics and change trends of low-carbon efficiency of green agriculture in each province in the domain. On this basis, the Tobit regression model was used to further examine the main drivers of the AEE in the region, with a view to providing data references and a decision-making basis for improving the AEE of the YEB, narrowing the gap between the AEE in the region, promoting the high-quality development of agriculture, and realizing the goal of “double-carbon.”
The contributions of this study are: First, it expands the assessment framework of AEE, incorporates agricultural carbon sinks into the evaluation system, and constructs a multi-dimensional analysis framework covering resource utilization, environmental impact and economic benefits, which is more in line with the nature of agro-ecological system’s balance of “carbon source-sink.” Secondly, the study reveals the spatial and temporal characteristics of AEE in the YEB and identifies the strengths and weaknesses of its upstream, midstream, and downstream regions, providing data support for optimizing agricultural resource allocation. Third, the research results can provide a reference for other regions and agricultural agglomerations to explore the path of low-carbon agriculture enhancement and achieve the carbon-neutral goal.
The following section outlines the structure of the remainder of this paper. Chapter 2: Constructing the research methodology and clarifying the data sources. Chapter 3: reports and analyzes the empirical results, including study of agricultural net carbon, AEE, and influencing factors. Chapter 4: Provides an in-depth discussion of the empirical results. Chapter 5: Contains conclusions, recommendations, and directions for further research.
2 Methodology
2.1 Research area
The YEB is a major economic region and an essential ecological security barrier in China (Zhang et al., 2024). It serves as a key platform for sustainable development while playing a crucial role in ensuring national ecological security. It fulfills multiple functions, including food production, water conservation, soil preservation, and carbon sequestration. The YEB consists of three main development areas: the upstream region (Chongqing, Sichuan, Yunnan, and Guizhou), the midstream region (Hubei, Hunan, and Jiangxi), and the downstream region (Shanghai, Jiangsu, Zhejiang, and Anhui). To create a safe ecological barrier for the YEB, the State issued the Outline of the Development Plan for the YEB in 2016, which clearly stated the need to advance agricultural modernization and improve the ecological environment of the Yangtze River Basin. In 2018, the central government further proposed that the YEB should adhere to the principles of ecological priority and green development, with the transformation of agricultural production to low-carbon models being a key initiative to implement these principles. Against this background, the provinces along the Yangtze River are actively promoting the transformation of agricultural production toward green development and implementing several initiatives to optimize the structure of agricultural production. The study aims to analyze the current situation and factors affecting the agroecological development of the YEB, which is important for further improving the overall competitiveness of agriculture in the region and maintaining regional ecological security. It will also provide replicable experiences for other major agricultural production areas and help achieve the ambitious goals of carbon peaking and carbon neutrality (Figure 1).
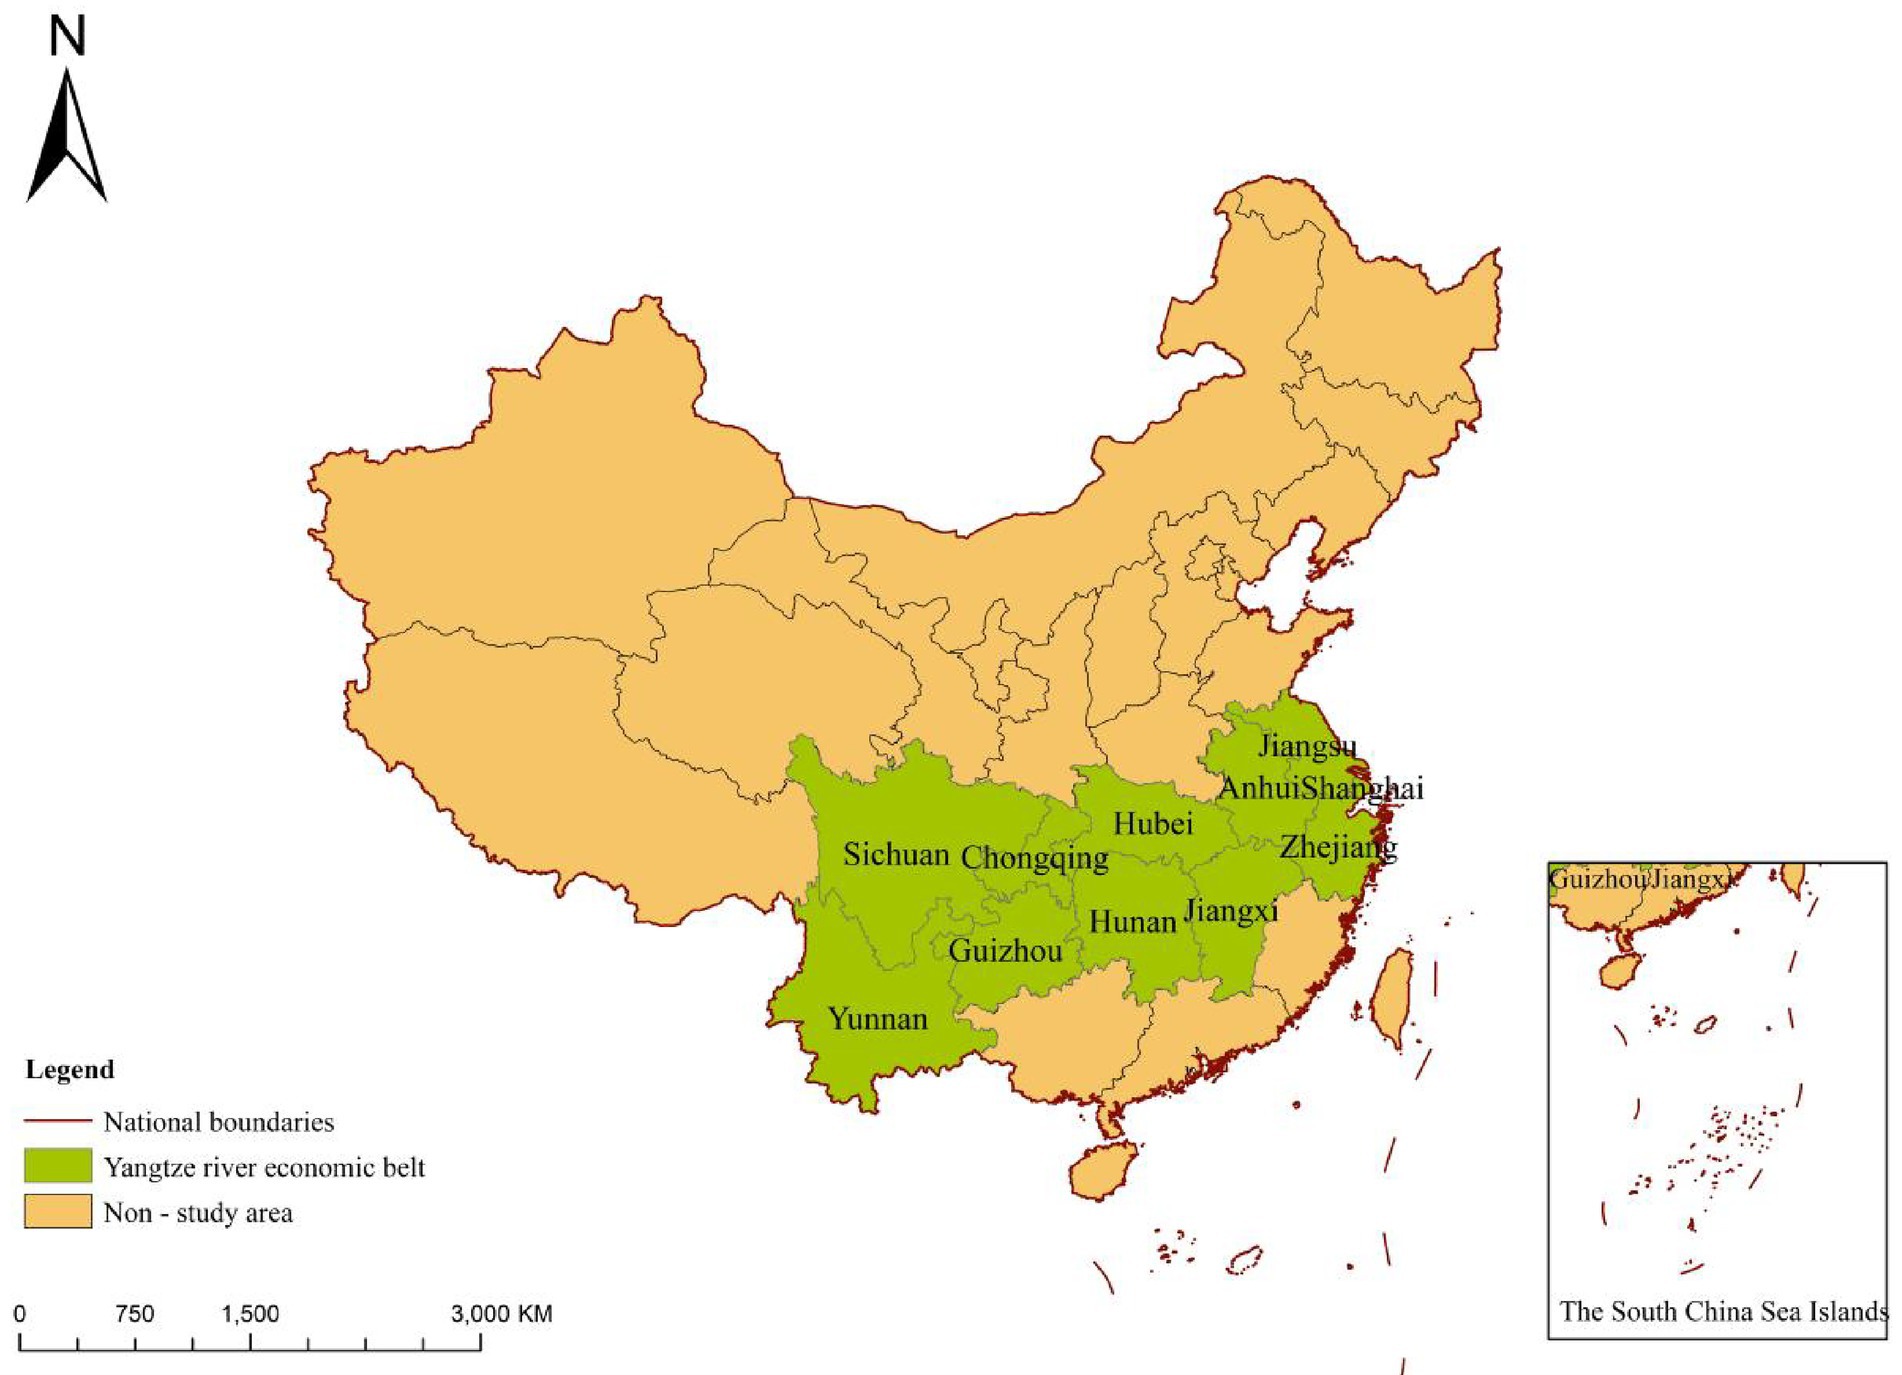
Figure 1. The geographic location of the Yangtze River Economic Belt display map.
2.2 Data sources
This study employs panel data from provinces and cities in the YEB from 2008 to 2023 to conduct a rigorous and effective evaluation of the region’s AEE. Additionally, the study analyzes the underlying causes of efficiency disparities across provinces and cities and offers insights into the future trajectory of low-carbon agriculture in the region. The data presented in this research are derived from the China Statistical Yearbook (2007–2023) and the statistical yearbooks of provinces and cities within the YEB. Some of the missing values were filled in using interpolation. Missing data for some years are made up by linear interpolation.
2.3 Research methodology
2.3.1 Estimation of agricultural net carbon sink in the YEB
2.3.1.1 Estimation of agricultural carbon emissions
Agricultural production activities contribute significantly to carbon emissions (Dubey and Lal, 2009). In this study, carbon emissions are calculated using the emission factor approach, with a focus on three primary sources of agricultural carbon emissions: agricultural inputs, rice cultivation, and livestock breeding. Carbon emissions from agricultural inputs are calculated based on the use of fertilizers, pesticides, plastic films, diesel fuel, land tillage, and the area of effective irrigation. Considering that the YEB is a significant rice-growing area in China, methane (CH4) emissions from rice paddies are identified as a separate carbon source in this study. The study also considers carbon emissions from livestock farming, focusing on five animal species: pigs, cattle, sheep, and poultry. The carbon emission factors for these sources are derived from the author’s previous research (Liu et al., 2022).
In the Equation 1, C represents the total agricultural carbon emissions. refers to the carbon emissions from the i-th type of carbon source in the t-th year, while represents the amount or output of the i-th carbon source in the t-th year. denotes the emission factor for each carbon source.
The emissions for the above indicators are converted into carbon equivalent using the following method: (1 t CH4 = 6.82 t C, 1 t N2O = 81.27 t C).
2.3.1.2 Estimation of agricultural carbon sequestration
This paper focuses on agricultural carbon sequestration, which means the carbon captured during farming, rather than the broader studies on forestry and soil carbon sequestration that look at ecosystem management and long-term changes. Crops, through photosynthesis, capture carbon from the air and convert it into carbohydrates, which they absorb and utilize, thus constituting agricultural carbon sequestration (Zhang et al., 2024). The level of carbon sequestration depends on crop yield. The greater the crop yield, the stronger the carbon absorption capacity, and hence, the higher the level of carbon sequestration. Conversely, lower yields correspond to lower carbon sequestration levels. Based on relevant studies, the selected food crops in this paper include rice, wheat, maize, tubers, and legumes, while the economic crops include oilseed plants, sugarcane, and vegetables. Carbon sequestration estimates are made for each of these crops. The economic coefficients and carbon sequestration rates for major crops are sourced from the “Provincial Greenhouse Gas Inventory Compilation Guidelines.” The formula for carbon sequestration estimation is as follows (Xiong et al., 2020):
In the Equation 2, represents the agricultural carbon sequestration amount, denotes the carbon sequestration for the i-th crop type, refers to the carbon absorption rate of the i-th crop type, is the yield of the i-th crop type, represents the moisture content of the harvested portion of the i-th crop, indicates the root-to-crown ratio of the i-th crop, and is the economic coefficient of the i-th crop.
2.3.1.3 Calculation of agricultural net carbon sequestration
In this study, agricultural net carbon sequestration refers to the difference between the carbon sequestration generated by agricultural production activities and the carbon emissions from agriculture. The formula is as follows:
In the Equations 3, 4: represents the total agricultural net carbon sequestration, represents the total carbon sequestration from agricultural production, represents the total carbon emissions from agricultural production, , represent the carbon emissions from agricultural input materials, rice cultivation, and livestock farming, respectively.
2.3.2 AEE in the YEB
2.3.2.1 Super-efficiency SBM model
The DEA model is a method to judge the relative efficiency among different individuals (Charnes et al., 1978). The traditional DEA (Data Envelopment Analysis) model has trouble telling apart different decision-making units that all have the same efficiency score of 1, and it also has limits when analyzing the factors that influence efficiency. To enhance the discriminative power of the model, Tone (2001) further developed the Super-efficiency SBM model, which incorporates slack variables into the objective function, effectively solving the problem of tied rankings (Zhang and Cai, 2024). This model allows for a more precise evaluation of the ecological efficiency optimization across provinces and municipalities in the YEB. This study focuses on the AEE of the YEB. Given that agricultural production has the dual attributes of economic benefits and environmental impacts (Fan et al., 2024), the traditional data envelopment analysis is unable to effectively deal with undesired outputs, such as agricultural carbon emissions (Huang and Wang, 2020), and the GML index is unable to analyze the efficiency components in a specific period (Li and Hu, 2025). The super-efficient SBM model can solve the above problems and better measure the resource efficiency and environmental cost of production activities, which fits the needs of assessing the AEE of the YEB. Accordingly, in this study, we consider agricultural gross output value and agricultural carbon sequestration as desirable output indicators, while agricultural carbon emissions are treated as undesirable outputs. The Super-SBM model is then employed to conduct an accurate assessment of AEE in the YEB. The specific formula is as follows:
In the Equations 5, 6: represents AEE, , , represent input factors, desirable outputs, and undesirable outputs, respectively, , , represent the slack variables for input factors, desirable outputs, and undesirable outputs, respectively, is the intensity variable, , , denote the number of input indicators, desirable output indicators, and undesirable output indicators, respectively, with representing the weight vector.
2.3.2.2 Selection of variables
AEE reflects the relationship between agricultural economic growth, resource conservation, and environmental protection. Based on economic growth theory and the specific characteristics of the agricultural ecosystem in the YEB, this study incorporates the concept of agricultural low-carbon development into the AEE framework. In this study and with reference to related studies (Gancone et al., 2017; He and Liu, 2024; Ji and Jiang, 2024), an AEE evaluation system for the YEB was constructed based on the principles of availability, authenticity, and representativeness in terms of production inputs, desired outputs, and non-desired outputs of agriculture (Table 1).
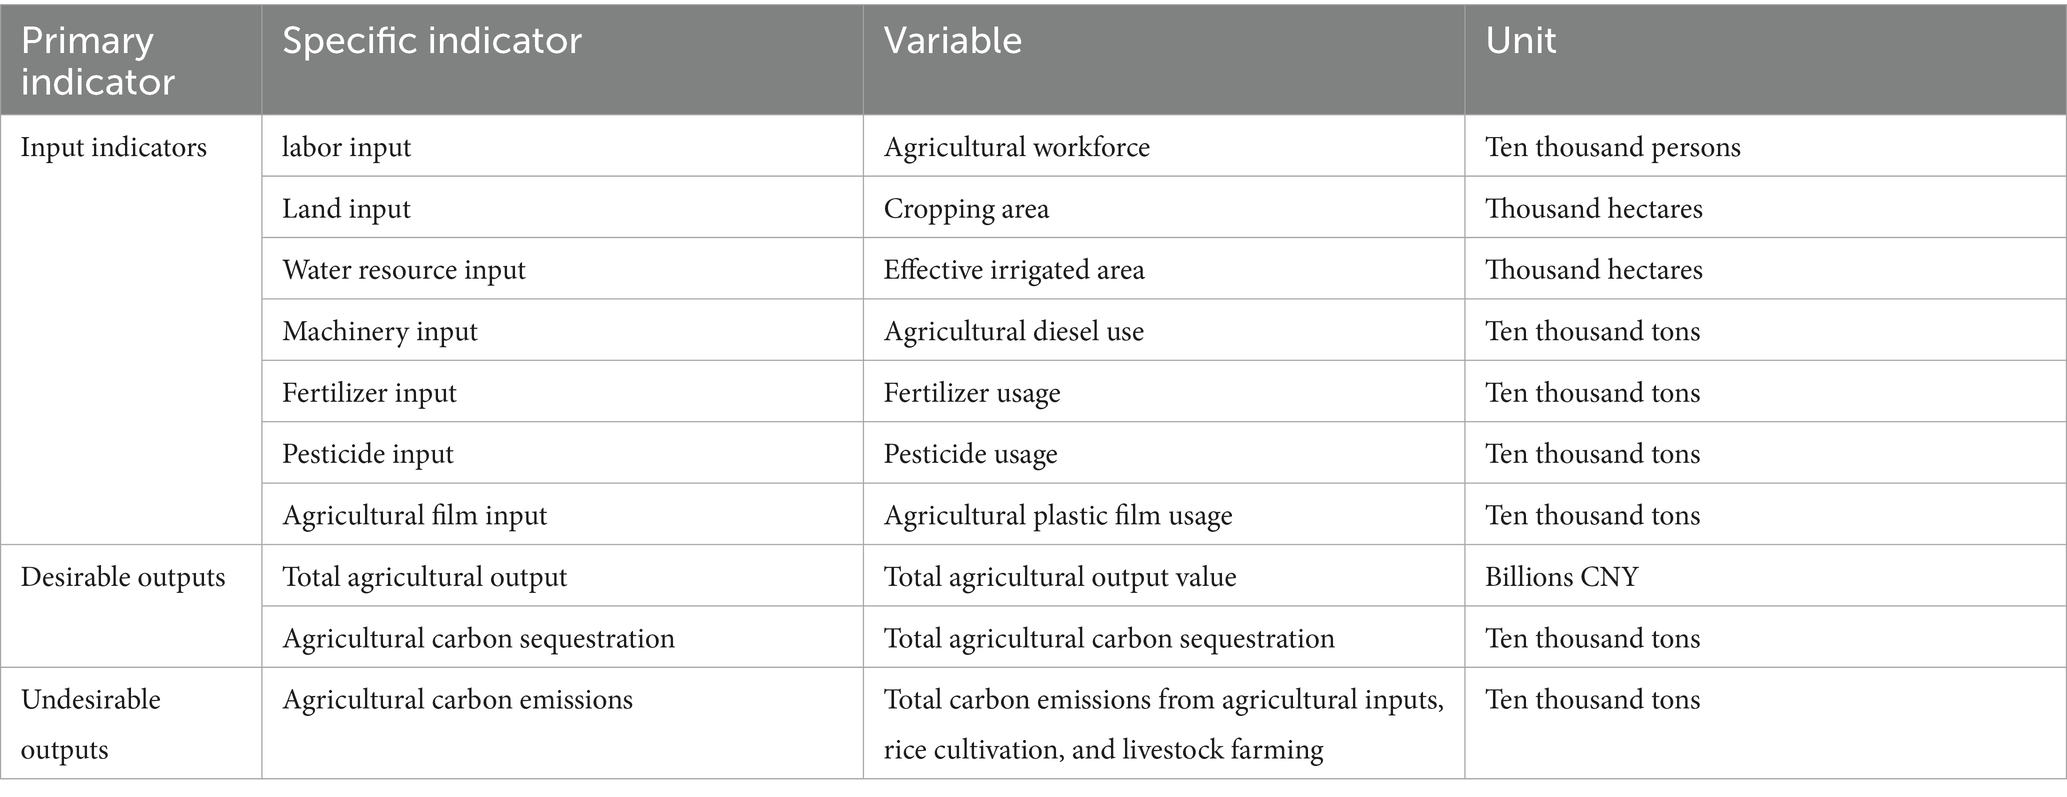
Table 1. Selection and explanation of variables.
In terms of input indicators, the labor force is the basis of agricultural production, characterized by the number of employees in the primary industry; land is the basis of agricultural production activities, characterized by the total sown area of crops; water resources is an important condition for agricultural production, characterized by the effective irrigated area; agricultural machinery is the main force of agricultural production, characterized by the total power of agricultural machinery; and agricultural means of production represent the potential pressure of the traditional agricultural high-input model on the environment. In the past few years, we have selected indicators of pesticide use, fertilizer application, agricultural plastic film use, and the total power of agricultural machinery to characterize the situation.
Desired Output Indicators include economic output and ecological output. The total agricultural output value shows how efficient agricultural production is economically, which is essential for agricultural development. The agricultural carbon sink indicates how agricultural production positively affects the environment, serving as a key measure for low-carbon agriculture. Non-desired output indicators refer to agricultural carbon emissions, which highlight the negative effects of agricultural production on the environment.
Non-desired output indicators include agricultural carbon emissions, which reflect the negative impact of agricultural production on the environment.
2.3.3 Analysis of the driving factors of AEE
2.3.3.1 Tobit mode
The Tobit model, also known as the restricted dependent variable model (Tobin, 1956), is a statistical model used to analyze binary dependent variables, which can flexibly accommodate various types of independent variables and has excellent interpretability for outliers and non-normally distributed data (Weiss and Zhu, 2025). In contrast, the least squares method to explore the relationship between AEE and external factors is prone to bias in parameter estimates (Xu et al., 2022). Considering the dynamic characteristics of ecological efficiency in the YEB, this study employs a Tobit regression analysis for panel data. The dependent variable in this model is the ecological efficiency value obtained through the Super-SBM model, which is a censored variable.
In the Equation 7: represents the dependent variable for the i-th observation, is the vector of independent variables for the i-th observation, is the vector of unknown parameters to be estimated, is the random error term, assumed to be independent and normally distributed.
2.3.3.2 Variable selection
The level of AEE is influenced not only by economic factors but also by agricultural production conditions and social factors, all of which play an increasingly important role in modern agricultural production. Based on existing research findings (Zhu and Cao, 2024) and practical data availability, this study categorizes the factors affecting AEE into the following eight aspects, as detailed in Table 2.
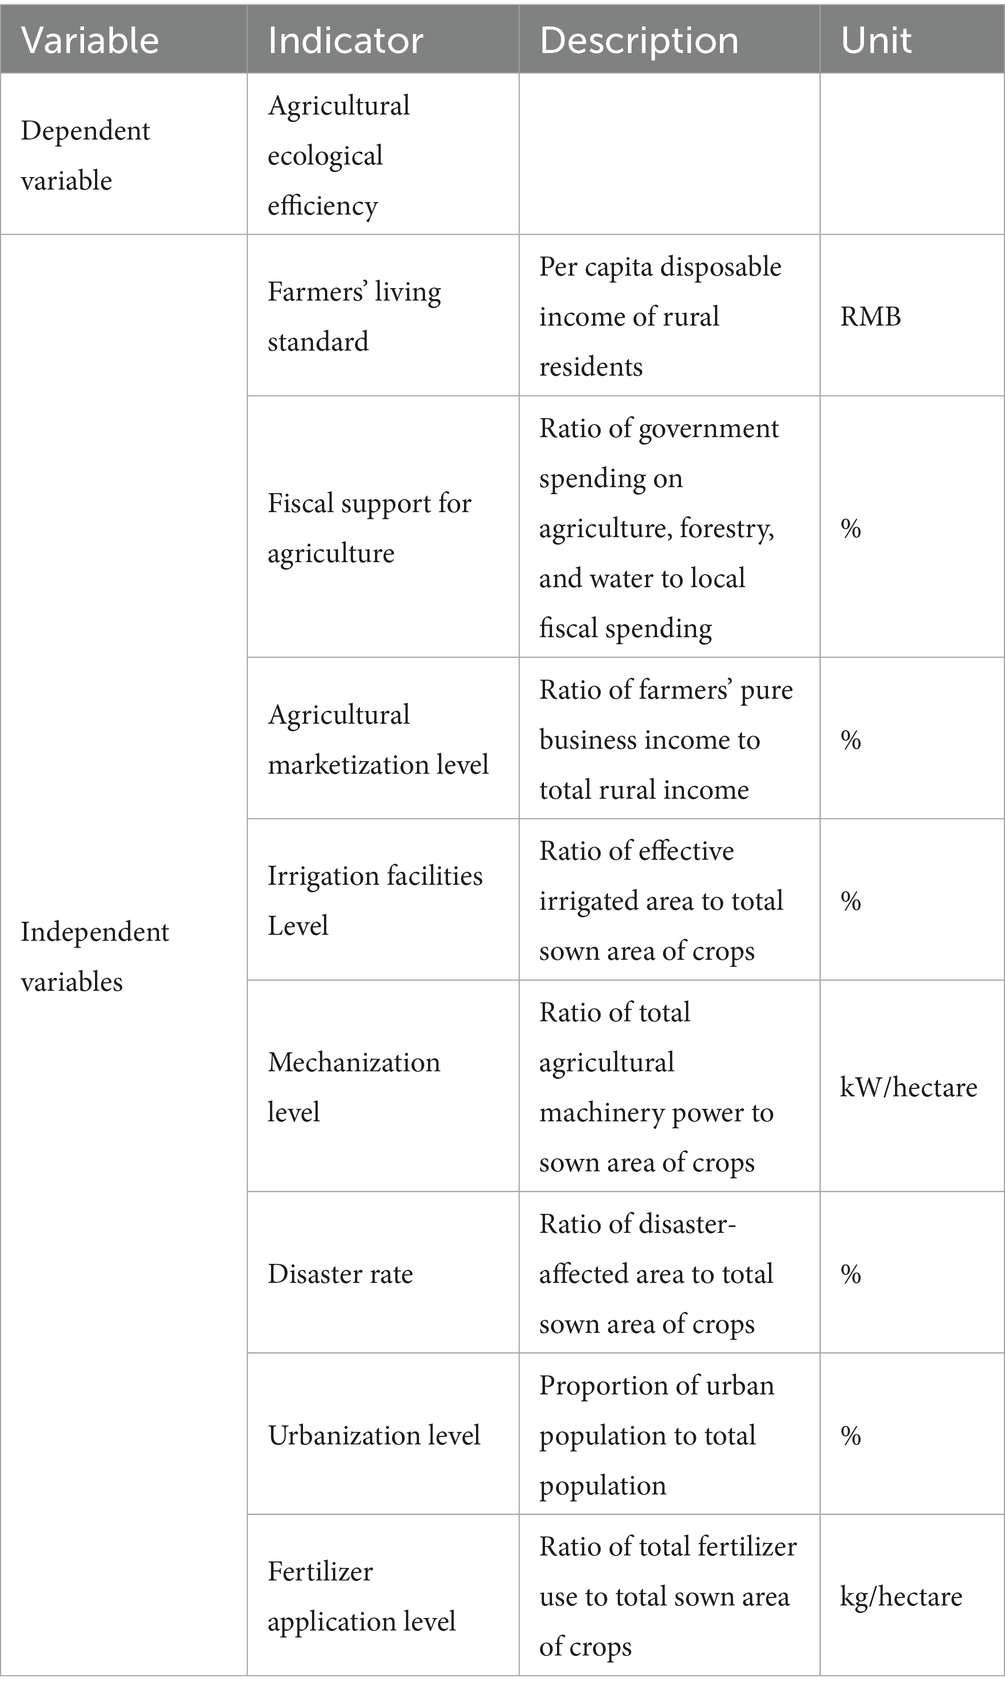
Table 2. Variables selected for the AEE analysis.
The living standard of farmers is measured by the per capita disposable income of rural residents, reflecting the incentive effect of the improvement of the economic level of agricultural practitioners on the behavior of green production. The level of financial support for agriculture is measured by the ratio of financial expenditure on agriculture, forestry and water to the ratio of local financial expenditure, which reflects the support of the government for low-carbon agriculture. The level of financial support for agriculture is measured by the ratio of financial expenditure on agriculture, forestry and water to local financial expenditure, reflecting the government’s support for low-carbon development in agriculture. The level of agricultural marketization shows how much farmers earn compared to rural income, which demonstrates how market changes affect growers. The level of water conservation in farmland looks at how much land is effectively irrigated compared to the total area planted with crops, showing how well water is used in farming; the level of agricultural mechanization compares the total power of farming machines to the area planted with crops, indicating how much mechanization affects farming efficiency. The disaster rate, which is the area affected by disasters compared to the area planted with crops, shows how natural disasters impact farming; the level of urbanization looks at the number of city residents compared to the total population, indicating how urban growth might affect farming efficiency; and the level of fertilizer application compares the total amount of fertilizers used to the area planted with crops, showing the environmental impact of farming inputs. The disaster rate, which is the ratio of the area affected by disasters to the area where crops are planted, shows how natural disasters affect farming; the level of urbanization, which is the percentage of people living in cities compared to the total population, indicates how urban and rural areas working together might influence agricultural efficiency. The level of fertilizer application, measured as the ratio of the total use of fertilizers to the total sown area of crops, reflects the environmental burden of resource inputs in agriculture.
3 Results and analysis
3.1 Results and analysis of agricultural carbon sources and sinks measurement in the YEB
Table 3 presents the total agricultural carbon sources, carbon sinks, and net carbon sink in the YEB from 2008 to 2023. Overall, the net carbon sink in the YEB remained positive during this period, indicating that agriculture in the region contributed to carbon sequestration. The development trend can be broadly divided into three stages:
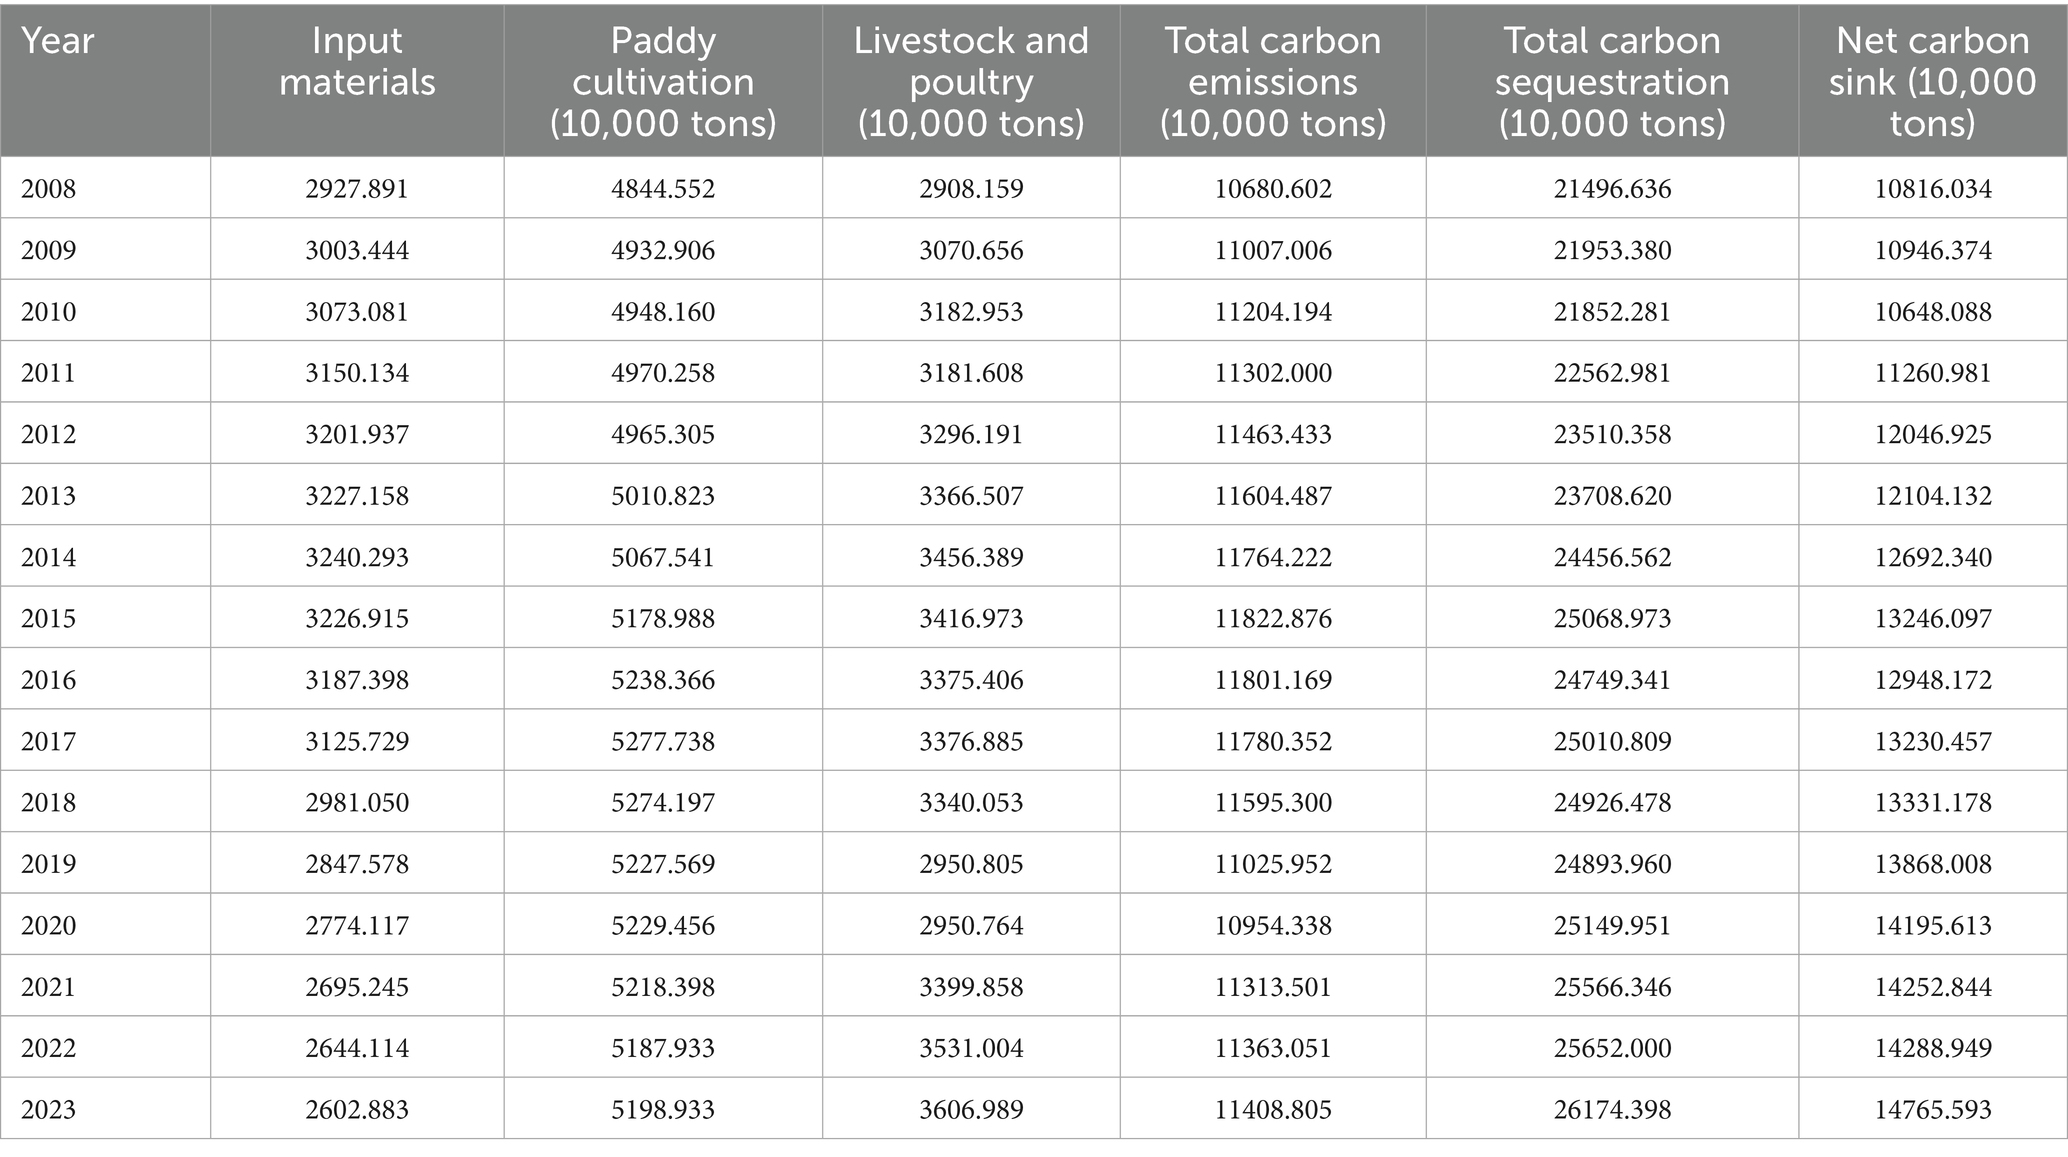
Table 3. Carbon emissions, carbon sequestration, and net carbon sink in the YEB (2008–2023).
First, the period from 2008 to 2015 marks a phase of sustained growth. The net agricultural carbon sink in the Yangtze River Economic Zone increased from 108.16 to 132.46 million tons, with an average annual increase of 2.29%. While agricultural carbon emissions remained constant during the study period, the net carbon sink increased primarily because of the growth in carbon sinks. The reason for this may be the large-scale use of agricultural mechanization, which improves the efficiency of agricultural production and increases the output of agricultural products, which in turn leads to an increase in carbon sinks.
Second, the period from 2016 to 2019 is characterized by fluctuating and gradual growth. During this period, the net agricultural carbon sink in the YEB showed a first decline and then a rise. Carbon emissions were cumulatively reduced by nearly 8 million tons during this phase, but the carbon sink declined in 2018 and 2019. This phenomenon is attributed to the country’s increasing emphasis on green development strategies and the introduction of stricter fertilizer reduction actions to promote agricultural cost savings and efficiency. The implementation of these policies has reduced carbon emissions on the one hand, but on the other hand, the reduction in the use of agricultural materials has led to a reduction in the level of crop yields, thus affecting the carbon sink.
Third, the period from 2020 to 2023 represents a phase of stable growth. During this period, the total agricultural carbon emissions and carbon sinks within the YEB show a steady increase, with a cumulative increase in net agricultural carbon sinks of 5.699 million tons. Looking specifically at carbon emissions, emissions from agricultural inputs and rice paddy cultivation have decreased, while carbon emissions from livestock farming have returned to the level before the outbreak of African swine fever. The reason for this shift is that the development of green agriculture has taken root in people’s hearts, and the transformation and development of low-carbon agriculture have achieved certain results, which, while reducing inputs of agricultural materials, have been able to promote the double enhancement of the yield and quality of agricultural products, further improving the carbon sink capacity of agriculture.
Overall, the net agricultural carbon sinks in the YEB exhibit a distribution pattern of high values on both ends and low values in the middle. From an interprovincial perspective, the total net agricultural carbon sinks in each province and city have shown an upward trend compared to the baseline period. Specifically, Jiangsu Province has the most significant growth in carbon sinks, from 17.395 million tons in 2008 to 26.038 million tons in 2023, with an increment of 8.463 million tons. The reason for this is that agricultural production in Jiangsu Province has shifted from “high inputs and high outputs” to “green and low carbon” and has improved soil carbon storage capacity through the promotion of green technologies such as returning straw to the fields, replacing chemical fertilizers with organic fertilizers, and no-tillage and minimum-tillage. With the support of large-scale planting and mechanization, agricultural output in Jiangsu Province has been rising, leading to an increase in the carbon sink from agricultural production. Meanwhile, the net carbon sinks of Anhui, Sichuan, Hubei, and Hunan are also at the forefront of the increase, with an increase of 8.445, 7.034, 5.838, and 3.669 million tons, respectively. By contrast, Shanghai and Zhejiang recorded the smallest growth in agricultural net carbon sinks. Shanghai, as one of China’s highly developed and modernized cities, has a relatively weak agricultural function, with limited farmland and smaller scales of both carbon emissions and sequestration. Particular attention should be paid to Zhejiang Province, which is regarded as a pilot area for China’s new era of common prosperity. Its agriculture has long been dominated by high value-added cash crops (e.g., tea, flowers, and vegetables in facilities) and large-scale aquaculture, and this type of production mode is significantly more dependent on chemical fertilizers, pesticides, and agricultural energy than traditional food crops. In addition, urbanization and industrialization have led to the encroachment of high-quality farmland on construction land, and agricultural production has been forced to shift to the ecologically fragile hills and mountains, resulting in high agricultural carbon emissions and low carbon sinks (Figure 2).
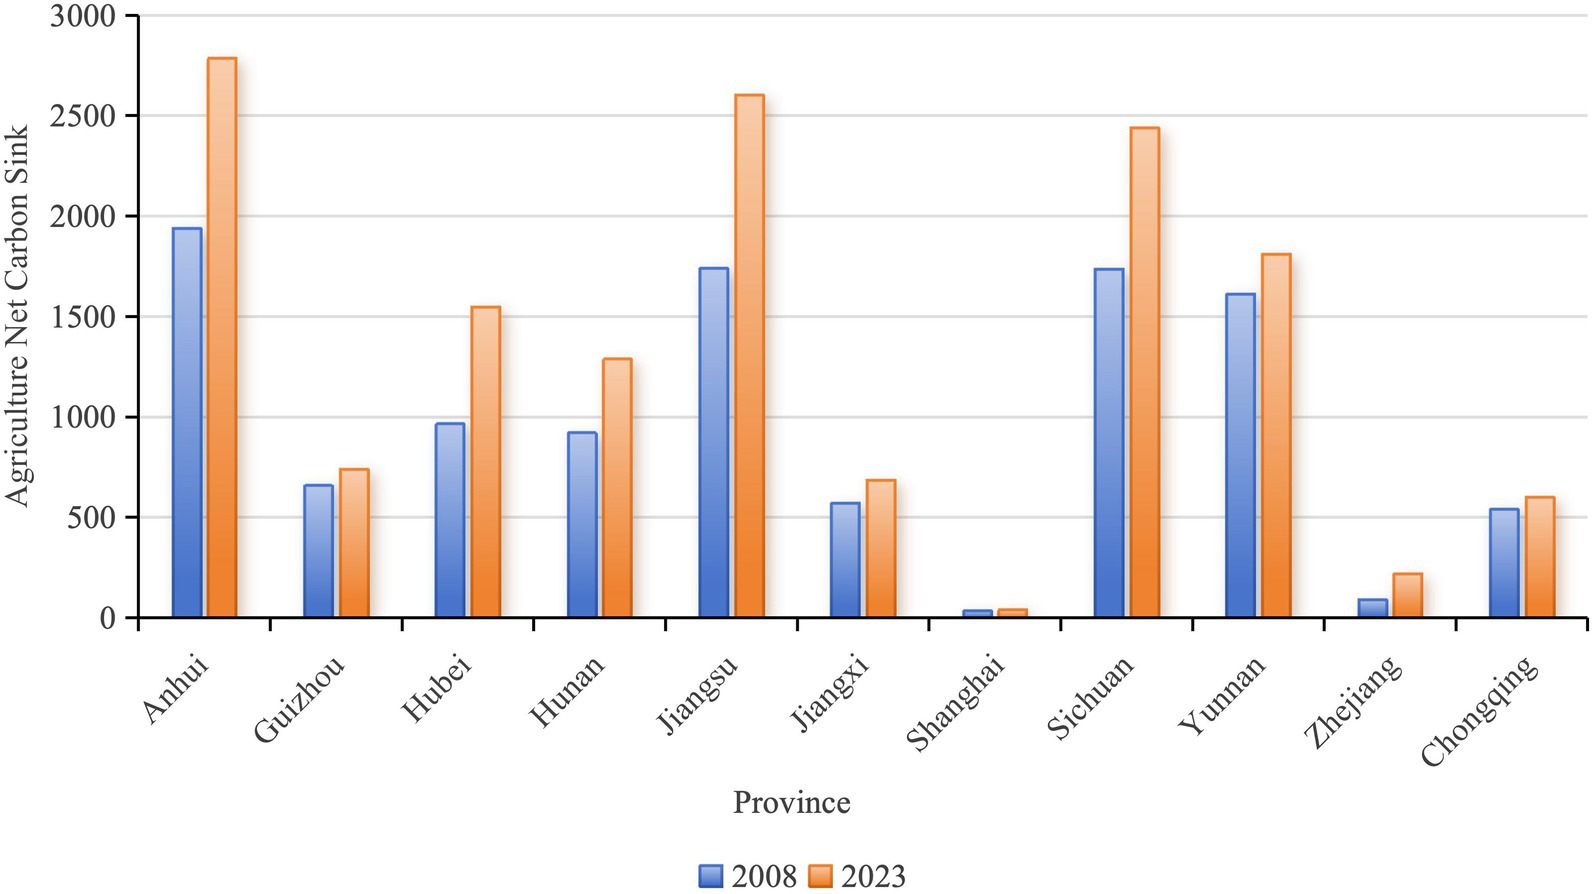
Figure 2. Comparison of net agricultural carbon sinks by province in 2008 and 2023.
From a temporal standpoint, the top three provinces in the YEB in 2023 concerning net carbon sequestration were Anhui, Jiangsu, and Sichuan, with net carbon sequestration values of 27.861, 26.038, and 24.398 million tons, respectively. The higher levels of agricultural carbon sequestration in these three provinces are largely due to their geographical characteristics, with most regions being in plains or basins that feature flat topography and extensive arable land. Additionally, the high level of mechanization and favorable crop yields in these regions enable effective absorption of CO2 generated during agricultural production. In contrast, Shanghai, Zhejiang, and Chongqing provinces had relatively lower agricultural net carbon sinks, with values of 0.399, 0.219, and 6.002 million tons, respectively. The cases of Shanghai and Zhejiang have already been discussed earlier, so further elaboration is unnecessary here. As for Chongqing, the agricultural net carbon sink is limited by topographical constraints. The arable land area in Jiangxi is relatively small and fragmented, making large-scale mechanized operations difficult. This results in higher agricultural input materials but lower crop yields, affecting the region’s overall agricultural net carbon sink. This analysis highlights the significant regional differences in agricultural net carbon sinks across the YEB, with clear variations in the rate of increase in net carbon sinks among different provinces and municipalities.
3.2 Research on the spatio-temporal evolution of AEE in the YEB
3.2.1 Impact of carbon source and carbon sink factors on AEE calculation results
This study, based on the assessment of agricultural carbon emissions and carbon sequestration, computes the AEE for the nine provinces and two municipalities within the YEB by considering them as individual decision-making units. To have a comprehensive view of the AEE of the YEB, we have calculated three different types of AEE: the traditional AEE, which only considers agricultural production; the low-carbon AEE, which additionally incorporates carbon sources; and the green AEE, which simultaneously considers both carbon sources and carbon sinks. It then systematically compares and analyzes the results of these three types of AEE. The results of these three types of AEE are then systematically compared and analyzed. It should be noted that the input indicators are consistent across the three AEE measures, with only the output indicators changing. Among them, the traditional AEE only sets the agricultural output value as the desired output; in the low-carbon AEE measurement, the agricultural output value is set as the desired output and the agricultural carbon emission is set as the non-desired output; and in the green AEE measurement, the agricultural output value and the agricultural carbon sinks are set as the desired outputs, and the agricultural carbon emission is set as the non-desired output.
The data presented in Figure 3 demonstrate that traditional AEE, low-carbon AEE, and green AEE all exhibited a consistent upward trend over time. During the study period, the average value of traditional AEE was 0.366. low-carbon AEE was 0.290, it is 20.765% lower than the AEE value of conventional agriculture. Green AEE was 0.772, nearly 1.355 times more eco-efficient than low-carbon agriculture. This indicates a clear ranking: green AEE is greater than traditional efficiency, which in turn is greater than low-carbon efficiency. If environmental factors are excluded from the AEE-Assessment, it could mislead relevant authorities in their decision-making processes regarding low-carbon agricultural development. Additionally, if environmental costs are considered in the evaluation of traditional AEE without accounting for carbon sink effects, it would fail to accurately assess the role of agriculture in reducing emissions and improving efficiency within the ecosystem. Such an outcome could lead to higher costs associated with carbon neutrality policies.
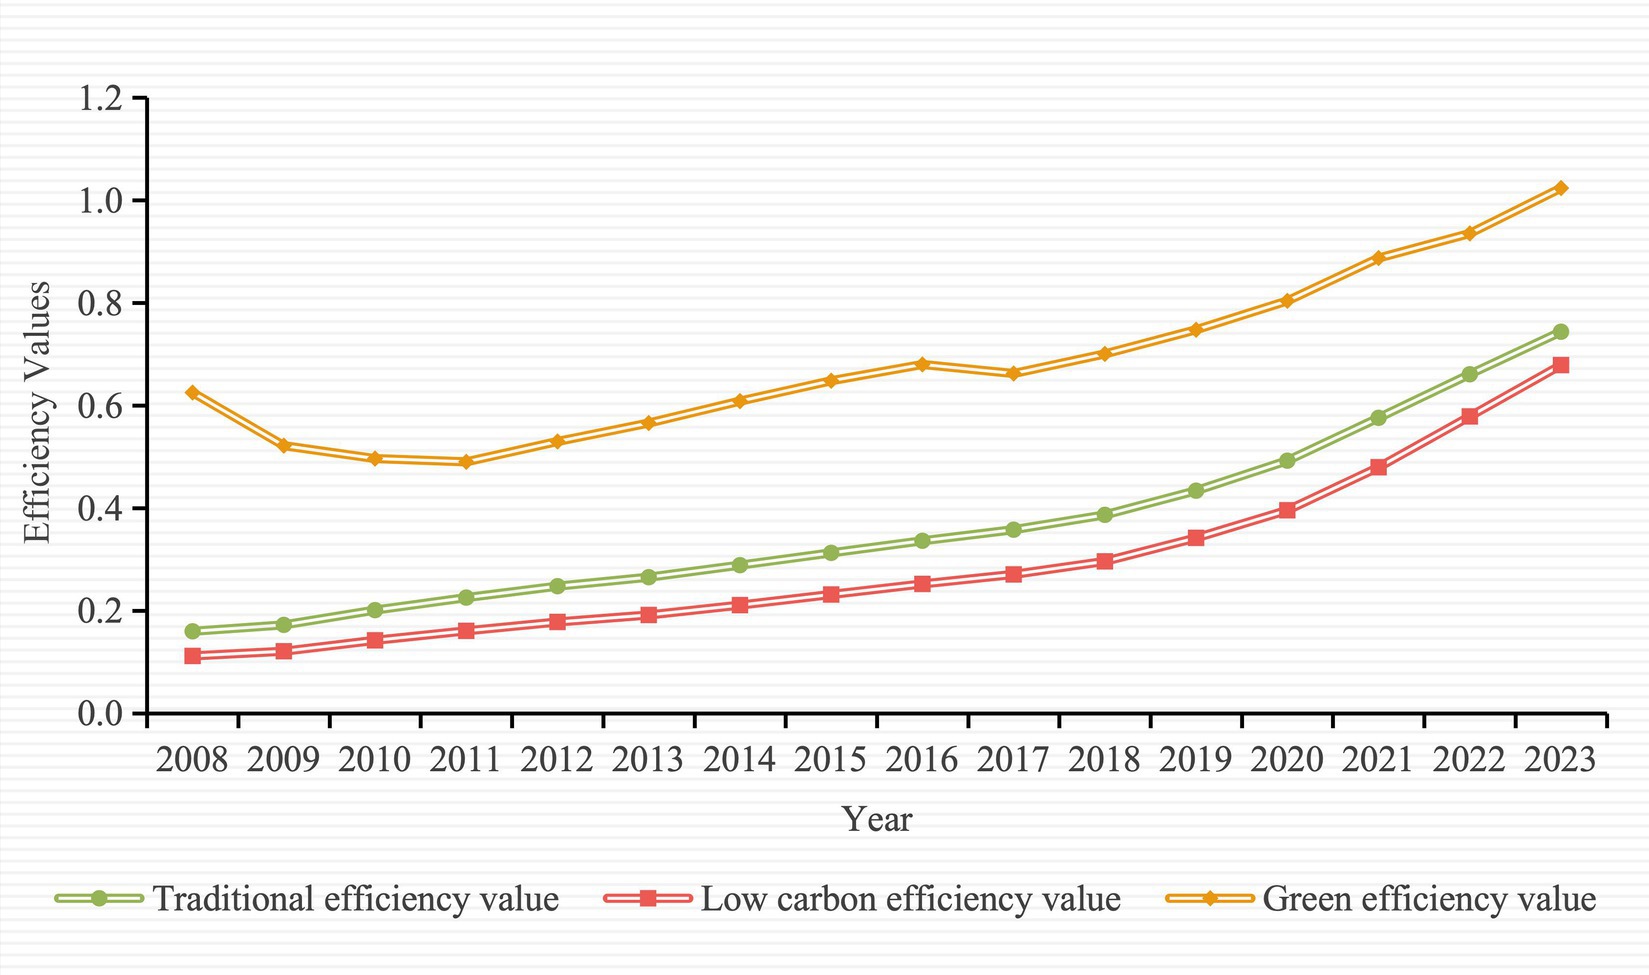
Figure 3. Comparative agro-ecological efficiency analysis of the Yangtze River Economic Belt.
Given that agriculture exhibits both carbon source and carbon sink characteristics, it is important to take into account both the negative impacts of carbon sources on AEE and the ecological benefits of carbon sinks. Particularly under the goals of carbon neutrality, integrating both carbon sources and carbon sinks into the evaluation of green AEE provides a more accurate representation of the true state of the agricultural ecosystem. This approach ensures that improvements in AEE are aligned with environmental protection objectives. Therefore, the subsequent sections of this study will further analyze and assess the green AEE (referred to as AEE).
3.2.2 Analysis of time evolution trend
From Figure 3, it can be seen that the YEB’s AEE shows a fluctuating upward trend in general, gradually increasing from 0.625 in 2008 to 1.024 in 2023, reflecting the YEB’s comprehensive enhancement of the green development of agriculture, eco-protection and resource utilization, which can be ambient in four stages. The first stage spans from 2008 to 2011, characterized by a high initial AEE that fluctuated and declined at the beginning. In this period, the efficiency value was 0.625 in 2008, indicating a high level; however, it continuously declined from 2009 to 2011, ultimately reaching a trough of 0.490 in 2011. The decline in AEE may be attributed to the faster development of traditional agricultural scale in the YEB during this stage, increased inputs of chemical fertilizers and pesticides, and the short-term pressure on the ecological environment that resulted from these factors. The second stage is 2012–2016, when AEE showed a gradual rebound. The efficiency value gradually rebounded from 0.530 in 2012 to 0.680 in 2016, with an average annual increase of about 5.2%. In this stage, the state began to pay attention to the protection of agricultural ecology, the policy shifted to “improve quality and efficiency,” and some regions began to promote the management of agricultural surface pollution, straw return to the field and other eco-agricultural measures, which alleviated the ecological pressure in the early stage. The third stage is 2017–2020; the AEE shows a trend of continuous growth. The efficiency value fell back slightly in 2017 (0.662) but entered a period of rapid growth after 2018, reaching 1.024 in 2023, an increase of 54.7% compared with 2017, of which the growth rate in 2020–2023 is especially obvious (average annual increase of about 8.8%). During this period, the YEB’s policy of “common protection” is deeply implemented, and the promotion of green agricultural technologies (such as organic fertilizer substitution, water-saving irrigation, and eco-cycling agriculture) is accelerated, which promotes the significant improvement of AEE.
3.2.3 Analysis of spatial evolution trend
To reveal the spatial distribution characteristics of AEE in the YEB, this study classifies AEE into five grades: low, low average, average, high average and high. 2008, 2016, and 2023 are selected as sample years for the analysis (Table 4).
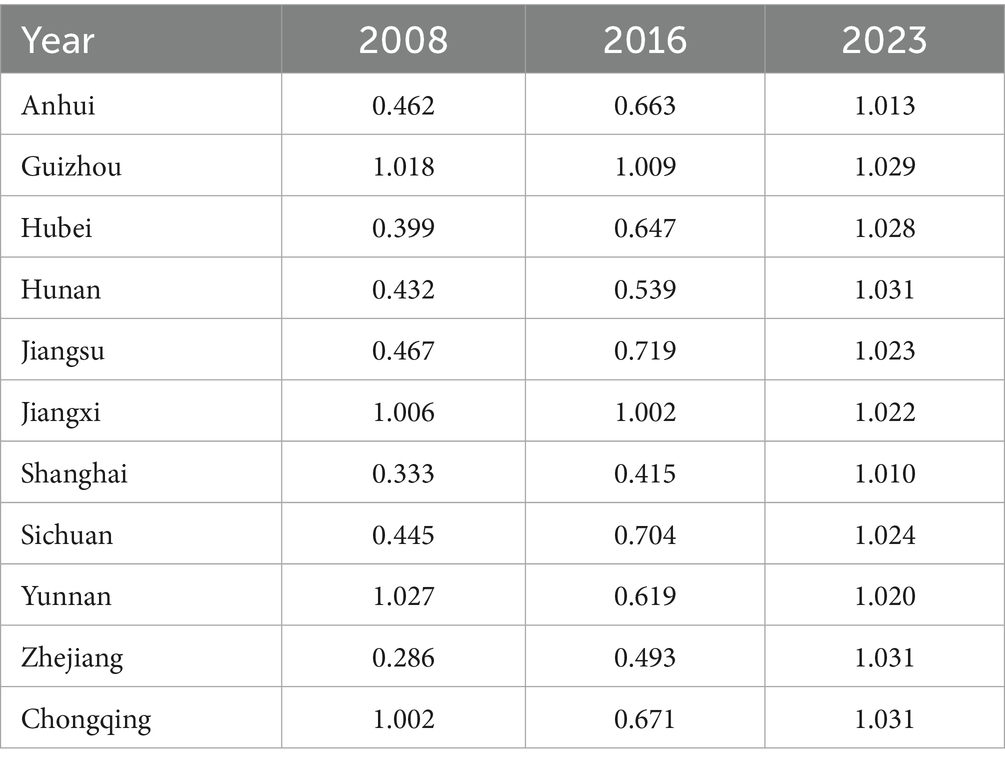
Table 4. Distribution of agro-ecological efficiency by provinces in the Yangtze River Economic Belt, 2008, 2016 and 2023.
In 2008, the spatial differentiation of AEE in the YEB was obvious. Provinces in the high-efficiency class include Guizhou, Jiangxi, Yunnan, and Chongqing, whose efficiency values are all over 1.000, showing that these regions have a pioneering advantage in the synergistic development of agricultural production and ecological protection; Anhui, Jiangsu, Hunan, and Sichuan provinces are in the average efficiency value, indicating that their AEE is yet to be improved; and the efficiency values of Hubei, Shanghai, and Zhejiang are lower, with the efficiency value of Zhejiang being only 0.286, reflecting that these regions have certain shortcomings in their agro-ecological development model. By 2016, the AEE of most provinces had realized a significant leap. Provinces like Anhui, Hubei, Jiangsu, Sichuan, and Yunnan have transitioned from average to higher grades, indicating that the YEB’s agro-ecological transformation is starting to yield positive results. However, Shanghai is still at the average level with an efficiency value of 0.415, and Zhejiang and Hunan have improved their efficiency to the average range, but their efficiency values have not yet exceeded 0.6, indicating that agro-ecological optimization in these regions still faces challenges. In 2023, the AEE pattern of the YEB undergoes a fundamental transformation. All provinces reach a high level of efficiency, with the efficiency value of Zhejiang jumping from 0.286 in 2008 to 1.031, and that of Shanghai from 0.333 to 1.010, realizing a leapfrog development from a lower to a higher level. This change confirms that agricultural production in the YEB, driven by agro-ecological protection policies, has comprehensively moved toward the green and efficient stage and that the spatial differences in AEE within the region have significantly narrowed, with a synergistic development trend gradually taking shape.
Looking specifically at the three regions of the YEB (Table 5), the AEE of the upper reaches of the YEB as a whole has shown a sustained and rapid growth, with an average value of 0.770. The reason for the upward trend is that the demand for agricultural materials during crop production is low due to favorable natural conditions, and there is less pollution in the agricultural sector. At the same time, the development of specialty agriculture in accordance with local conditions provides favorable conditions for ecological agricultural production. In addition, the efficiency value reaches 1.026 in 2023, surpassing that of downstream industries, which highlights the key role of ecological protection and the integration of specialty industries in the green transformation of agriculture. The average value of AEE in the middle reaches of the YEB is 0.672, showing a decreasing and then increasing trend during the examination period. As China’s major grain production area, the region has seen a decline in arable land fertility, leading to a greater reliance on farm inputs to ensure agricultural production, resulting in the level of eco-agricultural production being maintained at a low level. With the implementation of the 2020 Yangtze River Protection Law and the establishment of a cross-provincial eco-compensation mechanism, the midstream provinces are actively drawing on the advanced experience of sister provinces to optimize the structure of agricultural production and promote the mechanization, scaling and digitization of agricultural operations in accordance with local conditions, which is promoting the transformation of agricultural production to low-carbon and significantly improving the efficiency of agro-ecology. In contrast, the lower YEB has a lower level of AEE, with a mean value of 0.606, reflecting the challenges of synergistic development of agricultural production and ecological environment protection in the region. Although the downstream region has certain advantages in the application of agricultural science and technology and infrastructure construction, the overall efficiency of the agro-ecological system has not been fully released due to the accelerated process of urbanization and industrialization, the scarcity of land resources, and the need to improve the efficiency of resource utilization. As the State prioritizes the ecological environment, the downstream provinces have gradually improved their AEE by optimizing agricultural production methods, enhancing the promotion of eco-agricultural technologies, and advancing green agricultural development, resulting in a narrowing gap with the upstream and midstream regions.
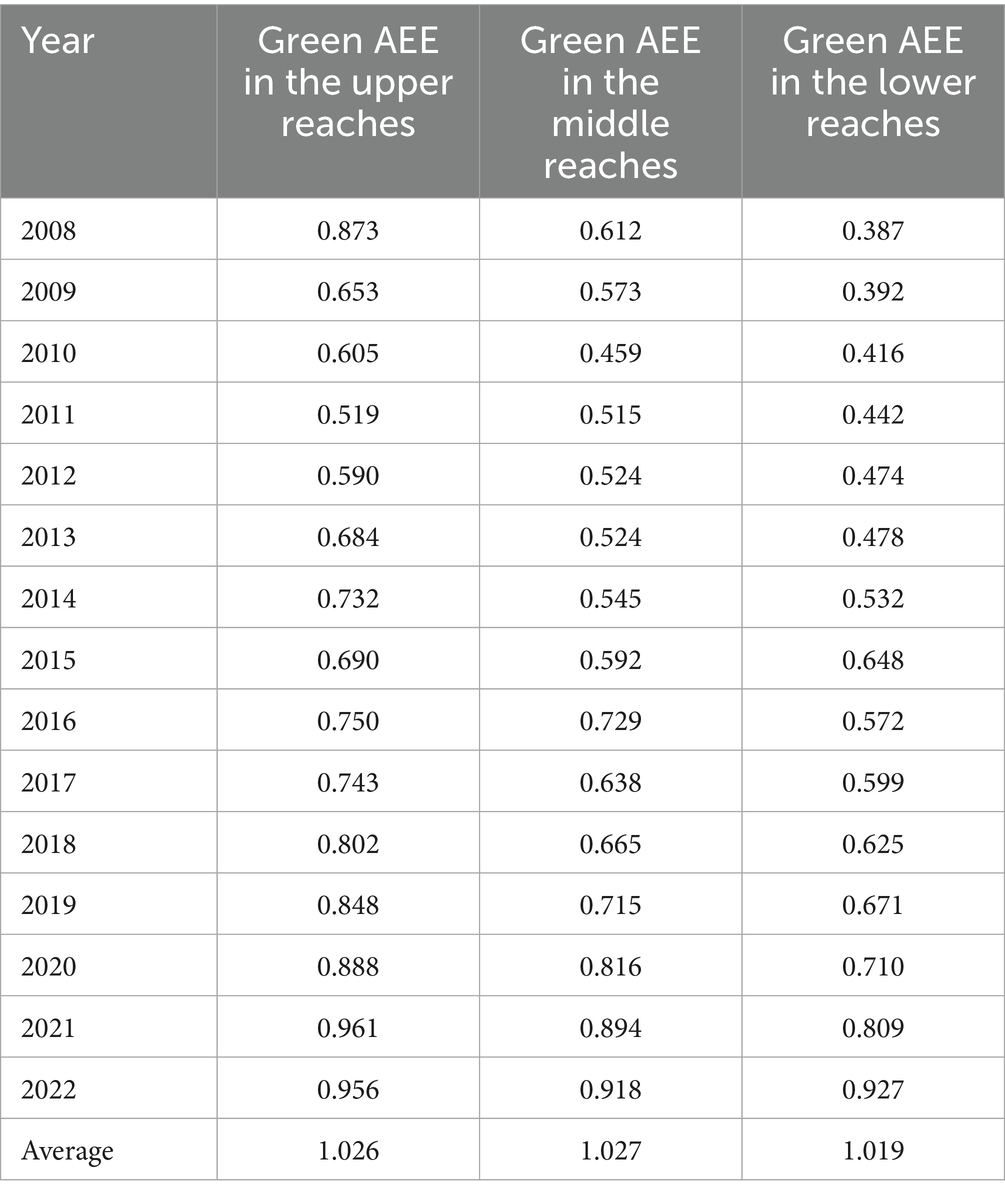
Table 5. Changes in agricultural ecological efficiency in the Yangtze River Economic Belt and its comparison.
3.2.4 Provincial categories and changes in AEE in the YEB
To understand the changing relationship between AEE and the ratio of carbon sinks and sources in provinces and municipalities of the YEB, examine type distribution of 9 Provinces and 2 Municipalities in the YEB, 2008–2023, and due to the limitation of space, only the scatter plots of the distribution of nine provinces and two municipalities directly under the central government in the YEB in 2008, 2012, 2016, 2020 and 2023 scenarios are shown (Figure 4). According to the methodology outlined by Zhu and Cao (2024), the 11 provinces and regions in the YEB were categorized into four groups based on their carbon sink-to-source ratio and AEE values. The classification included high surplus-efficiency zone, high surplus-inefficiency zone, low surplus-efficiency zone, and low surplus-inefficiency zone, with specific thresholds set at a carbon sink-to-source ratio of 2.5 and an AEE value of 0.6.
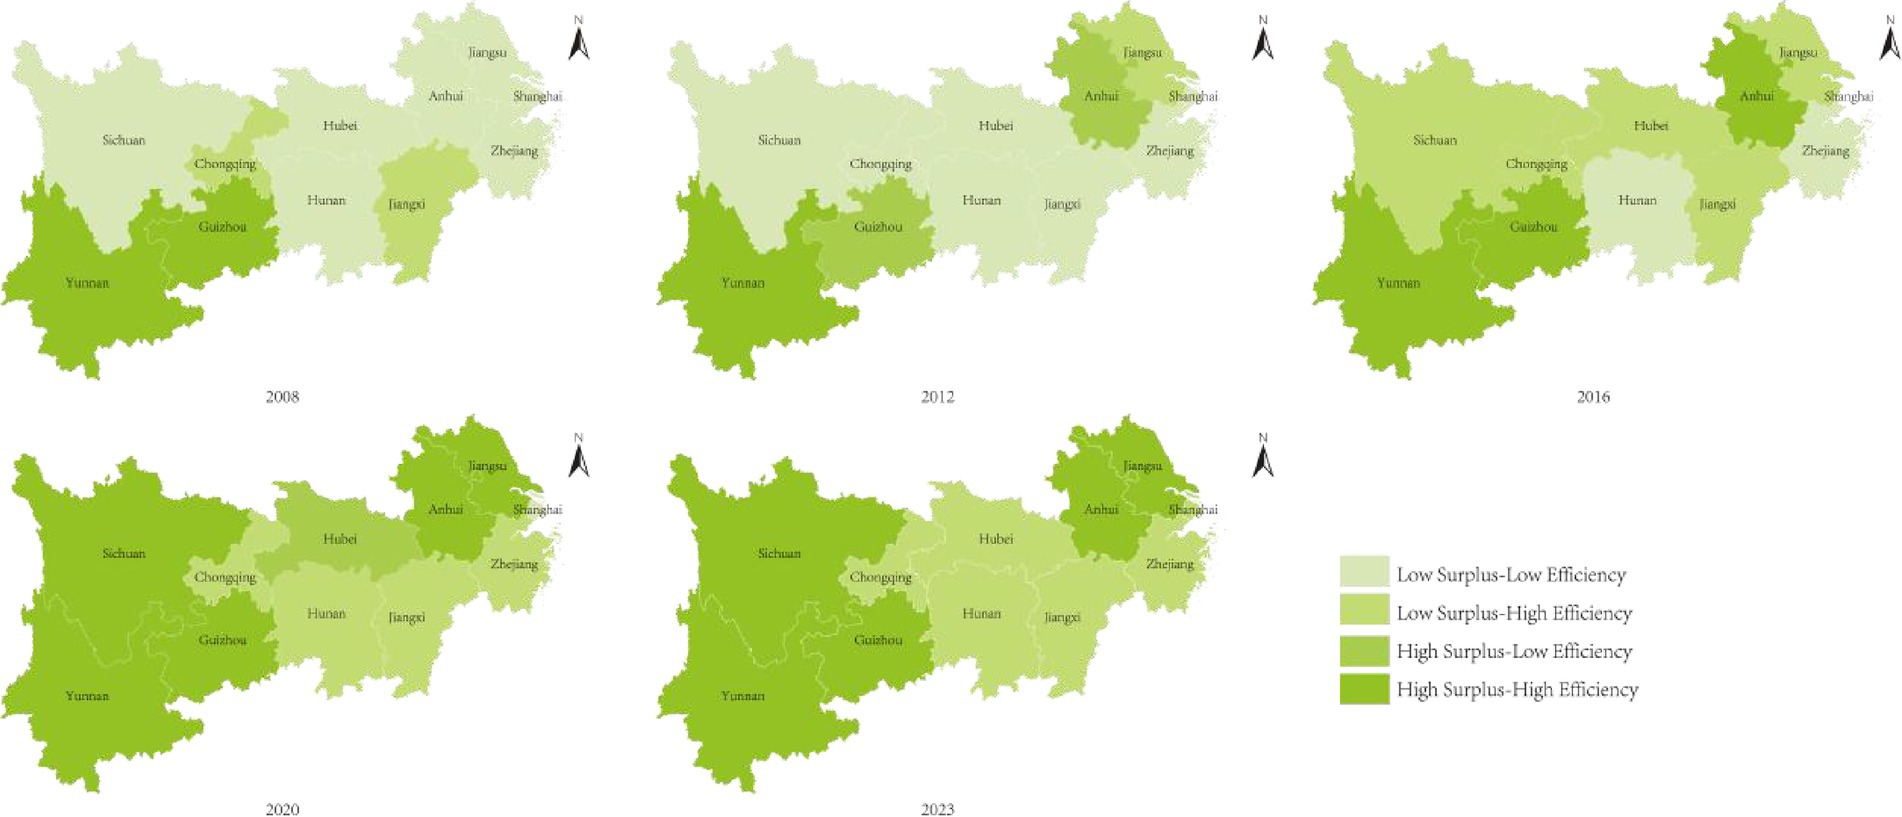
Figure 4. Distribution of provincial agro-ecological efficiency in the Yangtze River Economic Belt.
Firstly, high surplus-efficiency zone. The overall characteristic of provinces in the “double-high” agglomeration area is that agricultural carbon sinks are higher than carbon sources, with a high surplus capacity of carbon sinks and high AEE. From the figure, it is easy to find that in 2008 and 2012, there were two provinces (Guizhou and Yunnan) and one province (Yunnan) in the cluster; in 2016, there were three provinces in the cluster: Anhui, Guizhou and Yunnan; and in 2020 and 2023, a total of five provinces and municipalities directly under the central government, including Anhui, Guizhou, Jiangsu, Sichuan and Yunnan, will be in the agro-ecological direction of the region. This also shows that with economic and social development, the agricultural production in the provinces and municipalities of the YEB has continued to improve quality and efficiency; the surplus capacity of carbon sinks has been sufficiently improved; and the AEE has been strengthened.
Second, high surplus and low efficiency zone. The overall characteristic of provinces in the “high and low” agglomeration area is that the agricultural carbon sink is higher than the carbon source, but the AEE is lower. The chart shows that only three provinces were in this cluster during the study period: Anhui and Guizhou in 2012 and Hubei in 2020. The chart also shows that the overall AEE of the YEB is getting better and better.
Third, low-surplus, high-efficiency zones. Provinces in the “high and low” cluster are generally characterized by agricultural carbon sinks that are lower than carbon sources, with insufficient surplus capacity but relatively high AEE. The figure shows that there are more provinces in this zone during the survey period, jumping from two provinces and municipalities (Jiangxi and Chongqing) in 2008 to six provinces and municipalities (Hubei, Hunan, Jiangxi, Shanghai, Zhejiang, and Chongqing) in 2023, and most of the provinces have shifted from the “double-low” zone to this zone, realizing the improvement of AEE.
Fourth, low-surplus, low-efficiency zones. Provinces in the “double-low” agglomeration area are generally characterized by agricultural carbon sinks that are lower than carbon sources, insufficient carbon surplus capacity and low AEE. During the study period, the number of provinces in this cluster has been decreasing, from 7 provinces (Anhui, Hubei, Hunan, Jiangsu, Shanghai, Sichuan and Zhejiang) in 2008 to none in 2023, which indicates that the transformation of the agricultural production model in the region has been effective and the AEE has been improving.
In summary, in 2008, the YEB included a larger number of provinces located in both the low-surplus, high-efficiency zone and the low-surplus, low-efficiency zone. And by 2023, the proportion of provinces in the high-surplus, high-efficiency zone increased, while those in the low-surplus, low-efficiency zone had shifted into the low-surplus, high-efficiency zone. No provinces remained in the high-surplus, low-efficiency, or low-surplus, low-efficiency zones. It can be seen that the agricultural production of the provinces in the YEB has changed from low to high efficiency.
3.3 Analysis of the driving factors of AEE in the YEB
In this section, the driving factors that influence AEE across provinces in the YEB were analyzed using Stata software. The results of this analysis are presented in Table 5, showcasing the factors and their impact on AEE within the region. Conversely, the living standard of farmers, the level of financial support for agriculture, the level of agricultural marketization, and the level of urbanization will have a significant positive impact on the value of AEE; the level of mechanization and the disaster rate will have a significant negative impact on the value of AEE. The level of farmland water conservancy facilities and the level of fertilizer application do not affect the value of AEE (Table 6).
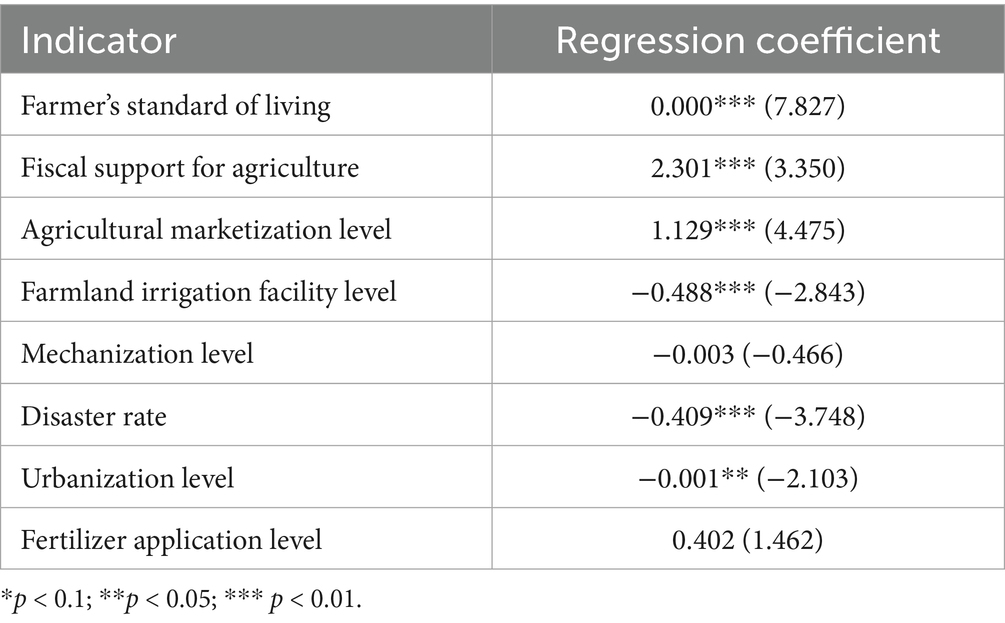
Table 6. Tobit model estimation results.
First, the living standard of farmers is significant at the 1% level, and the coefficient of the variable is positive. Economic development and the continuous improvement of the industrial base have largely contributed to the transformation and development of the agricultural economy in the YEB, and the continuous expansion of the scale of planting and breeding by farmers has made them very profitable. At the same time, the strong growth of market demand further promotes the prosperity of the agricultural sector; therefore, farmers will continue to improve green production technologies (such as drip irrigation and organic fertilizer substitution) to expand yields and enhance the quality of agricultural products, which will increase their business income and facilitate the transition of agricultural production from a “production-oriented” approach to one focused on “quality and efficiency.” Increase efficiency “transformation of agricultural production from” production-oriented “to” quality-enhancing.”
Second, the level of financial support to agriculture has a significant positive impact on the AEE of the YEB at the 1% significance level. The increase of government financial investment directly promotes the upgrading of water conservation systems for farmland, agricultural surface pollution control, and the smooth implementation of ecological compensation programs. Through the construction of ecological ditches, the promotion of resource utilization of livestock and poultry waste and the return of farmland to forests and grasslands, the YEB has gradually formed a virtuous cycle of “policy inputs-ecological improvement,” which has strongly promoted the improvement of AEE.
Third, the level of agricultural marketization is significant at the 1% level with a positive coefficient of the variable. It indicates that as the level of agricultural marketization increases, it has a promoting effect on AEE. In the context of the new era, the improvement of people’s living standards greatly stimulates the demand for green agricultural products. At the same time, the high value-addedness of green agricultural products also promotes the transformation of energy-intensive agriculture to a green and low-carbon direction (e.g., soil fertilization to maintain the quality of arable land), forming a self-driven mechanism of “economic dependence-ecological protection,” which promotes the AEE to be significantly improved.
Fourth, the level of water conservation facilities for farmland is significant at 1% level, and the coefficient of the variable is negative. This result reveals that there is an inverse relationship between the level of farmland water conservancy facilities and AEE, which is contrary to traditional research. It is generally believed that effective water conservation systems for farmland can improve water resource utilization and enhance agriculture’s ability to withstand natural disasters. However, in-depth analysis reveals that the current construction of on-farm water conservancy facilities is still mainly aimed at ensuring stable and increased agricultural production, especially in the middle reaches of the rice-growing provinces, which overly rely on the big water irrigation system, resulting in the waste of water resources and the aggravation of the problem of soil salinization. In addition, the construction of some old water conservancy facilities has not fully taken into account the need for ecological protection, resulting in a weakening of the ecosystem’s ability to repair itself.
Fifth, the damage rate has a negative impact on the AEE of the YEB at the 1% significance level. The reason for these findings is that agricultural production is greatly affected by natural climatic conditions, such as floods, droughts and other natural disasters that directly damage farmland ecosystems, leading to soil erosion and loss of organic matter from arable land, which in turn have a huge impact on crop growth and yield. In addition, post-disaster replanting and pesticide misuse exacerbate the ecological load, limiting the function of agricultural carbon sinks and thus reducing AEE.
Sixth, the level of urbanization is significant at the 5% level with negative coefficients of the variables. This result indicates that the increase of urbanization level has a certain counter effect on AEE. The increase in urbanization level is often accompanied by the transfer of rural labor to cities and towns, which leads to a structural shortage of labor in agricultural production and the phenomenon of abandonment of arable land or rough management in some areas, which in turn affects the effective implementation of agroecological management measures. At the same time, the expansion of cities and towns may encroach on high-quality arable land, forcing agricultural production to move to ecologically fragile areas and increasing the difficulty of ecological protection. In addition, industrial pollution and domestic sewage generated during urbanization, if not properly handled, may spread to the surrounding agricultural areas, exacerbating agricultural surface pollution and further restricting the improvement of AEE.
Seventh, the level of mechanization did not pass the significance test, indicating that there is no stable relationship between it and AEE. This outcome stems from the dual nature of mechanization in agricultural production. On the one hand, increasing the level of mechanization has significant economic and ecological benefits. That is to say, it can effectively reduce labor costs and significantly increase labor productivity, thus promoting the green production efficiency of agriculture. However, on the other hand, agricultural mechanization relies on fossil energy and generates a large amount of carbon emissions, which has a negative impact on AEE. In addition, regional differences further blur the association between mechanization and AEE, e.g., Jiangsu has popularized low-carbon farm machinery and precision operation technology, while the middle and upper provinces are still dominated by traditional fuel-fired farm machinery. This regional heterogeneity leads to insignificant overall regression results.
Eighth, the level of fertilizer application did not pass the significance test, implying that it did not show a stable association with AEE. On the one hand, rational application of fertilizer can provide sufficient nutrients for crop growth and significantly increase crop yield. As an important agricultural production area in China, the YEB’s, chemical fertilizer application has increased the yield per unit area to a certain extent and guaranteed China’s food security; however, excessive application of chemical fertilizer will lead to soil crusting and acidification, reduce soil fertility, and affect the balance of the soil ecosystem. At the same time, fertilizers not absorbed by crops will be washed into water bodies with rainwater, triggering environmental problems such as eutrophication of water bodies. The combined effect of the two ultimately makes the overall regression results insignificant.
4 Discussion and future research
4.1 Discussion
In the measurement of agricultural carbon sources and sinks, it was found that the net agricultural carbon sink in the Yangtze River Economic Zone showed a three-stage evolution of “continuous increase, fluctuating increase, and stable increase” during the study period, which echoes and expands on the findings of existing studies. For example, Zhang et al. (2022) pointed out that China’s AEE is driven by technological progress, and in this study, the popularization of mechanization promoted the increase of yields and hence carbon sinks, which confirms the positive role of technological factors. In addition, the present study further verifies that Jiangsu Province achieved a significant reduction in carbon emissions through the development of low-carbon production technologies, resulting in a significant increase in carbon sinks (Xiong et al., 2020), while Zhejiang and Shanghai lagged behind due to the contradiction between resource scarcity and economic development (Jing et al., 2022).
In the measurement of AEE, the classification of traditional, low-carbon and green AEE adopted in this study shows that the green AEE is significantly higher than the low-carbon AEE and the traditional AEE, which echoes Zhu and Cao (2024) conclusions about the efficiency of carbon sinks. In terms of temporal evolution trend, the AEE is basically consistent with Cui et al. (2022) study on the green development of agriculture in the YEB, which indicates that policy-driven (e.g., the post-2016 strategy of “grasping the maximum protection”) is the core driving force for the improvement of efficiency. In terms of spatial characteristics, AEE in upstream provinces such as Guizhou and Yunnan was at a high level in 2008, which is at variance with the finding that efficiency in downstream areas generally led in previous studies (Jin B. et al., 2024; Jin G. et al., 2024). This variance may stem from the inclusion of the carbon sink factor in this study—the upstream provinces rely on rich forest and grassland resources to develop eco-agriculture, and their carbon sink capacity significantly supports AEE (Wang and Liu, 2023). The downstream provinces, on the other hand, have high carbon emission intensity mainly due to high value-added agricultural patterns, which complements Cai and Li (2024) suggestion that industrial structure affects AEE. In addition, this study divides the provinces by the “carbon sink-source ratio” and finds that all the provinces are out of the “low-surplus, low-efficiency zone” in 2023, which indicates that the synergistic management policy of the YEB is effective in achieving balanced development in the region. This study indicates that the policy of coordinated governance of the YEB is effective in balanced regional development.
In terms of influencing factors, this study found that the living standard of farmers, the level of financial support for agriculture, and the level of agricultural marketization have a significant positive effect on the improvement of AEE, a result similar to the findings of Li et al. (2022), which suggests that governmental inputs and the market mechanism are the key to promoting the coordinated development of agricultural economy and ecology. The level of farmland water conservancy facilities, the disaster rate, and the level of fertilizer application will have a significant negative impact on the value of AEE. It is noteworthy that the increase in the level of urbanization has a significant negative impact on AEE, which is inconsistent with existing studies (Jin B. et al., 2024; Jin G. et al., 2024). This discrepancy may stem from the superimposed effect of fragmentation of arable land and loss of agricultural labor in the urbanization process in the middle and upper reaches of the YEB.
4.2 Limitations and future research
Although this study provides a useful reference for the study of AEE in the YEB, certain limitations still exist. (1) Due to the availability of data collection, this study only accounts for carbon sinks from crop photosynthesis and temporarily does not include soil carbon pools, forestry carbon sinks, and other carbon sequestration contributions of agroecosystems, which may underestimate the overall carbon sink capacity of agriculture. (2) This study is mainly based on provincial panel data and fails to capture the spatial heterogeneity fully at the city and county scales. (3) The model does not incorporate the impacts of exogenous shocks such as climate change and international agricultural market fluctuations, whose short-term perturbations and long-term impacts on AEE need to be specifically assessed.
In the future, the research team will deepen the field of agricultural low-carbon research and further expand the research content. (1) In the future, the research team will collect more information and data from all aspects and further construct an ideal system for assessing carbon emissions. (2) In the future, the research team will construct a “region-province-city-county” analysis framework and explore the AEE of different regions by combining more detailed regional data and spatial measurement models. (3) In the future, climate change indicators and international shock data will be introduced to further analyze the short-term disturbances and long-term impacts of exogenous shocks on AEE. It is expected that, through further research and policy implementation, the AEE of the YEB will achieve a higher level of improvement, providing a model for the green and low-carbon transformation of agriculture in China and around the world.
5 Conclusion and recommendations
5.1 Conclusion
This study conducted an in-depth assessment of the level of Agricultural Energy Efficiency (AEE) in the YEB from 2008 to 2023, utilizing panel data from provinces and cities, along with the super-efficiency SBM model and the Tobit model to measure agricultural carbon sources and sinks. The conclusions of the study are as follows:
(1) The net agricultural carbon sink of the YEB in general presents a three-stage evolution characteristic of continuous rise, fluctuating rise, and stable rise, increasing from 108.160 million tons in 2008 to 147.656 million tons in 2023. Spatially, Jiangsu has the largest increase in net carbon sinks (8.463 million tons) during the study period, while Shanghai (0.399 million tons) and Zhejiang (2.190 million tons) have low net carbon sinks due to the scarcity of arable land and the high-carbon agricultural model.
(2) Through the calculation, it is further verified that only by considering agricultural carbon sources and sinks at the same time can the regional AEE be reasonably measured, and the regional AEE can be more fairly and reasonably reflected. In time, the evolution of AEE goes through the stage of “fluctuating decline-driven rebound-rapid growth,” and AEE accelerates after 2020. Spatially, AEE has shifted from “leading in the upstream and diverging in the middle and lower reaches” to “high efficiency in the whole region,” with regional differences significantly narrowed. In terms of the type of AEE, in 2008, provinces and municipalities were mainly clustered in low-surplus low-efficiency zones, low-surplus high-efficiency zones, and high-surplus low-efficiency zones, whereas in 2023, provinces and municipalities will mainly be clustered in high-surplus high-efficiency zones and low-surplus high-efficiency zones, which indicates that agriculture in the YEB is accounted for both Ecological and economic benefits in the process of promoting green transformation.
(3) In terms of influencing factors, the living standard of farmers, the level of financial support for agriculture, and the level of agricultural marketization will have a facilitating effect on the improvement of AEE; the level of farmland water conservancy facilities, the rate of disaster, and the level of urbanization will have a hindering effect on the improvement of AEE. The level of mechanization and the level of fertilizer application will not impact the value of AEE.
5.2 Recommendations
Firstly, optimize the structure of agricultural production factors and promote low-carbon inputs and technological upgrading. The reason for the slow increase in the net carbon sink of agriculture lies in the irrationality of agricultural input factors in the agricultural production process. For this reason, it is necessary to continue to promote the reduction plan of pesticides, fertilizers, and other chemicals, as well as the structural optimization of agricultural inputs. For example, Yunnan, Guizhou and other upstream provinces have implemented actions to replace chemical fertilizers with organic fertilizers, Hubei, Hunan, Jiangxi and other rice-producing areas have promoted side-deep fertilization + biological control technology, and Jiangsu, Zhejiang and other downstream provinces have promoted the innovative use of agricultural machinery in a low-carbon manner, guiding them to reasonably control the use of agricultural inputs to achieve low-carbon development of agriculture; at the same time, we have promoted the enhancement of the digital-enabled carbon sinks by setting up an agricultural intelligent monitoring platform, promoting intelligent irrigation systems, and improving the structure of agricultural inputs. Additionally, the initiative promotes digital empowerment to enhance carbon sinks by establishing an agricultural intelligent monitoring platform and implementing intelligent irrigation systems. This approach aims to improve water resource utilization in key rice production areas while effectively preventing pests and diseases, thereby further advancing the development of low-carbon agriculture.
Secondly, differentiated low-carbon agricultural development strategies should be implemented according to local conditions. According to the natural conditions and market demand of different regions, develop specialized agriculture. For example, the Yangtze River Delta region develops modern urban agriculture and increases scientific and technological investment in research and development of new machinery for emission reduction agriculture so as to do a good job of demonstrating low-carbon agriculture. Jiangsu, Anhui, Sichuan Basin, the Dongting Lake Basin in Hunan Province, and the Poyang Lake Basin in Jiangxi Province have excellent natural resource endowments, so they should make more efforts to promote the construction of high-standard farmland and popularize the low-carbon model of integrated rice farming so as to enhance the carbon storage in the soil and improve the yield and quality of agricultural products at the same time. In the hilly and mountainous areas of the Yangtze River Basin, forestry and orchards can be developed to increase forestry carbon sinks.
Thirdly, the Government should strengthen collaborative governance and build a low-carbon agricultural policy support system. Financial expenditures on agriculture should be increased, with a focus on supporting the research and development of carbon sink enhancement technologies, low-carbon model pilots, and technical training for farmers. At the same time, the government should innovate market-based mechanisms, promote pilot trading of agricultural carbon sinks, and establish and improve cross-regional compensation mechanisms. In addition, in order to more effectively assess and monitor the low-carbon development of agroecology in the YEB, a dynamic assessment system of the basin’s AEE should be set up so as to provide a scientific basis and data support for regional cooperation and policy formulation.
Data availability statement
The original contributions presented in the study are included in the article/supplementary material, further inquiries can be directed to the corresponding author.
Author contributions
XL: Writing – review & editing, Formal analysis, Supervision, Methodology, Data curation, Software, Conceptualization, Investigation, Writing – original draft. YZ: Writing – original draft, Investigation, Data curation. BZ: Writing – original draft, Visualization. HL: Methodology, Writing – original draft. TZ: Writing – review & editing, Supervision, Visualization, Project administration.
Funding
The author(s) declare that no financial support was received for the research and/or publication of this article.
Conflict of interest
The authors declare that the research was conducted in the absence of any commercial or financial relationships that could be construed as a potential conflict of interest.
Generative AI statement
The authors declare that no Gen AI was used in the creation of this manuscript.
Any alternative text (alt text) provided alongside figures in this article has been generated by Frontiers with the support of artificial intelligence and reasonable efforts have been made to ensure accuracy, including review by the authors wherever possible. If you identify any issues, please contact us.
Publisher’s note
All claims expressed in this article are solely those of the authors and do not necessarily represent those of their affiliated organizations, or those of the publisher, the editors and the reviewers. Any product that may be evaluated in this article, or claim that may be made by its manufacturer, is not guaranteed or endorsed by the publisher.
References
Andersen, P., and Petersen, N. C. (1993). A procedure for ranking efficient units in data envelopment analysis. Manag. Sci. 39, 1261–1264. doi: 10.1287/mnsc.39.10.1261
Bernard, B. M., Song, Y., Narcisse, M., Hena, S., and Wang, X. (2023). A nonparametric analysis of climate change nexus on agricultural productivity in Africa: implications on food security. Renew. Agric. Food Syst. 38:e9. doi: 10.1017/S1742170522000424
Cai, Y., and Li, K. (2024). Spatiotemporal dynamic evolution and influencing factors of land use carbon emissions: Evidence from Jiangsu Province, China. Front. Environ. Sci. 12:1368205. doi: 10.3389/fenvs.2024.1368205
Cecchini, L., Venanzi, S., Pierri, A., and Chiorri, M. (2018). Environmental efficiency analysis and estimation of CO₂ abatement costs in dairy cattle farms in Umbria (Italy): a SBM-DEA model with undesirable output. J. Clean. Prod. 197, 895–907. doi: 10.1016/j.jclepro.2018.06.165
Charnes, A., Cooper, W. W., and Rhodes, E. (1978). Measuring the efficiency of decision making units. Eur. J. Oper. Res. 2, 429–444. doi: 10.1016/0377-2217(78)90138-8
Chen, X., Shang, J., and Ji, X. (2023). Impact of urbanization on agricultural ecological efficiency: evidence from China. Cienc. Rural 53:2023. doi: 10.1590/0103-8478cr20210650
Chen, W., Ye, X., Li, J., Fan, X., Liu, Q., and Dong, W. (2019). Analyzing requisition–compensation balance of farmland policy in China through telecoupling: a case study in the middle reaches of Yangtze River urban agglomerations. Land Use Policy 83, 134–146. doi: 10.1016/j.landusepol.2019.01.031
Cui, X., Cai, T., Deng, W., Zheng, R., Jiang, Y., and Bao, H. (2022). Indicators for evaluating high-quality agricultural development: empirical study from Yangtze River Economic Belt, China. Soc. Indic. Res. 164, 1101–1127. doi: 10.1007/s11205-022-02985-8
Cui, Y., Khan, S. U., Deng, Y., and Zhao, M. (2022). Spatiotemporal heterogeneity, convergence and its impact factors: perspective of carbon emission intensity and carbon emission per capita considering carbon sink effect. Environ. Impact Assess. Rev. 92:106699. doi: 10.1016/j.eiar.2021.106699
Deng, X., and Gibson, J. (2019). Improving eco-efficiency for sustainable agricultural production: a case study in Shandong, China. Technol. Forecast. Soc. Change 144, 394–400. doi: 10.1016/j.techfore.2018.01.027
Dubey, A., and Lal, R. (2009). Carbon footprint and sustainability of agricultural production systems in Punjab, India and Ohio, USA. Crop. Improv. 23, 332–350. doi: 10.1080/15427520902969906
Fan, Y. T., Ning, W. J., Liang, X. Y., Wang, L. Z., Lv, L. G., Li, Y., et al. (2024). Spatial-temporal characteristics and influencing factors of eco-efficiency of cultivated land use in the Yangtze River Delta region. Land 13:219. doi: 10.3390/land13020219
Farrell, M. J. (1957). The measurement of productive efficiency. J. R. Stat. Soc. A 120, 253–290. doi: 10.2307/2343100
Gancone, A., Pubule, J., and Rosa, M. (2017). Evaluation of agriculture eco-efficiency in Latvia. Energy Procedia 128, 309–315. doi: 10.1016/j.egypro.2017.08.318
He, X., and Liu, W. (2024). Coupling coordination between agricultural eco-efficiency and urbanization in China considering food security. Agriculture 14:781. doi: 10.3390/agriculture14050781
Huang, H., and Wang, Z. P. (2020). Analysis of spatial-temporal differences and influencing factors of agricultural land ecological efficiency in Jiangxi Province: based on the dual perspectives of non-point source pollution and carbon emission. Resour. Environ. Yangtze Basin 29, 412–423.
Huang, J., Xia, J., and Yu, Y. (2018). Composite eco-efficiency indicators for China based on data envelopment analysis. Ecol. Indic. 85, 674–697. doi: 10.1016/j.ecolind.2017.10.040
Ji, H., and Hoti, A. (2022). Green economy-based perspective of low-carbon agriculture growth for total factor energy efficiency improvement. Int. J. Syst. Assur. Eng. Manag. 13, 353–363. doi: 10.1007/s13198-021-01421-3
Ji, X. X., and Jiang, J. S. (2024). Study on the spatiotemporal evolution and influencing factors of agricultural eco-efficiency in main grain-producing areas. Stat. Decis. 40, 91–96. doi: 10.13546/j.cnki.tjyjc.2024.01.016
Jin, B., Cui, C., Wen, L., Shi, R., and Zhao, M. (2024). Regional differences and convergence of agricultural carbon efficiency in China: embodying carbon sink effect. Ecol. Indic. 169:112929. doi: 10.1016/j.ecolind.2024.112929
Jin, G., Deng, X., Zhao, X., Guo, B., and Yang, J. (2018). Spatio-temporal patterns in urbanization efficiency within the Yangtze River Economic Belt between 2005 and 2014. J. Geogr. Sci. 28, 1113–1126. doi: 10.1007/s11442-018-1545-2
Jin, G., Yu, H., He, D., and Guo, B. (2024). Agricultural production efficiency and ecological transformation efficiency in the Yangtze River Economic Belt. Land 13:103. doi: 10.3390/land13010103
Jing, P., Sheng, J., Hu, T., Mahmoud, A., Guo, L., Liu, Y., et al. (2022). Spatiotemporal evolution of sustainable utilization of water resources in the Yangtze River Economic Belt based on an integrated water ecological footprint model. J. Clean. Prod. 358:132035. doi: 10.1016/j.jclepro.2022.132035
Li, L., and Hu, J. Q. (2025). Measurement of China's provincial total factor energy efficiency: based on the meta-frontier DDF model and GML index. Adv. Soc. Sci. 14:420. doi: 10.12677/ass.2025.145410
Li, S., Zhu, Z., Dai, Z., Duan, J., Wang, D., and Feng, Y. (2022). Temporal and spatial differentiation and driving factors of China’s agricultural eco-efficiency considering agricultural carbon sinks. Agriculture 12:1726. doi: 10.3390/agriculture12101726
Liu, X., Ye, Y., Ge, D., Wang, Z., and Liu, B. (2022). Study on the evolution and trends of agricultural carbon emission intensity and agricultural economic development levels: evidence from Jiangxi Province. Sustainability 14:14265. doi: 10.3390/su142114265
Liu, Y. S., Zou, L. L., and Wang, Y. S. (2020). Spatial-temporal characteristics and influencing factors of agricultural eco-efficiency in China in recent 40 years. Land Use Policy 97:104794. doi: 10.1016/j.landusepol.2020.104794
Orea, L., and Wall, A. (2017). A parametric approach to estimating eco-efficiency. J. Agric. Econ. 68, 901–907. doi: 10.1111/1477-9552.12209
Pan, X., He, Y., and Hu, X. (2013). Evaluation of regional ecological efficiency and its spatial econometric analysis. Resour. Environ. Yangtze Basin 22, 640–647.
Pishgar-Komleh, S. H., Čechura, L., and Kuzmenko, E. (2021). Investigating the dynamic eco-efficiency in agriculture sector of the European Union countries. Environ. Sci. Pollut. Res. 28, 48942–48954. doi: 10.1007/s11356-021-13948-w
Quah, D. (1993). Galton’s fallacy and tests of the convergence hypothesis. Scand. J. Econ. 95, 427–443. doi: 10.2307/3440905
Rosano Peña, C., Serrano, A. L. M., de Britto, P. A. P., Franco, V. R., Guarnieri, P., and Thomé, K. M. (2018). Environmental preservation costs and eco-efficiency in Amazonian agriculture: application of hyperbolic distance functions. J. Clean. Prod. 197, 699–707. doi: 10.1016/j.jclepro.2018.06.227
Rosano-Peña, C., Almeida, C. A. R. D., and Rodrigues, E. C. C. (2020). Spatial dependency of eco-efficiency of agriculture in São Paulo. Braz. Bus. Rev. 17, 328–343. doi: 10.15728/bbr.2020.17.3.5
Schaltegger, S., and Sturm, A. (1990). Okologische Rationalität: Ansatzpunkte zur Ausgestaltung von okologieorientierten Management Instrumenten. Die Unternehmung 44, 273–290.
Tobin, J. (1956). Estimation of relationships for limited dependent variables. Cowles Foundation Discussion Papers 26, 24–36.
Tone, K. (2001). A slacks-based measure of efficiency in data envelopment analysis. Eur. J. Oper. Res. 130, 498–509. doi: 10.1016/S0377-2217(99)00407-5
Wang, S., and Liu, F. (2023). Spatiotemporal evolution of land use efficiency in southwest mountain area of China: a case study of Yunnan Province. Agriculture 13:1343. doi: 10.3390/agriculture13071343
Wang, G., Mi, L., Hu, J., and Qian, Z. (2022). Spatial analysis of agricultural eco-efficiency and high-quality development in China. Front. Environ. Sci. 10:847719. doi: 10.3389/fenvs.2022.847719
Weiss, C. H., and Zhu, F. K. (2025). Tobit models for count time series. Scand. J. Stat. 52, 381–415. doi: 10.1111/sjos.12751
Workneh, W. M., and Kumar, R. (2023). The technical efficiency of large-scale agricultural investment in Northwest Ethiopia: a stochastic frontier approach. Heliyon 9:e19572. doi: 10.1016/j.heliyon.2023.e19572
Wu, G., Fan, Y., and Riaz, N. (2022). Spatial analysis of agriculture ecological efficiency and its influence on fiscal expenditures. Sustainability 14:9994. doi: 10.3390/su14169994
Xie, H., Zhang, Y., and Choi, Y. (2018). Measuring the cultivated land use efficiency of the main grain-producing areas in China under the constraints of carbon emissions and agricultural nonpoint source pollution. Sustainability 10:1932. doi: 10.3390/su10061932
Xiong, C., Chen, S., and Xu, L. (2020). Driving factors analysis of agricultural carbon emissions based on extended STIRPAT model of Jiangsu Province, China. Growth Chang. 51, 1401–1416. doi: 10.1111/grow.12384
Xu, H., Tong, J., Chen, G., and Zhuang, T. (2022). Does feminization of agriculture promote outsourcing of agricultural machinery services? Acta Agric. Zhejiangensis 34, 173–183.
Yan, L. X., Zijun, L., and Liang, W. (2020). Temporal-spatial differences in and influencing factors of agricultural eco-efficiency in Shandong Province, China. Ciência Rural 50. doi: 10.1590/0103-8478cr20190818
Yang, B., Wang, Z., and Zou, L. (2021). Exploring the eco-efficiency of cultivated land utilization and its influencing factors in China's Yangtze River Economic Belt, 2001–2018. J. Environ. Manag. 294:112939. doi: 10.1016/j.jenvman.2021.112939
Yin, Y., Hou, X., Liu, J., Zhou, X., and Zhang, D. (2022). Detection and attribution of changes in cultivated land use ecological efficiency: a case study on Yangtze River Economic Belt, China. Ecol. Indic. 137:108753. doi: 10.1016/j.ecolind.2022.108753
Zhang, L., and Cai, C. (2024). Innovative measurement, trade-off-synergy relationship and influencing factors for agricultural net carbon emissions and effective supply of agricultural products in China. Heliyon 10:e24621. doi: 10.1016/j.heliyon.2024.e24621
Zhang, H., Song, Y., Zhang, M., and Duan, Y. (2024). Land use efficiency and energy transition in Chinese cities: a cluster-frontier super-efficiency SBM-based analytical approach. Energy 304:132049. doi: 10.1016/j.energy.2024.132049
Zhang, C., Zhou, R., Hou, J., and Feng, M. (2022). Spatial-temporal evolution and convergence characteristics of agricultural eco-efficiency in China from a low-carbon perspective. Sustainability 14:16509. doi: 10.3390/su142416509
Zhu, T., and Cao, J. (2024). Analysis of agricultural ecological efficiency in the Yellow River Basin from the perspective of carbon sources and carbon sinks. Ecol. Econ. 40, 129–135.
Keywords: Yangtze River Economic Belt, carbon source, carbon sink, agricultural ecological efficiency, driving factors
Citation: Liu X, Zhu Y, Zhang B, Lu H and Zhang T (2025) Patiotemporal evolution patterns and driving factors of agricultural ecological efficiency in the Yangtze River Economic Belt, China. Front. Sustain. Food Syst. 9:1618536. doi: 10.3389/fsufs.2025.1618536
Edited by:
Fahd Rasul, University of Agriculture Faisalabad, PakistanCopyright © 2025 Liu, Zhu, Zhang, Lu and Zhang. This is an open-access article distributed under the terms of the Creative Commons Attribution License (CC BY). The use, distribution or reproduction in other forums is permitted, provided the original author(s) and the copyright owner(s) are credited and that the original publication in this journal is cited, in accordance with accepted academic practice. No use, distribution or reproduction is permitted which does not comply with these terms.
*Correspondence: Tao Zhang, dGFvemhhbmdAbXB1LmVkdS5tbw==
†These authors have contributed equally to this work