 Arnab Kundu1,2*†
 Jayashree Dey Sarkar2*†
 Subham Mukherjee2,3
 Ramprasad Nandi2,4
 Subhadip Saha2Prasanta Kumar Bandyopadhyay2Shalini Sharma5
- 1Department of Soil Science, Dr. Rajendra Prasad Central Agricultural University, Samastipur, Bihar, India
- 2Soil Physics Laboratory, Department of Agricultural Chemistry and Soil Science, Bidhan Chandra Krishi Viswavidyalaya, West Bengal, India
- 3Soil and Land Use Survey of India (SLUSI), Government of India, Ministry of Agriculture and Farmers Welfare, Kolkata, India
- 4Department of Soil Science and Agricultural Chemistry, Institute of Agricultural Sciences, Siksha ‘O' Anusandhan, Bhubaneswar, Odisha, India
- 5Department of Soil Science and Agricultural Chemistry, Banaras Hindu University, Varanasi, India
Introduction: Conservation agriculture (CA) is promoted as a sustainable intensification strategy for improving soil structure and enhancing carbon sequestration. However, the influence of short-term CA interventions on soil aggregation and aggregate-associated carbon dynamics in heavy clayey soils remains inadequately understood.
Methods: A field experiment was conducted over three years (2018–2021) on a Vertic Epiaquept soil (~60% clay) in West Bengal, India, using a split–split plot experimental design with three rice-based cropping systems [rice–mustard–black gram (RMuB), rice–wheat–green gram (RWG) and rice–lentil–fallow (RLF)] in main plots, three tillage systems [conventional tillage (CT), zero tillage (ZT), and reduced tillage (RT)] in sub-plots and three combinations of residue and nutrient treatments [0% rice residue+100% recommended dose of fertilizer (RDF) (R1), 100% residue+75% RDF fertilization (R2) and 50% residue + 75% RDF fertilization (R3)] in sub-sub plots.
Results and discussion: After eight cropping seasons, ZT showed the highest values of geometric mean diameter (GMD) and aggregate ratio (AR), which were 13.0 and 22.6% higher than the corresponding values of CT, and 7 and 20% higher than those of RT. R2 resulted in a 3 and 13% hike in GMD and AR, respectively, over R1. RWG showed a hike in soil organic carbon (SOC) over other cropping systems which further reduced the tensile strength of soil aggregates. Although significantly higher SOC is recorded in the silt + clay (S+C) fraction, the carbon (C) mass associated with coarse macroaggregates (CMac) demonstrated an increase of up to 1.70 times compared to the C mass of the rest of the fractions.
Conclusion: Conjoint adoption of ZT and 100% rice residue was the best management practice for maintaining the structural attributes of the experimental soil. Further, the inclusion of a cereal along with a leguminous crop in a rice-based cropping system demonstrated the best outcome in terms of structural indices, SOC, and aggregate-associated C mass. The study underscores the importance of context-specific CA strategies tailored to cropping system diversity and edaphic conditions for improving soil quality and mitigating carbon loss in fine-textured soils of the eastern Indo-Gangetic Plains.
1 Introduction
In the post-green revolution epoch, the global agricultural community has experienced a remarkable escalation in food productivity, despite rising land values and increasing land scarcity. To achieve a higher return in a shorter span, agricultural intensification features within arable fields and as a “bonus”, it costs elevated environmental menaces, namely, groundwater depletion, increased greenhouse gas emissions, water pollution, and a decline in soil organic carbon (C) and microbial diversity. Agricultural intensification leads to multiple adverse consequences for natural resources, and farmers ace varying degrees of climatic risk, biotic invasion, and economic uncertainty. Thus, a paradigm shift in farming practices is urgent, by expelling unsustainable limbs, that is, conventional agriculture (too much plowing/tilling, exonerating all organic material, and monoculture), for future productivity gain, along with conserving natural resources. Adoption of conservation agricultural (CA) practices (comprising three key principles, that is, minimal mechanical disturbance of soil, permanent soil cover, and diversified crops) (FAO, 2008) has been recognized as a major strategy for sustainable intensification of agricultural production systems.
Aggregate stability is the most frequently used indicator of soil structure. Higher aggregate stability signifies improved soil productivity (Rieke et al., 2022) and sustainability, due to congenial structural arrangement and resistance against external disruptive forces. Furthermore, soil organic carbon (SOC) is considered an imperative aggregate binding agent, as it has a proximal relationship with aggregate formation and stabilization processes in association with soil biota (Six et al., 2002). Principally, macroaggregates protect the SOC, but disruption via tillage exposes the microaggregate C pool to decomposers and thereby amplifies subsequent mineralization. Thus, different aggregate size classes exhibit differential means of physical protection of associated C against microbial decomposition (Xie et al., 2017). Furthermore, the three principles of CA, applied in tandem, could alter the aggregation status of soil and its corresponding C dynamics. However, the amplitude of change varies with the nature of the soil (parent material, texture, depth, etc.) (Palm et al., 2014), prevailing climatic conditions (Li et al., 2020), and cultivation and crop management practices (Huang et al., 2018) as CA impacts are highly site-specific. Moreover, zero-tillage (ZT) with residue cover moderates soil temperature, conserves soil moisture (Six et al., 2000), increases mean weight diameter, water stable aggregate content, improves pore-size distribution (He et al., 2009), enhances macroaggregate-occluded microaggregates, and protects SOC better than those under CT (Barreto et al., 2009). Continuous inputs of organic materials form heterogeneous component crop species, and their divergent rhizospheric zones generate a diverse group of aggregating agents, such as fungal hyphae, microbial bioproducts (Haynes and Francis, 1993), and root exudates (Guggenberger et al., 1999).
Rice-based cropping systems are predominant in the lower Indo-Gangetic Plains of India, and conventional management (puddling) hastens issues like depletion of soil moisture and SOC, ultimately deteriorating the physical health of the soil (Hobbs, 2021). Recent research across South Asia has emphasized that the impact of CA on aggregate carbon distribution is strongly influenced by the type of rice-based cropping system employed. For instance, the inclusion of oilseed crops, such as mustard, contributes residues with faster decomposition rates and lower quality carbon inputs, which often lead to reduced macroaggregation and weaker carbon stabilization in soil aggregates (Amin et al., 2020). Although legumes contribute to nitrogen cycling, their influence on soil physical properties and carbon stabilization may not be as significant as cereal-based sequences (Islam et al., 2022; Mishra et al., 2024). Tillage intensity critically influences these dynamics, as Modak et al. (2020) observed that SOC within macroaggregates was approximately 30 and 25% higher under ZT than CT at 0–5 and 5–15 cm soil depths, respectively. Similarly, Nisar and Benbi (2024) reported that, at 0–7.5 cm depth, no-tillage without mulch increased macroaggregate-associated carbon by 45.5% compared to CT without mulch, while no-tillage with mulch led to a 67.9% increase over conventional tillage with mulch. There is an enduring debate about the impact of CA practices on soil structure and the ecosystem properties mediated by this structure. However, there is scarce reporting on the impact of CA on soil structural attributes of the lower Indo-Gangetic Plains, especially in soils with very high clay content during the initial years of adoption. The majority of previous research works on the lower Indo-Gangetic Plains have been predominantly focused on coarse-to-medium-textured soils, often overlooking the unique physical dynamics of very fine-textured soils, where movement of water, aeration, and microbial activity differ significantly. More often, those studies lack robust integration of region-specific cropping system diversity and residue management interactions within the CA framework. By identifying the range to which CA can influence the aggregation and SOC dynamics in the earlier stages of adaptation, it will facilitate our ability to determine its collective impact. Therefore, we hypothesized that three components of CA—minimum soil disturbance, residue retention, and crop diversification—along with their interactions with soil type and crop rhizosphere dynamics, may significantly modify the soil aggregation status and structural stability, and influence the physical environment of the soil rhizosphere. Furthermore, we anticipated that the maximum retention of rice residues under conservation tillage would result in higher levels of stable aggregates, along with an array of associated carbon, in the heavy clayey soils of the lower Indo-Gangetic Plains. We further hypothesized that the magnitudes of these effects would vary across cropping systems and that the inclusion of legumes and cereals in rotation would enhance soil structural indices and partitioning of SOC compared to less diverse systems.
To address these hypotheses, an experiment was conducted in a heavy clayey soil of the lower Gangetic plains, by cultivating different rice-based cropping systems along with different combinations of tillage and residue management, with the following objectives, (i) to access the impact of short-term CA practices on structural attributes of soil, (ii) to examine the impact of such management practices on C associated with different aggregate fractions. Accordingly, we can quantify the aggregate-size-specific carbon content and mass, offering a detailed picture of the carbon stabilization pathway of very fine-textured (clayey) soils in the under-researched lower Indo-Gangetic Plains. Further, this could identify the best-fit combination of tillage, residue, and region-specific cropping systems under CA.
2 Materials and methods
2.1 Description of the experimental site
The field experiment was conducted from 2018 to 2021 at Balindi Research Complex (22°58′N, 88°32′E) of Bidhan Chandra Krishi Viswavidyalaya, Nadia, West Bengal, India (Supplementary Figure 1). This region is located in the humid subtropics, with an annual rainfall of 1,470 mm, and mean annual minimum and maximum temperatures of 18 and 35°C, respectively (Supplementary Figure 2). The experimental soil represents an inceptisol (Vertic Epiaquept, US Soil Taxonomy, Soil Survey Staff, 2003) and falls under the clayey textural class (sand, 7.1%; silt, 30.1%; and clay, 63.8%) with a hyperthermic temperature regime. The soil had a neutral soil reaction [pH, 7.39 (1:2.5)], 0.29 dS m−1 electrical conductivity, high SOC content of 9.1 g kg−1, 1.42 Mg m−3 bulk density, low available nitrogen (222 kg ha−1), high available phosphorus (25 kg ha−1) and high available potassium (298 kg ha−1) content. The experimental field was mainly used for rice cultivation during kharif and for rice or mustard during the rabi season for the last 8 years, before the inception of the current experiment.
2.2 Experimental details and crop management
The experiment was carried out by following a split–split plot design (replicated thrice) with three cropping systems (RMuB, rice–mustard–black gram; RWG, rice–wheat–green gram and RLF, rice–lentil–fallow) in the main plot, three tillage systems (CT, conventional tillage; ZT, zero tillage, and RT, reduced tillage) in sub-plots and three regimes of residue and nutrient management (R1, 0% rice residue retention + 100% recommended dose of fertilizer (RDF)s fertilization; R2, 100% rice residue retention + 75% RDF fertilization; and R3, 50% rice residue retention + 75% RDF fertilization) in sub–sub plots. This resulted in a total of (3 × 3 × 3 = 27) twenty-seven treatments, each with three replicates. Treatment details are described in Supplementary Table 1. The size of each sub–sub plot was 20 × 6.3 m2.
A description of tillage operations is provided in Table 1. Sub–sub-plot treatments were assigned depending upon doses of residue and NPK fertilizers for the cultivation of rabi and pre-kharif crops. After harvesting rice, rice straws were used as mulch as a conservation technique in mustard, wheat, and lentil (for RMuB, RWG, and RLF cropping systems, respectively), and sowing of the aforementioned crops was conducted using a multicrop planter. The total straw yield of rice was considered as 100% and among which half (50%) and the entire (100%) amount of rice straw were retained in the field for respective sub–sub plot treatments. However, in pre-kharif season (black gram and green gram cultivation), only differential fertilizer treatments were used based on their RDF, and no crop residue was retained. Sub–sub-plots during rice cultivation had no variation in inputs as there was no addition of residues, and 100% RDF was followed. The description of the package of practices for the cultivation of individual crops is provided in Supplementary Table 2. During fertilization, nitrogen (N) was applied in three splits, that is, at basal and two doses based on the duration of component crops (rice, mustard, and wheat), and a full dose of phosphorus and potassium was applied as basal. Whereas, a full dose of N, P, and K was used as a starter dose at the time of sowing for lentil, black gram, and green gram. The complex NPK fertilizer (10-26-26) and urea were applied to supply nitrogen, phosphorus, and potassium. The plot-wise irrigation was used on the field depending on their water requirement (except lentil, which was cultivated as a rainfed crop).
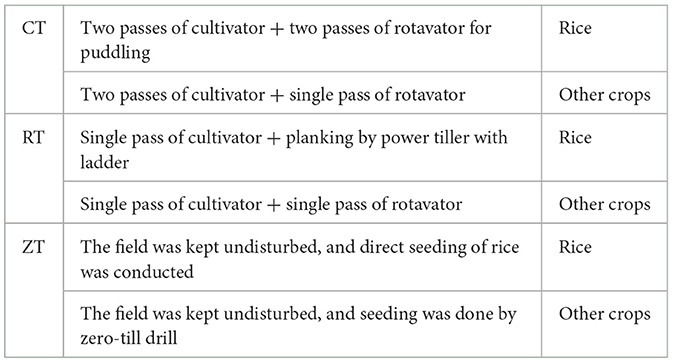
Table 1. Description of tillage practices deployed in the sub-plot.
2.3 Sampling and processing of soil
Collection of soil samples was carried out in 2021 (after eight cropping seasons) after harvesting of rabi crops, that is, mustard for RMuB, wheat for RWG, and lentil for RLF, from two soil depths, namely, 0–10 and 10–20 cm, with a bucket auger from each replication (6 representative samples) of the sub–sub-plots. For aggregate tensile strength analysis, a portion of the field-moist samples was gently crushed and passed through an 8.0 mm sieve and retained in a 5.0 mm sieve. For wet-sieving, a portion of the soil aggregates was passed through a 5.0 mm sieve and retained in a 2.0 mm sieve. After hand crushing, the remaining samples were air-dried in the shade, processed, and passed through the 2.0 mm sieve. Processed bulk soil samples were kept in air-tight containers for further laboratory analysis.
2.4 Observation recorded
2.4.1 Wet sieving and structural indices of soil
Six nested sieves (2.0, 1.0, 0.5, 0.25, 0.1, and 0.05 mm size classes) in two sets were used for wet-sieving of soil aggregates in Yoder's apparatus (Kemper and Rosenau, 1986). First, 25 g samples (2.0–5.0 mm) were slaked in duplicate by submerging for 10 min at room temperature. One of the samples was used for sand correction, and the other was kept for wet-sieving. The nests of sieves were vertically shaken for 30 min (30–35 cycles min−1 through a stroke length of 3.8 cm using an electric motor), and the retained aggregates on individual sieves were backwashed into filter paper. After wet-sieving, the “silt + clay” (S+C) sized fraction was collected from soil suspension in Yoder's apparatus and passed through a 0.05 mm sieve. Retained aggregates on individual sieves were transferred into a pre-weighed container, dried at 60°C, and weighed. The weights of primary particles were also recorded during sand correction. In this way, aggregates were fractioned into coarse macroaggregates (CMac, > 2.0 mm), mesoaggregates (Meso, 0.25–2.0 mm), coarse microaggregates (CMic, 0.10–0.25 mm), and silt+clay (S + C, < 0.05 mm).
The geometric mean diameter (GMD) and aggregate ratio (AR) were determined using the following equations:
where n is the number of size-fractions (> 2.0, 1.0–2.0, 0.50–1.0, 0.25–0.50, and 0.1–0.25 mm), Xi is the mean diameter of each size-fractions (3.5, 1.5, 0.75, 0.375, and 0.175 mm), and Wi is the proportion of the total water-stable aggregates after sand correction.
2.4.2 Aggregate-associated carbon and bulk soil organic carbon
Aggregate-associated oxidizable C of each size fraction was estimated (Walkley and Black, 1934) as grams C per kilogram of sand-free water-stable aggregate and expressed as coarse macroaggregate-associated C (CMacAC, >2.0 mm), mesoaggregated C (MesAC, 0.25–2.0 mm), coarse microaggregated C (CMicAC, 0.05–0.25 mm), and “silt + clay” associated C (S + CAC, < 0.05 mm. Further, the mass of aggregate-associated C was calculated as the amount of C contained in each of the total mass of soil aggregates per kilogram of soil. The soil organic carbon of bulk soil was also estimated by the Walkley and Black (1934) method.
2.4.3 Tensile strength of soil aggregates
Individual aggregates (5–8 mm diameter) were placed in tensile-strength apparatus, and the force (P) required to crush them was recorded. Ten aggregate samples from each replication were used. Then the aggregate tensile strength (TS) was computed (Dexter and Kroesbergen, 1985) using the formula
where D is the mean diameter of the aggregate.
The longest (d1), intermediate (d2), and smallest (d3) diameters of individual aggregates were measured by using a Vernier caliper, and the effective diameter (D) was computed by the following equation:
2.5 Carbon input calculations
The cumulative carbon input across all three cropping systems was quantified based on crop yield data (both grain and straw/stover yield) and residue retention measurements obtained during the experimental period. Below-ground and plant-derived carbon inputs, encompassing rhizodeposition, root biomass carbon, and carbon from crop residues (stubble and straw), were calculated using well-established empirical relationships documented in previous studies. For rice cultivation, rhizodeposition and root biomass contributions were calculated as 15% each of the total above-ground biomass (combined grain and straw yield), while for wheat, these parameters were estimated at 12.6 and 10% of above-ground biomass at harvest, respectively (Bronson et al., 1997; Majumder et al., 2007). Carbon concentrations in stubble, root, and rhizodeposition components were set at 38.1, 41.2, and 74 for rice, and 35.2% 39.1, and 74% for wheat, respectively (Roy et al., 2024). For green gram, the root biomass carbon input was estimated as 16% of the above-ground biomass carbon, based on the study by Matsumoto et al. (2021). The rhizodeposition carbon was calculated as 10% of the total root biomass (Roy et al., 2024). Mustard crop root biomass was estimated at 20% of above-ground biomass, with root carbon content of 42.3% and rhizodeposition carbon equivalent to 65% of root carbon (Gan et al., 2009). Regarding black gram, root biomass was calculated as 18% of the above-ground biomass, with root carbon comprising 34.2% of root biomass and rhizodeposition carbon estimated at 1.4 times the root carbon content (Shamoot et al., 1968; Srinivasarao et al., 2019). For lentil, the root biomass was determined to be 14% of the stover yield, containing 34.8% carbon, with rhizodeposition carbon calculated as 1.33 times the root carbon (Srinivasarao et al., 2012; Slater, 2015).
2.6 Statistical analysis
The analysis of variance (ANOVA) was executed to determine the effects of each factor and their interaction in a split–split plot design, by using GenStat software (Version 16.0). Duncan's multiple range test (p ≤ 0.05) was performed for mean comparison. Correlation matrices were computed and visualized via the R programme (Version 4.2.1). Principal component analysis (PCA) was conducted in the R programme (Version 4.2.1) and Past (Version 4.03). PCA was conducted using a set of structural indices (e.g., GMD, AR, and TS), as well as organic carbon metrics (SOC, CMacAC, MesoAC, CMicAC, and S+CAC) to delineate the orthogonal linear combinations of a set of management factors that maximize the variation contained within them. Each treatment combination (e.g., ZT-R1, RT-R2, CT-R3) was assigned a principal component score for the first two principal components (PCs). Treatments with the highest PC1 scores were considered the most effective, and higher positive loading on PC1 was interpreted as a superior indicator for improving soil physical health under conservation agriculture. Similarly, a separate PCA was conducted to identify the suitable cropping system for maintaining structural stability and C dynamics of the soil.
3 Results
3.1 Aggregate size distribution
Irrespective of the different treatments involved, the experimental soil was predominantly composed of CMac, ranging from 46.0 to 72.9%. Intermediate abundance was noticed for Meso (17.1–36.4%), followed by S+C (6.0–11.2%), and CMic was present in the least amount (1.98–4.38%) (Figure 1). Among the tillage treatments, ZT resulted in the highest amount of CMac in each of the cropping systems. Overall, it was 1.27 and 1.15 times higher than CT atsoil depths of 0–10 cm and 10–20 cm, respectively. In contrast, CT plots recorded higher proportions of Meso, CMic, and S + C fractions. Furthermore, residue retained plots (R2 and R3) caused significantly higher amounts of CMac than residue removed plots. Overall, R2 and R3 had 1.06 and 1.04 times higher CMac at depths of 0–10 cm. Conversely, smaller aggregate fractions were abundant under R1. After 3 years of CA management, RWG demonstrated 1.27 and 1.08 times higher amounts of CMac than RMuB and RLF, respectively. However, RMuB recorded higher contents of Meso, CMic, and S + C fractions.
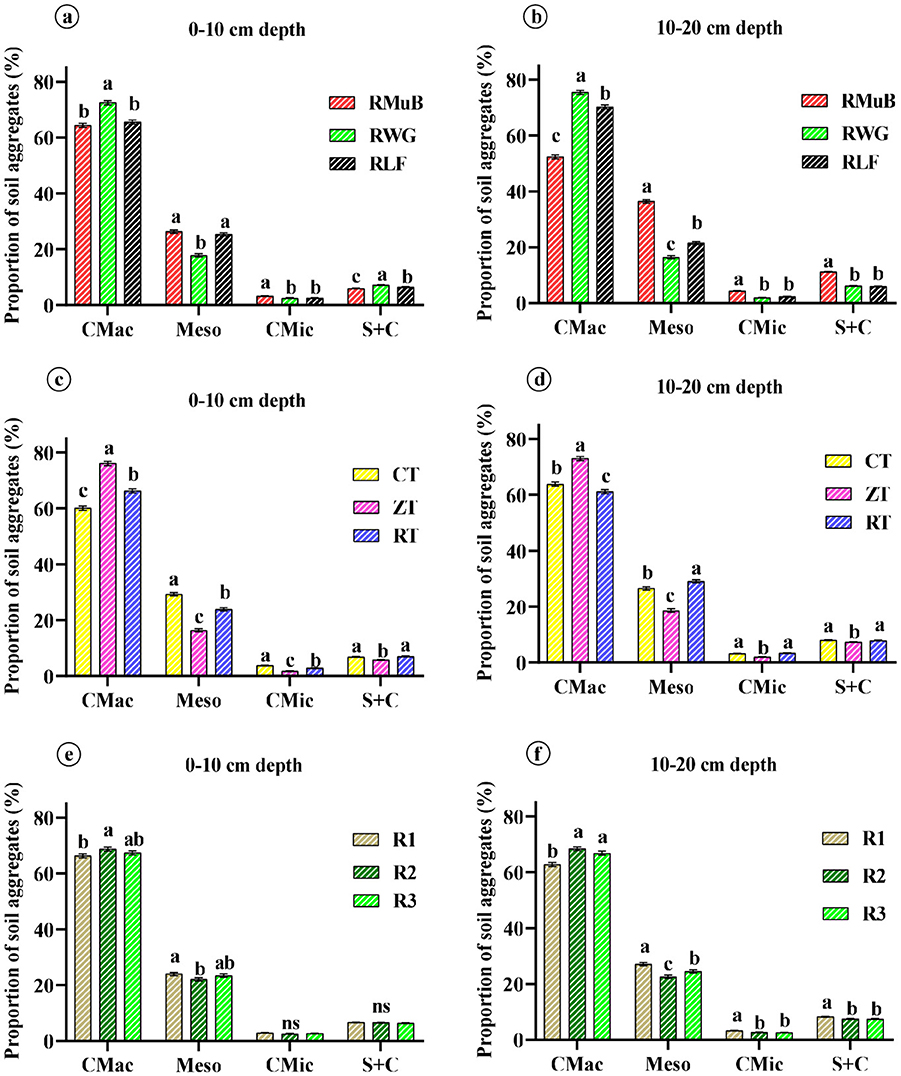
Figure 1. Size distribution of water-stable aggregates (%) under conservation agriculture practices; Impact of cropping systems in (a) 0–10 cm soil depth, (b) 10–20 cm soil depth, impact of tillage in (c) 0–10 cm soil depth, (d) 10–20 cm soil depth, impact of residue management in (e) 0–10 cm soil depth, (f) 10–20 cm soil depth. CMac, coarse macroaggregates; Meso, meso aggregates; CMic, coarse microaggregates; S + C, silt + clay fraction; RMuB, rice–mustard–black gram; RWG, rice–wheat–green gram; RLF, rice–lentil–fallow cropping system; CT, conventional tillage; ZT, zero tillage; RT, reduced tillage; R1, 0% residue + 100% recommended dose of fertilizer (RDF); R2, 100% residue+75% RDF; R3, 50% residue+75% RDF fertilization; ns, non-significant. Vertical bars with different lowercase letters are significantly different at p < 0.05 according to Duncan's multiple range test. Error bars represent the standard error of the mean.
3.2 Aggregation indices
The CA practices had a significant impact on both GMD and AR of soil aggregates (Table 2). RWG demonstrated significantly larger GMD, which was 11 and 3% higher than RMuB and RLF, for overall soil depths. ZT demonstrated a 12 and 8% hike in GMD over CT at surface and subsurface soil, respectively. Similarly, residue management played a key role as R2 showed up to 4% increase over R1. In the case of AR of soil aggregates, RLF resulted in a significantly larger value, which was statistically at par with RWG and 19% higher than RMuB. ZT demonstrated the largest AR (12.56 and 11.91), which was 44 and 18% higher than CT at the surface and subsurface soil, respectively.
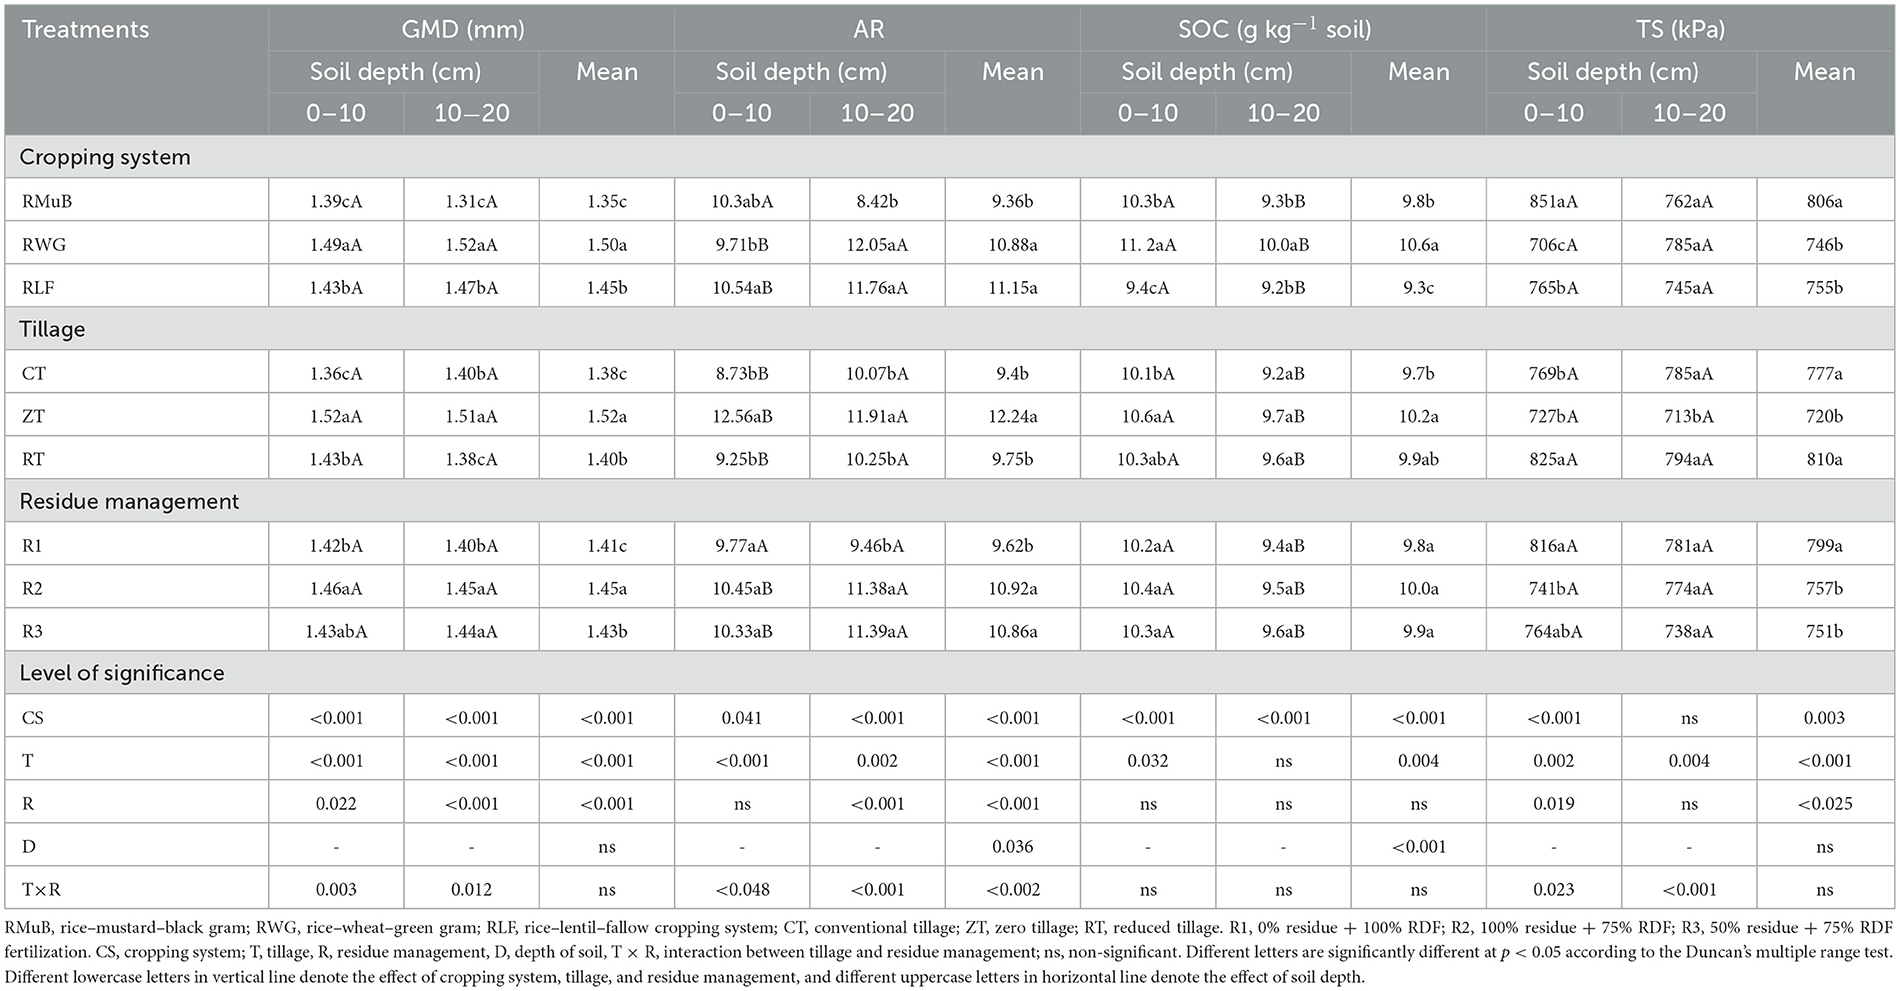
Table 2. Effect of conservation agriculture management on geometric mean diameter (GMD), aggregate ratio (AR), soil organic carbon (SOC), and tensile strength (TS) of soil aggregates across three cropping systems.
3.3 Soil organic carbon
The SOC ranged between 9.2 and 11.7 g kg−1 soil (Table 2). Tillage significantly influenced the SOC of surface soil, and the observed trend was ZT > RT > CT. However, this effect was not significant at the subsurface layer (10–20 cm). Although the effect of residue addition did not exert a statistically significant effect on SOC, R2 revealed the highest corresponding values at both soil depths. Considering the impact of cropping systems, RWG resulted in the highest SOC at each of the soil depths, which was 19 and 9% higher than RLF and RMuB at surface soil and 9% higher than both RLF and RMuB at subsurface soil, respectively.
3.4 Tensile strength of aggregates
ZT resulted in the lowest TS (Table 2) at each of the soil depths, and overall ZT showed 13% and 8% lower TS than RT and CT, respectively. The impact of residue management was only found to be significant at the surface soil layer, and R2 had 10% lower TS than residue-removed plots. Cropping systems demonstrated a significant impact on TS at the surface soil layer, as RWG had the lowest TS (746 kPa), which was 20% and 8% lower than RMuB and RLF, respectively.
3.5 Aggregate-associated carbon content
The perusal of data showed that the highest concentration of organic carbon was associated with the silt + clay fraction (S + CAC) (Figure 2). Across three cropping systems, ZT had significantly higher C in each of the four fractions, with noticeable relative increments of 28, 26, 48, and 31% for CMac, Meso, CMic, and S + C over CT at the surface soil layer, respectively. R2 accumulated the highest concentration of aggregate-associated carbon in each of the four fractions. Considering the impact of cropping systems (Figure 3), RWG showed 43 and 39% higher CMacAC, 22 and 19% higher MesoAC, and 55 and 34% higher CMicAC than RMuB and RLF, respectively, for the soil depth of 0–20 cm.
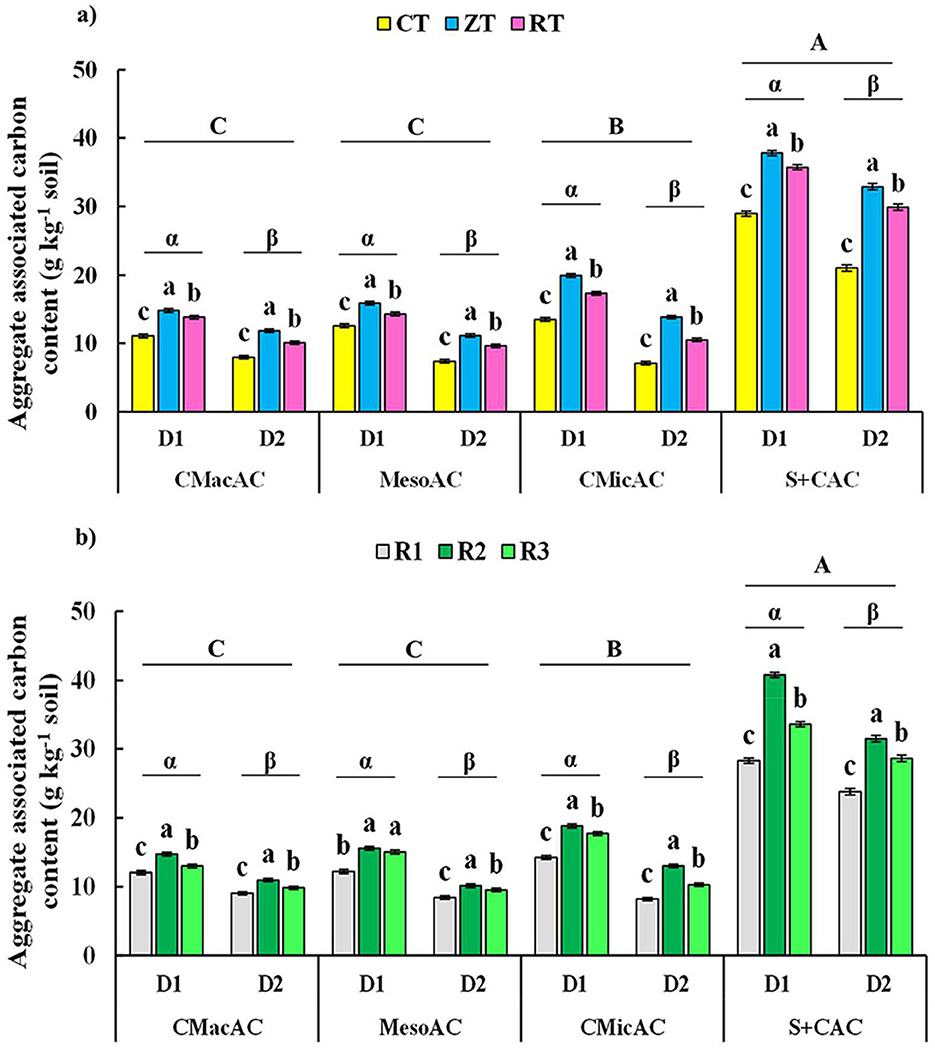
Figure 2. Impact of (a) tillage and (b) residue management on soil aggregate-associated carbon (g C kg−1 soil). CMacAC, coarse macroaggregate-associated carbon; MesoAC, meso aggregate-associated carbon; CMicAC, coarse microaggregate-associated carbon; S + CAC, silt + clay associated carbon; D1, 0–10 cm soil layer; D2, 10–20 cm soil layer; CT, conventional tillage; ZT, zero tillage; RT, reduced tillage. R1, 0% residue + 100% recommended dose of fertilizer (RDF); R2, 100% residue + 75% RDF; R3, 50% residue + 75% RDF fertilization. Vertical bars with different lowercase English letters denote that the different tillage/residue management treatments are significantly different; different lowercase Greek letters denote that the different soil depths are significantly different; different uppercase English letters denote that the different aggregate fractions are significantly different at p < 0.05 according to Duncan's multiple range test. Error bars represent the standard error of the mean.
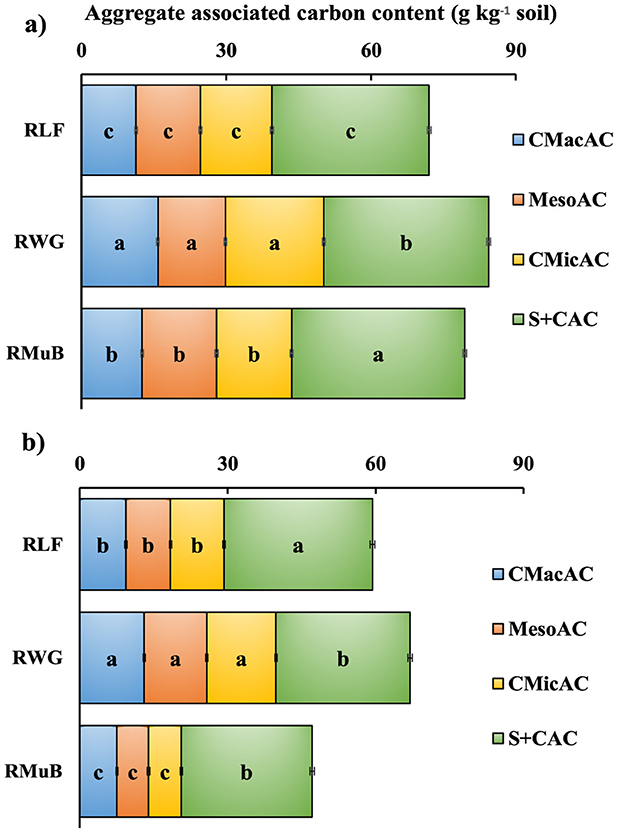
Figure 3. Impact of cropping systems on soil aggregate-associated carbon (g C kg−1 soil) (a) in 0–10 cm soil layer and (b) 10–20 cm soil layer. CMacAC, coarse macroaggregate-associated carbon; MesoAC, meso aggregate-associated carbon; CMicAC, coarse microaggregate-associated carbon; S + CAC, silt+clay associated carbon; RMuB, rice–mustard–black gram; RWG, rice–wheat–green gram; RLF, rice–lentil–fallow cropping system. Horizontal bars with different lowercase letters are significantly different at p < 0.05 according to Duncan's multiple range test. Error bars represent the standard error of the mean.
3.6 Aggregate-associated carbon mass
The mass of aggregate-associated C per kilogram of soil at each soil depth was significantly influenced by short-term CA practices (Figures 4, 5). The ZT led to the highest CMacAC mass, which was 1.67 and 1.70 times higher than CT at the surface and subsurface soil, respectively. In contrast, CT showed the highest mass of MesoAC and CMicAC at surface soil, and RT accumulated the highest S + CAC mass at each of the soil depths. Residue retention also had a notable effect, as R2 exhibited the highest mass of aggregate-associated C in each of the aggregate-size fractions. Regarding the interaction between tillage and residue management, ZT-R2 accumulated the highest mass of CMacAC at each of the soil depths. RT–R3 resulted in the highest MesoAC and CMicAC mass, and RT-R2 had the highest S+CAC mass. Moreover, RWG demonstrated 1.53 and 1.42 times greater CMacAC mass than RLF and RMuB, respectively. Additionally, RMuB resulted in the highest MesoAC and CMicAC mass over other cropping systems. However, the observed trend of accumulated C mass among the different aggregate-size classes was CMacAC > MesoAC > S + CAC > CMicAC and CMacAC > MesoAC = S + CAC > CMicAC.
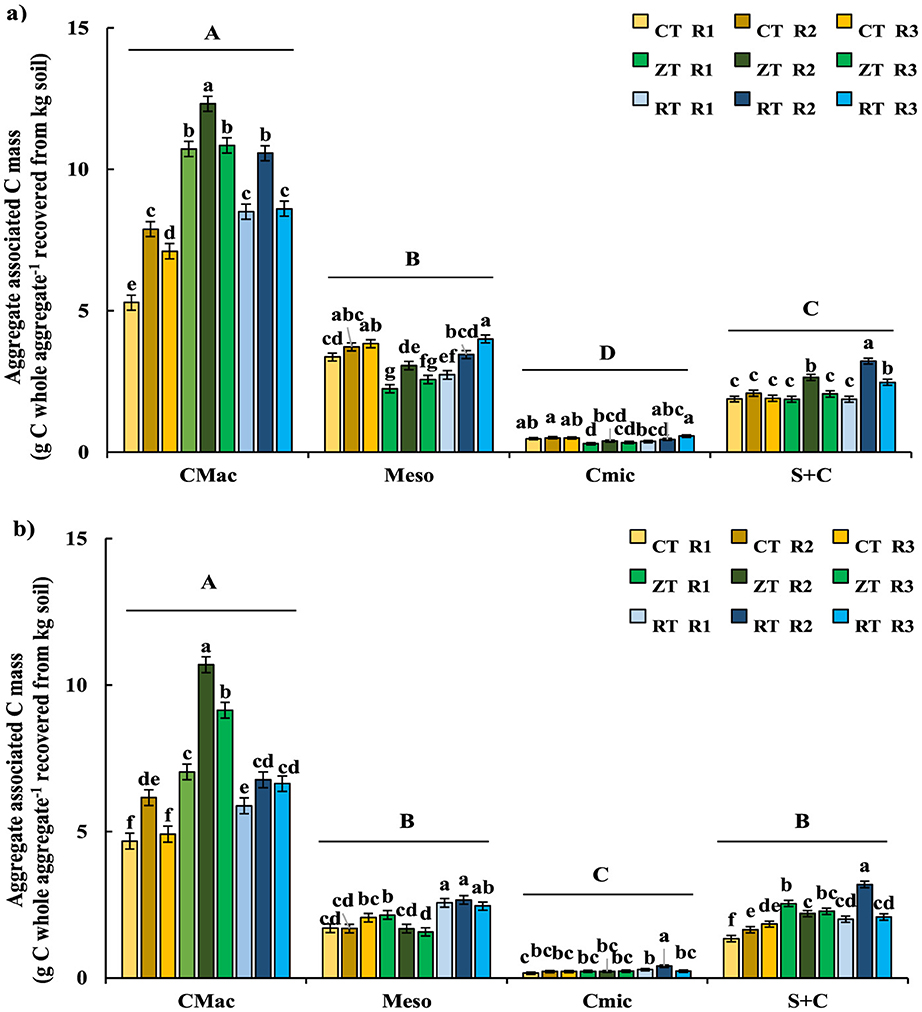
Figure 4. Aggregate-associated C mass (g C whole aggregates recovered from kg−1 of soil; normalized to sand-free water stable aggregates) at (a) 0–10 cm and (b) 10–20 cm depths as affected by tillage and residue management. CMac, coarse macroaggregates, Meso, meso aggregates; CMic, coarse microaggregates; S + C, silt + clay fraction; CT, conventional tillage; ZT, zero tillage; RT, reduced tillage. R1, 0% residue + 100% recommended dose of fertilizer (RDF); R2, 100% residue+75% RDF; R3, 50% residue+75% RDF fertilization. Vertical bars with different lowercase English letters denote that the interaction of tillage-residue management treatments is significantly different; different uppercase English letters denote that the different aggregate fractions are significantly different at p < 0.05 according to Duncan's multiple range test. Error bars represent the standard error of the mean.
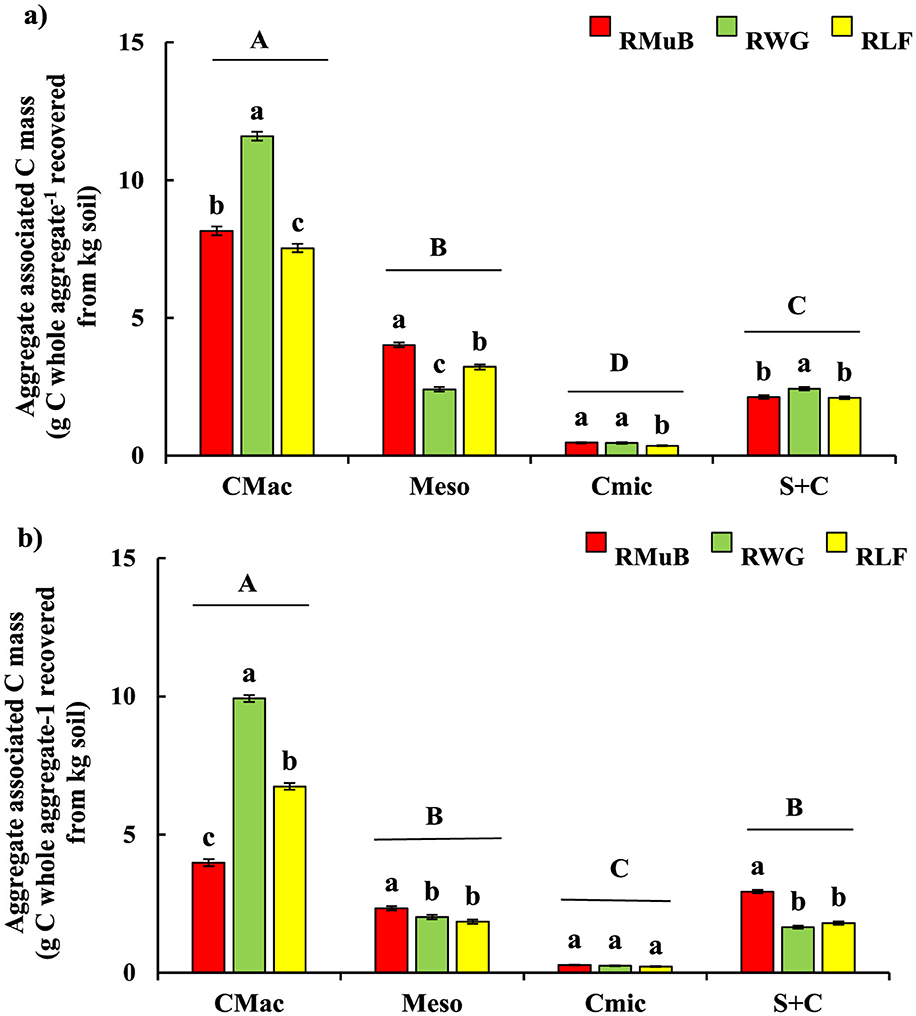
Figure 5. Aggregate-associated carbon (C) mass (g C whole aggregates recovered from kg−1 of soil; normalized to sand-free water stable aggregates) at (a) 0–10 cm, (b) 10–20 cm depths as affected by different cropping systems. CMac, coarse macroaggregates' Meso, meso aggregates; CMic, coarse microaggregates; S + C, silt + clay fraction; RMuB, rice–mustard–black gram; RWG, rice–wheat–green gram; RLF, rice–lentil–fallow cropping system. Vertical bars with different lowercase English letters denote that the different cropping systems are significantly different; different uppercase English letters denote that the different aggregate fractions are significantly different at p < 0.05 according to Duncan's multiple range test. Error bars represent the standard error of the mean.
3.7 Correlation analysis
Pearson's correlation analysis (Figure 6) showed a strong and significant negative relationship between CMac and Meso (r = −0.99, p ≤ 0.001), CMic (r = −0.90, p ≤ 0.001), and S + C (r = −0.67, p ≤ 0.001) fractions of soil aggregates. In contrast, strong positive relationships were observed between CMac and the aggregation indices of soil, that is, GMD (r = 0.98, p ≤ 0.001) and AR (r = 0.75, p ≤ 0.001). Bulk SOC showed a significant positive correlation with CMac (r = 0.49, p ≤ 0.01), a significant negative correlation was found with Meso (r = −0.51, p ≤ 0.01) and CMic (r = −0.35, p ≤ 0.01). The correlation between SOC and S + C was negative but non-significant (r = −0.16, p > 0.05). Furthermore, CMac possessed a significant positive correlation with CMacAC (r = 0.69, p ≤ 0.001), MesoAC (r = 0.74, p ≤ 0.001), CMicAC (r = 0.80, p ≤ 0.001), and S + CAC (r = 0.53, p ≤ 0.01). Although SOC had a non-significant correlation with CMacAC (r = 0.23, p > 0.05), it showed significant positive correlation with MesoAC (r = 0.41, p ≤ 0.05), CMicAC (r = 0.47, p ≤ 0.01), and S + CAC (r = 0.42, p ≤ 0.01). Additionally, TS showed a non-significant negative correlation with SOC (r = −0.28, p > 0.05), but possessed significant negative correlations with CMacAC (r = −0.47, p ≤ 0.01), MesoAC (r = −0.49, p ≤ 0.01), and CMicAC (r = −0.49, p ≤ 0.01).
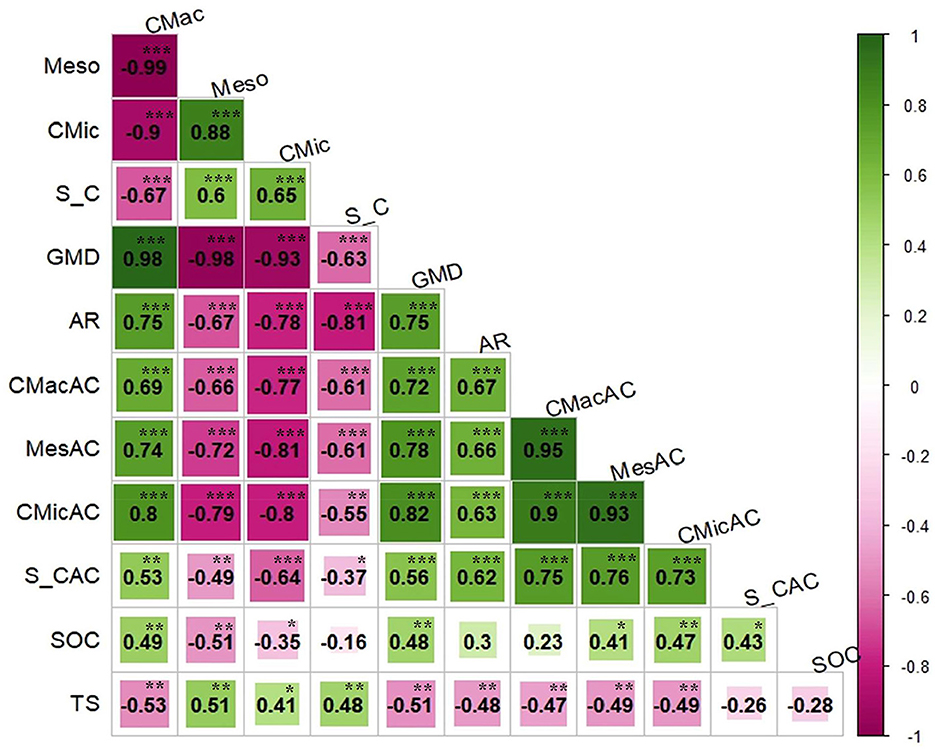
Figure 6. Impact of conservation agriculture practices on Pearson correlations between soil aggregate fractions, structural indices, aggregate-associated carbon content, bulk soil organic carbon content, and tensile strength of soil aggregates. *, **, and *** denote significance at 0.05, 0.01 and 0.001% levels, respectively. CMac, coarse macroaggregates; Meso, meso aggregates; CMic, coarse microaggregates; S + C, silt + clay fraction; GMD, geometric mean diameter; AR, aggregate ratio; CMacAC, coarse macroaggregate-associated carbon; MesoAC, meso aggregate-associated carbon; CMicAC, coarse microaggregate-associated carbon; S+CAC, silt+clay associated carbon; SOC, bulk soil organic carbon content; TS, tensile strength of soil aggregates.
3.8 Principal component analysis
Principal component analyses (Figure 7) were conducted for each of the cropping systems to identify suitable conservation management practices for individual cropping systems. Two principal components (PC) explained ~85.7, 84.6, and 91.6% of the total variance within the variables in RMuB, RWG, and RLF, respectively (Table 3). PCA further revealed that ZT-R2 performed better for each of the three cropping systems, as the majority of the variables were loaded significantly higher on ZT-R2 for each of the three cropping systems (Supplementary Figures 3–5), resulting in the highest corresponding score at PC1 in each case (Table 3). The RT–R2 showed the highest corresponding PCA score at PC2 for each cropping system.
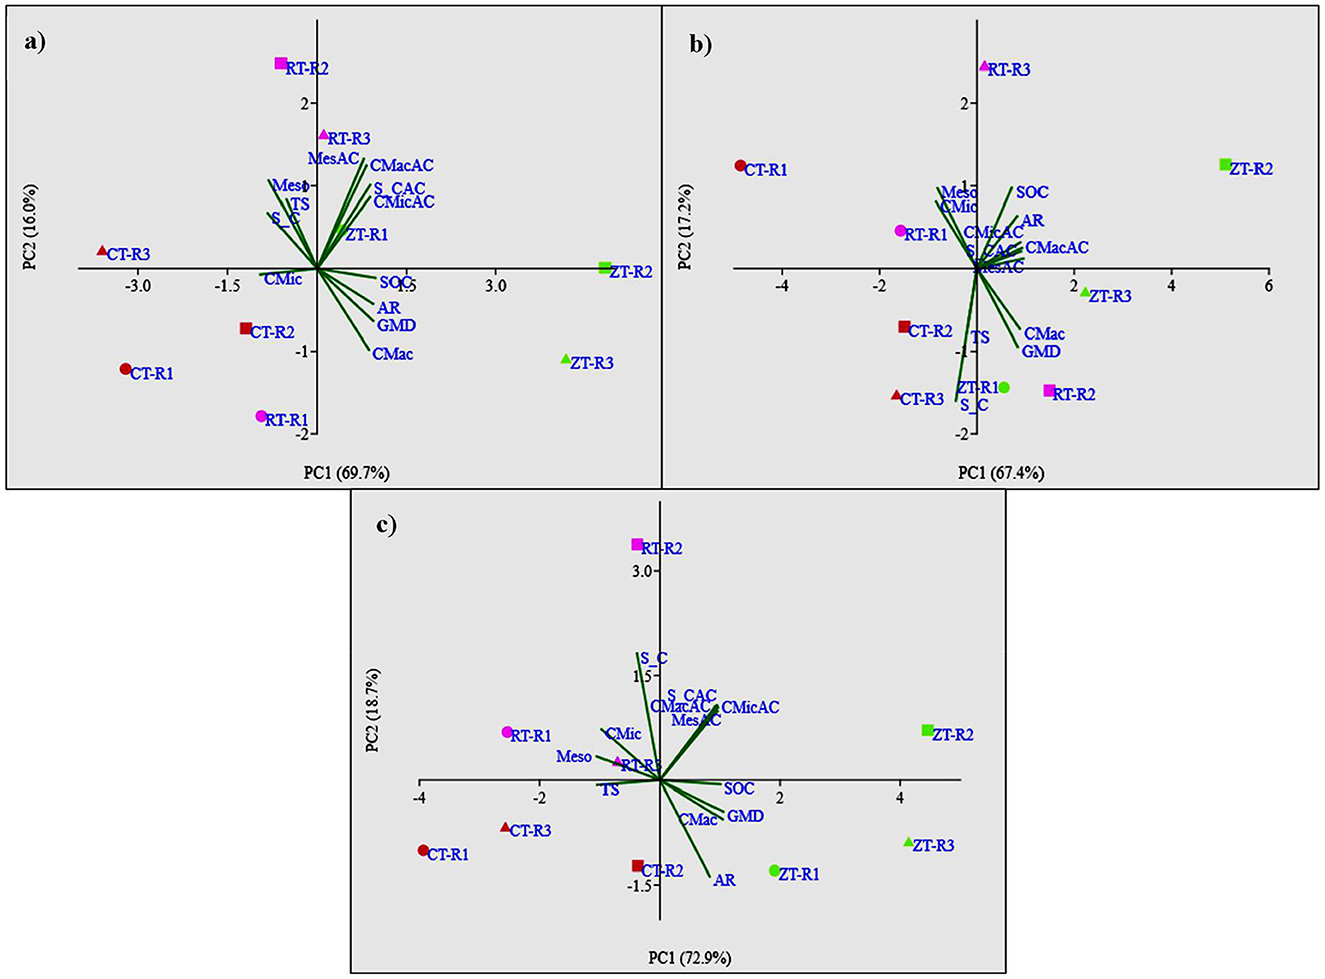
Figure 7. Biplot of principal component analysis of structural attributes of soil and carbon content of soil under (a) rice–mustard–black gram, (b) rice–wheat–green gram, and (c) rice–lentil–fallow cropping systems.
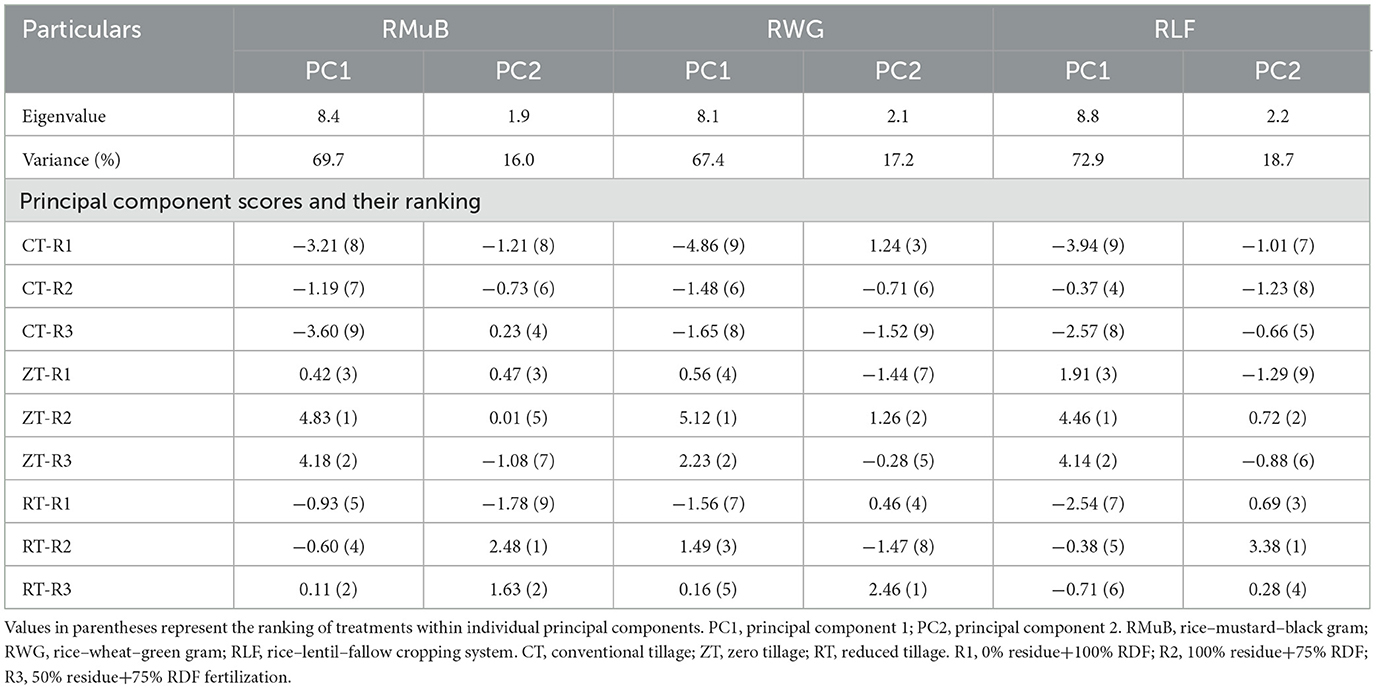
Table 3. Description of principal components and principal component scores from the correlation matrix under different treatments of tillage and residue management for three cropping systems (RMuB, RWG, and RLF).
Moreover, another PCA was conducted to identify the suitability of cropping systems (Figure 8), and visual observation of the PCA biplot indicated that SOC and other aggregate-associated organic carbon contents were highly correlated with RWG, whereas AR and CMac had higher loading in RLF.
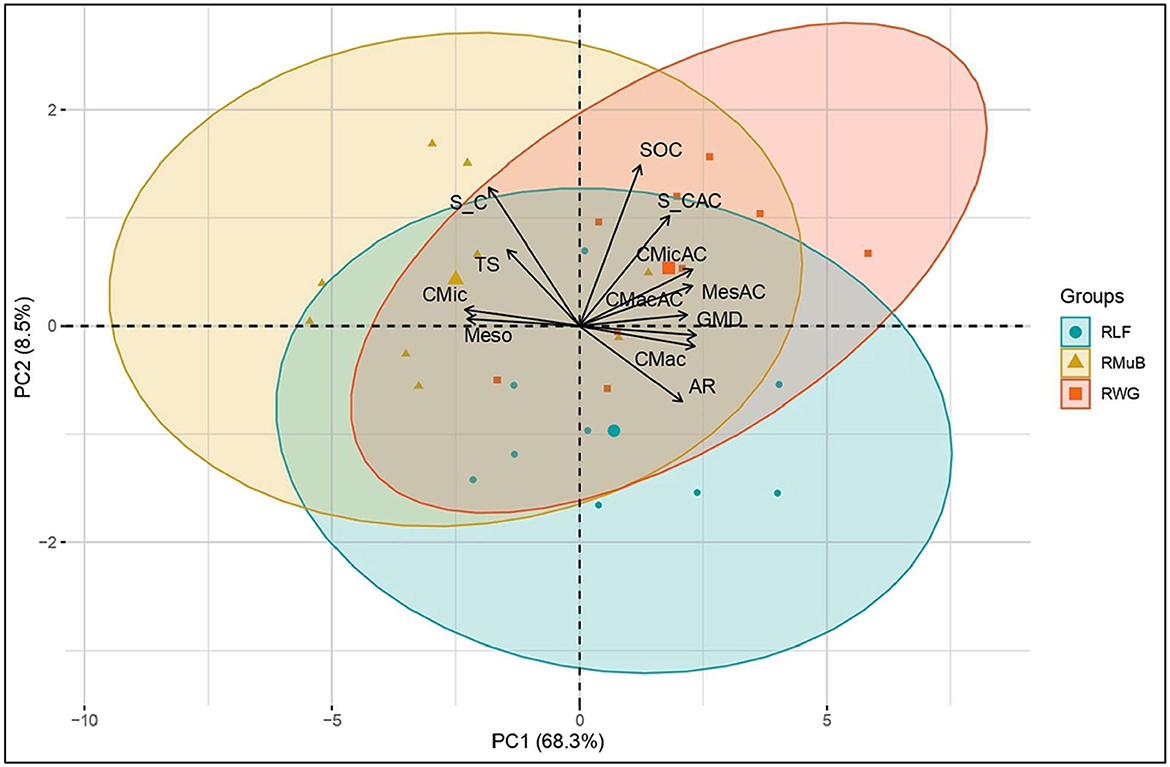
Figure 8. Biplot of principal component analysis describing the impact of cropping systems on structural attributes of soil and carbon content of soil.
4 Discussion
The amount and quality of water-stable soil aggregates pithily regulate soil productivity plus quality, being the pavement of soil structure, energy conservation, metabolism, and resilience (Zheng et al., 2018; Kundu et al., 2021). Our findings suggested that conservation agriculture practices (CA), even within a relatively short span of 3 years, promoted greater aggregate stability by retaining C mainly in the macroaggregate fractions of the surface soil. This experiment will provide knowledge for the better adoption of conservation agriculture practices at the regional level for achieving sustainability of rice-based cropping systems in heavy clayey soils of the lower Indo-Gangetic plains.
Our results demonstrated that, irrespective of the cropping system, an increased proportion of CMac was observed under CA practices, which was positively associated with enhanced aggregation indices such as geometric mean diameter (GMD) and aggregate ratio (AR) (Mondal et al., 2021). Other relatively smaller aggregate fractions (Meso, CMic, and S + C) were dominated under CT due to mechanical jeopardization of the soil. Our findings were consistent with earlier work by Nandan et al. (2019), who observed a 1.1 and 1.28 times hike in MWD, and a 1.4 times and 1.7 times hike in AR, due to residue retention and ZT over residue removal and CT plots, respectively, after 6 years of practice. Under CA practices, aggregate stability increases with increasing SOC as it acts as an aggregate binding agent. Retention of 100% rice residue resulted in the most impressive effect on the distribution of water-stable aggregates and aggregation indices (Li et al., 2019; Sharma et al., 2022). Addition of crop residue improves the aggregate stability in two separate ways, one by supplying carbon, which acts as an aggregate binding agents (namely, polysaccharides, humic substances, etc.) or acts as a hotspot of microbial activity, which impart beneficial consequences on soil structure (Choudhury et al., 2014). Literature suggests that biogenic agents are critical drivers of aggregate stabilization, especially in the early years of CA, as microbial exudates, fungal hyphae, and root-derived polysaccharides foster aggregate formation and stability (Baumert et al., 2021). Second, by providing protection against various disruptive forces (namely, rain splash, wind force, machinery, surface runoff, etc.) (Schmidt et al., 2018), moderated temperature-moisture fluctuations create favorable conditions for microbial binding agents. In our experiment, the second explanation holds good as a significant enhancement in structural indices was noticed without significant enrichment of SOC after residue retention. The non-significant impact of residue management on SOC might be due to (i) short-term (3 years) CA practice which did not provide the necessary time for decomposition of crop residues, (ii) residues retention of residues rather incorporation, (iii) heavy textural class of the experimental soil might subdue the effects of residue addition, (iv) reduced fertilization under residue retained plots. However, Oicha et al. (2010) observed that plant residue incorporation resulted in a significant hike in SOC under CA management in a short-term study (1 year) which leads to a greater (but non-significant) degree of soil aggregation in a heavy clayey soil (73% clay, 24% silt, and 3% sand).
Among the different cropping systems, cereal–cereal–legume-based RWG was reported to have better GMD and AR which was mainly due to higher SOC (Pi et al., 2019; Nandi et al., 2020). Zuber et al. (2015) reported significantly lower levels of water-stable aggregates due to the inclusion of oilseed in cereal-based crop rotation. The significant influence of crop rotation on SOC was most probably from the differences in underground biomass and contribution from leaf litter in short-term rotations (Dube et al., 2012). Cumulative carbon inputs (CCI) based on actual residue retention rates (100% in R2 and 50% in R3), root C, and rhizodeposition are provided in Table 4 and Supplementary Table 3. These added C inputs (up to 16.14 Mg ha−1) served as the primary organic input, and in conjunction with minimal soil disturbance under CA, enhanced macroaggregate formation and increased aggregate-associated carbon. This supports early-stage SOC stabilization via physical encapsulation and reduced decomposition, as reflected by improvements in GMD, AR, and PCA analysis, favoring ZT-R2 treatments. Notably, the RWC system recorded significantly the highest CCI (13.62 Mg ha−1), which was 1.3 times greater than RLF (10.6 Mg ha−1), primarily due to greater root biomass and rhizodeposition contributions (Table 4). Higher fibrous root biomass of cereal crops accounted for significantly higher rhizodeposition which possibly acted as temporary and transient binding agents (Tisdall and Oades, 1982), and ultimately triggered stable aggregate formation. Rasse et al. (2005) emphasized the relevance of C input from roots of component crops. They estimated that the root-derived C has 2.4 times the mean residence time of shoot-derived C. Thus, differences in component crop in rotation under CA also have the potential to impact SOC values over conventional practices and trigger stable aggregate formation. A significant positive correlation was also observed between SOC and CCI at each soil layer (Figures 9a, b), implying that enhanced C input contributes to SOC accumulation which improves aggregate stability. However, a relatively weaker positive correlation existed between SOC and geometric mean diameter (GMD) (significant only at the surface layer). This might be due to the short duration of the study, and stronger associations may emerge over a longer timescale (Parihar et al., 2020). Jahangir et al. (2021) reported significantly higher values of GMD due to the inclusion of wheat in the rice–rice cropping system over the inclusion of legume and mustard in rotation at the sub-tropical rice ecosystem of Bangladesh in a short-term study.
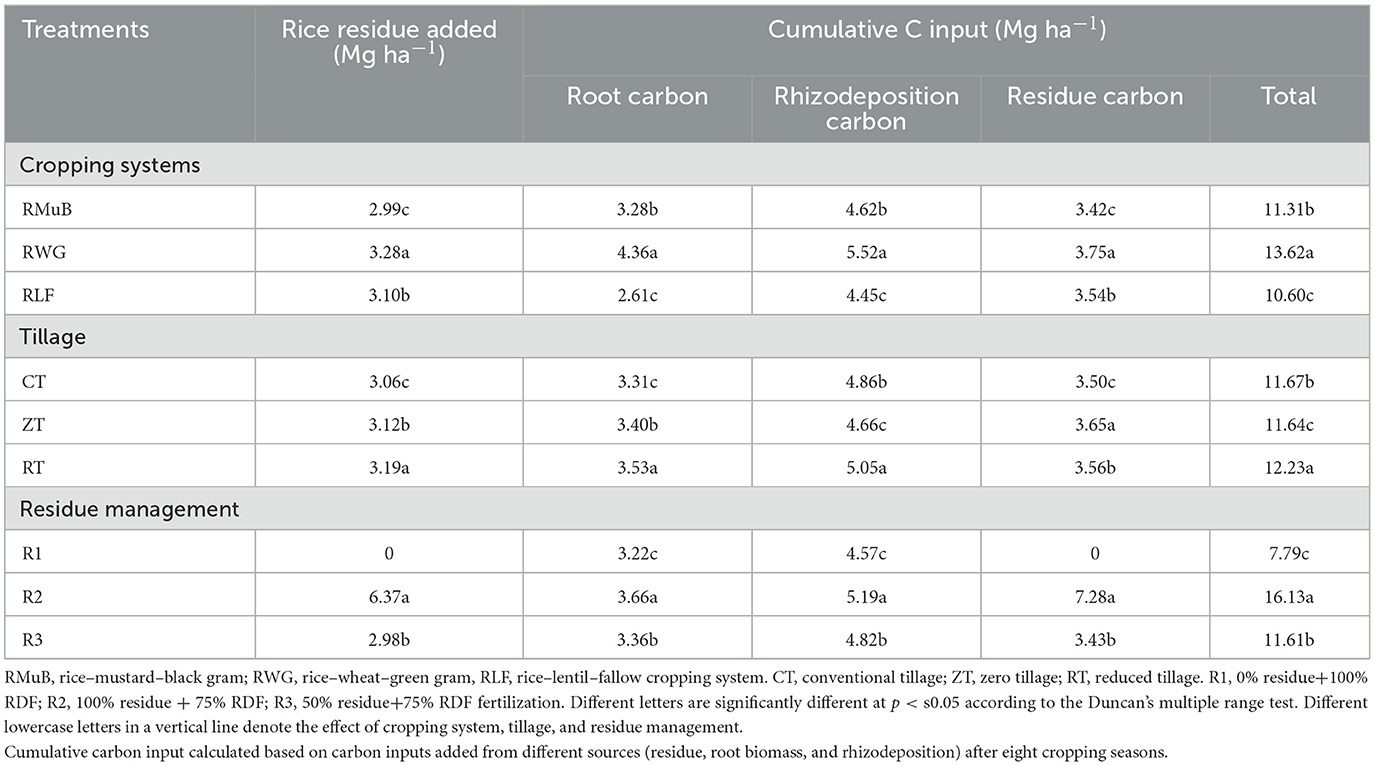
Table 4. Rice equivalent yield, cumulative crop residues recycled, and estimated carbon input from various sources.
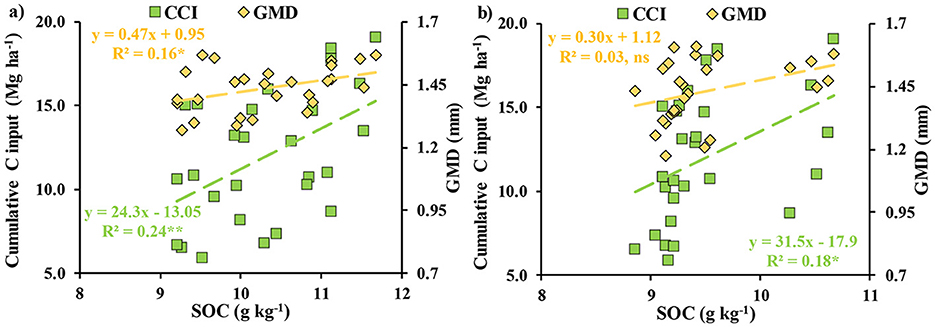
Figure 9. Relationship between oxidizable soil organic carbon, cumulative carbon inputs, and geometric mean diameter (a) at 0–10 cm and (b) 10–20 cm soil layer. * and ** denote significance at 0.05 and 0.01% levels, respectively. SOC, bulk soil organic carbon content; CCI, cumulative carbon inputs; GMD, geometric mean diameter; ns, non-significant.
TS, being a fundamental property of soil aggregates, is very sensitive to soil management, and we observed a trend under tillage systems of RT > CT > ZT (Abid and Lal, 2009). Jeopardization of soil leads to loss of SOC which hampers the stability of aggregates and as a result, higher TS was experienced. In clayey soils, high TS often translates to poor friability and restricted root penetration from an agronomic standpoint. Our results show that ZT, combined with residue retention, significantly reduced TS (up to 13% compared to CT), which implies improved soil workability and better seedling emergence. This is especially beneficial for intensive cropping in heavy clayey soils, where physical constraints often hinder crop establishment. The inverse correlation between CMacAC and TS further supports the role of SOC in improving aggregate friability under CA systems (Blanco-Canqui et al., 2005).
The concentrations of aggregate-associated C followed the order of S + CAC > CMicAC > MesoAC = CMacAC. The smallest particle size of “silt+ clay” fraction offers copious reactive sites within which C could be riveted through strong ligand exchange or polyvalent cation bridges (Majumder et al., 2007). Thus, greater surface area for S + C and their intimacy with decomposed C were accountable for sustaining a good amount of C. Accumulation of C in silt-clay fractions highlighted the importance of clay and aggregation in C sequestration and stabilization (Singh et al., 2018). However, the highest aggregate-associated C mass within coarse macroaggregates was encountered mainly due to two reasons. First, CA practices enhanced proportion of CMac from breaking down, and C was kept well protected within it. Second, the clay fraction itself acts as an aggregating agent, and heavy clayey soil accounts for a very high level of macroaggregates (Pinheiro et al., 2004). Transfer of C into the CMac mass was highest under ZT and lowest for CT, as CT hastens the oxidation of C by destroying the macroaggregates (Guo et al., 2013). Higher concentration of aggregated associated C under straw-retained plots of ZT/RT treatments in the surface layer may be related to the interactive effect of tillage and straw returning (Gathala et al., 2015). The relationship between CCI and aggregate-associated C across different aggregate size fractions of the 0–10 cm soil layer revealed a significant positive linear trend at each aggregate size class (Figure 10a). In contrast, the trend was weaker in the 10–20 cm layer (Figure 10b), indicating reduced sensitivity at the subsurface soil. Principal component analysis revealed that practicing ZT with 100% rice-residue retention was conducive to stable aggregate formation, as the majority of the structural attributes of experimental soil were positively influenced, irrespective of the cropping systems. Further, PCA demonstrated the importance of the inclusion of another cereal (wheat) into rice-based cropping systems which triggers the formation of water-stable aggregates in heavy clayey soils of the lower Indo-Gangetic plains.
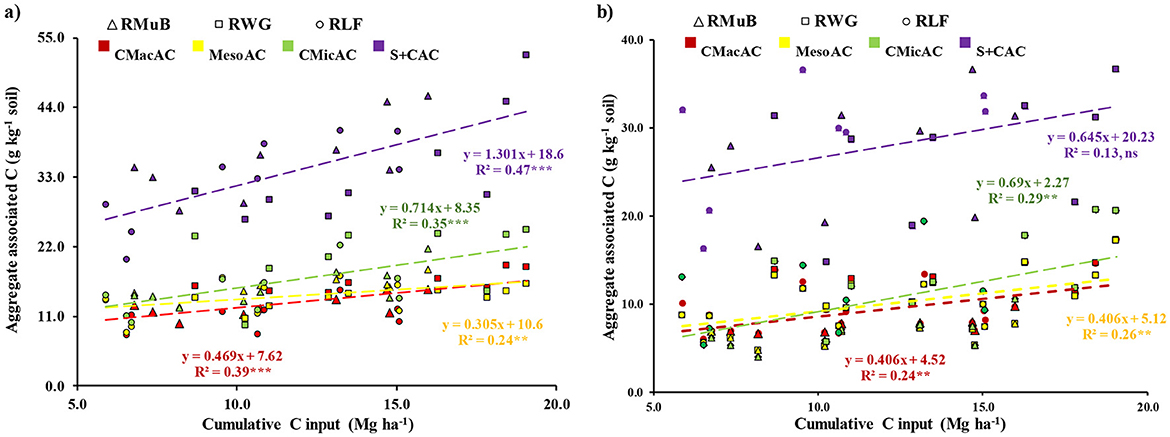
Figure 10. Relationship between aggregate-associated carbon of different-sized aggregates and cumulative carbon inputs across three cropping systems (a) at 0–10 cm and (b) 10–20 cm soil layer. *, ** and *** denote significance at 0.05, 0.01, and 0.001% levels, respectively. CMac, coarse macroaggregates, Meso, meso aggregates; CMic, coarse microaggregates; S + C, silt + clay fraction; GMD, geometric mean diameter; AR, aggregate ratio; CMacAC, coarse macroaggregate-associated carbon; MesoAC, meso aggregate-associated carbon; CMicAC, coarse microaggregate-associated carbon; S + CAC, silt+clay-associated carbon; RMuB, rice–mustard–black gram; RWG, rice–wheat–green gram; RLF, rice–lentil—fallow cropping system.
5 Conclusion
The results clearly indicated that conservation agriculture practices exerted a net positive influence on soil aggregation and aggregate stability, thereby contributing to an increase in soil organic carbon content in the clay-rich soils of the lower Indo-Gangetic Plains. Minimum soil disturbance combined with residue retention increased the amount of C retained within the macro- and microaggregates of surface soil and thereby offered a higher level of structural stability. Although the concentration of aggregate-associated carbon was highest for the silt + clay fraction, the highest mass of aggregate-associated C was noticed in the case of the coarse macroaggregate-associated fraction. Zero tillage with 100% rice residue retention and 75% RDF fertilization has been proven to be the best conservation practice for maintaining structural attributes of soil. Moreover, the inclusion of wheat in a rice–legume cropping sequence provided better aggregate stability and associated carbon due to higher underground biomass and rhizodeposition. However, these short-term (3-year) findings may not fully capture long-term trends in soil carbon dynamics and aggregate stability. Furthermore, only rice residue was retained, and that was also limited to the surface, which may have limited the potential carbon enrichment in deeper layers of soil. Integrating both reduced RDF and residue retention as sub–sub plot treatment made it difficult to explicitly identify the individual effects of these two factors. Despite these constraints, current study will contribute practical insights for global agricultural community and encourage the adoption of conservation agriculture in rice-based cropping systems of this region. Future research should focus on a long-term monitoring involving diverse agroecological zones, deeper soil layers, and alternative residue incorporation strategies to capture the whole trajectory of organic carbon stabilization in very fine-textured soil to further validate the scalability and robustness of these findings.
Data availability statement
The datasets presented in this study can be found in online repositories. The names of the repository/repositories and accession number(s) can be found in the article/Supplementary material.
Author contributions
AK: Visualization, Conceptualization, Software, Writing – original draft, Investigation, Resources, Writing – review & editing, Formal analysis, Methodology, Data curation. JD: Methodology, Data curation, Investigation, Formal analysis, Writing – original draft. SM: Formal analysis, Data curation, Writing – review & editing, Methodology, Conceptualization. RN: Investigation, Data curation, Formal analysis, Writing – review & editing, Methodology. SS: Data curation, Investigation, Formal analysis, Writing – review & editing. PB: Supervision, Writing – review & editing, Investigation, Software, Data curation, Resources, Validation, Project administration, Methodology, Visualization, Conceptualization. SS: Writing – review & editing, Conceptualization, Software, Methodology, Data curation.
Funding
The author(s) declare that no financial support was received for the research and/or publication of this article.
Acknowledgments
The authors acknowledge the Centre for Advanced Agricultural Science and Technology (CAAST) on Conservation Agriculture, funded by World Bank and the Government of India (NAHEP-ICAR) for providing infrastructure and monetary funding for conducting the field trial and laboratory analysis. Further, the first author would like to thank University Grants Commission for providing the Junior Research Fellowship in this research programme.
Conflict of interest
The authors declare that the research was conducted in the absence of any commercial or financial relationships that could be construed as a potential conflict of interest.
Generative AI statement
The author(s) declare that no Gen AI was used in the creation of this manuscript.
Publisher's note
All claims expressed in this article are solely those of the authors and do not necessarily represent those of their affiliated organizations, or those of the publisher, the editors and the reviewers. Any product that may be evaluated in this article, or claim that may be made by its manufacturer, is not guaranteed or endorsed by the publisher.
Supplementary material
The Supplementary Material for this article can be found online at: https://www.frontiersin.org/articles/10.3389/fsufs.2025.1622985/full#supplementary-material
References
Abid, M., and Lal, R. (2009). Tillage and drainage impact on soil quality: II. Tensile strength of aggregates, moisture retention and water infiltration. Soil Tillage Res. 103, 364–372. doi: 10.1016/j.still.2008.11.004
Amin, M. S., Khan, M. Z., Laskar, T., and Rabbi, S. M. F. (2020). Carbon sequestration in soil aggregates under different cropping patterns of Bangladesh. Open J Soil Sci. 10:459. doi: 10.4236/ojss.2020.1010024
Barreto, R. C., Madari, B. E., Maddock, J. E. L., Machado, P., Tortes, E., Franchini, J., et al. (2009). The impact of soil management on aggregation, carbon stabilization and carbon loss as CO2 in the surface layer of a Rhodic Ferralsol in Southern Brazil. Agric. Ecosyst. Environ. 132, 243–251. doi: 10.1016/j.agee.2009.04.008
Baumert, V. L., Forstner, S. J., Zethof, J. H., Vogel, C., Heitkötter, J., Schulz, S., et al. (2021). Root-induced fungal growth triggers macroaggregation in forest subsoils. Soil Biol. Biochem. 157:108244. doi: 10.1016/j.soilbio.2021.108244
Blanco-Canqui, H., Lal, R., Owens, L. B., Post, W. M., and Izaurralde, R. C. (2005). Mechanical properties and soil organic carbon of soil aggregates in the northern Appalachians. Soil Sci. Soc. Am. J. 69, 1472–1481. doi: 10.2136/sssaj2004.0356
Bronson, K. F., Cassman, K. G., Wassmann, R., Olk, D. C., Van Noordwijk, M., Garrity, D. P., et al. (1997). “Soil carbon dynamics in different cropping systems in principal ecoregions of Asia,” in Management of Carbon Sequestration in Soil, eds. R. Lal, J. M. Kimble, R. F. Follett, and B. A. Stewart (CRC, Boca Raton, NY: CRC Press), 35–37.
Choudhury, S. G., Srivastava, S., Singh, R., Chaudhari, S. K., Sharma, D. K., Singh, S. K., et al. (2014). Tillage and residue management effects on soil aggregation, organic carbon dynamics and yield attribute in rice-wheat cropping system under reclaimed sodic soil. Soil Tillage Res. 136, 76–83. doi: 10.1016/j.still.2013.10.001
Dexter, A. R., and Kroesbergen, B. (1985). Methodology for determination of tensile strength of soil aggregates. J. Agric. Eng. Res. 31, 139–147. doi: 10.1016/0021-8634(85)90066-6
Dube, E., Chiduza, C., and Muchaonyerwa, P. (2012). Conservation agriculture effects on soil organic matter on a haplic cambisol after four years of maize-oat and maize-grazing vetch rotations in South Africa. Soil Tillage Res. 123, 21–28. doi: 10.1016/j.still.2012.02.008
FAO (2008). Investing in Sustainable Agricultural Intensification. The Role of Conservation Agriculture-a Framework for Action. Rome: Food and Agriculture Organization of the United Nations. Available online at: http://www.fao.org/ag/ca/doc/proposed_framework.pdf (Accessed August, 2022).
Gan, Y. T., Campbell, C. A., Janzen, H. H., Lemke, R. L., Basnyat, P., McDonald, C. L., et al. (2009). Carbon input to soil from oilseed and pulse crops on the Canadian prairies. Agr. Ecosyst. Environ. 132, 290–297. doi: 10.1016/j.agee.2009.04.014
Gathala, M. K., Timsina, J., Islam, M. S., Rahman, M., Hossain, M. M., Harun-Ar-Rashid, I., et al. (2015). Conservation agriculture based tillage and crop establishment options can maintain farmers' yields and increase profits in South Asia's rice-maize systems: evidence from Bangladesh. Field Crops Res. 172, 85–98. doi: 10.1016/j.fcr.2014.12.003
Guggenberger, G., Frey, S. D., Six, J., Paustian, K., and Elliott, E. T. (1999). Bacterial and fungal cell-wall residues in conventional and no-tillage agroecosystems. Soil Sci. Soc. Am. J. 63, 1188–1198. doi: 10.2136/sssaj1999.6351188x
Guo, D., Li, X., Li, X., Wang, J., and Fu, H. (2013). Conventional tillage increases soil microbial biomass and activity in the Loess Plateau, China. Acta Agric. Scand. B - Soil Plant Sci. 63, 489–496. doi: 10.1080/09064710.2013.807356
Haynes, R. J., and Francis, G. S. (1993). Changes in microbial biomass C, soil carbohydrate composition and aggregate stability induced by growth of selected crop and forage species under field conditions. Eur. J. Soil Sci. 44, 665–675. doi: 10.1111/j.1365-2389.1993.tb02331.x
He, J., Wang, Q. J., Li, H. W., Tullberg, J. N., McHugh, A. D., Bai, Y. H., et al. (2009). Soil physical properties and infiltration after long-term no-tillage and ploughing on the Chinese Loess Plateau. N. Z. J. Crop Hortic. Sci. 37, 157–166. doi: 10.1080/01140670909510261
Hobbs, P. R. (2021). “Tillage and crop establishment in South Asian rice-wheat systems: present practices and future options,” in The Rice-Wheat Cropping System of South Asia: Efficient Production Management, eds. P. Kataki, and S. C. Babu (CRC Press), 1–22. doi: 10.1201/9781003210658-1
Huang, T., Yang, H., Huang, C., and Ju, X. (2018). Effects of nitrogen management and straw return on soil organic carbon sequestration and aggregate-associated carbon. Eur. J. Soil Sci. 69, 913–923. doi: 10.1111/ejss.12700
Islam, M. A., Bell, R. W., Johansen, C., Jahiruddin, M., Haque, M. E., Vance, W., et al. (2022). Conservation agriculture practice influences soil organic carbon pools in intensive rice-based systems of the Eastern Indo-Gangetic plain. Soil Use Manage. 38, 1217–1236. doi: 10.1111/sum.12798
Jahangir, M. M., Jahiruddin, M., Akter, H., Pervin, R., and Islam, K. R. (2021). Cropping diversity with rice influences soil aggregate formation and nutrient storage under different tillage systems. J. Plant Nutr. Soil Sci. 184, 150–162. doi: 10.1002/jpln.202000310
Kemper, W. D., and Rosenau, R. C. (1986). “Aggregate stability and size distribution,” in Methods of Soil Analysis. Part 1, ed. A. Klute (Madison, WI: ASA and SSSA), 425–444. doi: 10.2136/sssabookser5.1.2ed.c17
Kundu, A., Mukherjee, S., Nandi, R., and Bandyopadhyaya, P. K. (2021). “Conservation agriculture-an approach towards sustainability of soil physical health,” in Conservation Agriculture and Climate Change: Impacts and Adaptations, eds. R. Saha, D. Barman, and M. Behera (New Delhi: New India Publishing Agency), 283–307. doi: 10.1201/9781003364665-22
Li, Y., Li, Z., Chang, S. X., Cui, S., Jagadamma, S., Zhang, Q., et al. (2020). Residue retention promotes soil carbon accumulation in minimum tillage systems: implications for conservation agriculture. Sci. Total Environ. 740:140147. doi: 10.1016/j.scitotenv.2020.140147
Li, Y., Li, Z., Cui, S., Jagadamma, S., and Zhang, Q. (2019). Residue retention and minimum tillage improve physical environment of the soil in croplands: a global meta-analysis. Soil Tillage Res. 194:104292. doi: 10.1016/j.still.2019.06.009
Majumder, B., Mandal, B., Bandyopadhyay, P. K., and Chaudhury, J. (2007). Soil organic carbon pools and productivity relationships for a 34-year-old rice-wheat-jute agroecosystem under different fertilizer treatments. Plant Soil 297, 53–67. doi: 10.1007/s11104-007-9319-0
Matsumoto, N., Nobuntou, W., Punlai, N., Sugino, T., Rujikun, P., Luanmanee, S., et al. (2021). Soil carbon sequestration on a maize-mung bean field with rice straw mulch, no-tillage, and chemical fertilizer application in Thailand from 2011 to 2015. Soil Sci. Plant Nutr. 67, 190–196. doi: 10.1080/00380768.2020.1857660
Mishra, A. K., Shinjo, H., Jat, H. S., Jat, M. L., Kumar Jat, R., Funakawa, S., et al. (2024). Conservation agriculture enhances crop productivity and soil carbon fractions in Indo-Gangetic Plains of India. Front. Sustain. Food Syst. 8:1476292. doi: 10.3389/fsufs.2024.1476292
Modak, K., Biswas, D. R., Ghosh, A., Pramanik, P., Das, T. K., Das, S., et al. (2020). Zero tillage and residue retention impact on soil aggregation and carbon stabilization within aggregates in subtropical India. Soil Till. Res. 202:104649. doi: 10.1016/j.still.2020.104649
Mondal, S., Mishra, J. S., Poonia, S. P., Kumar, R., Dubey, R., Kumar, S., et al. (2021). Can yield, soil C and aggregation be improved under long-term conservation agriculture in the eastern Indo-Gangetic plain of India? Eur. J. Soil Sci. 72, 1742–1761. doi: 10.1111/ejss.13092
Nandan, R., Singh, V., Singh, S. S., Kumar, V., Hazra, K. K., Nath, C. P., et al. (2019). Impact of conservation tillage in rice-based cropping systems on soil aggregation, carbon pools and nutrients. Geoderma 340, 104–114. doi: 10.1016/j.geoderma.2019.01.001
Nandi, R., Mukherjee, S., Ghatak, P., Kundu, A., Mukherjee, D., Bandyopadhyay, P. K., et al. (2020). Aggregates characterization and its associated organic carbon in two contrasting lowland rice soils of West Bengal. Int. J. Environ. Clim. Chang. 10, 14–23. doi: 10.9734/ijecc/2020/v10i430191
Nisar, S., and Benbi, D. K. (2024). Tillage and mulching effects on carbon stabilization in physical and chemical pools of soil organic matter in a coarse textured soil. Geoderma Reg. 38:e00827. doi: 10.1016/j.geodrs.2024.e00827
Oicha, T., Cornelis, W. M., Verplancke, H., Nyssen, J., Govaerts, B., Behailu, M., et al. (2010). Short-term effects of conservation agriculture on Vertisols under tef (Eragrostis tef (Zucc.) Trotter) in the northern Ethiopian highlands. Soil Tillage Res. 106, 294–302. doi: 10.1016/j.still.2009.12.004
Palm, C., Blanco-Canqui, H., DeClerck, F., Gatere, L., and Grace, P. (2014). Conservation agriculture and ecosystem services: an overview. Agric. Ecosyst. Environ. 187, 87–105. doi: 10.1016/j.agee.2013.10.010
Parihar, C. M., Singh, A. K., Jat, S. L., Dey, A., Nayak, H. S., Mandal, B. N., et al. (2020). Soil quality and carbon sequestration under conservation agriculture with balanced nutrition in intensive cereal-based system. Soil Tillage Res. 202:104653. doi: 10.1016/j.still.2020.104653
Pi, H., Huggins, D. R., and Sharratt, B. (2019). Dry aggregate stability of soils influenced by crop rotation, soil amendment, and tillage in the Columbia plateau. Aeolian Res. 40, 65–73. doi: 10.1016/j.aeolia.2019.07.001
Pinheiro, E. F. M., Pereira, M. G., and Anjos, L. H. C. (2004). Aggregate distribution and soil organic matter under different tillage systems for vegetable crops in a red Latosol from Brazil. Soil Tillage Res. 77, 79–84. doi: 10.1016/j.still.2003.11.005
Rasse, D. P., Rumpel, C., and Dignac, M. F. (2005). Is soil carbon mostly root carbon? Mechanisms for a specific stabilization. Plant Soil 269, 341–356. doi: 10.1007/s11104-004-0907-y
Rieke, E. L., Bagnall, D. K., Morgan, C. L., Flynn, K. D., Howe, J. A., Greub, K. L., et al. (2022). Evaluation of aggregate stability methods for soil health. Geoderma 428:116156. doi: 10.1016/j.geoderma.2022.116156
Roy, D., Kundu, R., Ghosh, S., Datta, A., Mandal, B., Sharma, S., et al. (2024). Early-stage soil organic carbon stabilization in conservation agriculture-based cereal systems. Geoderma Reg. 39:e00870. doi: 10.1016/j.geodrs.2024.e00870
Schmidt, E. S., Villamil, M. B., and Amiotti, N. M. (2018). Soil quality under conservation practices on farm operations of the southern semiarid pampas region of Argentina. Soil Tillage Res. 176, 85–94. doi: 10.1016/j.still.2017.11.001
Shamoot, S., McDonald, L., and Bartholomew, W. V. (1968). Rhizo-deposition of organic debris in soil. Soil Sci. Soc. Am. J. 32, 817–820. doi: 10.2136/sssaj1968.03615995003200060031x
Sharma, S., Kaur, S., Parkash Choudhary, O., Singh, M., Al-Huqail, A. A., Ali, H. M., et al. (2022). Tillage, green manure and residue retention improves aggregate-associated phosphorus fractions under rice-wheat cropping. Sci. Rep. 12:7167. doi: 10.1038/s41598-022-11106-x
Singh, M., Sarkar, B., Sarkar, S., Churchman, J., Bolan, N., Mandal, S., et al. (2018). Stabilization of soil organic carbon as influenced by clay mineralogy. Adv. Agron. 148, 33–84. doi: 10.1016/bs.agron.2017.11.001
Six, J., Elliott, E. T., and Paustian, K. (2000). Soil macroaggregate turnover and microaggregate formation: a mechanism for C sequestration under no-tillage agriculture. Soil Biol. Biochem. 32, 2099–2103. doi: 10.1016/S0038-0717(00)00179-6
Six, J., Feller, C., Denef, K., Ogle, S. M., de Moraes Sa, J. C., and Albrecht, J. C. (2002). Soil organic matter, biota and aggregation in temperate and tropical soils-effects of no-tillage. Agronomie 22, 755–775. doi: 10.1051/agro:2002043
Slater, K. (2015). The Influence of Legume and Below-Ground Carbon and Nitrogen Inputs in Pulsecrop Rotations. Saskatoon: University of Saskatchewan.
Srinivasarao, C., Kundu, S., Kumpawat, B. S., Kothari, A. K., Sodani, S. N., Sharma, S. K., et al. (2019). Soil organic carbon dynamics and crop yields of maize (Zea mays)-black gram (Vigna mungo) rotation-based long term manurial experimental system in semi-arid Vertisols of western India. Trop. Ecol. 60, 433–446. doi: 10.1007/s42965-019-00044-x
Srinivasarao, C., Venkateswarlu, B., Lal, R., Singh, A. K., Vittal, K. P. R., Kundu, S., et al. (2012). Long-term effects of soil fertility management on carbon sequestration in a rice-lentil cropping system of the indo-gangetic plains. Soil Sci. Soc. Am. J. 76, 168–178. doi: 10.2136/sssaj2011.0184
Tisdall, J. M., and Oades, J. M. (1982). Organic matter and water-stable aggregates in soils. Eur. J. Soil Sci. 33, 141–163. doi: 10.1111/j.1365-2389.1982.tb01755.x
Walkley, A., and Black, I. A. (1934). An examination of the Degjareff method for determining soil organic matter and a proposed modification of the chromic acid titration method. Soil Sci. 37, 29–38. doi: 10.1097/00010694-193401000-00003
Xie, J., Hou, M., Zhou, Y., Wang, R., Zhang, S., Yang, X., et al. (2017). Carbon sequestration and mineralization of aggregate-associated carbon in an intensively cultivated Anthrosol in north China as affected by long term fertilization. Geoderma 296, 1–9. doi: 10.1016/j.geoderma.2017.02.023
Zheng, H., Liu, W., Zheng, J., Luo, Y., Li, R., Wang, H., et al. (2018). Effect of long-term tillage on soil aggregates and aggregate-associated carbon in black soil of Northeast China. PLoS ONE 13:e0199523. doi: 10.1371/journal.pone.0199523
Keywords: conservation agriculture, clayey soil, rice-based cropping system, soil structure, aggregate associated carbon
Citation: Kundu A, Dey Sarkar J, Mukherjee S, Nandi R, Saha S, Bandyopadhyay PK and Sharma S (2025) Impact of different cropping systems on structural attributes and aggregate-associated carbon dynamics of clayey soil under conservation agriculture. Front. Sustain. Food Syst. 9:1622985. doi: 10.3389/fsufs.2025.1622985
Received: 05 May 2025; Accepted: 11 July 2025;
Published: 01 August 2025.
Edited by:
Biplab Mitra, Uttar Banga Krishi Viswavidyalaya, IndiaReviewed by:
Dibakar Roy, National Bureau of Soil Survey and Land Use Planning (ICAR), IndiaAbhik Patra, Banaras Hindu University, India
Copyright © 2025 Kundu, Dey Sarkar, Mukherjee, Nandi, Saha, Bandyopadhyay and Sharma. This is an open-access article distributed under the terms of the Creative Commons Attribution License (CC BY). The use, distribution or reproduction in other forums is permitted, provided the original author(s) and the copyright owner(s) are credited and that the original publication in this journal is cited, in accordance with accepted academic practice. No use, distribution or reproduction is permitted which does not comply with these terms.
*Correspondence: Arnab Kundu, ZHIuYXJuYWJAcnBjYXUuYWMuaW4=; Jayashree Dey Sarkar, ZGV5c2Fya2FyamF5YXNocmVlMUBnbWFpbC5jb20=
†These authors have contributed equally to this work and share first authorship