 Yue Ma
 Kaiyue Zhang1
- 1College of Resources and Environment, Qingdao Agricultural University, Qingdao, China
- 2Academy of Dongying Efficient Agricultural Technology and Industry on Saline and Alkaline Land in Collaboration with Qingdao Agricultural University, Dongying, China
Introduction: Soil salinity in the Yellow River Delta exhibits seasonal dynamics, with desalination in October (low-salt period) and salinity return in April (high-salt period).
Methods: This study quantified the spatiotemporal variations in soil salinity, alkaline nitrogen (AN), available phosphorus (AP), and available potassium (AK) in mild saline soils (0-20 cm depth) at a 72.3 hm2 farm scale using grid sampling, classical statistics, and geostatistics (semi-variance analysis, ordinary kriging)
Results: The key results showed that the mean soil salinity was higher in April than in October; all indices displayed moderate variability, where the coefficient of variation (CV) of salinity was higher in October than in April, while the CV values of AN, AP, and AK were lower in October than in April; salinity (in both periods), AK (in both periods), and AP (in October) exhibited weak spatial dependence (C0/(C0+C) > 75%) under the influence of random factors, and AN (in both periods) and AP (in April) showed moderate spatial dependence (25% < C0/(C0+C) < 75%) driven by both structural and random factors. Spatial distribution maps revealed patchy patterns, with salinity, AN, and AP contents being higher at field edges. In October, except for the southern part with high AK content, the AK content at the edges was lower than that in the central area; in April, AK was distributed in rings, and its content generally increased from the middle to the four sides.
Discussion: These high-resolution farm-scale study results provide data support for precise nutrient management of saline soils during low-salinity and high-salinity periods.
1 Introduction
The yield of crops depends on the abundance and deficiency of soil nutrients. Under the influence of structural factors and random factors, such as climate, parent material, topography biology, fertilization and irrigation, even in the same field, soil nutrients have different spatial heterogeneity, and the spatial distribution characteristics of soil nutrients are also significantly different (Ye, 2014). Soil nutrients are essential to the development of modern healthy agriculture. More and more people are concerned about the spatial distribution of soil nutrients (Xie, 2020). Studying soil nutrients in cultivated land is of great significance for nutrient management and fertilization decisions (Wang et al., 2015; Gogoi et al., 2021).
The content of soil salt plays a key role in plant growth, directly affects the composition and physiological ability of plant communities, and determines the structure, function and productivity level of ecosystems (Gu et al., 2016). The spatial variability of soil salinity is an important natural attribute of soil. In-depth study can not only find out the degree and state of soil salinization in the soil tillage layer (Wang et al., 2019)., but also more comprehensively understand the spatial distribution characteristics of soil salinity. High soil salt content affects the absorption and utilization of plant nutrients (Gorji et al., 2015), and limits soil fertility.
Geostatistical methods, particularly kriging, have been widely employed to analyze the spatial variability of soil properties due to their ability to account for spatial autocorrelation and provide unbiased estimates with minimized prediction error (Goovaerts, 1997). Unlike deterministic interpolation methods such as inverse distance weighting (IDW) or splines, which rely solely on geometric proximity, kriging utilizes a variogram model to quantify the spatial structure of the variable of interest. This allows kriging to not only predict values at unsampled locations but also quantify the uncertainty associated with these predictions (Webster and Oliver, 2008). The development of a variogram involves modeling the spatial dependence using functions such as spherical, exponential, or Gaussian, which are selected based on criteria like the residual sum of squares (RSS) and coefficient of determination (R2). Validation is typically performed using cross-validation to ensure model robustness. Compared to IDW, kriging provides more accurate and less smoothed spatial predictions, especially when data exhibit strong spatial structure (Li and Heap, 2011).
Many scholars studied the spatial variability of soil nutrients and salt by combining geostatistics and other methods they found that it is closely related to natural factors and human factors (Wang et al., 2021; Karunaratne et al., 2014; Bocchi et al., 2000). Many scholars mostly studied the spatial distribution characteristics of farmland soil nutrients and salt at the county level and above, while few studies analyzed the characteristics of farmland soil nutrients and salt at the farm level. Large-scale soil properties can reveal the spatial variation of soil spatial distribution characteristics in the study area, which is of great significance to improve the quality of soil mapping and soil digitalization (Feng et al., 2023; Duan et al., 2022; Wang et al., 2022). Research on the mesoscale level can improve the soil nutrient management space, establish a soil nutrient management information system, and provide data support. The size of evaluation unit directly affects the accuracy of soil quality evaluation, and the smaller the evaluation unit, the higher the accuracy of evaluation results (Wu et al., 2009). Addressing the limitations of existing research that primarily focuses on county-level or higher scales, this farm-scale approach provides high-resolution data support for precision agriculture, helping to effectively reduce resource waste and enhance crop yields (Guo et al., 2015). The spatial variation structure of soil salinity reflects the changing law of autocorrelation of salinization degree with spatial scale, which is crucial for regional salinization treatment and farmland protection.
This study systematically investigated soil salinity and AN, AP, and AK content at the farm scale during low-salinity and high-salinity phases, along with their spatial distribution patterns. By analyzing dynamic changes in soil salinity and nutrients during these two phases, the research revealed spatiotemporal evolution patterns of soil composition, breaking through the constraints of single-phase studies.
2 Materials and methods
2.1 Overview of the study area
East of Dongying City, Shandong Province (118°15′ ~ 119°19′E, 37°24′ ~ 38°10′N) the Yellow River is injected into the Bohai Sea from this area, and the topography of the study area is mainly formed by the Yellow River siltation retreating to the sea, due to the history of the Yellow River coccyx section often swayed from side to side, and many times ulceration, overflowing, flooding, and other alluvial and siltation pads, and thus the formation of typical deltaic geomorphology (Luo and Liu, 2024). Located in the monsoon area of the east coast of China, the strong evaporation causes rapid loss of soil moisture, while at the same time, groundwater is continuously replenished, forming the dynamic conditions for upward migration of water and salt. Under the continuous evaporation of water, the soluble salts in soil and groundwater continuously converge to the soil surface, greatly accelerating the process of land salinization (Zhou et al., 2022). The main crops are corn and wheat. The soil parent material is the alluvium of the Yellow River, and the texture is mainly silt, silty loam and sandy loam.
2.2 Sampling method
This study takes the Academy of Dongying Efficient Agricultural Technology and Industry on Saline as the research area (an area of 72.3 hm2) (Figure 1). The density of sampling points has a direct effect on the test accuracy and is related to the size of the region (Wang et al., 2022; Sun et al., 2023; Xue et al., 2023), Based on previous research results, 278 soil sampling points were collected in October 2020 and April 2021 with a grid density of 50 m × 50 m. Each point is collected according to the 5-point mixed sampling method to collect 0–20 cm soil samples. During sampling, latitude and longitude at different points were recorded using GPS. The soil samples are dried naturally under atmospheric conditions; then weighed and ground to form air-dried fine soil.
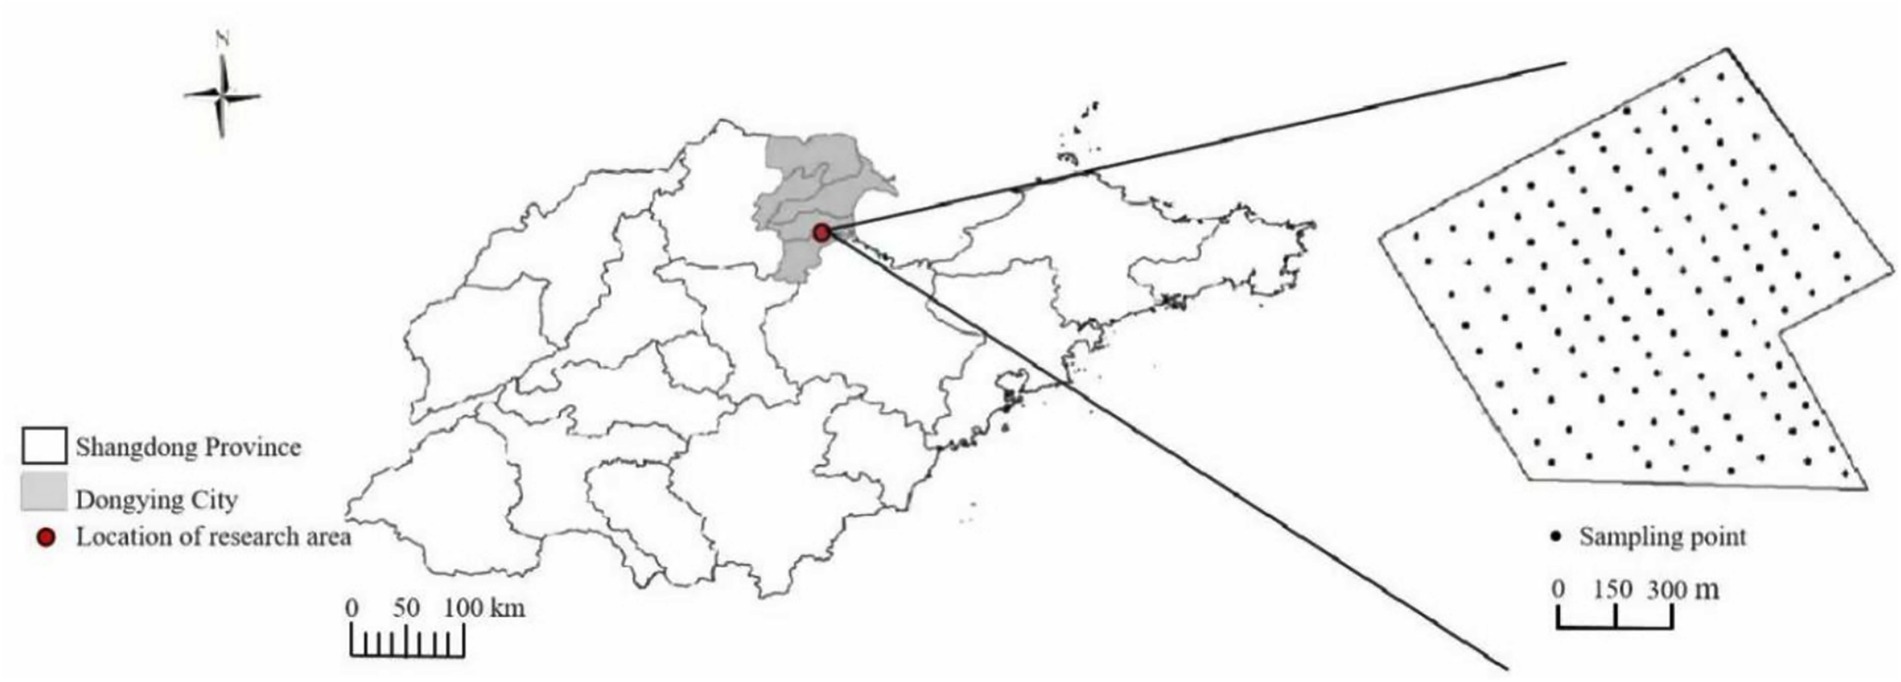
Figure 1. Location of the study area.
2.3 Determination method
The contents of soil salinity, AN, AP, and AK were determined. Soil salinity was determined by the residue drying-mass method, AN was determined by alkaline hydrolysis diffusion method, AK was determined using flame photometry after ammonium acetate extraction, AP was extracted with the sodium bicarbonate extraction/molybdenum antimony colorimetric method (Bao, 2000).
2.4 Data analysis
SPSS 19.0 was used to conduct descriptive statistical analysis of each attribute of the collected soil samples. Geostatistical methods were used to predict the spatial distribution of soil nutrients and salinity in the study area, which provided basic data for analyzing the spatial heterogeneity of farmland soil properties (Fan et al., 2015). The CV of soil properties was calculated to reflect the degree of dispersion between data. The CV is an important index used in classical statistics to determine the degree of variation of data, which can distinguish the sensitivity of different soil physical and chemical indexes to external conditions (Yang et al., 2018). The semi-variance function analysis was used to analyze the soil salinity of different densities in the study area with GS + 9.0, and the optimal fitting model and parameters were obtained, and then ordinary kriging in the spatial analysis module of ArcGis10.8 software was used to optimize the soil nutrient content at the unsampled points, to obtain planar data from point data. The spatial distribution map of soil salinity and nutrient content in the study area was generated.
3 Results
3.1 Descriptive statistical analysis
The distribution characteristics of soil salinity and nutrients in study area were analyzed (Table 1) using classical statistical parametric methods; the differences in the soil salinity nutrients in October and in April were determined, and the temporal variation of soil salinity and nutrients were studied. The raw data were mostly non-normal distributed, and the data was log-transformed to a normal distribution.
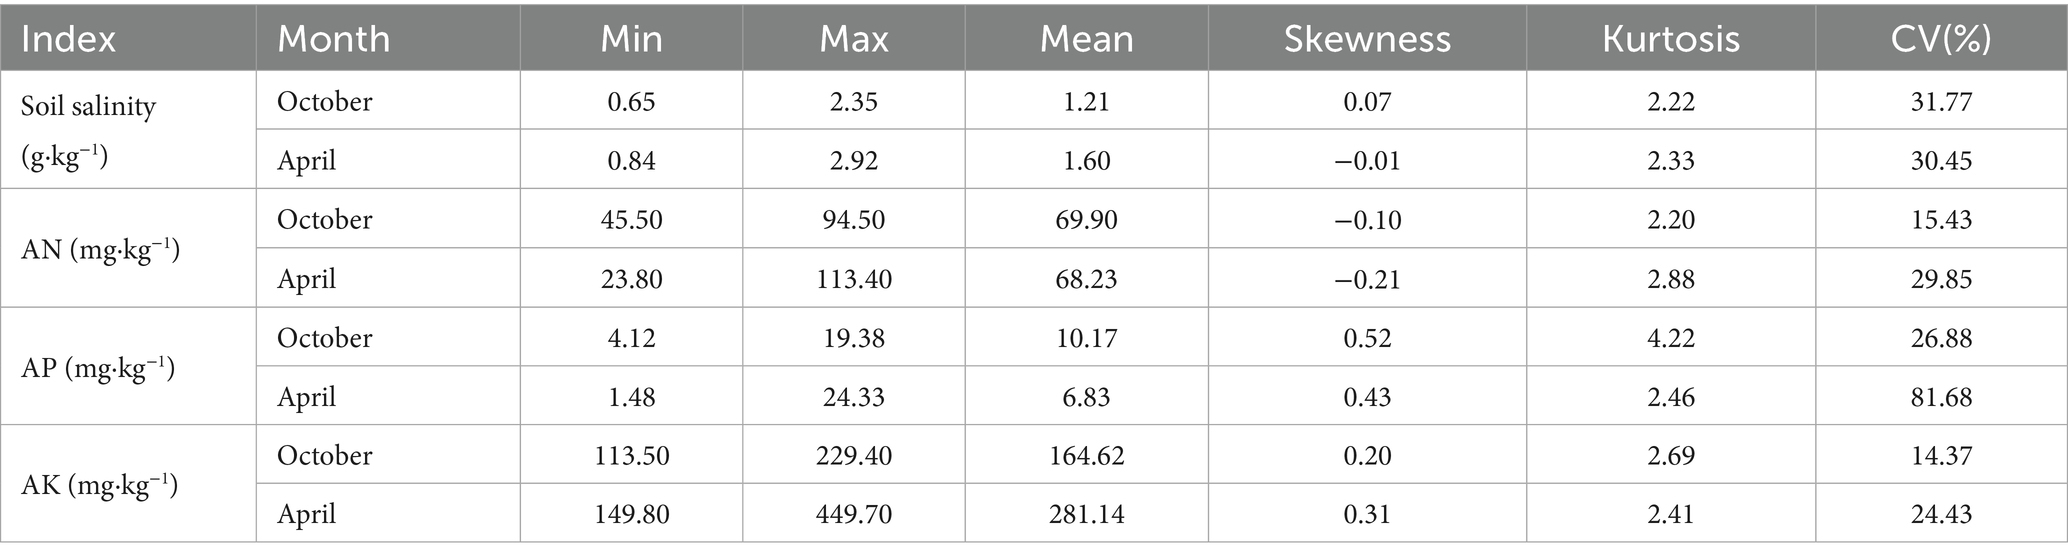
Table 1. The result of descriptive statistics.
The mean of soil salinity, AN, AP, and AK content were 1.21 g·kg−1, 69.90 mg·kg−1, 10.17 mg·kg−1, and 164.62 mg·kg−1 in October. The mean of soil salinity, AN, AP, and AK content were 1.60 g·kg−1, 68.23 mg·kg−1, 6.83 mg·kg−1, and 281.14 mg·kg−1 in April. The farmland soil was mainly slightly salinized. Soil salinity and AK content in April> Soil salinity and AK content in October, AN and AP content in October > AN and AP content in April.
A CV of <10% indicated weak variability, a CV between 10 and 100% indicated moderate variability, and a CV of more than 100% indicated strong variability. All soil indicators showed moderate variability. The CV of soil salinity, AN, AP and AK were 31.77, 15.43, 26.88, and 14.37% in October, respectively. The CV of Soil salinity, AN, AP and AK were 30.45, 29.85, 81.68, and 24.43%, respectively, in April. The CV of soil salinity in October was greater than that in April. The October CV values of AN, AP, and AK were less than that in April.
3.2 Spatial variability analysis
When quantitatively describing the variation characteristics, it is necessary to build a theoretical model of the variation function through the optimal fitting of the model. The GS + 9.0 software was used to select the optimal half-variance function model which follows the criterion of minimum RSS and maximum R2. The parameters provided by the geostatistical analysis further revealed the spatial variation characteristics of the soil salinity and nutrients in study area. Specifically, nugget (C0) refers to random variations that may be caused by human activities, soil biology, and sampling errors, whereas sill (C0 + C) represents the total variation in the soil nutrient content at the current scale.
According to the classification standard of spatial correlation degree of regional variables (Hartfiel and Digman, 2021). When C0/C0 + C < 25%, variables have a strong spatial correlation. Between 25% < C0/C0 + C < 75%, the variables have a moderate spatial correlation. However, when C0/C0 + C > 75%, the spatial correlation of variables is weak. In general, variables with strong variability are mainly affected by structural factors, such as soil texture, soil particle, soil bulk density, etc., while variables with weak variability are affected by random factors. The driving factors of randomness are mainly human factors, such as agricultural irrigation, fertilizer use, tillage measures, etc.
In October, the best fitting model of AK was Gaussian model, the exponential model was the best fitting model for soil indicators in other periods. Weak spatial correlation between soil salinity and AK in October and April and AP in October, moderate spatial correlation between AN in October and April and AP in April (Table 2).
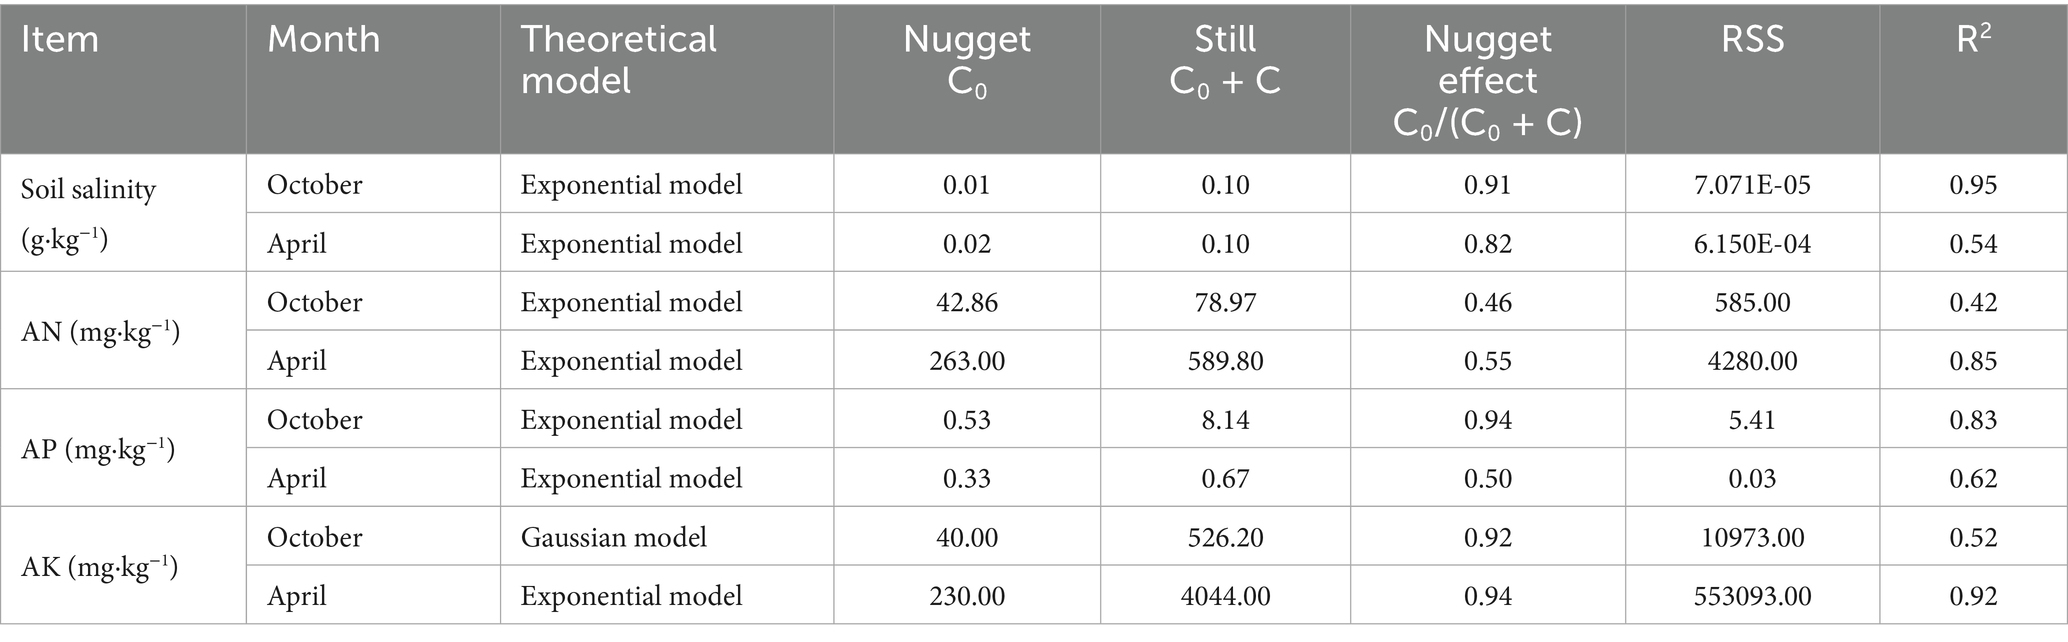
Table 2. Semi-variogram models and parameters.
3.3 Spatial distribution analysis
Ordinary kriging was used to perform optimal spatial interpolation on the soil salinity, AN, AP, and AK based on the obtained semivariance function model and related parameters, and the spatial distributions of soil salinity, AN, AP, and AK were graphed (Figure 2) to intuitively describe the spatial distribution of the soil properties in the study area.
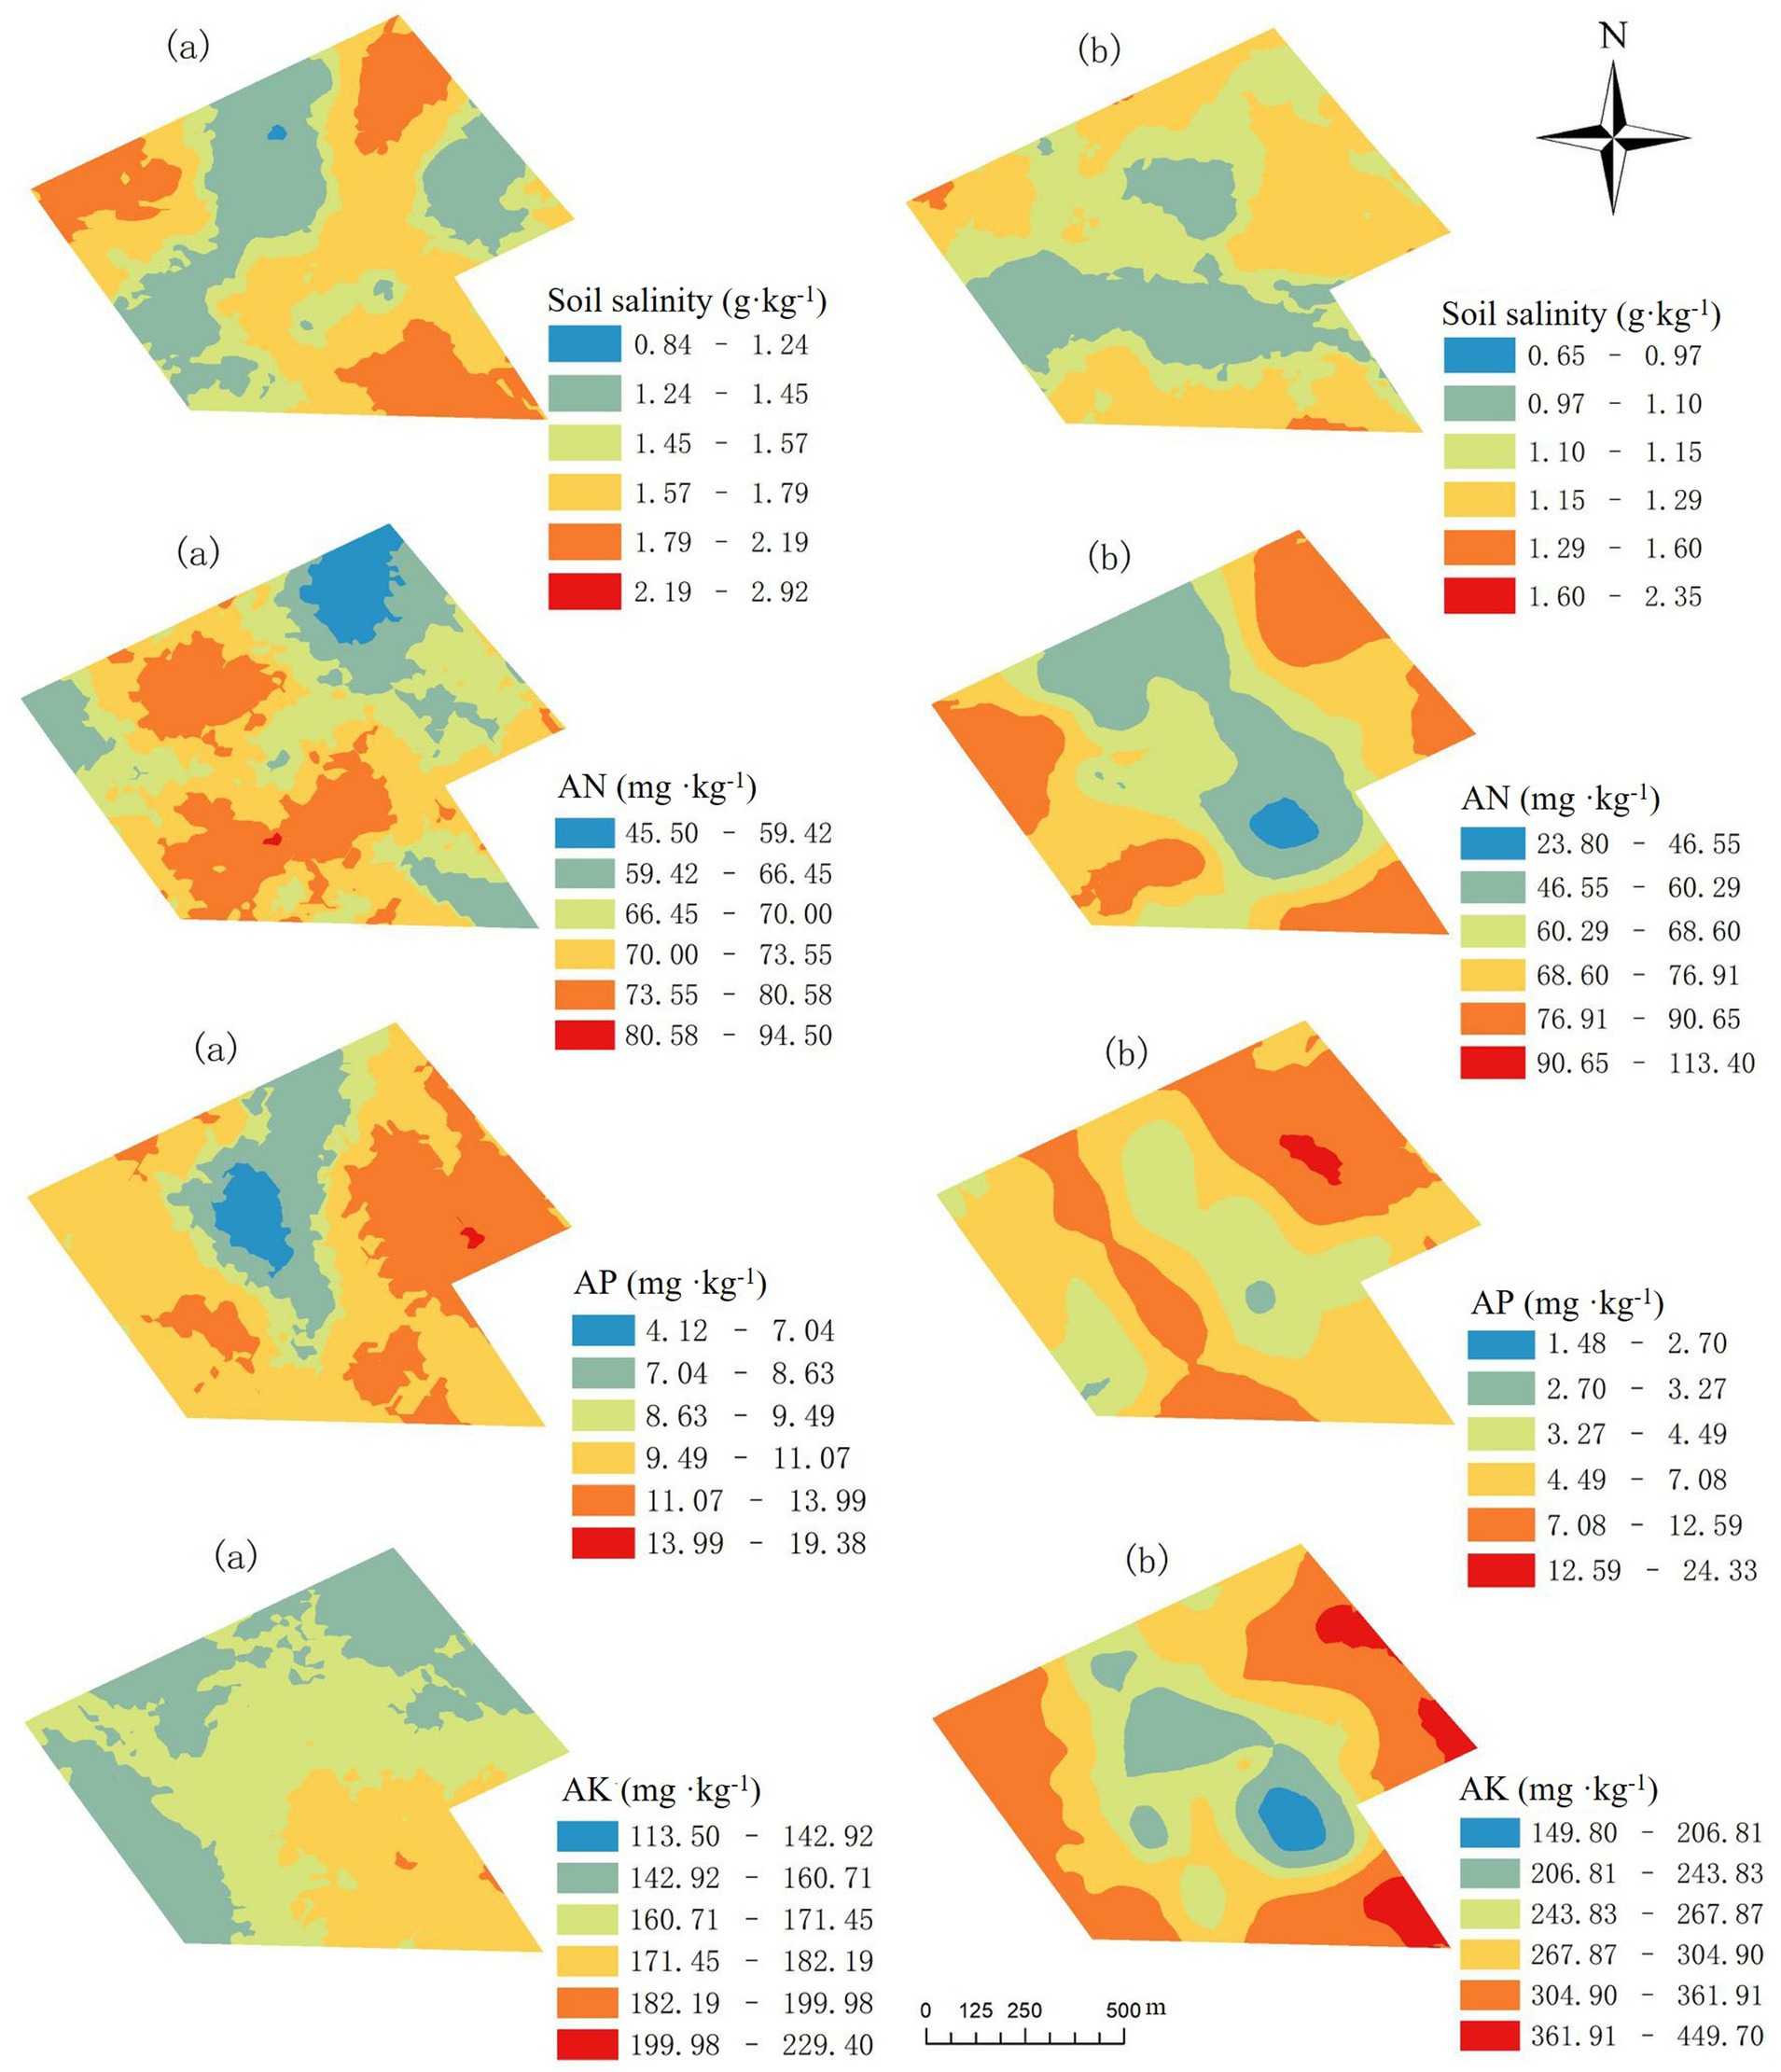
Figure 2. Spatial patterns of soil salinity, AN, AP, and AK in October (a) and April (b).
In October and April, soil salinity, AN and AP were distributed in patches, with the overall content being low in the middle and high in the four sides. In October, AK was distributed in patches, except for the southern part where the content was high, the rest of the space showed that the edge content was lower than the central content. In April, AK was distributed in rings, and the content generally increased from the middle to the four sides.
4 Discussion
4.1 Analysis of the spatial heterogeneity of soil salinity
The spatial variability of soil salinity is influenced by many factors, such as groundwater level, climate, irrigation and drainage system, and topography (Cemek et al., 2007). The accumulation of soil surface salt and the erosion of surface salt caused by rainfall are the reasons for the spatial heterogeneity of salt in the two periods. The CV of salinity in October is greater than that in April, which may be due to the high temperatures in Dongying City in October causing large amounts of soil moisture to evaporate. Evaporation promotes the loss of moisture from the soil surface, causing salt to gradually accumulate on the surface and increasing the variability of soil salinity. In contrast, although temperatures gradually increased in April, evaporation was relatively weak and changes in soil salinity were also small. The specific law of water and salt absorption causes the uneven distribution of salt around the plant roots (Doris et al., 2004), which is also the reason for the difference in the spatial heterogeneity of salt between the two periods, the difference in rainfall can affect the content and distribution of soil moisture, and then affect the migration and accumulation of soil salinity. There is more rainfall in October, while April is in a period of less rainfall.
4.2 Analysis of the spatial heterogeneity of soil nutrients
Soil nutrients typically exhibit significant spatial differentiation, with uneven distribution and often appear as discrete patches. These patches show heterogeneity in both spatial and temporal dimensions. Spatially, this manifests as differences in the location, size, scale, and quantity of nutrient patches; temporally, it is reflected in the timing of patch appearance, duration, and frequency (Cao et al., 2021). The heterogeneity in nutrient distribution may be caused by various factors. For example, differences in the physical and chemical properties of soil itself (Xu et al., 2019), variations in the chemical attributes of litter substrates (Yan et al., 2019; Sayer et al., 2021). The October CV of AN, AP, and AK were less than that in April. AN, AP, and AK are the nutrients most easily absorbed by plants, which are greatly affected by plant growth, and then affect the content of N, P, and K in the regional soil. As an important limiting factor in agricultural production, soil salinity affects soil quality and crop growth (Li et al., 2010). Salt content affects the absorption and distribution of N, P, and K nutrients, and the higher the salt concentration, the more obvious the inhibitory effect (Liu et al., 2017; Gong et al., 2009). Therefore, the unevenness of salt leads to the difference of crop’s nutrient absorption from soil, and there are obvious differences in nutrient absorption of plants, which leads to the degree and rate of nutrient consumption of plants in nutrient-rich patches in heterogeneous environment, which is also the reason for studying the unevenness of soil nutrients in the region (Gross et al., 2007). Due to leaching, soil nutrients flow with water is also the reason for the difference in soil nutrient heterogeneity between the two periods. In October, the crop is approaching harvest and the uptake of soil nutrients is reduced, so the soil nutrient variability may be relatively low. In April, crops began a new growth cycle, with increased demand for nutrients, and agricultural activities (such as fertilization, irrigation, etc.) became more frequent, leading to increased variability in soil nutrients. According to Figure 2, nutrient content in the central part of farmland during the April growing season is lower than in surrounding areas. It is recommended to increase nutrient application in the central part of farmland and reduce nutrient application in surrounding areas.
4.3 Implications for precision farming and soil management
The high-resolution spatial maps generated through ordinary kriging in this study provide actionable insights for precision nutrient and salinity management at the farm scale. By identifying zones with high salinity or nutrient deficits, farmers can implement variable-rate fertilization and irrigation, thereby optimizing resource use and minimizing environmental impact (Shaheb et al., 2022). For instance, the observed lower nutrient content in the central area during April suggests the need for targeted nutrient supplementation in that zone, while reduced application in nutrient-rich edges can prevent over-fertilization. Moreover, kriging-based maps can guide targeted soil sampling strategies, reducing the number of samples required for monitoring while maintaining accuracy. This is particularly valuable for long-term soil health assessment and salinization control in dynamic environments like the Yellow River Delta.
5 Conclusion
In October and April, salinity, AN, AP, and AK all exhibited moderate variability, with the CV value for salinity being higher in October than in April, while the CV values for AN, AP, and AK were lower in October than in April. Salinity and AK in both periods, as well as AP in October, exhibited weak spatial dependence, influenced by random factors; AN in both periods and AP in April exhibited moderate spatial dependence, driven by both structural and random factors. During the crop growing season in April, it is recommended to increase fertilizer application in the central areas of farmland and reduce it in peripheral areas.
Data availability statement
The original contributions presented in the study are included in the article/supplementary material, further inquiries can be directed to the corresponding author.
Author contributions
YM: Writing – original draft, Writing – review & editing. KZ: Writing – original draft, Software, Data curation. XZ: Writing – original draft, Software. XL: Writing – review & editing, Funding acquisition.
Funding
The author(s) declare that financial support was received for the research and/or publication of this article. This research was funded by the National Key Research and Development Program of China (2021YFD190090308), the Innovation Team for Cotton in the Shandong Province Modern Agricultural Industry Technology System (SDAIT-03-06), and the Science and Technology Project of the National Agricultural High-Tech Zone in the Yellow River Delta (2022SZX33).
Conflict of interest
The authors declare that the research was conducted in the absence of any commercial or financial relationships that could be construed as a potential conflict of interest.
Generative AI statement
The authors declare that no Gen AI was used in the creation of this manuscript.
Any alternative text (alt text) provided alongside figures in this article has been generated by Frontiers with the support of artificial intelligence and reasonable efforts have been made to ensure accuracy, including review by the authors wherever possible. If you identify any issues, please contact us.
Publisher’s note
All claims expressed in this article are solely those of the authors and do not necessarily represent those of their affiliated organizations, or those of the publisher, the editors and the reviewers. Any product that may be evaluated in this article, or claim that may be made by its manufacturer, is not guaranteed or endorsed by the publisher.
References
Bocchi, S., Castrignanò, A., Fornaro, F., and Maggiore, T. (2000). Application of factorial kriging for mapping soil variation at field scale. Eur. J. Agron. 13, 295–308. doi: 10.1016/S1161-0301(00)00061-7
Cao, Y., Wang, L., Gu, W., Wang, Y. J., and Zhang, J. H. (2021). Increasing photosynthetic performance and post-silking N uptake by moderate decreasing leaf source of maize under high planting density. J. Integr. Agric. 20, 494–510. doi: 10.1016/S2095-3119(20)63378-0
Cemek, B., Güler, M., Kiliç, K., Demir, Y., and Arsian, H. (2007). Assessment of spatial variability in some soil properties as related to soil salinity and alkalinity in Bafra plain in northern Turkey. Environ. Monit. Assess. 124, 223–234. doi: 10.1007/s10661-006-9220-y
Doris, V., Katharina, K., Sven, S., and Reinhold, J. (2004). Consequences of sodium exclusion for the osmotic potential in the rhizosphere - comparison of two maize cultivars differing in Na+ uptake. J. Plant Nutr. Soil Sci. 167, 337–344. doi: 10.1002/jpln.200420407
Duan, M. Q., Song, X. Y., Liu, X. W., Cui, D. J., and Zhang, X. G. (2022). Mapping the soil types combining multi-temporal remote sensing data with texture features. Comput. Electron. Agric. 200:107230. doi: 10.1016/j.compag.2022.107230
Fan, L. J., Hu, G. L., Liao, Y. X., Wang, D. J., Zhang, D. G., and Wang, J. Y. (2015). Spatial variability of soil particle size and its fractal dimension of patchy vegetation in Hexi corridor. Arid Zone Res. 32, 1068–1075. doi: 10.13866/j.azr.2015.06.04
Feng, H. D., Zhang, X. G., Nan, Y., Zhang, D., and Sun, Y. (2023). Ecological sensitivity assessment and spatial pattern analysis of land resources in Tumen River basin, China. Appl. Sci. 13:4197. doi: 10.3390/app13074197
Gogoi, B., Borah, N., Baishya, A., Nath, D. J., Dutta, S., Das, R., et al. (2021). Enhancing soil ecosystem services through sustainable integrated nutrient management in double rice-cropping system of north-East India. Ecol. Indic. 132:108262. doi: 10.1016/j.ecolind.2021.108262
Gong, J., Lv, N., Ru, S. B., and Hou, Z. A. (2009). Effects of soil salinity on nutrients and ions uptake in cotton with drip irrigation under film. Plant Nutr. Fertil. Sci. 15, 670–676. doi: 10.3321/j.issn:1008-505X.2009.03.027
Goovaerts, S. A. P. (1997). Geostatistics for natural resources evaluation. Applied Geostatistics Series. xiv + 483. New York, Oxford: Oxford University Press. Geological Magazine. 135:819–842. doi: 10.1017/S0016756898631502
Gorji, T., Tanik, A., and Sertel, E. (2015). Soil salinity prediction, monitoring and mapping using modern technologies. Procedia Earth Planet. Sci. 15, 507–512. doi: 10.1016/j.proeps.2015.08.062
Gross, N., Suding, K. N., Lavorel, S., and Roumet, C. (2007). Complementarity as a mechanism of coexistence between functional groups of grasses. J. Ecol. 95, 1296–1305. doi: 10.1111/j.1365-2745.2007.01303.x
Gu, H. B., Wang, Z., Wu, H. Q., and Sheng, J. D. (2016). Research on temporal and spatial distribution characteristics of soil nutrient and salt under different reclamation years. Agric. Res. Arid Areas. 34, 8–15. doi: 10.7606/j.issn.1000-7601.2016.03.02
Guo, E. H., Chen, L. D., Sun, R. H., and Wang, Z. M. (2015). Effects of riparian vegetation patterns on the distribution and potential loss of soil nutrients: a case study of the Wenyu River in Beijing. Front. Environ. Sci. Eng. China 9, 279–287. doi: 10.1007/s11783-014-0667-8
Hartfiel, L. M., and Digman, M. F. (2021). The impact of tedding on alfalfa nutritive value in a silage production system. Appl. Eng. Agric. 37, 1115–1118. doi: 10.13031/aea.14723
Karunaratne, S. B., Bishop, T. F. A., Baldock, J. A., and Odeh, I. O. A. (2014). Catchment scale mapping of measurable soil organic carbon fractions. Geoderma 219–220, 14–23. doi: 10.1016/j.geoderma.2013.12.005
Li, J., and Heap, A. D. (2011). A review of comparative studies of spatial interpolation methods in environmental sciences: performance and impact factors. Ecol. Inform. 6, 228–241. doi: 10.1016/j.ecoinf.2010.12.003
Li, H. Y., Shi, Z., and Tang, H. L. (2010). Research on three-dimension spatial variability of soil electrical of coastal land using 3D ordinary kriging method. Acta Pedol. Sin. 47, 359–363. doi: 10.11766/trxb200805090222
Liu, W. Y., Yang, F. R., Huang, J., Wei, Y. M., and Jin, Q. (2017). Response of seedling growth and the activities of antioxidant enzymes of Chenopodium quinoa to salt stress. Acta Bot. Boreal. Occident. Sin. 37, 1797–1804. doi: 10.7606/j.issn.1000-4025.2017.09.1797
Luo, J. J., and Liu, F. L. (2024). Land use changes and impacts on ecosystem service values in the Yellow River Delta – an example from Kenli district of Dongying city, Shandong province. Resourc. Habitant Environ. 12, 61–69.
Sayer, E. J., Baxendale, C., Birkett, A. J., Bréchet, L. M., Castro, B., Kerdraon-Byrne, D., et al. (2021). Altered litter inputs modify carbon and nitrogen storage in soil organic matter in a lowland tropical forest. Biogeochemistry 156, 115–130. doi: 10.1007/s10533-020-00747-7
Shaheb, M. R., Sarker, A., and Shearer, S. A. (2022). “Precision agriculture for sustainable soil and crop management” in Soil Science - Emerging Technologies, Global Perspectives and Applications. doi: 10.5772/intechopen.101759
Sun, D. Y., Xue, Z. C., Han, X., Yang, Y., and Xue, Z. S. (2023). Characteristics and remediation strategy of heavy metal polluted agricultural soil near a mine in northern Hebei Province based on field scale. Environ. Ecol. 5, 11–18.
Wang, W. J., Duan, M. Q., Zhang, X. G., Song, X. Y., Liu, X. W., and Cui, D. J. (2022). Determining optimal sampling numbers to investigate the soil organic matter in a typical county of the Yellow River Delta, China. Appl. Sci. 12:6062. doi: 10.3390/app12126062
Wang, R. S., Kang, Y. H., and Wan, S. Q. (2015). Effects of different drip irrigation regimes on saline-sodic soil nutrients and cotton yield in an arid region of Northwest China. Agric. Water Manag. 153, 1–8. doi: 10.1016/j.agwat.2015.01.025
Wang, J. Y., Liu, Y. X., Wang, S. M., Liu, S. M., Liu, H. M., Fu, G. Q., et al. (2019). Spatial distribution of soil salinity and potential implications for soil management in the Manas River watershed, China. Soil Use Manag. 36, 93–103. doi: 10.1111/sum.12539
Wang, Y., Xiao, Z. L., Aurangzeib, M., Zhang, X. Y., and Zhang, S. L. (2021). Effects of freeze-thaw cycles on the spatial distribution of soil total nitrogen using a geographically weighted regression kriging method. Sci. Total Environ. 763:142993. doi: 10.1016/j.scitotenv.2020.142993
Webster, R., and Oliver, M. A. (2008). Geostatistics for environmental scientists. 2nd Edn: Statistics for Earth and Environmental Scientists. doi: 10.1002/9780470517277
Wu, Y. H., Tian, X. H., Hou, Y. H., Zhou, M., and Tong, Y. A. (2009). Preliminary study on the subject concerning fuzzy assessment method of soil fertility based on field scale. J. Nat. Resour. 24, 1422–1431. doi: 10.11849/zrzyxb.2009.08.011
Xie, M. J. (2020). Recognition method and application of spatial characteristics of soil nutrients based on farm and field scale : Baoding Agricultural University of Hebei. doi: 10.27109/d.cnki.ghbnu.2020.000215
Xu, Y., Deng, Y., Cao, J., Yue, X., and Zhu, Z. (2019). Spatial heterogeneity of soil fertility in karst faulted basin and its influencing factors. Res. Soil Water Conserv. 26, 355–362.
Xue, X., Mao, Y. P., and Zhang, H. (2023). Transport fluxes of nitrogen, phosphorus, cadmium and arsenic at farmland plot scale in the typical areas of Pearl River Delta region. J. Environ. Eng. Technol. 13, 1179–1186. doi: 10.12153/j.issn.1674-991X.20220391
Yan, H., Kou, L., Wang, H., Fu, X., Dai, X., and Li, S. (2019). Contrasting root foraging strategies of two subtropical coniferous forests under an increased diversity of understory species. Plant Soil 436, 427–438. doi: 10.1007/s11104-019-03936-y
Yang, Z. J., Chen, X. M., Jing, F., Guo, B. L., and Lin, G. Z. (2018). Spatial variability of nutrients and heavy metals in paddy field soils based on GIS and geostatistics. Chin. J. Appl. Ecol. 29, 1893–1901. doi: 10.13287/j.1001-9332.201806.036
Ye, H. C. (2014). Study on the spatial variability and scale effect of soil fertility quality and its key factor in Beijing. Beijing: China Agricultural University.
Keywords: farm scale, soil salinity, soil nutrients, spatial heterogeneity, different periods
Citation: Ma Y, Zhang K, Zhang X and Liu X (2025) Spatial distribution characteristics of soil salinity and nutrients in saline soil based on farm scale. Front. Sustain. Food Syst. 9:1623923. doi: 10.3389/fsufs.2025.1623923
Edited by:
Xiquan Wang, Inner Mongolia Agricultural University, ChinaReviewed by:
Hongyuan Zhang, Chinese Academy of Agricultural Sciences, ChinaMing-Song Zhao, Anhui University of Science and Technology Affiliated Fengxian Hospital, China
Copyright © 2025 Ma, Zhang, Zhang and Liu. This is an open-access article distributed under the terms of the Creative Commons Attribution License (CC BY). The use, distribution or reproduction in other forums is permitted, provided the original author(s) and the copyright owner(s) are credited and that the original publication in this journal is cited, in accordance with accepted academic practice. No use, distribution or reproduction is permitted which does not comply with these terms.
*Correspondence: Xinwei Liu, MjAwNTAxMDY1QHFhdS5lZHUuY24=