 Kumari Shubha*
 Anup Das
 Arbind Kumar Choudhary
 Anirban Mukherjee
 Kirti Saurabh
 Saurabh Kumar
 Santosh Kumar
 Ajeet Kumar Pal
 Sanjeev Kumar
 Ujjwal Kumar
- ICAR-Research Complex for Eastern Region, Patna, Bihar, India
Introduction: Grass pea (Lathyrus sativus L.), a resilient legume adapted to drought and waterlogged conditions, presents a promising solution for sustainable intensification of rice-fallow systems in South Asia, where ~9.7 million hectares remain uncultivated post-kharif due to moisture and socio-economic constraints.
Materials and Methods: This study evaluated seventeen diverse lines for dual-purpose (leaf and grain) utility, analysing morpho-agronomic traits, imbibition kinetics, and genetic diversity to identify optimal breeding material.
Results: Phenotypic characterization revealed significant variation: pulse-type genotypes flowered earlier (mean 47.1 ± 5.8 days) than leaf-types (54.4 ± 5.5 days), with plant height (12.33–43.66 cm), seed yield (1.98–3.34 g/plant), and leaf yield (28.76–60.71 g/plant) showing distinct trade-offs. Correlation analyses highlighted key associations, including strong negative relationships between days to flowering and seed yield (r = −0.750) and between pod length and leaf yield (r = −0.652). Imbibition kinetics varied genotypically, with fast-imbibing lines (e.g., Ratan) suited for rapid establishment in residual moisture, while slow-imbibing types (e.g., 75,049) showed potential for waterlogging resilience. Principal component analysis extracted 88.54% of variability into five components, with PC1 (42.23%) representing a yield–flowering time trade-off and PC2 (22.50%) separating broad-leaved from high-seed genotypes. Cluster analysis grouped genotypes into five distinct clusters, with maximum divergence between Clusters II and III (distance = 43.62), while solitary genotypes (Clusters IV–V) emerged as unique genetic resources.
Discussion: These findings provide a roadmap for breeding programs targeting rice-fallow adaptation, emphasizing early flowering for yield optimization, imbibition efficiency for moisture stress adaptation, and strategic utilization of genetically distant clusters (II × III) to maximize heterosis. The study underscores grass pea’s potential as a dual-purpose crop to enhance productivity and nutritional security in vulnerable rice-fallow systems.
1 Introduction
In South Asia, about 15 mha of cultivated area remains fallow every year after harvesting of rice and out of which 11.65 mha area lies in India (Ghosh et al., 2016; Gumma et al., 2016). Approximately 84% of the country’s total rice-fallow area (9.7 mha) is concentrated in the eastern parts of India (Ali et al., 2014; Kumar et al., 2019). The reasons for fallowing of land in dry season are fast depletion of residual moisture, deficient irrigation, poor socio-economic condition of the farmers, and some regional limitations like free grazing of livestock (Kumar et al., 2019). Another important factor is delay in sowing of dry season crops due to late harvesting of long duration rice cultivars (such as MTU 7029, BPT 5204, and traditional local varieties), which imparts moisture and temperature stress in the succeeding crops (Kumar et al., 2018; Kumar et al., 2025). As global demand for sustainable legume protein grows, grass pea emerges as a key crop for marginal environments, offering both ecological and nutritional benefits (Maleki et al., 2025; Kumar et al., 2025). Their ability to establish as a pre-harvest crop with standing rice and persist through subsequent dry periods makes them a resilient choice for stabilizing productivity in these vulnerable cropping systems. This dual-phase tolerance addresses both the delayed sowing constraints of dry-season crops and the moisture deficits typical of post-rice fallows, providing crucial risk mitigation in rainfed ecosystems. Interestingly, the populaces of Bihar, West Bengal, and Odisha commonly consume the tender shoot terminals and leaves of grass pea, known as khesari saag are widely consumed as a nutritious winter leafy vegetable (Panda et al., 2021). In these regions, the preference for grass pea leaves during the entire winter season is evident. Cultivating grass pea as a dual-purpose crop in rice fallow areas offers an excellent opportunity to grow an additional crop after the long-duration rice harvest (Tripathi et al., 2025). While farmer preference for leafy types is evident, potential adoption barriers such as labor requirements for leaf harvesting and post-harvest handling need to be considered. Additionally, poor-quality seeds, inadequate crop management, weak marketing facilities, and high labor wages have also been reported as major constraints affecting adoption and profitability (Pandey et al., 2019). Additionally, developing local market linkages and value chains for leafy grass pea could further enhance its economic viability and farmer acceptance (Solovieva et al., 2025). Traditional long-duration rice varieties often overlap with the recommended sowing time for rabi crops like wheat, mustard, and other cool-season pulses and vegetables. This timing conflict increases the risk of terminal heat stress on winter crops, potentially affecting their yield potential. Moreover, the shrinking duration of winter months in recent decades has heightened the susceptibility of legume crops, including grass pea, to diseases like powdery mildew (Shubha et al., 2024). Terminal heat stress further compromises the quality and quantity of grass pea. In this scenario, promoting the cultivation of grass pea for leafy vegetable purposes becomes a viable option in rice fallow areas as a second crop, addressing the challenges associated with limited sowing windows and heat stress while satisfying the demand for nutritious greens.
Grass pea (Lathyrus sativus L.), a diploid legume (2n = 14), is a resilient crop due to adapting features like narrow leaves, winged stems, and a deep root system enhance its ability to thrive in diverse soil types and withstand environmental stresses. Grass pea is a model crop for sustainable agriculture (Vaz Patto et al., 2006). It is a resilient crop, tolerant to extreme temperatures, drought and flood, and considerably resistant to several pests and diseases, which allows its cultivation in different production systems and environments (Campbell et al., 1993; Gonçalves et al., 2022; Vaz Patto and Rubiales, 2014). Grass pea contains the neurotoxin β-ODAP, which, when consumed excessively, can cause neurolathyrism-a non-lethal neurodegenerative disorder in humans and animals (Lambein et al., 2019; Dutta et al., 2024). The content of β-ODAP in grass pea lines differs from 0.02 to 2.59% (Kumar et al., 2011). Its accumulation is influenced by drought, nitrogen and phosphorus levels, and deficiencies in sulfur-containing amino acids like cysteine and methionine, linking ODAP biosynthesis to sulfur metabolism (Das et al., 2021).
Understanding imbibition behavior across grass pea lines is critical due to its role in seed germination and stress adaptation. Seed imbibition efficiency serves as a critical physiological determinant for sustainable grass pea establishment in rice fallow systems, directly influencing water productivity and resource-use efficiency. This trait governs the kinetics of water uptake during germination-a process vital for optimizing residual moisture utilization in post-harvest paddy soils. Comparative germplasm analysis reveals significant intraspecific variation in imbibition dynamics, with drought-adapted genotypes exhibiting accelerated hydration rates (Shubha et al., 2022). Such divergence in water absorption capacity not only affects seedling vigor but also determines the crop’s potential for sustainable intensification under fluctuating soil moisture regimes.
To address these challenges, this study aims to evaluate grass pea’s potential as a climate-resilient dual-purpose crop for rice-fallow systems by characterizing key adaptive traits among diverse genotypes. We hypothesize that genetic variations in imbibition behavior and phenological traits significantly influence establishment success and productivity under post-rice conditions. Specifically, the research will (1) quantify genotype-specific differences in imbibition kinetics and early growth vigor, (2) assess correlations between physiological traits and dual-purpose yield potential, and (3) identify superior genotypes combining rapid establishment with tolerance to moisture stress and terminal heat. By elucidating these trait relationships, the study will provide critical insights for breeding programs targeting sustainable intensification of rice-fallow systems through grass pea cultivation.
2 Materials and methods
2.1 Experimental site and research materials
The study was conducted from 2023–24 to 2024–25 in experimental farm of ICAR Research Complex for Eastern Region, Patna, Bihar India (25°35′N, 85°05′E, 51 MSL). The region has a subtropical climate with annual rainfall of 1,167 mm (70–75% during July–September), temperatures ranging from 7.4–39.6 °C, and relative humidity of 50–80.5%. The silty loam soil (0–15 cm depth) had a pH of 7.22 and EC of 0.17 dS m−1. The experiment was carried on for two consecutive years 2023–24 and 2024–25 in Rabi season. Seventeen grass pea (Lathyrus sativus L.) genotypes (Table 1), sourced from farmers field (Passport data is available in Supplementary file) and ICARDA gene banks were evaluated over two consecutive growing seasons (2023–24 and 2024–25). A randomized row-column alpha lattice design with two replications was employed for field trials. Individual plots measured 3 m × 2 m, containing eight rows spaced at 0.50 m intervals, with 0.50 m alleys separating adjacent plots. In both years of the study, sowing was conducted in the last week of November immediately after rice harvest to utilize residual soil moisture. Seeds were manually dibbled at a uniform depth of 2 cm with 10 cm row spacing. A basal fertilizer dose of 20:40:40 kg/ha (N:P₂O5:K2O) was applied. Standard agronomic practices for rainfed grass pea cultivation were followed, with manual weed control as required. During periods of water deficit at critical growth stages, supplemental irrigation was applied via sprinkler system to maintain plant viability. No irrigation was provided during the vegetative growth stage, allowing the crop to grow solely on residual soil moisture typical of rice-fallow conditions. Supplemental irrigation was applied only at the flowering and pod formation stages via a sprinkler system to maintain plant viability and prevent complete crop failure. The system was calibrated to deliver approximately 12 mm of water per irrigation event. The irrigation rate (L m−2 h−1) was measured and multiplied by the duration of application to estimate the total water applied per plot, expressed in millimeters (1 L m−2 = 1 mm of water). Phenotypic data were recorded for multiple agronomic traits across both seasons. For each growing season, observations were categorized into four distinct datasets (Table 2) to facilitate comprehensive analysis. (i) Plant growth parameters: days first flowering (DFF), days to 50% flowering (D50%F), plant height (PH) (ii) Leaf parameters: leaf length (LL), leaf width (LW), internodal length (IL), leaf yield per plant (LYP) (iii) Yield parameters: pod length (PL), pod width (PW), number of pods per plant (NPP), number of seeds per pod (NSP) (iv) Seed parameters: seed length (SL), seed width (SW), grain yield per plant (GYP) recorded in 10 random seeds per plot. The percentage of outcrossing was determined by counting off-type plants, which were characterized by different flower color and leaf structure, and dividing that number by the total plant population, then multiplying by 100. Recommended agronomical practices were followed, including plot preparation, fertilization, and application of fungicides and insecticides. To ensure individuality of each entry, care was taken to segregate them properly. To avoid the influence of border effects, 10 randomly selected plants were taken from each genotype to measure their morphological traits and the average was recorded. Grass pea was harvested manually at 30–35 DAS (vegetative stage, pre-flowering) for leafy vegetables by cutting stems 5–10 cm above ground. For seed production, harvest occurred at 120 DAS when 80% pods turned yellow-brown; plants were cut at ground level, sun-dried 3–5 days, then threshed.
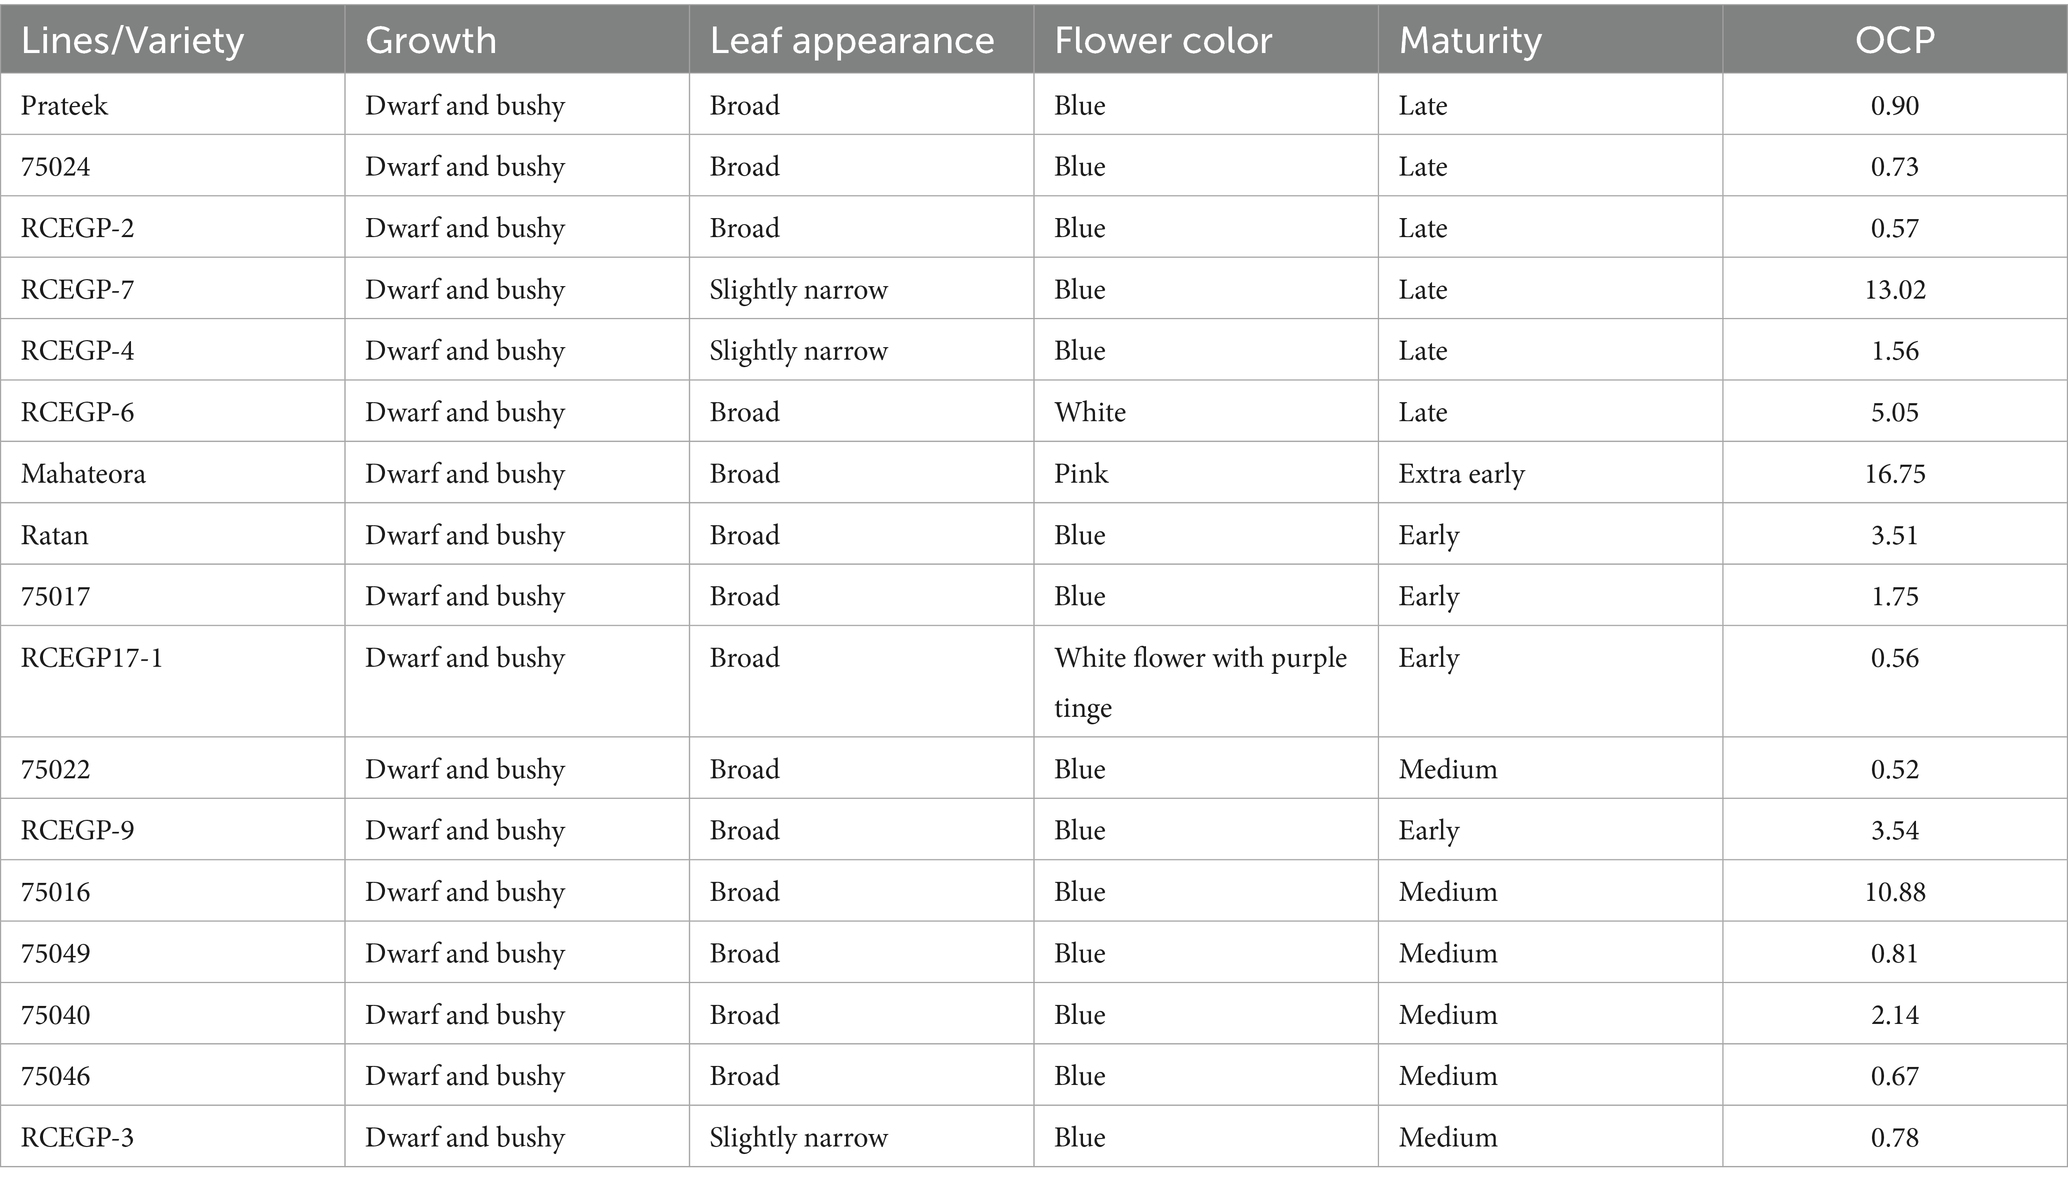
Table 1. The list of seventeen lines and morphological traits and outcrossing percentage in this study.
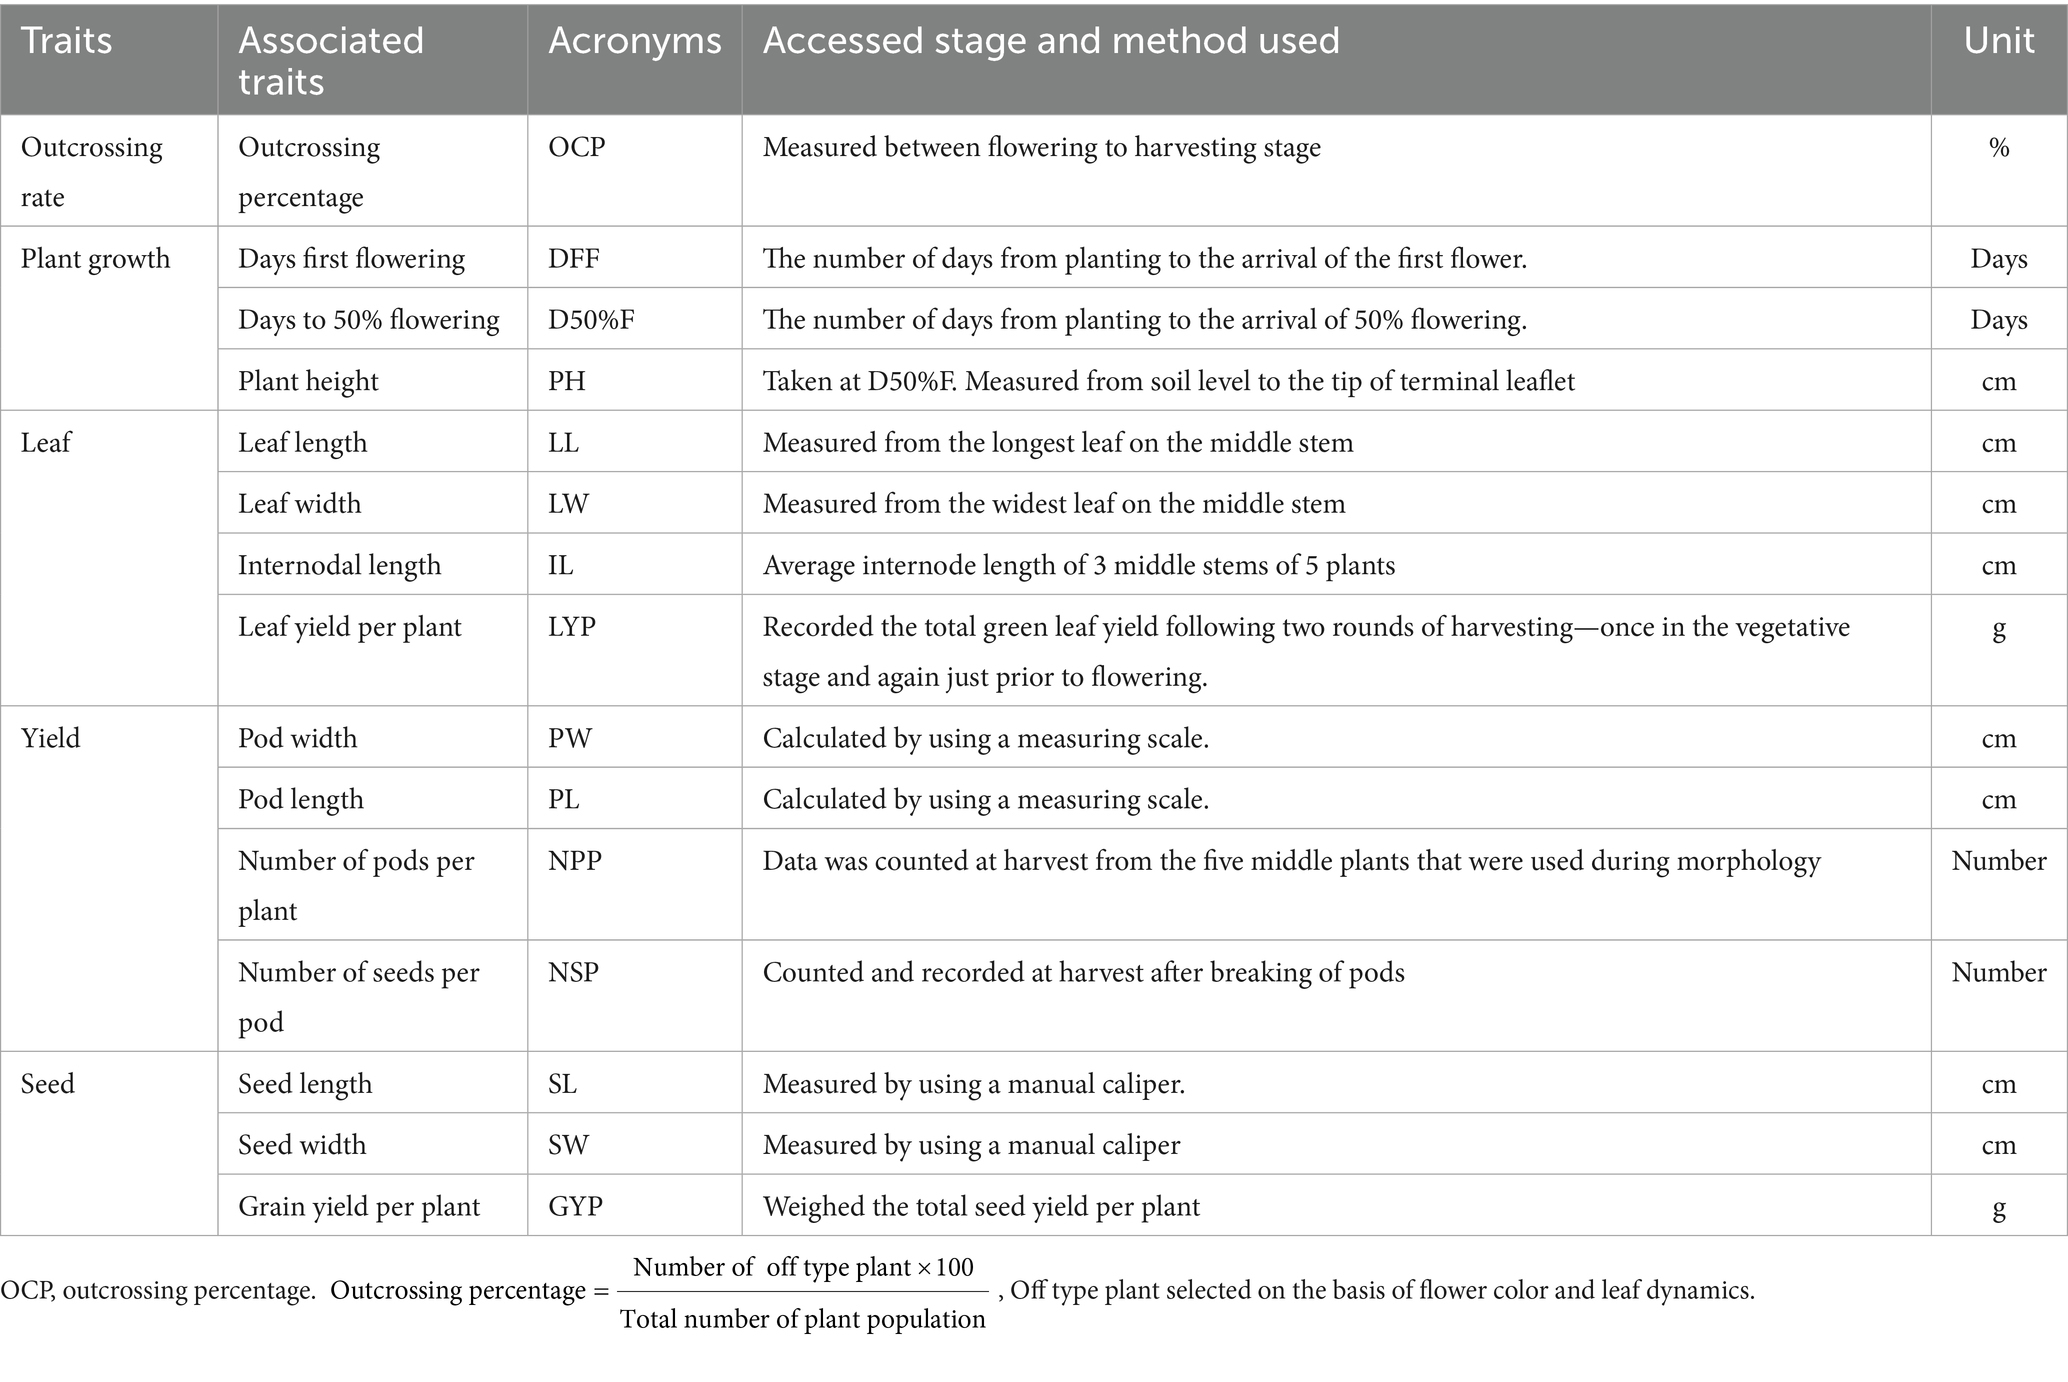
Table 2. Morphological and agronomic traits accessed.
2.2 Methodology for imbibition behavior analysis
The imbibition characteristics of the seed lots (n = 10) were evaluated through a standardized protocol. Seed moisture content was first determined in triplicate using the high-temperature oven method prescribed by International Seed Testing Association (ISTA) (2015). For quantifying water uptake dynamics, initial seed weights were recorded using a precision digital balance. Seeds were then immersed in 50 mL distilled water contained in 200 mL beakers, with the setup maintained at a constant 25 °C and covered with aluminum foil to minimize evaporation. Seeds were weighed at 1-h intervals for the first 12 h, and then at 12-h intervals until no significant weight change (<0.01 g) occurred over three consecutive hours, indicating that imbibition plateau was reached. After this, seeds started to germinate. Prior to each measurement, seeds were carefully surface-dried with absorbent paper to remove excess moisture. For more understanding seventeen grass pea genotypes were evaluated for germination index (GI) under laboratory conditions. For each genotype, three replications of 10 seeds were placed on moistened filter paper in Petri dishes and incubated at 25 ± 2 °C. The number of seeds germinated was recorded daily until no new germination occurred for three consecutive days. GI was calculated as per Association of Official Seed Analysts (1983):
Where Gₜ is the number of seeds germinated on day t. Data were analysed using one-way ANOVA in a completely randomized design, and mean separation was done using Tukey’s HSD test (p ≤ 0.05).
2.3 Statistical analysis
The morpho-agronomic traits were statistically analysed using a comprehensive approach. Descriptive statistics and box plot visualizations were generated using PAST 3 (Paleontological Statistics, version 3.13) and GraphPad Prism, respectively. Pearson correlation coefficients were calculated in XLSTAT to quantify linear relationships between quantitative traits. Multivariate analyses included Principal Component Analysis (PCA) to identify key variance patterns and Agglomerative Hierarchical Clustering (AHC) to group genotypes based on Euclidean distance similarity measures, with clustering performed using XLSTAT.
3 Results
3.1 Morpho-agronomic characterization of grass pea for dual-purpose use in rice fallows
Table 1 presents outcrossing percentages (OCP) of the grass pea lines evaluated in this study. The table demonstrates considerable variation in OCP among grass pea genotypes, ranging from 0.52 to 16.75%. High outcrossing lines like Mahateora (16.75% OCP, pink flowers, extra-early) and RCEGP-7 (13.02% OCP, narrow leaves) show exceptional cross-pollination potential, making them ideal for hybrid breeding. Moderate outcrossing lines (3–5% OCP) like RCEGP-6 (white flowers) and Ratan demonstrate intermediate potential, while low outcrossing lines (<1% OCP) like 75022 and RCEGP-2 are predominantly self-pollinating, suitable for stable pure-line development. The Table 3 presents a comprehensive morpho-agronomic characterization of diverse grass pea genotypes evaluated for dual-purpose (leaf and pulse) utilization in rice fallow systems. The presented data provide a robust foundation for strategic breeding of grass pea for specific utilization goals in rice fallow systems. For optimal leafy vegetable production, late-maturing genotypes (DFF 51–63 days; D50%F 57–70 days) with taller plant stature (PH up to 43.66 cm) and longer internodes (IL 0.72–3.38 cm) are particularly valuable, as these traits facilitate multiple leaf harvests (typically 2–3 pickings) while maintaining satisfactory grain yield (GYP 1.68–3.34 g/plant). The considerable variability in vegetative traits (CV 28.53% for PH, 35.57% for IL) offers ample scope for selecting genotypes with enhanced branching architecture, crucial for maximizing both leaf and grain productivity. Conversely, early-flowering genotypes (DFF 39–51 days) demonstrate superior adaptation for grain production, escaping terminal stresses while maintaining stable pod (PL 2.26–4.00 cm; PW 1.06–1.46 cm) and seed characteristics (SL 0.46–0.70 cm; SW 0.23–0.46 cm). The moderate variability observed in yield components (NPP 12–26.33, CV 20.13%; GYP CV 18.67%) suggests significant potential for genetic improvement, particularly when combined with the crop’s inherent stress tolerance. The highest-yielding genotype, 75017, produces 3.34 g/plant seed yield with 26.33 pods/plant, but its early maturity (DFF: 42 days) and tall stature (40 cm) create a unique ideotype for dual-purpose use. Notably, RCEGP-6 shows exceptional green yield potential (60.43 g/plant) coupled with broad leaves (0.96 cm width), making it ideal for leafy vegetable purposes. These findings enable precise development of three distinct ideotypes: (1) leafy-types emphasizing prolonged vegetative phase and vigorous growth, (2) grain-types prioritizing early maturity and high pod/seed yield, and (3) dual-purpose varieties balancing leaf and grain productivity—all critical for sustainable intensification of rice fallows. The stability in quality traits (pod/seed dimensions) versus variability in productivity traits presents a unique opportunity to simultaneously improve yield while maintaining product uniformity, making grass pea a versatile solution for climate-resilient cropping systems.
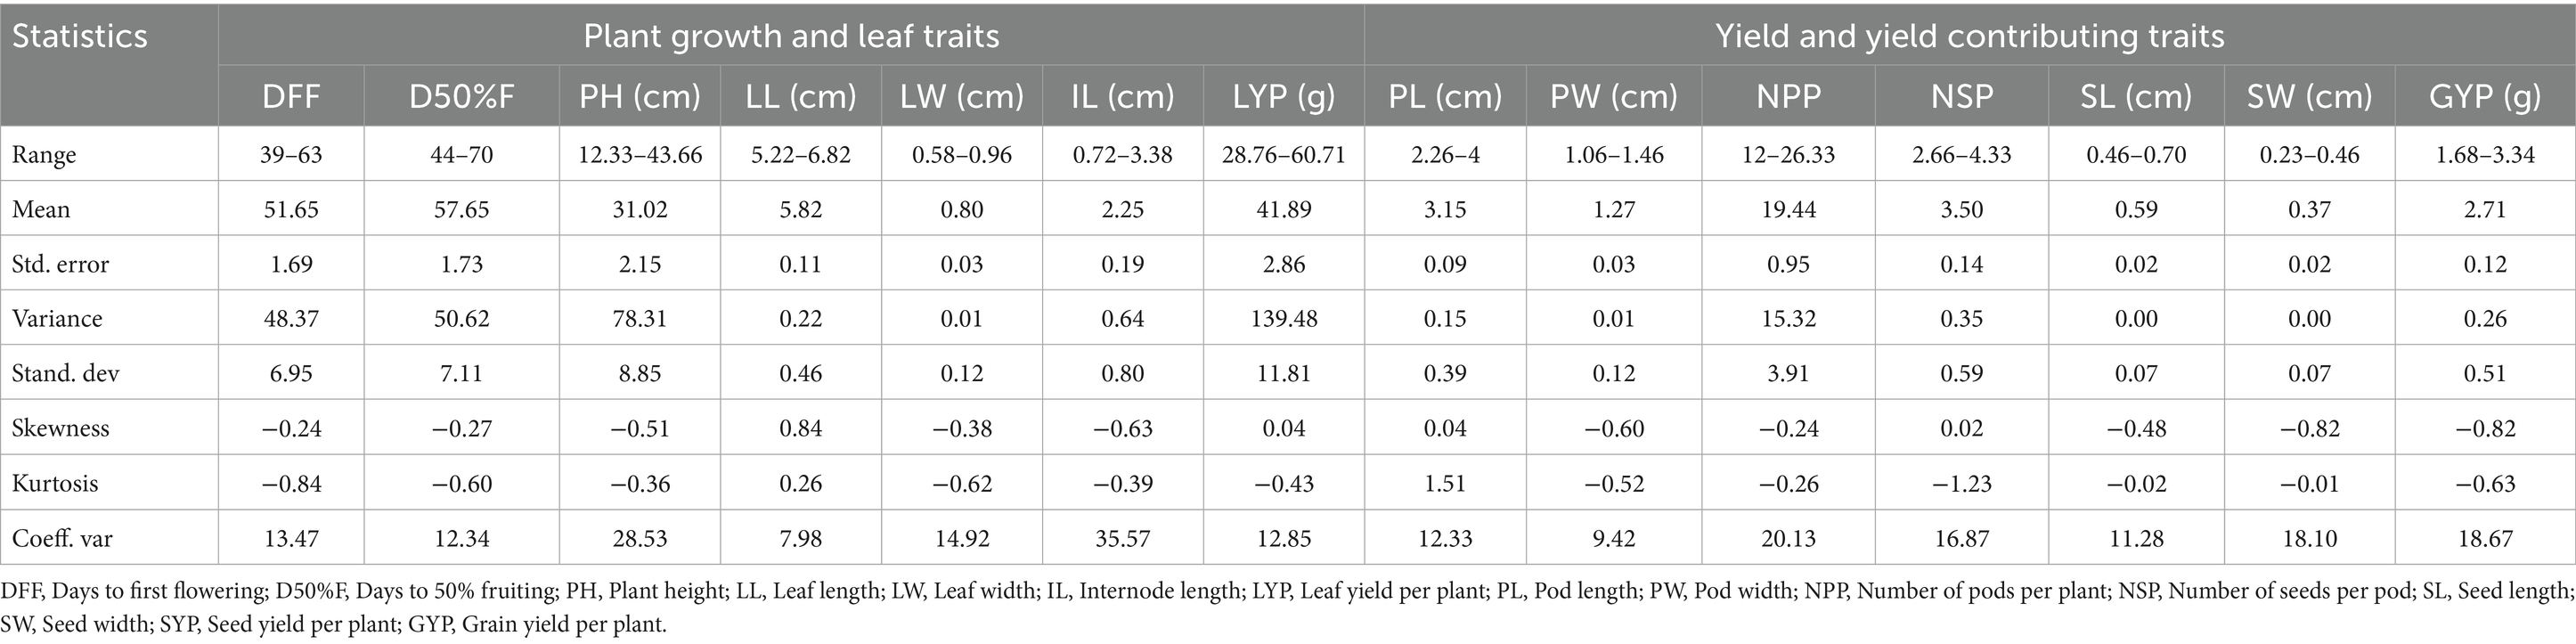
Table 3. Variability in plant growth, leaf traits, and yield-related parameters among grass pea (Lathyrus sativus) lines.
3.2 Correlation studies
The correlation analysis revealed important associations among key agronomic traits in the studied grass pea lines (Table 4). Days to first flowering (DFF) and days to 50% flowering (D50%F) showed an exceptionally strong positive correlation (r = 0.986), confirming that these two developmental stages are closely synchronized. Plant height (PH) exhibited a significant positive relationship with seed length (SL) (r = 0.744), suggesting that seed dimension is a major contributor to overall plant stature. A notable positive correlation was observed between leaf width (LW) and seed width (SW) (r = 0.695), which may reflect coordinated resource allocation between vegetative and reproductive structures.
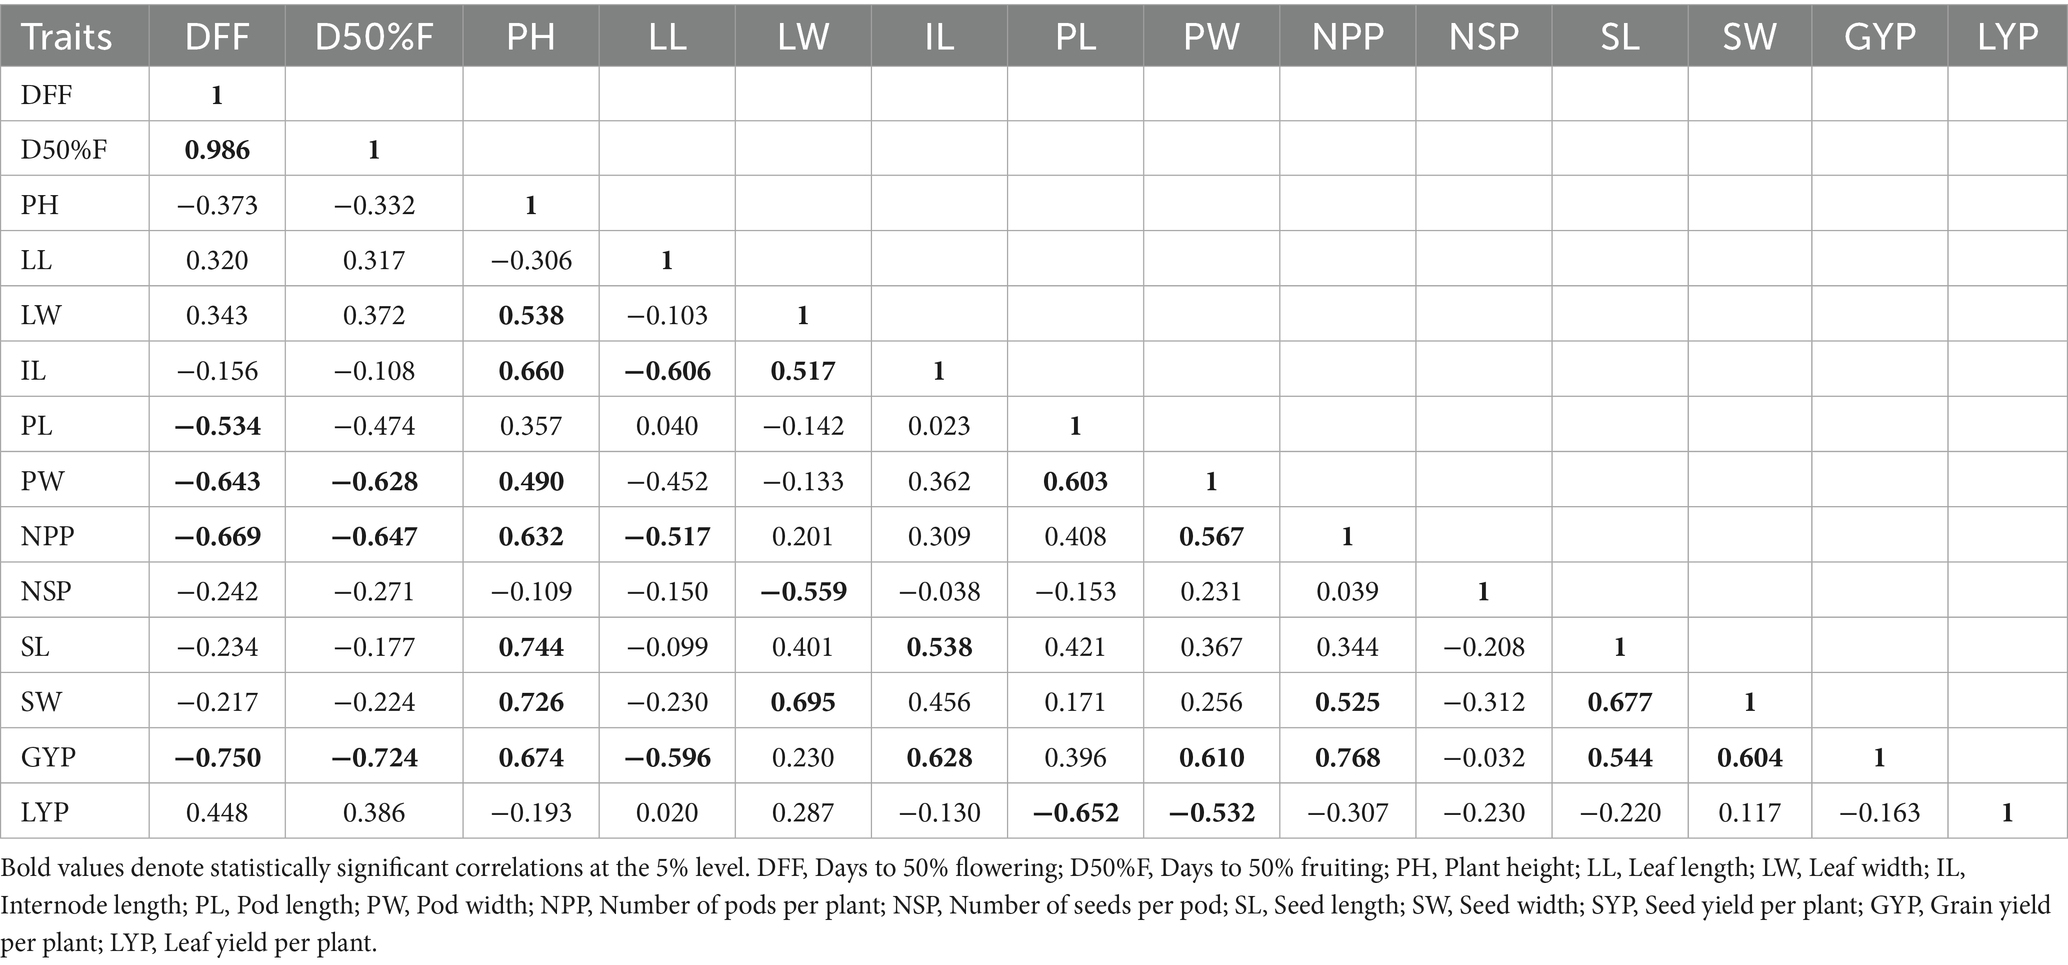
Table 4. Pearson correlation matrix among agronomic and yield-related traits in grass pea.
Of particular agronomic importance, days to first flowering (DFF) displayed a strong negative correlation with grain yield per plant (GYP) (r = −0.750), indicating that early-flowering genotypes tend to have higher yield potential. Pod length (PL) showed a significant negative association with leaf yield per plant (LYP) (r = −0.652), suggesting that plants investing more in pod elongation may allocate fewer resources to leaf biomass production. Additionally, the negative correlation between number of seeds per pod (NSP) and leaf width (LW) (r = −0.559) implies a potential trade-off between leaf expansion and seed number per reproductive unit.
These findings provide valuable insights into trait relationships that could guide selection strategies in breeding programs, particularly for optimizing the balance between vegetative growth and reproductive output. The strong associations between flowering time and yield components, as well as between pod morphology and leaf production, highlight key factors that may influence crop productivity and help in multiple traits selection.
3.3 Variation in imbibition kinetics among grass pea lines
The Figure 1 depicts the imbibition kinetics of various grass pea genotypes by tracking their weight gain (in grams) over time during water uptake. The x-axis represents the imbibition duration from 9:40 to 6:40 (9 h), culminating when seeds reached full hydration (“Fully imbibed”), while the y-axis shows the incremental water absorption (0 to 0.35 gm). Distinct genotypic differences in imbibition rates are evident, with some genotypes like Ratan, RCEGP-2, 75049, 75016 and 75017 exhibiting rapid water uptake, as indicated by their steep initial curves, suggesting superior adaptation to environments requiring quick germination, such as rice fallow systems. In contrast, genotypes like 75046, RCEGP-6 and RCEGP-3 displayed slower imbibition, with gradual weight gain, which may be advantageous in waterlogged conditions where rapid hydration could lead to hypoxia stress.
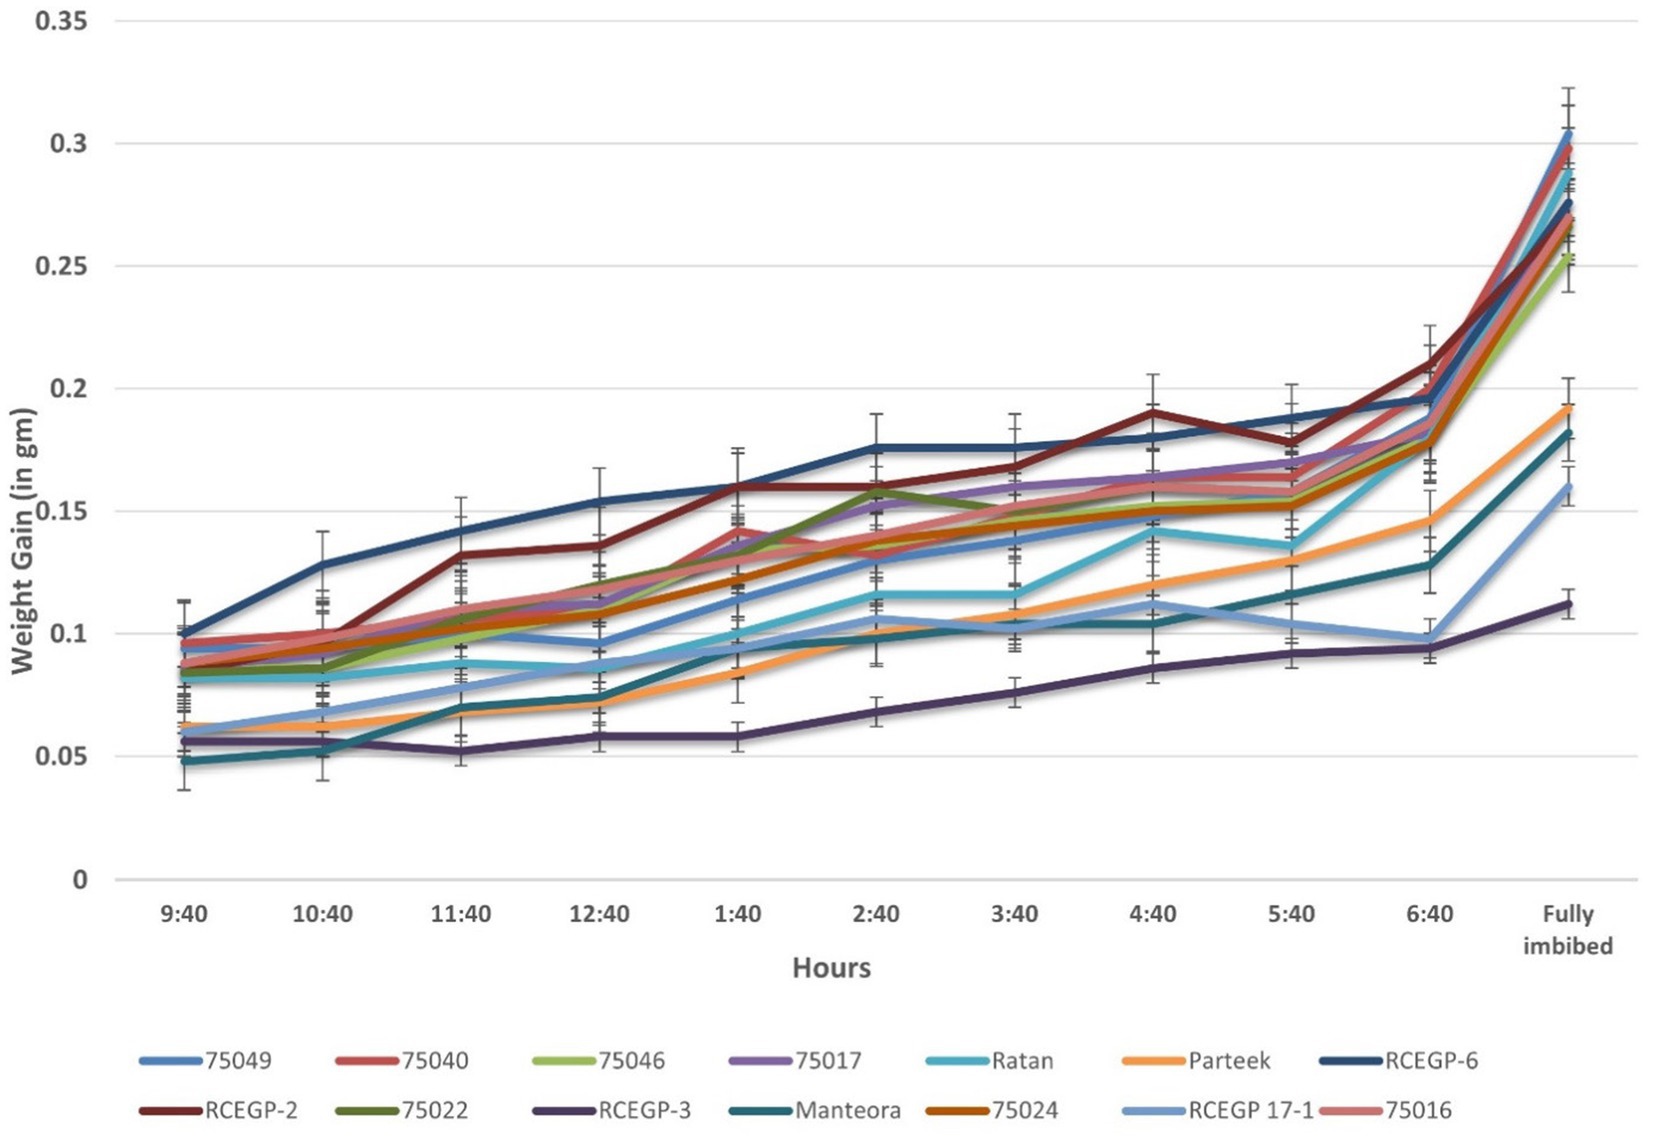
Figure 1. Water imbibition kinetics of different grass pea lines over time.
For better understanding, the germination index (GI) was calculated to assess seed vigor and emergence rate. The Table 5 presents the mean GI values of seventeen grass pea (Lathyrus sativus L.) genotypes, grouped statistically using Tukey’s Honest Significant Difference (HSD) test. GI reflects both the speed and uniformity of germination, where higher values denote greater vigor. Significant variation was observed among genotypes, with RCEGP-2 showing the highest GI (13.5), followed by Ratan and 75016, indicating superior seed vigor and rapid emergence. In contrast, RCEGP-6, RCEGP-3, and 75046 exhibited the lowest GI, suggesting poor and delayed germination. These variations highlight the potential for selecting or breeding genotypes tailored to specific moisture conditions, with fast-imbibing types being ideal for drought-prone areas and slower-imbibing types potentially better suited for environments with unpredictable water availability. The findings underscore the importance of imbibition efficiency as a critical trait for improving grass pea’s adaptability across diverse agroclimatic conditions.
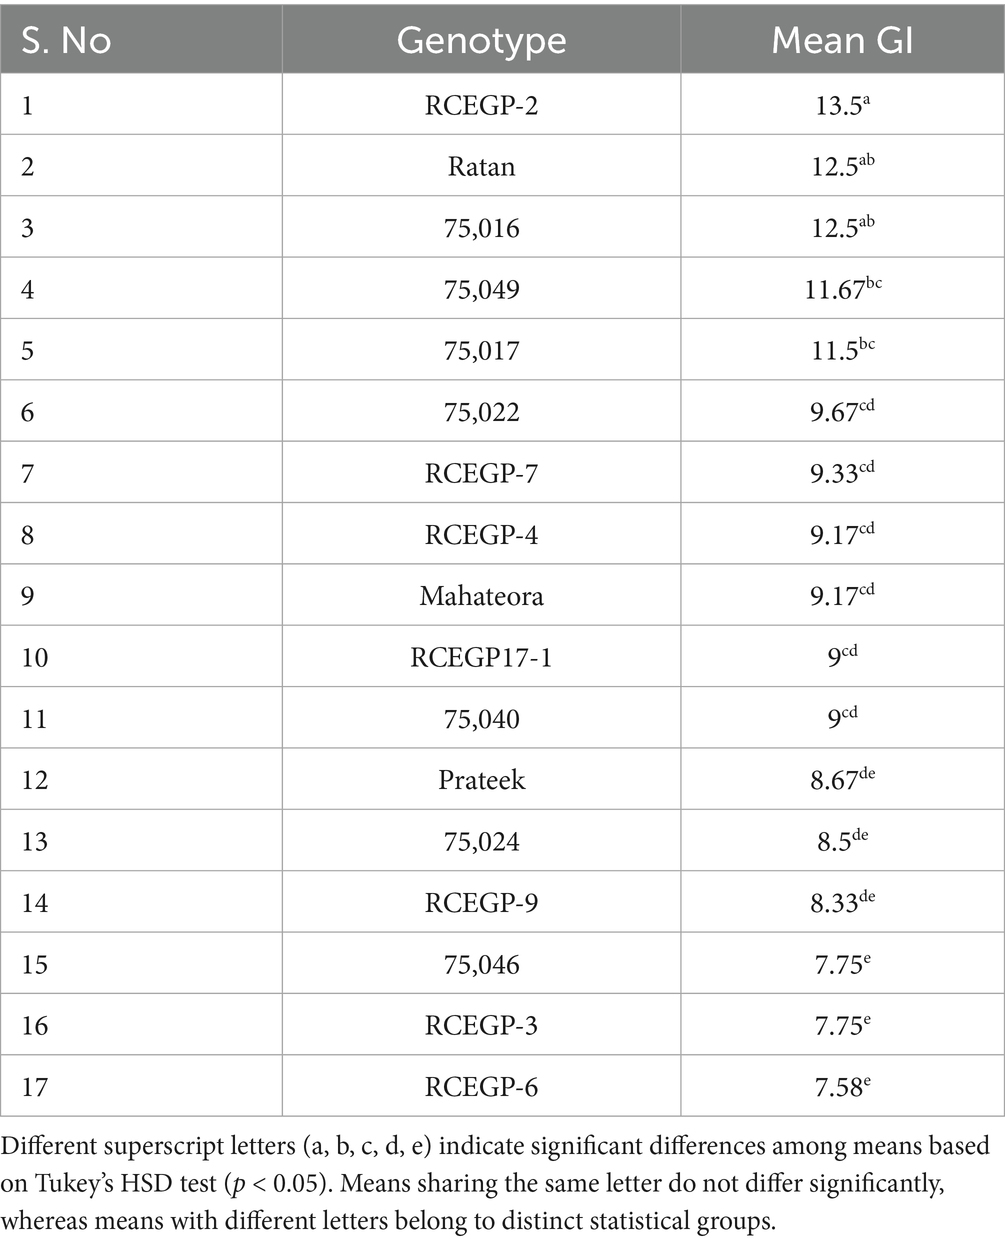
Table 5. Grouping of grass pea genotypes by germination index using Tukey’s HSD test.
3.4 Multivariate analysis
Principal component analysis (PCA) of fourteen morphological and agronomic traits effectively captured the variation patterns within grass pea lines. The Kaiser-Meyer-Olkin (KMO) Measure of Sample Adequacy (>0.5) confirmed the dataset’s suitability for factor analysis. The analysis revealed five significant principal components (PCs) collectively explaining 88.54% of the total variation. PC1 emerged as the most significant component with an eigenvalue of 5.912, accounting for 42.23% of the variance. Subsequent components showed progressively smaller eigenvalues (PC2 = 3.150, PC3 = 1.574, PC4 = 1.048, PC5 = 0.712), following the characteristic scree plot pattern of diminishing returns (Figure 2). The first four PCs alone captured 83.46% of the total variance, demonstrating their effectiveness in summarizing the major patterns of variation in the grass pea lines (Table 6).
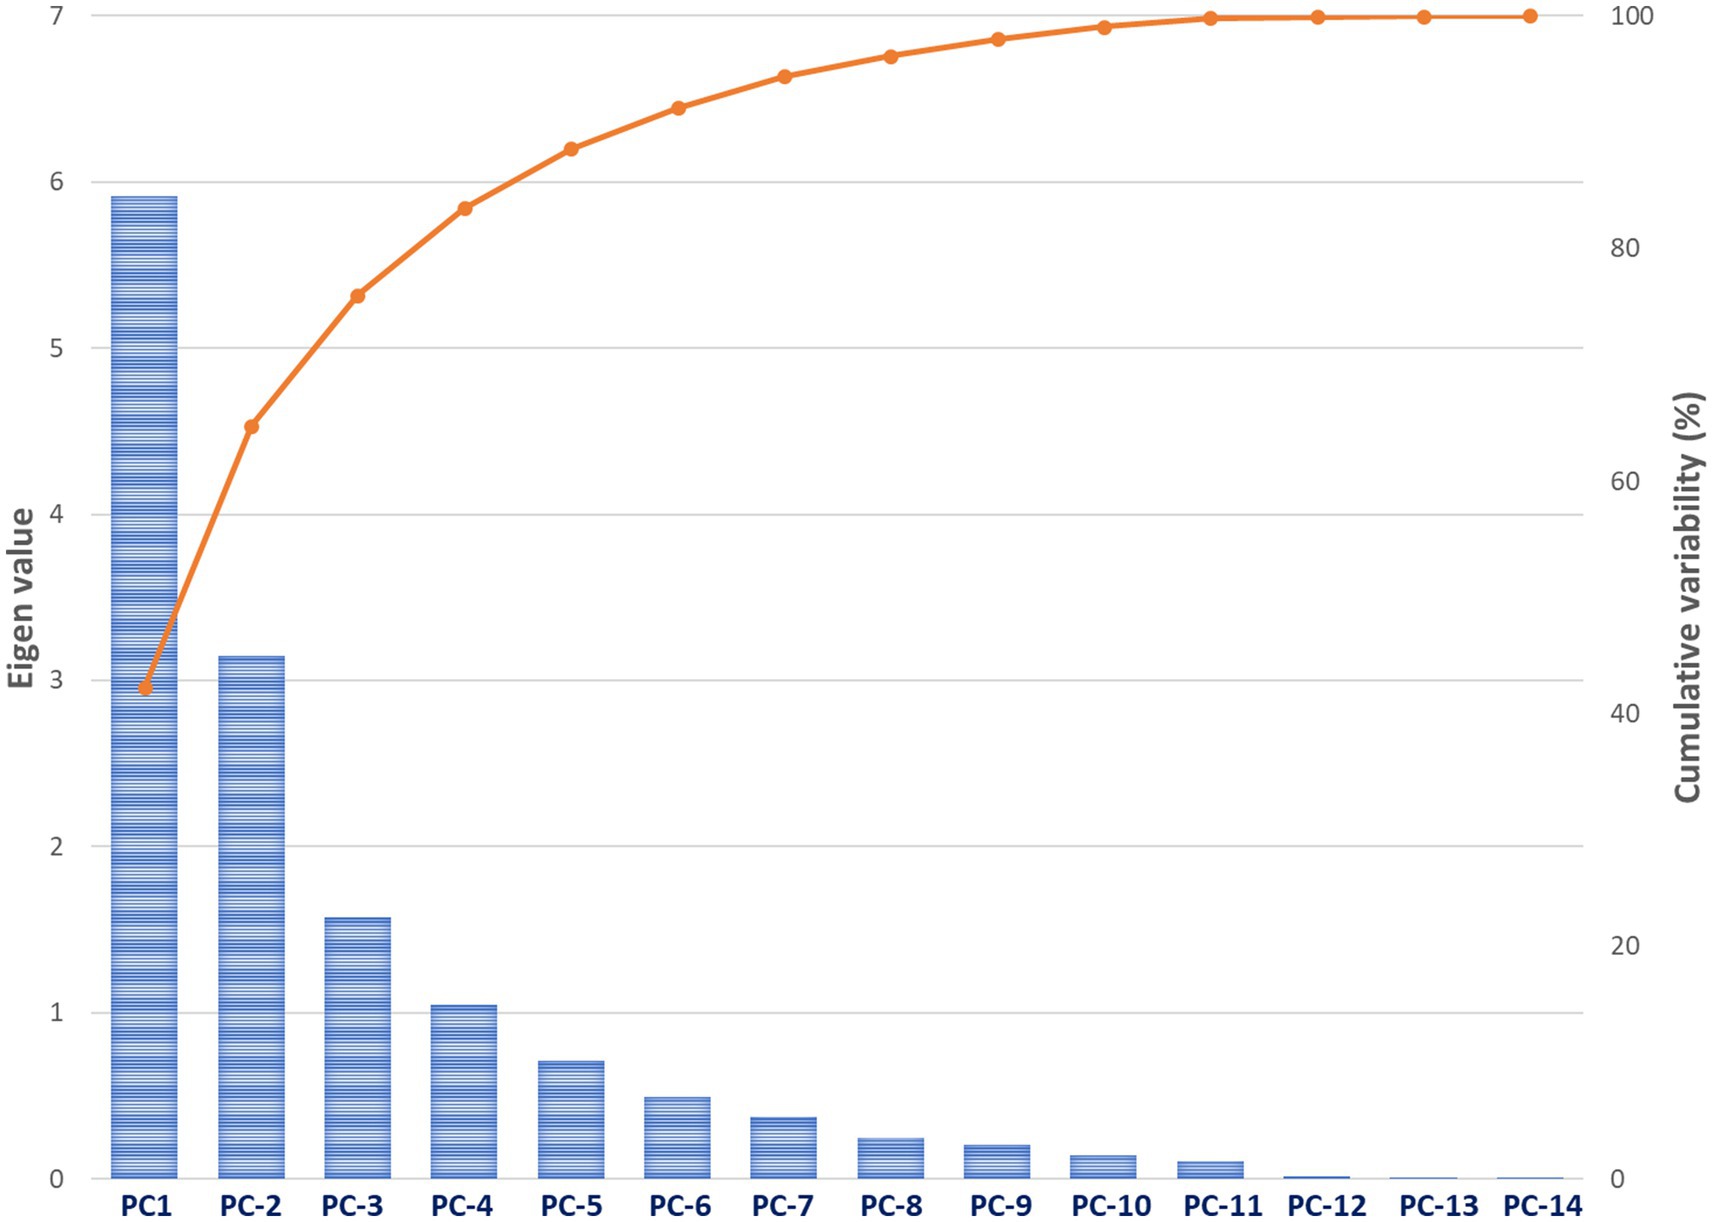
Figure 2. Scree plot and cumulative variance of principal components in grass pea morpho-agronomic traits analysis.
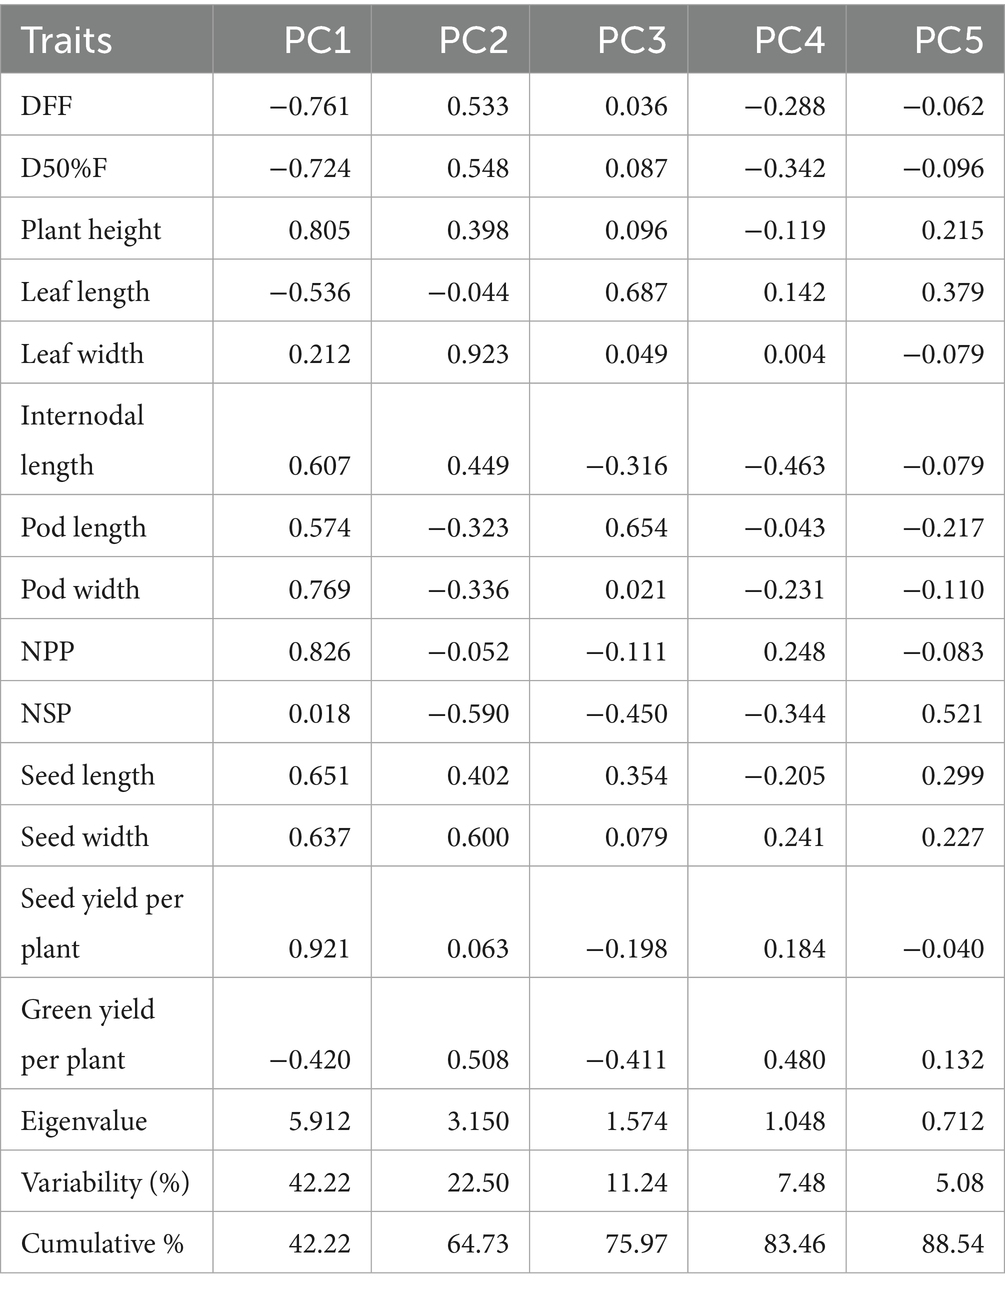
Table 6. Eigen values, accumulated variance and correlations between original variables and the first five PCs representing variability of grass pea lines.
The first principal component (PC1) accounts for the largest proportion of variance at 42.23% and is strongly associated with growth and yield-related traits, showing high positive loadings for plant height (0.805), pod width (0.769), number of pods per plant (0.826), and seed yield per plant (0.921), while displaying strong negative correlations with days to first flowering (−0.761) and days to 50% flowering (−0.724). This suggests that PC1 primarily represents a trade-off between early flowering and high yield potential. The second component (PC2) explains 22.50% of the variation and is dominated by leaf width (0.923) with a negative influence from the number of seeds per pod (−0.590), indicating a separation between plants with broader leaves and those producing more seeds per pod. PC3 contributes 11.24% of the variability and is characterized by positive associations with leaf length (0.687) and pod length (0.654), contrasting with negative loading for internodal length (−0.316). The remaining components (PC4 and PC5) account for smaller portions of the variation (7.48 and 5.08% respectively) and involve more specific trait relationships, such as the influence of green yield per plant on PC4 (0.480) and number of seeds per pod on PC5 (0.521). The analysis reveals that the first two principal components capture nearly 65% of the total variability, highlighting their importance in understanding the underlying structure of the data and identifying key traits for potential crop improvement strategies focused on yield, flowering time, and morphological characteristics (Table 6).
Cluster analysis was performed using the UPGMA (Unweighted Pair Group Method with Arithmetic Mean) algorithm to elucidate genotypic relationships. The validity of the resulting clusters was statistically verified using the Calinski-Harabasz Index (CHI) Table 7, which quantitatively assesses between-cluster separation versus within-cluster cohesion. This combined approach provides robust evidence that the observed groupings reflect true differences among genotypes. The study reveals important insights into the genetic diversity of grass pea lines through cluster analysis, with significant implications for breeding programs. The genotypes were grouped into five distinct clusters based on their genetic characteristics, showing varying levels of relatedness (Tables 8, 9). Cluster I emerged as the largest group, comprising nine closely related genotypes (Prateek, 75024, RCEGP-2, RCEGP-4, RCEGP-6, RCEGP17-1, 75022, 75040, and 75046), indicating strong genetic similarity among these accessions. In contrast, Cluster II contained just two genotypes (RCEGP-7 and RCEGP-3), while Cluster III included four (Mahateora, Ratan, 75017, and 75049). The remaining two clusters each contained a single unique genotype—RCEGP-9 in Cluster IV and 75016 in Cluster V—suggesting these may represent particularly distinct genetic resources.
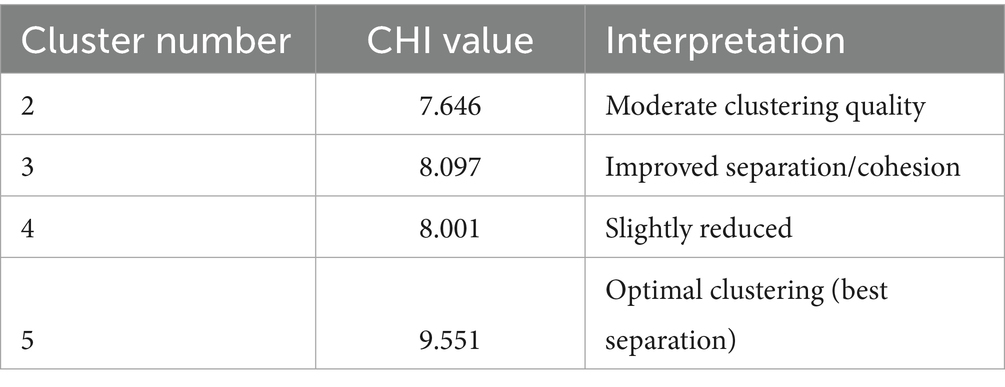
Table 7. Calinski-Harabasz Index (CHI) values for determining optimal cluster number.
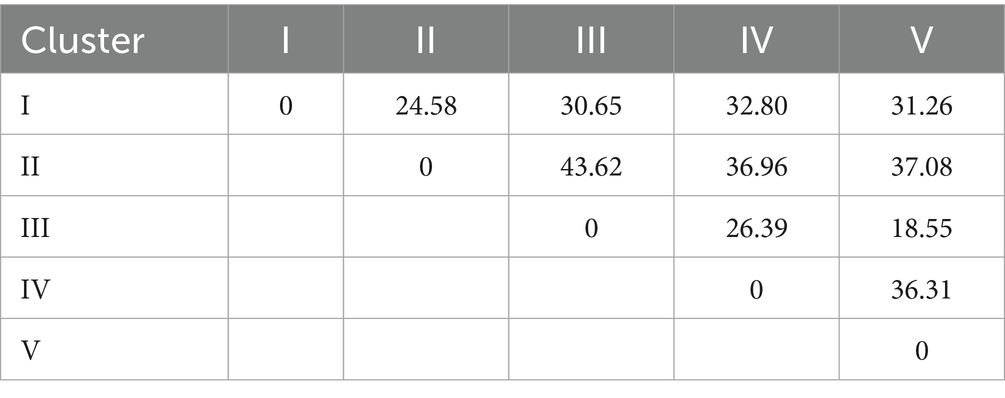
Table 8. Estimates of intra- and inter-cluster distances.
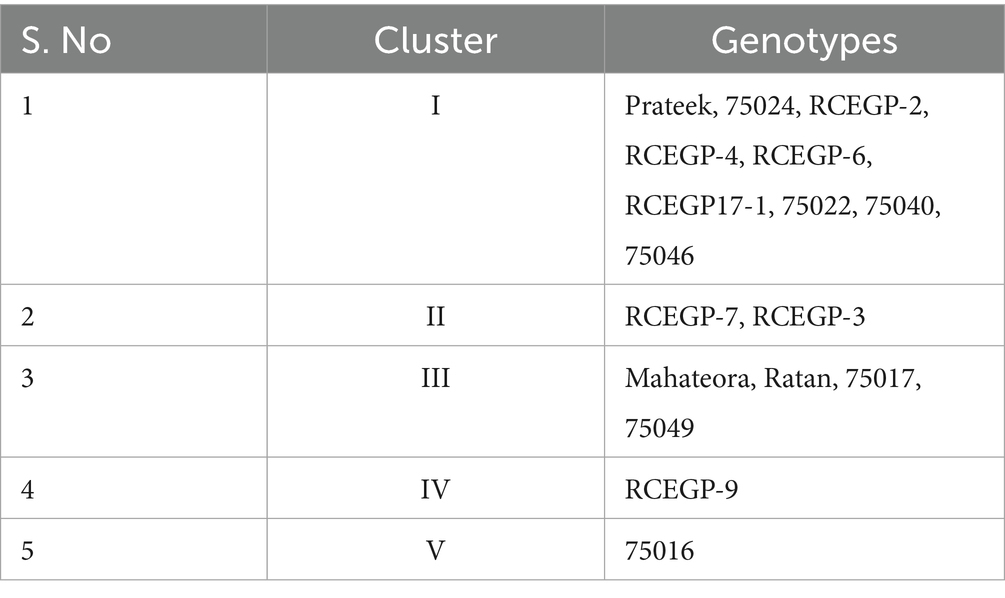
Table 9. Distribution of genotypes into five clusters using hierarchical clustering.
Analysis of inter-cluster distances further illuminates these relationships, with the zero diagonal values confirming tight genetic cohesion within each cluster. The most pronounced genetic divergence appears between Cluster II and Cluster III (distance = 43.62), marking them as the most distinct groups. Conversely, Cluster III and Cluster V show the closest relationship (distance = 18.55), potentially sharing valuable traits like drought tolerance or yield potential. The isolated nature of Clusters IV and V, each containing just one genotype, highlights their potential as unique genetic material for targeted breeding objectives. The high cophenetic correlation coefficient (0.705) confirmed strong clustering reliability, showing the UPGMA analysis effectively captured genetic relationships among the genotypes.
This clustering pattern provides a valuable framework for parental selection in breeding programs. The genetically diverse clusters (particularly II and III) offer opportunities for maximizing heterosis through strategic crosses, while the unique genotypes in Clusters IV and V may contribute specific desirable traits. The larger, more homogeneous Cluster I represents a pool of similar material that could be useful for trait stabilization.
4 Discussion
India dominates South Asia’s rice fallows, accounting for 79% (11.65 million ha) of the region’s 15 million ha. These post-kharif rice areas remain uncultivated in rabi due to climate-driven constraints: inadequate irrigation infrastructure, cultivation of the long-duration rice varieties that are harvested late and soil moisture imbalances at the time of crop establishment (Kumar et al., 2025; Ali and Kumar, 2009). Grass pea emerges as a climate-adaptive solution for the marginal systems (Gonçalves et al., 2024). To fully harness the potential of grass pea in revitalizing underutilized rice fallows, we focused on characterizing its dual-purpose utility-both as a leafy vegetable and a grain crop-a trait deeply valued in local food systems (Figure 3). Although limited supplemental irrigation was provided at the flowering and pod formation stages, it was applied only to prevent complete crop failure under exceptionally dry conditions. No irrigation was given during the vegetative phase, thereby allowing plants to experience the natural depletion of residual soil moisture typical of rice-fallow environments (Kumar et al., 2018). Early and strategic leaf picking (1–2 harvests before flowering) not only provides nutritious greens for household consumption but also stimulates lateral branching, which subsequently enhances pod formation and grain yield. This unique agronomic advantage ensures that farmers benefit from immediate nutritional and economic returns (through leafy vegetable sales) while simultaneously securing long-term gains from higher grain productivity (Tripathi et al., 2025). By integrating this dual-purpose trait into breeding programs, grass pea becomes an even more compelling candidate for sustainable intensification of rice fallows, as it maximizes resource use efficiency, improves farm income, and strengthens food security-all while thriving in the challenging post-rice growing conditions characterized by moisture stress, waterlogging, and low-input systems. It offers farmers a high-profit opportunity—yielding 10–11 quintals per hectare at ₹3,500 per quintal. After deducting the low cultivation cost of ₹8,000/ha, farmers can secure a solid ₹30,000/ha profit (Panda et al., 2021).
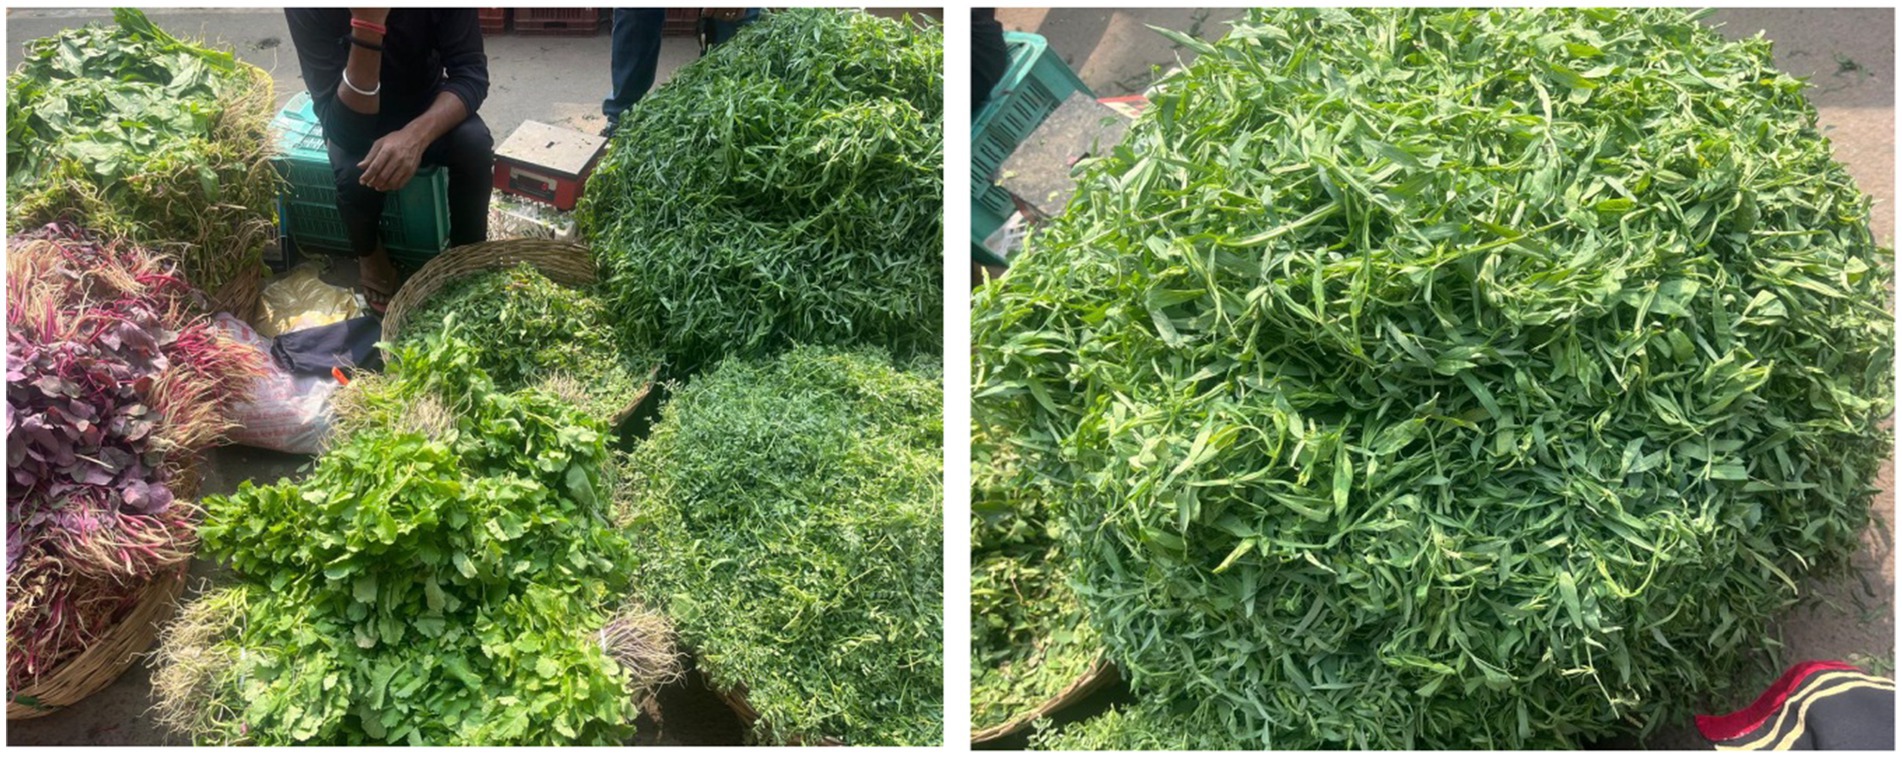
Figure 3. Sale of fresh grass pea (Khesari) leaves at a local market in Patna, India.
4.1 Morpho-agronomic characterization and utilization-based classification of grass pea lines for rice fallow diversification
The evaluation of grass pea genotypes reveals distinct phenotypic variations that can be strategically utilized for different production goals in rice fallow systems. In the present study, significant differences existed among lines for fourteen quantitative traits (Figure 4). The observed diversity in flowering time (39–63 days) presents a valuable opportunity to match genotypes with specific growing windows—late-maturing types are better suited for leafy vegetable production due to their extended vegetative phase and taller stature, while Earliness is vital for escaping terminal heat stress in short-winter climates, allowing the crop to complete flowering and pod-filling before the onset of damaging high temperatures (Gonçalves et al., 2025). The evaluated grass pea lines demonstrate potential for different utilization purposes in rice fallow systems. For specific grain production, early-flowering genotypes like 75017 (42 DFF, 3.21 g seed yield) and 75049 (45 DFF, 3.34 g seed yield) are optimal, combining high pod numbers (26.33 and 21.66 respectively) with excellent seed size and yield stability. Leaf-optimized lines are characterized by later maturity (DFF > 55 days) and superior vegetative traits, viz. 75024 (60.71 g green yield) and RCEGP-6 (60.43 g green yield, 0.96 cm leaf width), which support multiple harvests of quality nutritious green. Dual-purpose genotypes such as Mahateora (42 DFF, 2.98 g seed yield, 54.91 g green yield) and RCEGP-2 (59 DFF, 2.75 g seed yield, 46.45 g green yield) offer balanced performance, maintaining intermediate phenology with optimum productivity for both leaves and grain. Studies reveal grass pea’s genetic diversity for yield and growth traits globally (Hanbury et al., 1999; Arslan et al., 2022; Parihar et al., 2013) and regionally (Abate et al., 2018; Tadesse and Bekele, 2003), though leafy vegetable characteristics remain limited investigated.
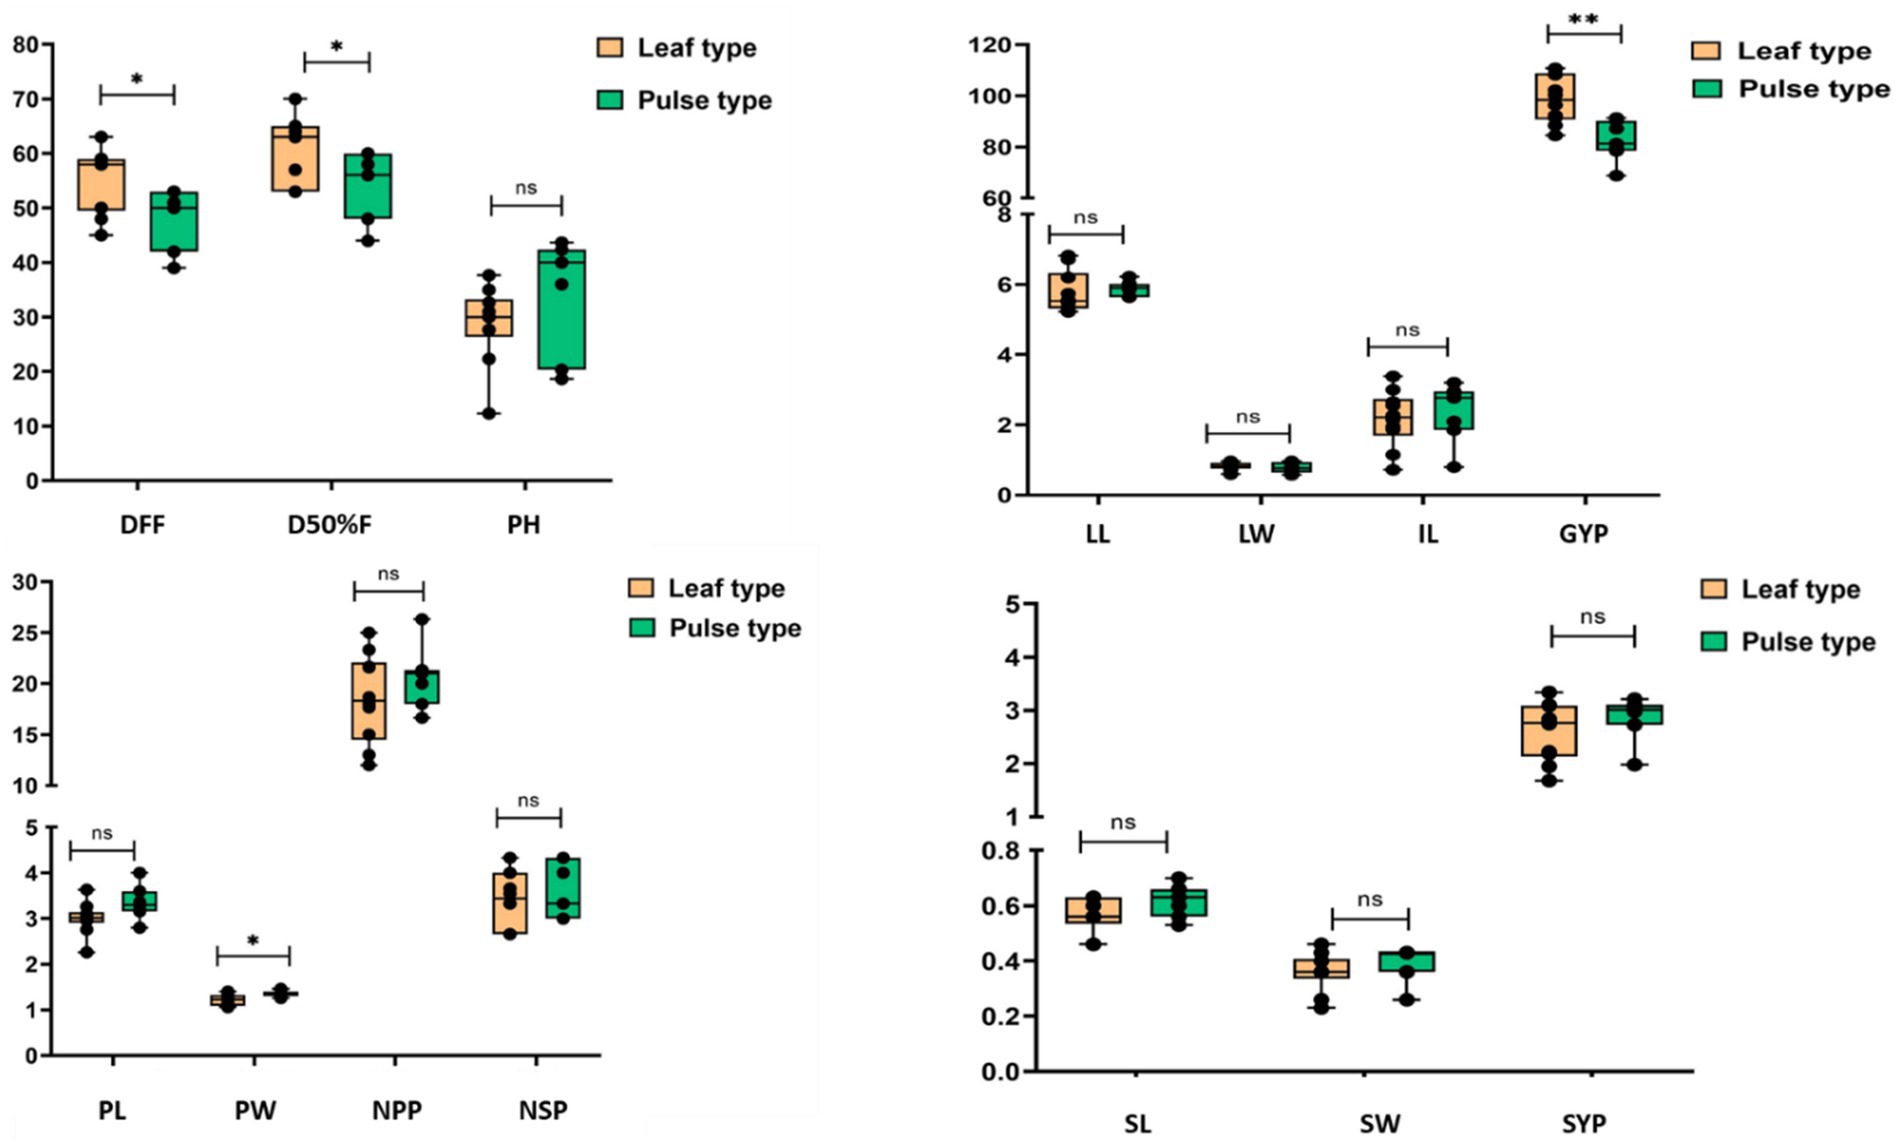
Figure 4. Comparison of agronomic traits between leaf type and pulse type grass pea lines through box and whisker plot.
4.2 Trait correlations for targeted grass pea improvement
The development of improved grass pea varieties necessitates simultaneous selection for multiple traits to achieve optimal trait combinations and understand potential pleiotropic effects (Akhtar et al., 2011; Diriba et al., 2014). Correlation analysis, through determination of Pearson’s correlation coefficients (r), provides a quantitative measure of linear dependence between phenotypic traits, indicated the potential of multiple trait selection (Maleki et al., 2024).
The correlation analysis revealed key trait associations for grass pea improvement. Early-flowering genotypes showed higher grain yield (DFF-GYP: r = −0.75), while broader-leaved types (LW-SW: r = 0.70) offered better dual-purpose potential. Late flowering extends the vegetative phase, increasing susceptibility to terminal drought and heat stress during pod filling (Lake and Sadras, 2014). Additionally, delayed flowering may shorten the reproductive window, limiting pod development and seed maturation before unfavorable conditions arise (Turcotte and Johnson, 2014). A critical trade-off emerged between pod and leaf production (PL-LYP: r = −0.65), requiring careful selection based on end-use goals. Plant height positively influenced yield through pod number (PH-NPP: r = 0.63, NPP-GYP: r = 0.77), while longer internodes improved productivity (IL-GYP: r = 0.63). These relationships provide clear selection criteria for developing specialized varieties—early, compact types for grain versus later, tall types for leafy production. The strong correlation between flowering stages (DFF-D50%F: r = 0.99) confirms the reliability of using first flowering as a selection marker. These findings enable precise breeding strategies to optimize either grain yield or leaf yield. Yield is a multifaceted trait, display variability influenced by several other contributing traits in grass pea (Maleki et al., 2025).
These findings align with the resource allocation theory proposed by Vaz Patto et al. (2006) and provide a physiological basis for developing selection indices that optimize dual-purpose performance without compromising farmer-preferred traits. However, scaling up dual-purpose grass pea cultivation requires attention to socio-economic and practical factors. Labor availability-particularly for leaf harvesting, often managed by women-can influence adoption. Mechanization or community-based labor-sharing models may ease this burden. Additionally, market access for grass pea as leafy vegetable remains limited; strengthening local value chains, improving aggregation, and creating consumer awareness could enhance profitability. Post-harvest issues like perishability and lack of storage further constrain expansion (Solovieva et al., 2025). Addressing these through low-cost processing and storage solutions can improve viability. Therefore, successful scaling requires genetic improvements as well as coordinated efforts in extension, input delivery, market linkage, and gender-sensitive interventions to ensure adoption in rice-fallow systems of eastern India.
4.3 Imbibition kinetics as a novel selection criterion for stress adaptation
Our detailed analysis of water uptake patterns revealed significant genotypic variation in imbibition behavior with important implications for crop establishment in rice-fallow systems. Fast-imbibing genotypes like Ratan, RCEGP-2, 75049, 75016 and 75017 demonstrated superior capacity for rapid establishment using residual soil moisture, a critical trait given the typically narrow planting window after rice harvest (Gumma et al., 2016). Their steep initial hydration curves (0.25–0.30 g water uptake within 6 h) suggest adaptation to drought-prone environments where quick germination is essential. Conversely, slower imbibing genotypes like 75046, RCEGP-6 and RCEGP-3 may be better suited for waterlogged conditions, as rapid hydration can exacerbate hypoxic stress during germination (Gonçalves et al., 2022). Figure 5 and Table 5 shows that genotypes exhibiting faster water uptake during imbibition also tended to germinate earlier, suggesting a possible positive association or direct proportionality between imbibition rate and germination efficiency. These findings align with those reported by Chibarabada et al. (2014), who observed that certain genotypes absorbed water more slowly than others. This delayed absorption may result from substances present on the seed coat or within the seed itself, which can hinder metabolic processes essential for germination, restrict oxygen availability to the embryo, or impede the release of carbon dioxide. Additionally, various germination inhibitors, such as tannins, phenolic acids, alkaloids, and aldehydes, have been identified as factors that can suppress germination (Marcos, 2005). These findings explained demonstrating how imbibition behavior could serve as a reliable, easily measurable selection criterion for specific rice-fallow environments, potentially improving establishment rates and reducing crop failure risks.
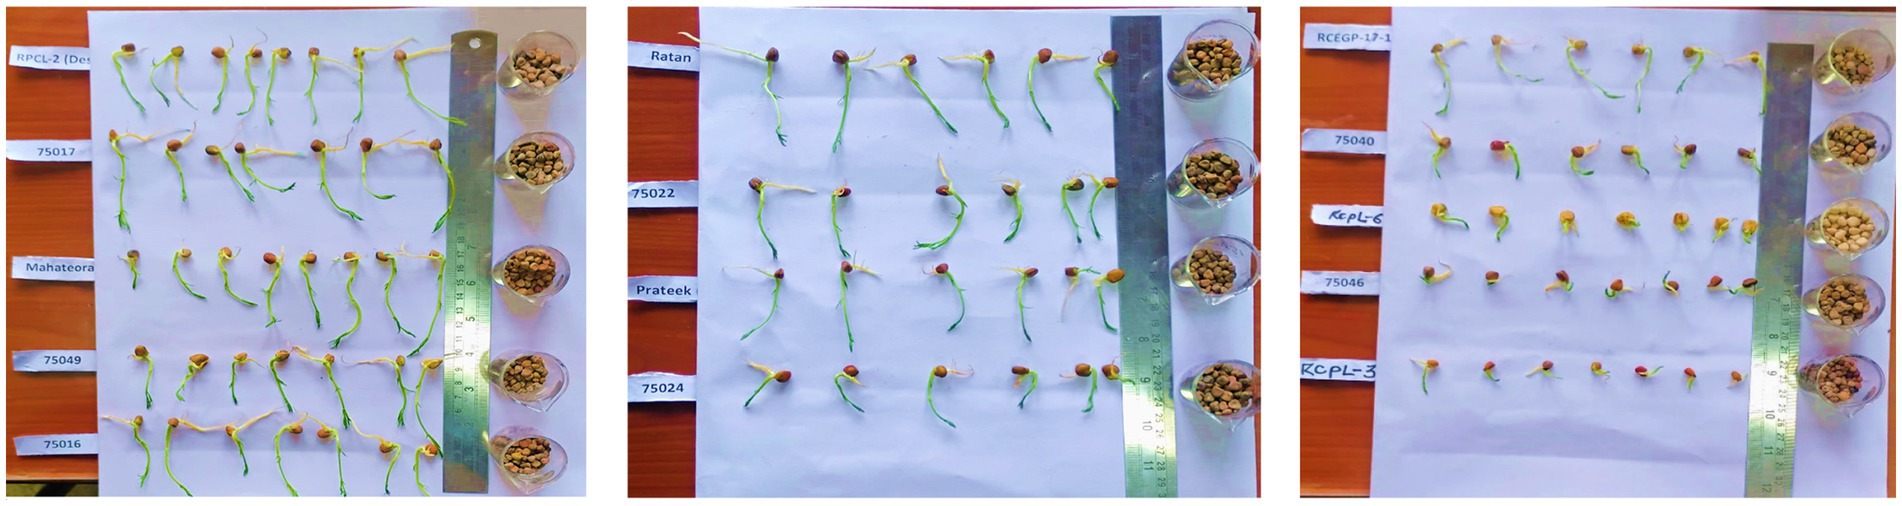
Figure 5. Comparative germination speed in grass pea seeds.
4.4 Multivariate analysis for efficient trait prioritization and selection
Principal Component Analysis provided a robust framework for identifying key selection targets, with the first two components explaining 64.73% of total variation. PC1 (42.22% variance) strongly associated high yield traits (grain yield loading = 0.921) with early flowering (DFF loading = −0.761), validating conventional breeding priorities while quantifying their relative importance. PC2 (22.50% variance) effectively separated broad-leaved genotypes (leaf width loading = 0.923) from those with higher seed production (number of seeds per pod loading = −0.590), suggesting independent genetic control of these characteristics. Principal components with eigenvalues greater than 1 (Kaiser criterion; Brejda et al., 2000) and those accounting for at least 5% of the total variation (Sharma et al., 2005; Gui et al., 2010) were retained for further analysis. Confirm the reliability of these patterns for breeding decisions, supporting their use in developing cultivars for sustainable production systems. In a PCA biplot (Figure 6), trait arrows indicate the direction of increasing trait values, with genotypes positioned closer to an arrow exhibiting higher expression of that trait. Longer arrows represent traits with greater contributions to overall variation, highlighting their importance in genotype differentiation. The angular relationships between arrows reveal trait correlations: acute angles denote positive associations, obtuse angles (near 180°) indicate negative relationships, and right angles (~90°) suggest little to no correlation. This visualization aids in identifying key traits for selection and understanding trade-offs in breeding programs (Yan and Kang, 2002). Thus, the prominent characters coming together in different principal components and contributing toward explaining the variability have the tendency to remain together (Figure 7).
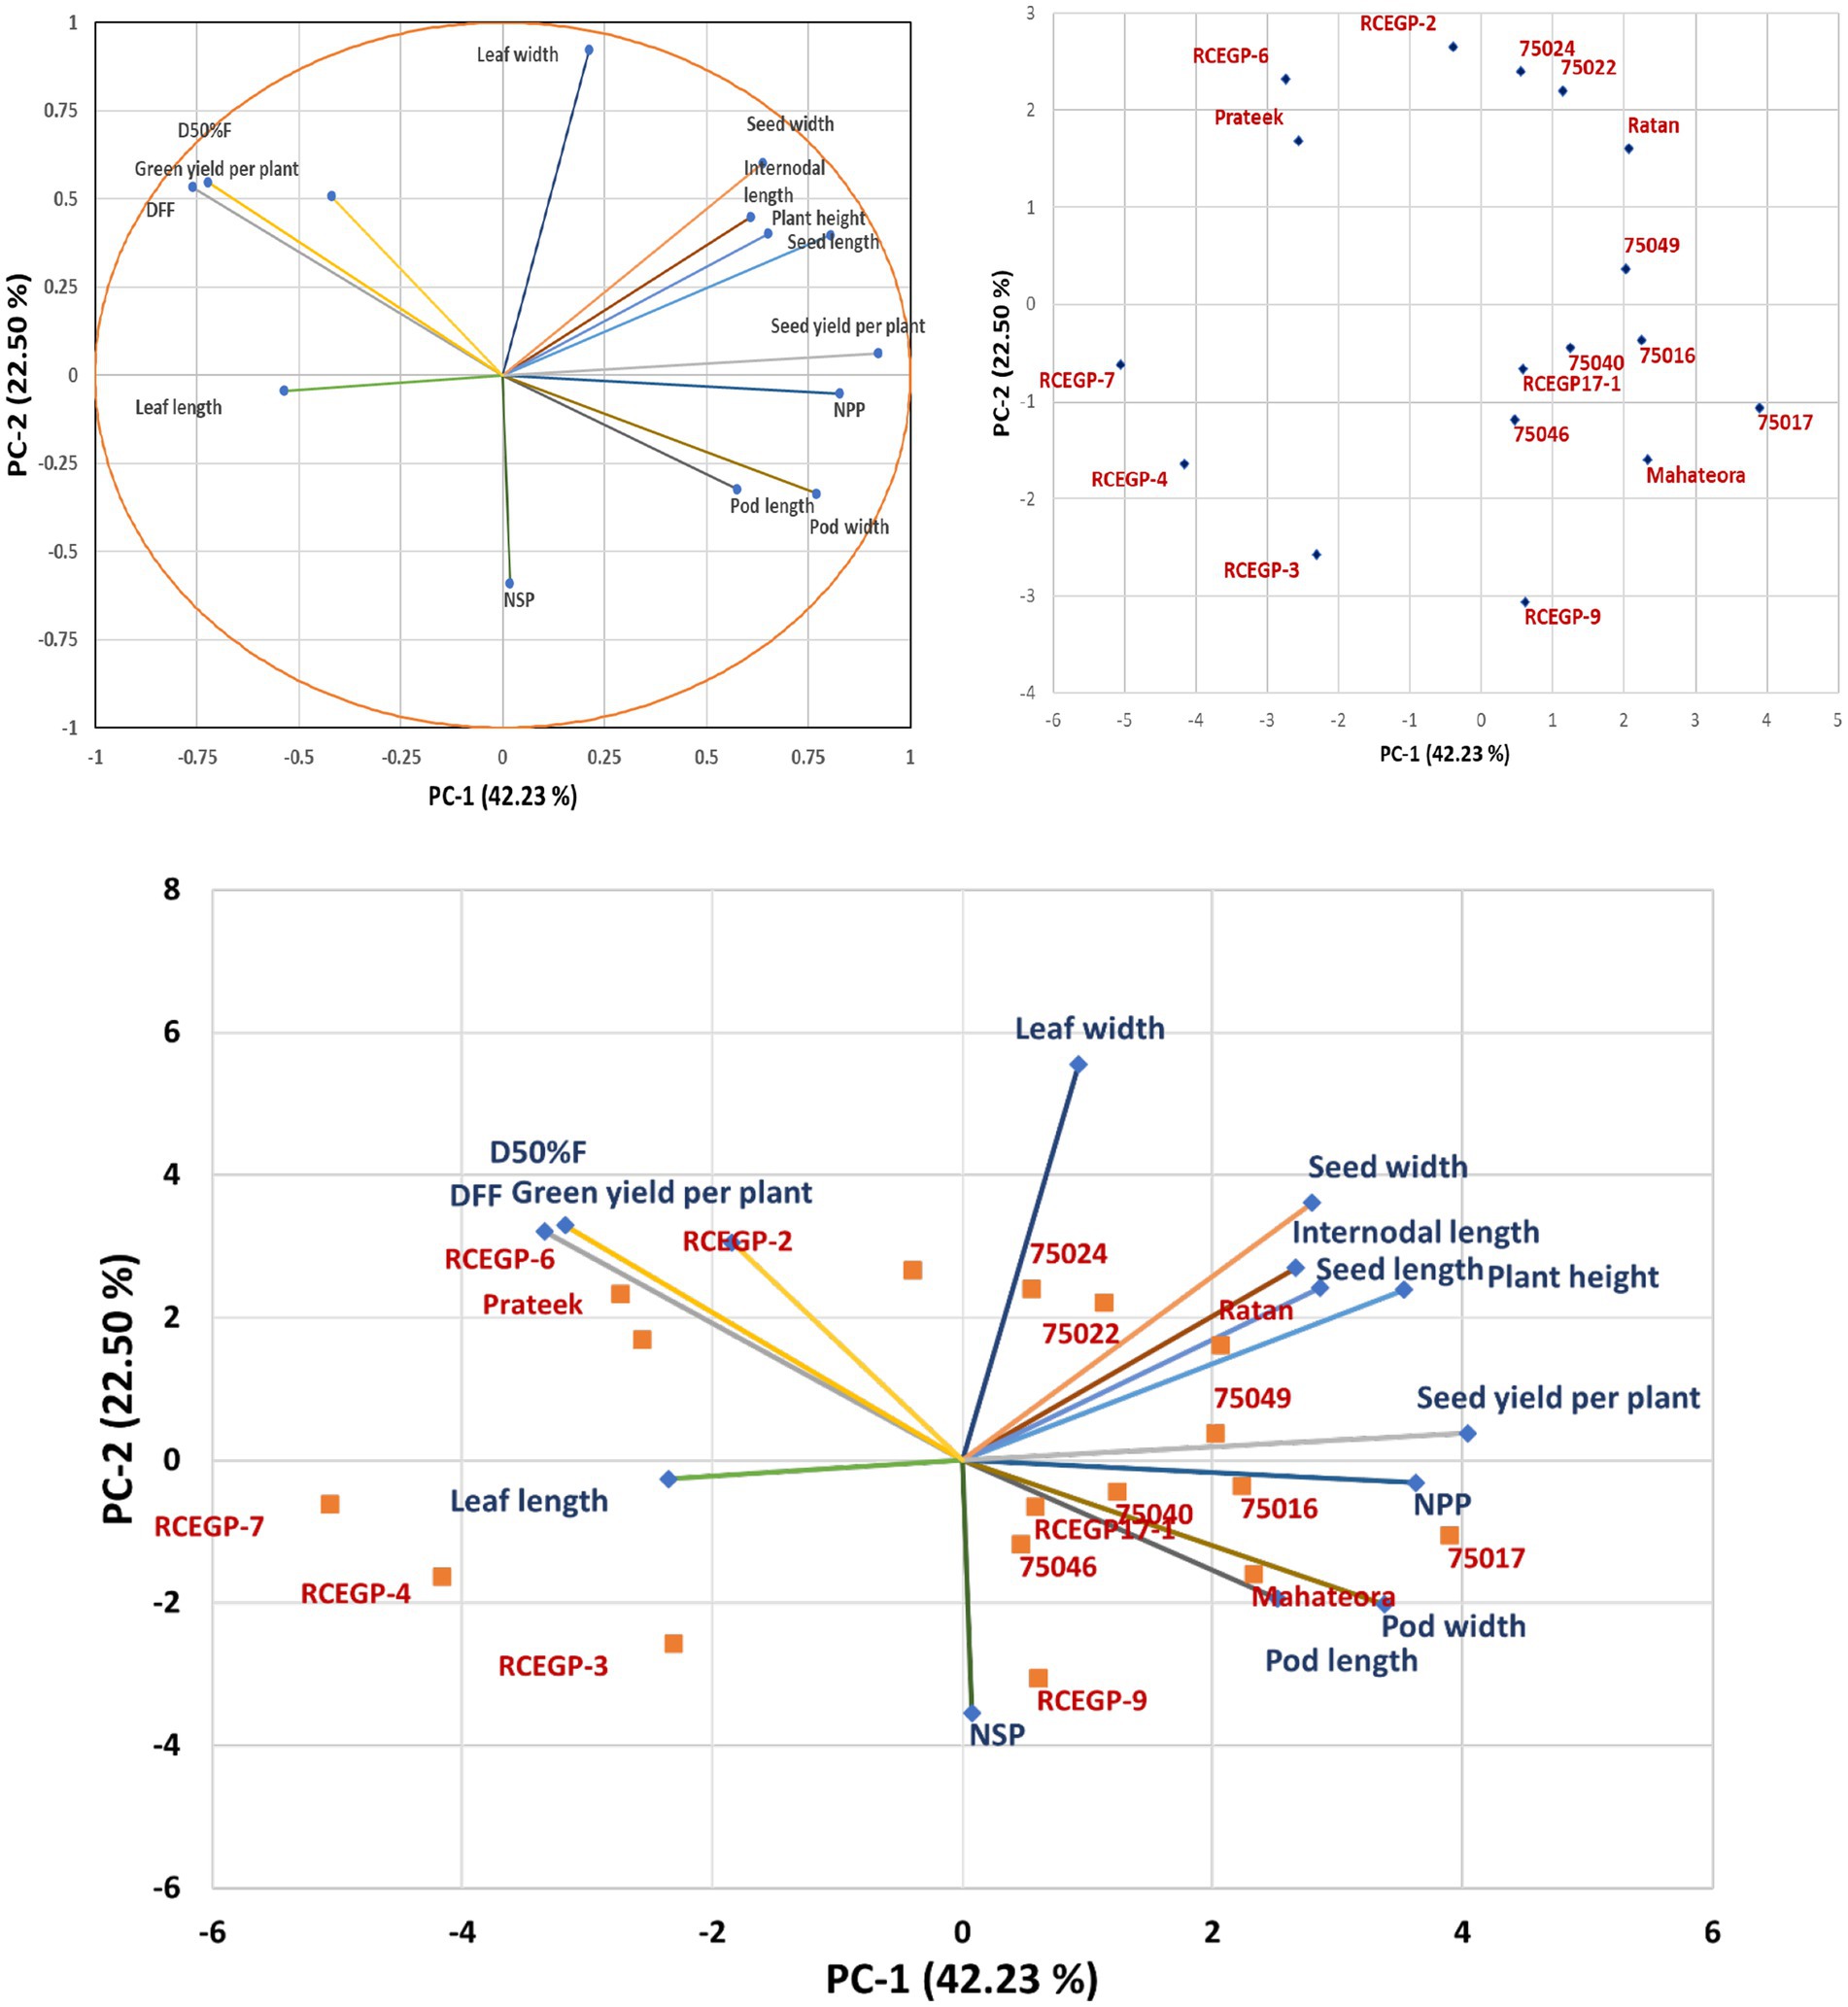
Figure 6. Principal component analysis and biplot visualization of morpho-agronomic traits variation and genotype relationships in grass pea.
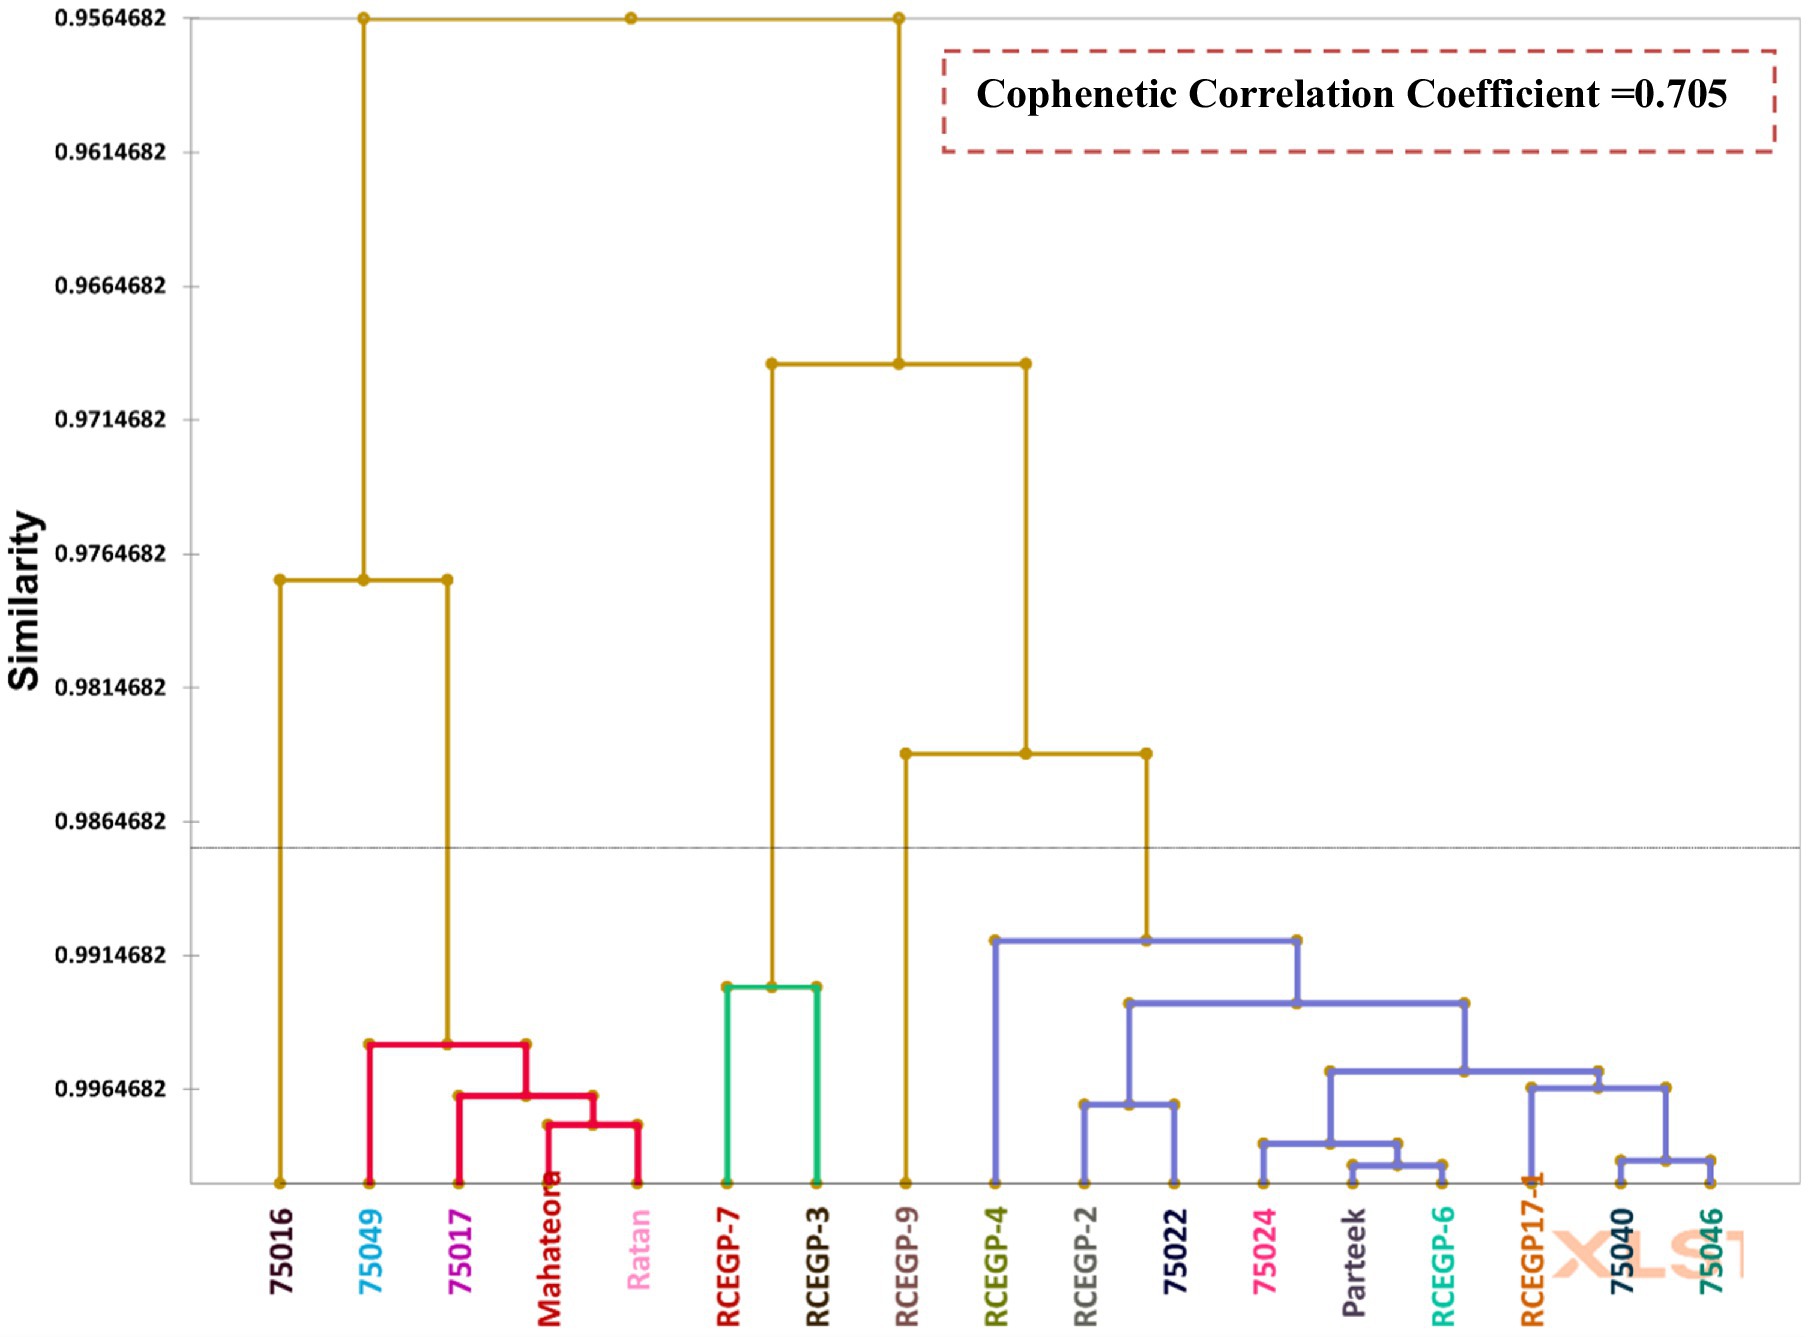
Figure 7. Hierarchical clustering of grass pea genotypes based on morpho-agronomic traits.
Cluster analysis delineated five genetically distinct groups (Figure 6), revealing diverse opportunities for crop improvement. Notably, pulse-type (III) and leafy-type (I) genotypes segregated into separate clusters, confirming their divergent genetic backgrounds. The pronounced divergence between Clusters II and III (genetic distance = 43.62) surpassed typical pulse crop values (cf. Campbell et al., 1993), highlighting exceptional potential for heterosis breeding. Meanwhile, genetically unique genotypes-RCEGP-9 (Cluster IV) and 75016 (Cluster V)-emerged as promising donors for abiotic stress tolerance, particularly in rice-fallow environments. The dendrogram’s cophenetic correlation coefficient (0.705) was close to 1, indicating strong clustering reliability (Chaudhuri and Ambhaikar, 2014) and a robust representation of the original data. This UPGMA analysis effectively revealed genetic relationships among the 17 grass pea genotypes. These findings advocate a three-pronged breeding strategy: (1) population enhancement within homogeneous clusters (e.g., Cluster I), (2) strategic hybridization of divergent groups (II × III) to capitalize on heterosis, and (3) targeted introgression of novel traits from genetically isolated lines (Clusters IV/V). The proposed heterosis breeding strategy (e.g., Cluster II × III crosses) aligns with recent evidence of hybrid-derived trait improvement in grass pea. While empirical evidence on hybrid vigor in L. sativus is limited, a diallel study by Lyngdoh et al. (2019) identified ‘Prateek’ as the best general combiner for high forage yield and low ODAP content. Additionally, Gonçalves et al. (2025) showed that crosses with L. cicera produced transgressive segregants with improved adaptive traits (e.g., earliness) and quality attributes (e.g., L-homoarginine content), alongside agronomically viable phenotypes. These findings support the potential of hybridization to introgression beneficial alleles, reinforcing our approach to exploit heterosis for yield and stress adaptation.
5 Conclusion
In conclusion, this study demonstrates how strategic breeding of dual-purpose grass pea can transform rice fallows from single-cropping systems into highly productive, double-window agricultural systems. The identification of elite genotypes-including high-yielding 75,017 (3.34 g/plant grain), leafy RCEGP-6 (60.43 g/plant greens), and versatile Mahateora (balancing grain and green yields)-provides a genetic foundation for targeted crop improvement. Key trait correlations (e.g., between early flowering and yield potential) and novel selection parameters (such as imbibition kinetics) offer precise breeding tools, while exceptional genetic diversity (with inter-cluster distances up to 43.62) creates opportunities for robust hybridization.
By aligning these genetic advances with farmer priorities (enhanced nutrition and drought tolerance) and ecological benefits (sustainable intensification), grass pea emerges as a climate-smart solution for marginal environments. These findings establish a actionable framework for developing next-generation cultivars that can simultaneously boost productivity in rice fallows while addressing food security, farmer livelihoods, and environmental sustainability.
Data availability statement
The original contributions presented in the study are included in the article/Supplementary material, further inquiries can be directed to the corresponding author.
Author contributions
KuS: Writing – original draft, Investigation, Data curation, Methodology, Conceptualization. AD: Supervision, Writing – review & editing, Funding acquisition. AC: Supervision, Conceptualization, Writing – review & editing. AM: Writing – review & editing, Visualization, Formal analysis. KiS: Validation, Data curation, Writing – review & editing. SaurK: Writing – review & editing, Software, Visualization. SantK: Writing – review & editing. AP: Writing – review & editing. SanjK: Writing – review & editing. UK: Writing – review & editing, Supervision.
Funding
The author(s) declare that no financial support was received for the research and/or publication of this article.
Acknowledgments
The authors are grateful to the ICAR-Research Complex for Eastern Region, Patna 800014, Bihar, India.
Conflict of interest
The authors declare that the research was conducted in the absence of any commercial or financial relationships that could be construed as a potential conflict of interest.
Generative AI statement
The authors declare that no Gen AI was used in the creation of this manuscript.
Any alternative text (alt text) provided alongside figures in this article has been generated by Frontiers with the support of artificial intelligence and reasonable efforts have been made to ensure accuracy, including review by the authors wherever possible. If you identify any issues, please contact us.
Publisher’s note
All claims expressed in this article are solely those of the authors and do not necessarily represent those of their affiliated organizations, or those of the publisher, the editors and the reviewers. Any product that may be evaluated in this article, or claim that may be made by its manufacturer, is not guaranteed or endorsed by the publisher.
Supplementary material
The Supplementary material for this article can be found online at: https://www.frontiersin.org/articles/10.3389/fsufs.2025.1625927/full#supplementary-material
References
Abate, A., Mekbib, F., Fikre, A., and Ahmed, S. (2018). Genetic variability and heritability in Ethiopian grasspea (Lathyrus sativus L.) accessions. Ethiop. J. Crop Sci. 6, 79–94.
Akhtar, N., Mehmood, T., Ahsan, M., Aziz, A., Ashraf, M., Ahmad, S., et al. (2011). Estimation of correlation coefficients among seed yield and some quantitative traits in wheat (Triticum aestivum L.). Afr. J. Agric. Res. 6, 152–157. doi: 10.5897/AJAR10.805
Ali, M., Ghosh, P. K., and Hazra, K. K. (2014). “Resource conservation technologies in rice fallow” in Resource conservation technology in pulses (India: Scientific Publishers), 83–88.
Ali, M., and Kumar, S. (2009). “Major technological advances in pulses-Indian scenario” in Milestones in food legumes research. eds. M. Ali and S. Kumar (Kanpur, India: Indian Institute of Pulses Research), 20.
Arslan, M., Yol, E., and Türk, M. (2022). Disentangling the genetic diversity of grass pea germplasm grown under lowland and highland conditions. Agronomy 12:2426. doi: 10.3390/agronomy12102426
Association of Official Seed Analysts (1983). Seed Vigor Testing Handbook. 1st Edn. East Lasing: AOSA, 88.
Brejda, J. J., Moorman, T. B., Karlen, D. L., Smith, J. L., and Dao, T. H. (2000). Identification of regional soil quality factors and indicators: I. Central and southern hill plains. Soil Sci. Soc. Am. J. 64, 2115–2124. doi: 10.2136/sssaj2000.6462115x
Campbell, C. G., Mehra, R. B., Agrawal, S. K., Chen, Y. Z., Abd El Moneim, A. M., Khawaja, H. I. T., et al. (1993). Current status and future strategy in breeding grasspea (Lathyrus sativus L.). Euphytica 73, 167–175. doi: 10.1007/BF00027192
Chaudhuri, A., and Ambhaikar, A. (2014). Performance comparison of hard and fuzzy clustering algorithms on ESTs of human genes. IJSR, 3, 1634–1638.
Chibarabada, T. P., Modi, A. T., and Mabhaudhi, T. (2014). Seed quality characteristics of a bambara groundnut (Vigna subterranea L.) landrace difering in seed coat colour. S. Afr. J. Plant Soil 31, 219–226. doi: 10.1080/02571862.2014.966340
Das, A., Parihar, A. K., Barpete, S., Kumar, S., and Gupta, S. (2021). Current perspectives on reducing the β-ODAP content and improving potential agronomic traits in grass pea (Lathyrus sativus L.). Front. Plant Sci., 12:703275. doi: 10.3389/fpls.2021.703275
Diriba, S., Mebeasellasie, A., and Habtamu, Z. (2014). Interrelationship and path coefficient analysis of some growth and yield characteristics in cowpea (Vigna unguiculata L. Walp) genotypes. J. Plant Sci. 2, 97–101. doi: 10.11648/j.jps.20140202.13
Dutta, N., Neog, S. B., Barua, P. K., and Verma, V. K. (2024). Evaluation of grass pea (Lathyrus sativus L.) landraces for genetic variability and character association for growth, yield and quality attributes. Indian J. Plant Genet. Resour. 37, 502–512. doi: 10.61949/0976-1926.2024.v37i03.13
Ghosh, P. K., Hazra, K. K., Nath, C. P., Das, A., and Acharya, C. L. (2016). Scope, constraints and challenges of intensifying rice (Oryza sativa) fallows through pulses. Indian J. Agron. 61, 122–128.
Gonçalves, L., Bento-Silva, A., do Rosário Bronze, M., Rubiales, D., and Patto, M. C. V. (2025). Lathyrus cicera x Lathyrus sativus interspecific hybrids: a way forward to quality and agronomic beneficial traits combination? J. Agric. Food Res. 23:102210. doi: 10.1016/j.jafr.2025.102210
Gonçalves, L., Rubiales, D., Bronze, M. R., and Vaz Patto, M. C. (2022). Grass pea (Lathyrus sativus L.)-a sustainable and resilient answer to climate challenges. Agronomy 12, 1–19. doi: 10.3390/agronomy12061324
Gonçalves, L., Rubiales, D., Lourenço, M., and Patto, M. C. V. (2024). Exploring grass pea (Lathyrus sativus L.) genetic diversity in Mediterranean changing climate conditions. Eur. J. Agron. 156:127142. doi: 10.1016/j.eja.2024.127142
Gui, D. W., Lei, J. Q., and Zeng, F. J. (2010). Farm land management effects on the quality of Sur face soil during oasification in the southern rim of the Tarim Basin in Xinjiang. China. Plant Soil Environ. 56, 348–356. doi: 10.17221/54/2009-PSE
Gumma, M. K., Thenkabail, P. S., Teluguntla, P., Rao, M. N., Mohammed, I. A., and Whitbread, A. M. (2016). Mapping rice-fallow cropland areas for short-season grain legumes intensification in South Asia using MODIS 250 m time-series data. Int. J. Digit. Earth 9, 981–1003. doi: 10.1080/17538947.2016.1168489
Hanbury, C. D., Siddique, K. H. M., Galwey, N. W., and Cocks, P. S. (1999). Genotype environment interaction for seed yield and ODAP concentration of Lathyrus sativus L. and L. cicera L. in Mediterranean-type environments. Euphytica 110, 45–60. doi: 10.1023/A:1003770216955
International Seed Testing Association (ISTA) (2015). Available at: https://www.seedtest.org
Kumar, R., Das, A., Mondal, S., Upadhyay, P. K., Bhatt, B. P., Mishra, J. S., et al. (2025). Greening rice-fallow areas: integrating pulses and oilseeds for sustainable cropping in eastern India. Front. Sustain. Food Syst. 9:1502759. doi: 10.3389/fsufs.2025.1502759
Kumar, S., Beijiga, G., Ahmed, S., Nakkoul, H., and Sarkar, A. (2011). Genetic improvement of grass pea for low neurotoxin (β-ODAP) content. Food Chem. Toxicol. 49, 589–600. doi: 10.1016/j.fct.2010.06.051
Kumar, R., Mishra, J. S., Upadhyay, P. K., and Hans, H. (2019). Rice fallows in the eastern India: problems and prospects. Indian J. Agric. Sci. 89, 567–577. doi: 10.56093/ijas.v89i4.88838
Kumar, N., Yadav, A., Singh, S., and Yadav, S. L. (2018). “Growing pulses in rice fallow: ensuring nutritional security in India” in Conservation agriculture for advancing food security in changing climate, vol. 1 (India: Today & Tomorrow’s Printers and Publishers), 107–122. doi: 10.1016/j.fct.2010.06.051
Lake, L., and Sadras, V. O. (2014). The critical period for yield determination in chickpea. Field Crop Res. 168, 1–7. doi: 10.1016/j.fcr.2014.08.003
Lambein, F., Travella, S., Kuo, Y. H., Van Montagu, M., and Heijde, M. (2019). Grass pea (Lathyrus sativus L.): orphan crop, nutraceutical or just plain food? Planta 250, 821–838. doi: 10.1007/s00425-018-03084-0
Lyngdoh, A. A., Neog, S. B., Sarma, A., Das, K., and Das, P. (2019). Heterosis and combining ability studies in a diallel cross of grass pea (Lathyrus sativus L.) genotypes for green forage yield and its component traits. Forage Res. 45, 183–188.
Maleki, H. H., Vaezi, B., Jozeyan, A., Mirzaei, A., Darvishzadeh, R., Dashti, S., et al. (2025). Grass pea dual purpose dry matter and seed yields in rainfed conditions across diverse environments. Sci. Rep. 15:4960. doi: 10.1038/s41598-025-89050-9
Maleki, H. H., Vaezi, B., Jozeyan, A., Mirzaei, A., Darvishzadeh, R., Dashti, S., et al. (2024). Deciphering genotype-by-environment interaction of grass pea genotypes under rain-fed conditions and emphasizing the role of monthly rainfall. BMC Plant Biol. 24:559. doi: 10.1186/s12870-024-05256-5
Panda, C. K., Narayan, U. P., Kumar, R., Mandal, D., and Siddiqui, M. W. (2021). Revival of grass pea cultivation in Bihar. Sabour, India: Bihar Agricultural University.
Pandey, P. R., Gaur, P. M., and Sajja, S. B. (Eds.) (2019). Pulses value chain development for achieving food and nutrition security in South Asia: current status and future prospects. Dhaka, Bangladesh: SAARC Agriculture Centre, 181.
Parihar, A. K., Dixit, G. P., and Singh, D. (2013). Multivariate analysis of various agronomic traits in grasspea (Lathyrus spp.) germplasm. Indian J. Agric. Sci. 83, 570–575.
Sharma, K. L., Mandal, U. K., Srinivas, K., Vittal, K. P. R., Mandal, B., Grace, J. K., et al. (2005). Long-term soil management effects on crop yields and soil quality in a dry land Alfisol. Soil Tillage Res. 83, 246–259. doi: 10.1016/j.still.2004.08.002
Shubha, K., Choudhary, A. K., Dubey, A. K., Tripathi, K., Kumar, R., Kumar, S., et al. (2024). Evaluation of lablab bean [Lablab purpureus (L.) sweet] genotypes: unveiling superior pod yield, nutritional quality, and collar rot resistance. Front. Nutr. 10:1243923. doi: 10.3389/fnut.2023.1243923
Shubha, K., Choudhary, A. K., Eram, A., Mukherjee, A., Kumar, U., and Dubey, A. K. (2022). Screening of yardlong bean (Vigna unguiculata (L.) Walp. Ssp. unguiculata cv.-gr. Sesquipedalis) genotypes for seed, yield and disease resistance traits. Genet. Resour. Crop. Evol. 69, 2307–2317. doi: 10.1007/s10722-022-01418-2
Solovieva, I., Miteva-Bölter, P., Knez, M., Bessai, A. K., Barilli, E., Kasperczyk, N., et al. (2025). Exploring the potential and challenges of Lathyrus sativus (grass pea) in European Agri-food value chains: A cross-country analysis. Sustainability 17:3283. doi: 10.3390/su17083283
Tadesse, W., and Bekele, E. (2003). Variation and association of morphological and biochemical characters in grass pea (Lathyrus sativus L). Euphytica 130, 315–324. doi: 10.1023/A:1023087903679
Tripathi, K., Shubha, K., Pamarthi, R. K., Mukherjee, A., Ramya, K. R., Bhardwaj, R., et al. (2025). Grasspea (Lathyrus sativus L.) – A potential leafy vegetable of eastern India. Indian J. Plant Genet. Resour. 38, 84–92. doi: 10.61949/0976-1926.2025.v38i01.09
Turcotte, M. M., and Johnson, M. T. J. (2014). The impact of rapid flowering on yield in annual legumes. J. Ecol. 102, 738–747.
Vaz Patto, M. C., and Rubiales, D. (2014). Lathyrus diversity: available resources with relevance to crop improvement – L. sativus and L. cicera as case studies. Ann. Bot. 113, 895–908. doi: 10.1093/aob/mcu024
Vaz Patto, M. C., Skiba, B., Pang, E. C. K., Ochatt, S. J., Lambein, F., and Rubiales, D. (2006). Lathyrus improvement for resistance against biotic and abiotic stresses: from classical breeding to marker assisted selection. Euphytica 147, 133–147. doi: 10.1007/s10681-006-3607-2
Keywords: Lathyrus sativus L., rice fallows, dual-purpose crop, imbibition kinetics, principal component analysis, genetic diversity
Citation: Shubha K, Das A, Choudhary AK, Mukherjee A, Saurabh K, Kumar S, Kumar S, Pal AK, Kumar S and Kumar U (2025) Optimizing grass pea (Lathyrus sativus L.) for rice-fallow systems: phenotypic and genetic insights for dual-purpose breeding. Front. Sustain. Food Syst. 9:1625927. doi: 10.3389/fsufs.2025.1625927
Edited by:
Parimalan Rangan, Indian Council of Agricultural Research (ICAR), IndiaReviewed by:
Rishu Sharma, Bidhan Chandra Krishi Vishvavidyalaya, IndiaBadal Singh, Indian Council of Agricultural Research (ICAR), India
Copyright © 2025 Shubha, Das, Choudhary, Mukherjee, Saurabh, Kumar, Kumar, Pal, Kumar and Kumar. This is an open-access article distributed under the terms of the Creative Commons Attribution License (CC BY). The use, distribution or reproduction in other forums is permitted, provided the original author(s) and the copyright owner(s) are credited and that the original publication in this journal is cited, in accordance with accepted academic practice. No use, distribution or reproduction is permitted which does not comply with these terms.
*Correspondence: Kumari Shubha, c2h1YmhhLmljYXJAZ21haWwuY29t