 Clémence Vannier*†
 Michelle Barnes
- Manaaki Whenua – Landcare Research Group, Bioeconomy Science Institute, Palmerston North, New Zealand
Introduction
Food production, trade, and nutrient deficiencies are increasingly critical global research areas, given their implications for national food security, public health, and environmental sustainability (Oluwole et al., 2023; Tian et al., 2016). As a major food-exporting nation, New Zealand (NZ) plays an important role in global food supply chains; however, domestic food insecurity remains a concern, particularly among vulnerable populations (Graham et al., 2022; Hobbs et al., 2019). NZ produces and exports food and fiber for 354% of its own population requirements, yet it relies heavily on imports when it comes to feed its people (64%) (Smith et al., 2021).
In NZ, the lack of short-term food security has become increasingly recognized in the face of recent major market disruptions (Snow et al., 2021). Trade and supply chain vulnerabilities further affect food prices and accessibility. In addition, the prevalence of micronutrient deficiencies and diet-related diseases, including obesity and type 2 diabetes, continues to rise, reflecting the shifts in dietary patterns and socioeconomic disparities (Mann et al., 2024; World Health Organization, 2018). For example, iron deficiency, especially among premenopausal women, remains prevalent and contributes to fatigue, reduced cognitive function, and impaired immune response (Calje and Skinner, 2017; Jin et al., 2020). Furthermore, food insecurity persists among vulnerable populations, affecting performance, health, and wellbeing (Graham et al., 2022).
Policy measures, including food fortification programs and the advocacy for a national food strategy, aim to mitigate these nutritional challenges and improve population health outcomes. Given the critical role of nutrition in overall wellbeing, ongoing research and policy interventions are essential to addressing micronutrient deficiencies and ensuring equitable access to nutritious food in NZ.
Several food production and nutrition databases already provide insights for research, policymaking, and public health. Food and Agriculture Organization Statistics (FAOSTAT), managed by the Food and Agriculture Organization of the United Nations (FAO), offers comprehensive data on global food production, trade, and security. The World Health Organization's Nutrition and Food Safety Databases track nutrition-related health indicators, while the Global Dietary Database (GDD) focuses on worldwide dietary intake patterns (GDD, 2025). The FAO also provides country profiles that present country-specific information on agriculture, food security, and nutrition. These databases are essential tools for understanding the relationship between food systems and nutrition. However, none of these databases provide spatial information or links between the agricultural food system and production, as well as the nutrient content in the food produced. This information is critical to understanding and addressing the gaps between a national food system and nutrient deficiencies in a population. However, limited research has examined whether the types and quantities of food produced in NZ provide sufficient nutrients for domestic consumption (New Zealand Institute of Economic Research, 2025). This gap underscores the importance of linking production data with nutritional indicators to inform policy and improve the resilience of the national food system (Kidd et al., 2025).
The objective of our project was to develop the New Zealand Food Production and Nutrition Data Stack (NZFPNDS) as a comprehensive resource comprising 19 spatial layers that provide spatially explicit nutritional indicators for energy, macronutrients, vitamins, and minerals. This data report provides a detailed methodology and usability guidelines, serving as a crucial tool for researchers, policymakers, and stakeholders who aim to bridge the gap between food production and national nutritional outcomes.
Materials and methods
To develop a national-scale dataset that connects food production with nutrient availability, we integrated multiple agricultural and nutritional data sources, and this involved preparing the database, utilizing spatial mapping, and applying statistical analysis. We identified the foods produced in NZ, estimated their nutrient content using international composition tables, and mapped this information onto a national spatial grid. By combining geospatial data (such as farm types and land cover) with national production statistics and food composition values, we created a set of 19 nutrient-specific maps that represent the potential annual availability of key nutrients across the country. The following sections describe the data collection and processing steps used to construct this dataset.
Data collection
Four datasets were used as modeling inputs for a national-level analysis (Table 1, Figure 1). These datasets were accessed online, manually downloaded, and securely stored between August and September 2024. Three of the datasets were publicly available during this period, while AgriBase® (a product of AsureQuality, Auckland, New Zealand) was the only dataset licensed to Landcare Research New Zealand Ltd and accessed privately.
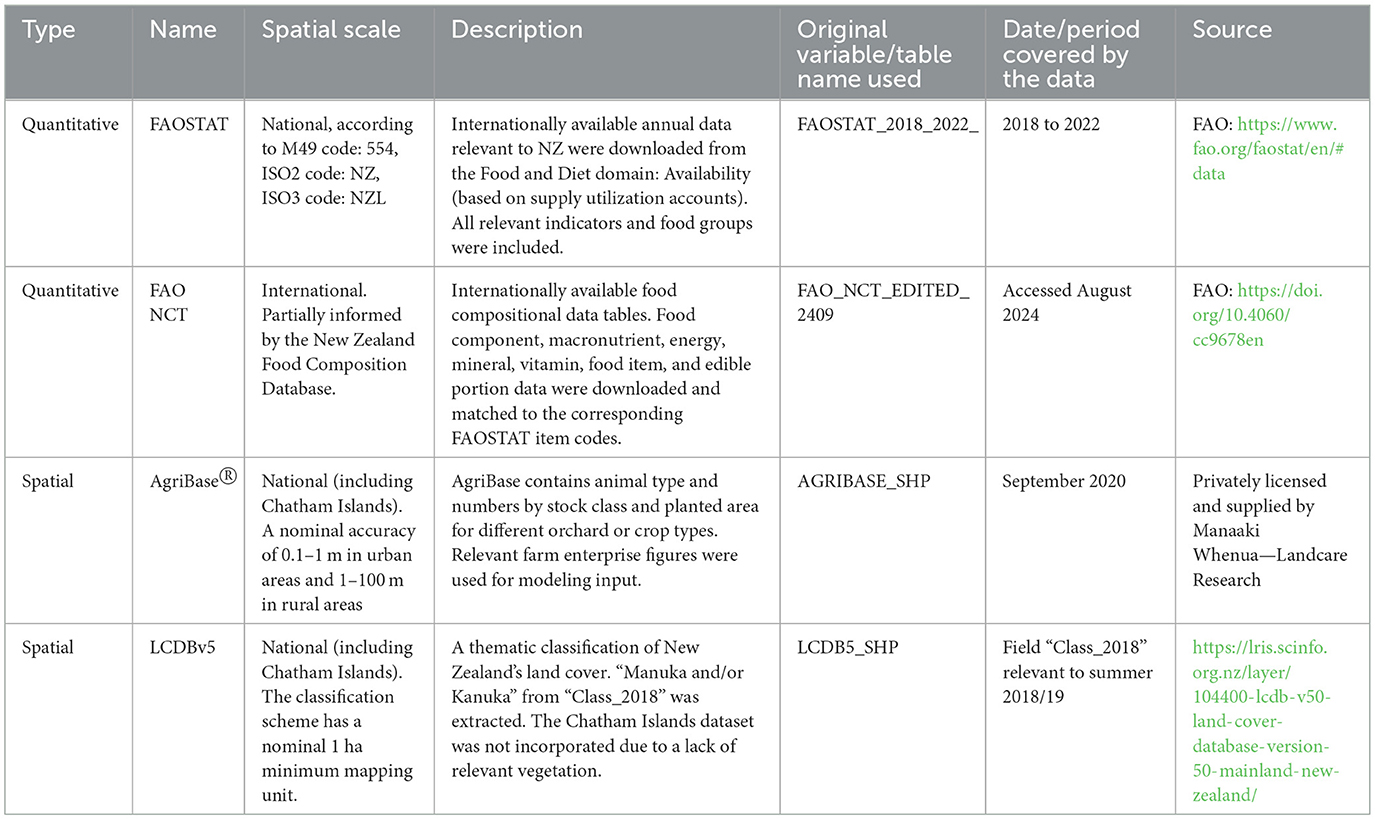
Table 1. Input database characteristics.
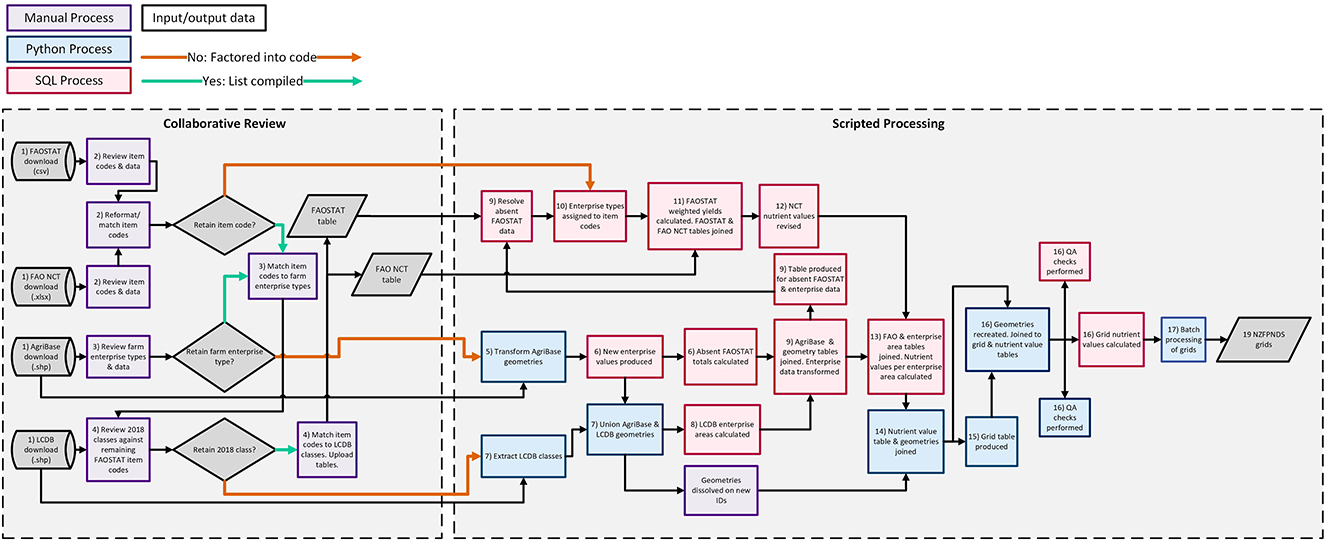
Figure 1. Flowchart for overall data processing.
AgriBase is NZ's national geospatial database of rural properties (farms, orchards, vineyards, forestry blocks, and conservation areas), and each property is assigned a unique Farm Identification number (Farm_ID), which is maintained by AsureQuality. It contains farm boundaries [linked to Land Information New Zealand (LINZ) land parcels], farm centroids, property roles and contacts, predominant land use, livestock numbers by class, crop/orchard areas, and spatial geometry for use in Geographic Information System (GIS) systems. Data in AgriBase are verified through frequent updates from LINZ parcel records (quarterly, moving to monthly), cross-checks with GPS and orthophoto data, and error detection resulting from widespread operational use. AsureQuality acts as the custodian to ensure accuracy, security, and traceability.
Coverage of the NZ mainland, its near-shore islands, and the Chatham Islands was included for all layers.
An extract of FAOSTAT was downloaded from the “Food and Diet Domain: Availability” (based on supply utilization accounts) (Table 1). We selected “New Zealand,” all food groups and indicators, and the years 2018 to 2022 for output in CSV format.
The entire geospatial and tabular extent of both geospatial datasets and the whole FAO Nutrient Conversion Table (FAO NCT) were downloaded for modeling purposes (Table 1).
Data processing
Collaborative review
Initially, manual steps were undertaken following the downloading of all the raw dataset inputs (Figure 1, Step 1). Relevant pre-processed/whole food items from the FAOSTAT database were reviewed and matched with those from the FAO NCT via food item codes (Figure 1, Step 2).
Selected codes were reviewed and matched to relevant AgriBase aggregated farm enterprise detail descriptions using enterprise type names. The enterprise types included both hectare and animal number groupings (Figure 1, Step 3).
Land Cover DataBase version 5 (LCDBv5) classes were reviewed against item codes unaccounted for by AgriBase enterprise types. Ultimately, “Manuka and/or Kanuka” geometries were selected to inform locations possibly contributing to honey production during the 2018/19 summer. In this case, honey production was based on the potential available resources for honeybees. The finalized tables were reformatted and uploaded to a Structured Query Language (SQL) server database before executing the joins (Figure 1, Step 4).
Scripted processing
The module “arcpy” was used for geoprocessing within a Python 3 environment, and SQL was largely used for tabular processing on an SQL server.
Processing commenced with the removal of AgriBase farms that contained irrelevant enterprise types and combinations, or those with no corresponding FAOSTAT data (Figure 1, Step 5). For example, mountainous national park land solely associated with natural forest was excluded.
In preparation for final grid outputs, AgriBase farms containing overlapping vector geometries were effectively split into both overlapping and remaining “enterprise areas” (hectares) (Figure 1, Step 5). A recalculation of enterprise-type values for new enterprise areas was achieved via multiplication of original enterprise-type values by a coefficient, whereby enterprise areas were divided by the total original area of a farm to produce the coefficients. The new enterprise-type values were also summed for each enterprise type per enterprise area (Figure 1, Step 6).
“Manuka and/or Kanuka” geometries were extracted from LCDBv5 via the “Class_2018” field and combined with AgriBase enterprise areas (Figure 1, Step 7). Hectares of “Manuka and/or Kanuka” were calculated, covering three requirements for its addition to the AgriBase and FAOSTAT data-derived tables: total hectares, hectares per enterprise area, and hectares outside of enterprise areas (Figure 1, Step 8).
AgriBase enterprise-type data were normalized into two new enterprise name and number fields, streamlining enterprise-centric joins and calculations. AgriBase enterprise types—“vegetables” and “other animal numbers”—were summed and added via union to the FAOSTAT table to represent absent total hectares of “mushrooms and truffles” and “other meat” animal numbers (Figure 1, Step 9).
FAOSTAT curation began with “Unit” conversion and the calculation of 5-year averages for tons, hectares, and animal number figures (Figure 1). Item codes were assigned to AgriBase enterprise-type classes in a new field containing “item enterprise” types. Item code values were summed across the new item enterprise types to produce “item enterprise sums,” while unusable item codes were excluded (Figure 1, Step 10).
Item code contribution (per item enterprise type) percentage figures were calculated by dividing the item code values by the total sums of the item enterprises. Five-year “item code contribution averages,” which sum to one, were produced from the resulting item code contribution percentage figures (Figure 1, Step 11).
Weighted yield values were generated for each enterprise item class, providing values for both hectare and animal number scenarios. This was achieved by dividing mean tons by mean hectares and mean tons by the mean number of animals for each item code value. The new mean item code yields were multiplied by the item code contribution averages and then summed across each item's enterprise class and unit (Figure 1, Step 11).
Subsequently, amended nutrient values based on the item code contributions to each item in the enterprise class were produced. Nutrient values were multiplied by the item code contribution averages and summed across each item enterprise class and unit. To implement this step, FAO NCT data were joined to the finalized FAOSTAT table via the item codes (Figure 1, Step 11).
Nutrient values were further adjusted, accounting for each FAO NCT item code's sum of proximate components and edible portions. Nutrient values were converted from 100 g to 1 ton representation and multiplied at last by the hectare and animal number-weighted yield values for each item enterprise class. This produced a finalized set of nutrient values representing each item of the enterprise class (Figure 1, Step 12).
The revised AgriBase and FAO tables were joined. Nutrient figures per enterprise type for both hectares and animal numbers were generated, where the number of enterprises was multiplied by the new nutrient values. Nutrient values per enterprise area were calculated by summing all enterprise-type nutrient values per enterprise area (Figure 1, Step 13).
The finalized table and geometries were joined using enterprise area IDs. Enterprise areas with null identifiers were deleted, which was indicative of a lack of relevant or usable FAOSTAT data (Figure 1, Step 14). A 1 km-square grid was produced from the enterprise area IDs (Figure 1, Step 15).
For quality assurance, the grid was exported to polygon geometries and joined to tables created in earlier processing steps. All the final nutrient values relevant to each enterprise area ID were divided by the grid cell “count,” producing an estimation of nutrient values per cell (Figure 1, Step 16). Finally, batch processing was performed on the geometries to create grids originating from each nutrient-value field (Figure 1, Step 17).
Geographic coverage
The NZFPNDS covers NZ mainland, its near-shore islands, and the Chatham Islands at a 1 km-square pixel size spatial resolution for all grids.
Reusing the data
The NZFPNDS consists of 19 spatial data layers, with each layer representing an annual estimate of a specific nutrient's presence across New Zealand's agricultural landscape. These maps show the estimated amount of nutrients produced by the animals and crops raised or cultivated in each location, expressed as nutrient mass per square kilometer.
Users can view and download all NZFPNDS outputs via the LRIS Portal. All NZFPNDS data and metadata are managed by Manaaki Whenua–Landcare Research and published for use under the Creative Commons by Attribution 4.0 International license (https://creativecommons.org/licenses/by/4.0/). An overview of the dataset is presented in Table 2. The purpose of the NZFPNDS is to provide information on annual nutrition indicators for various food components, including macronutrients, energy, minerals, and vitamins (Table 2).
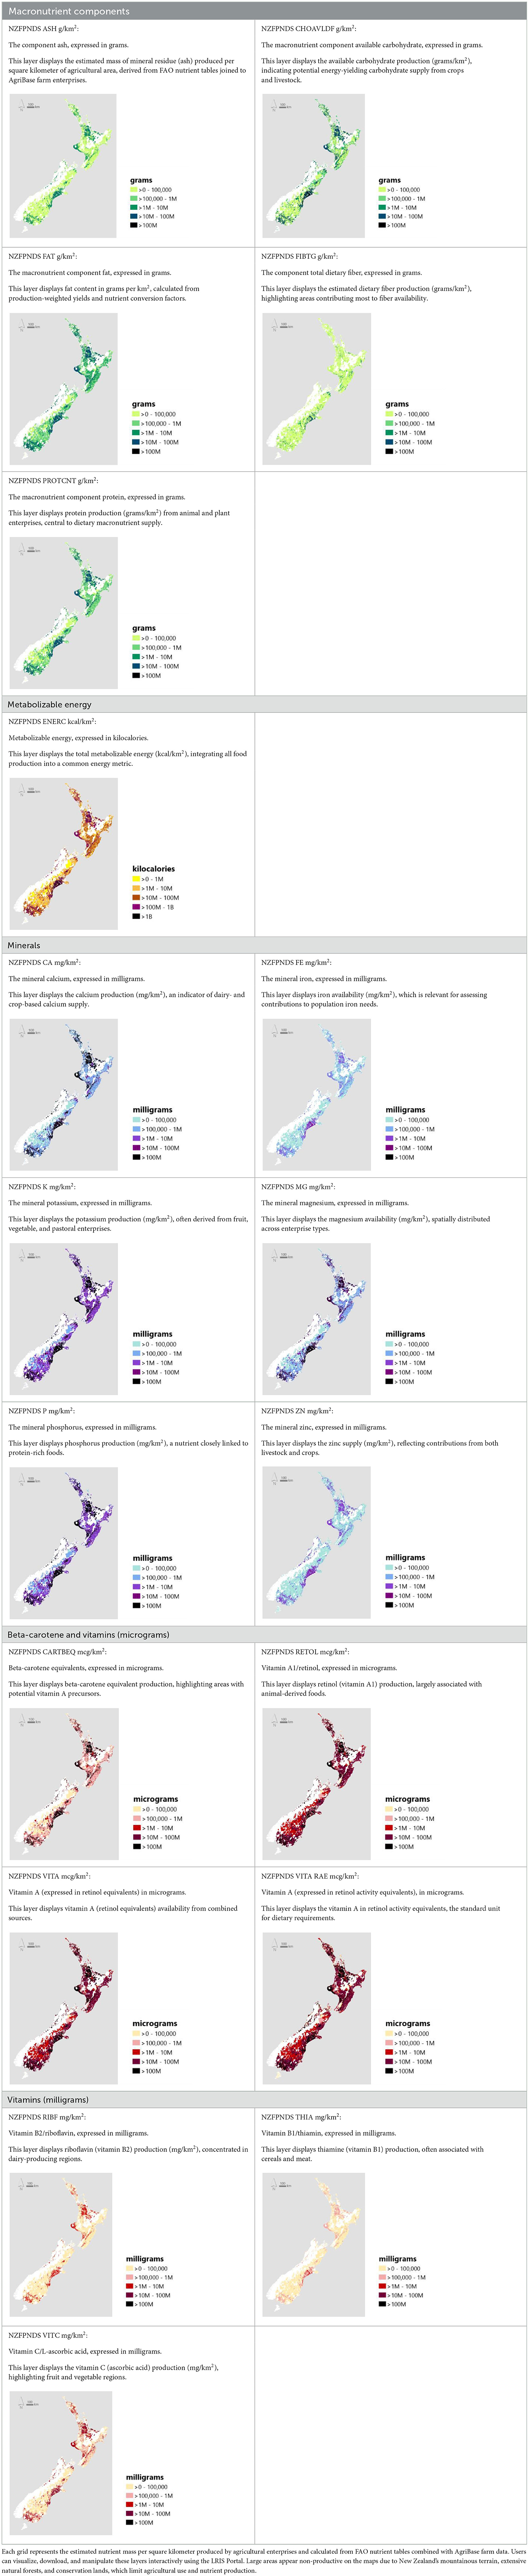
Table 2. LRIS Portal grid name, description, and map overview.
Best usage information
The NZFPNDS contains 19 spatial layers that provide information on annual nutrition indicators for food components, including macronutrients, energy, minerals, and vitamins. The NZFPNDS has been modeled using data from the FAO, AgriBase, and LCDBv5. It has been produced for analyses including aspects of health and wellbeing.
Limitations
As highlighted in international food composition research, micronutrients, such as vitamin C, thiamin, and certain minerals (e.g., iron and zinc), are particularly sensitive to agroecological conditions, varietal differences, and post-harvest handling, leading to greater variability and lower accuracy when estimated from global data sources (Deharveng et al., 1999; Greenfield and Southgate, 2003). In contrast, macronutrient values such as protein, fat, and energy are generally more consistent across regions.
One limitation arises from the exclusion of certain data during processing. Enterprise areas without relevant or usable FAOSTAT item codes were removed, potentially omitting some minor or less-documented food production activities from the dataset. Similarly, unusable FAOSTAT item codes that could not be reliably matched or aggregated were excluded, which may have led to a slight under-representation of niche food types or less commonly reported nutrient sources.
Another key limitation of the NZFPNDS is the spatial and temporal resolution of the data layers. The database is built from a national agricultural database and an international nutritional dataset, neither of which is uniformly updated. As a result, the NZFPNDS represents the year 2020, with averages for food production (yields) from 2018 to 2022. Data availability was insufficient to capture regional or finer-scale variations in food production and nutrient distribution.
Another key limitation of the NZFPNDS is its reliance on the use of the international FAO NCT to estimate the nutritional content of produced foods. Nutrient composition varies according to soil quality, climate conditions, food-processing methods, and post-harvest handling. The database assumes average nutrient values rather than accounting for variations due to production conditions that were not possible to capture. Future improvements could focus on enhancing data resolution.
Finally, while the NZFPNDS maps nutrient production locations, its utility for assessing local food access during shocks is limited by New Zealand's centralized food system, where production does not necessarily reflect local availability.
Potential research pathways
By providing spatially explicit data on nutrient availability, the NZFPNDS allows the investigation of critical gaps in the food system's capability to meet NZ's national nutritional needs (Smith et al., 2021).
Climate change
The NZFPNDS can support studies on climate change and food system vulnerabilities, particularly in the context of increasing risks from drought, flooding, and soil degradation. Understanding how environmental stressors affect nutrient yield, crop productivity, and food availability is critical for developing climate-resilient food policies that ensure sustainable nutritional access for all New Zealanders (Barnsley et al., 2021; Drew et al., 2020; Lawrence et al., 2024).
Geospatial analysis
The NZFPNDS is a geospatial database that allows the creation of nutritional risk maps that identify disparities in food access, agricultural productivity, and health outcomes. As the NZFPNDS provides estimates of nutrient production rather than direct measures of nutrient consumption, developing nutritional risk maps would require further information, including (i) population distribution and nutrient requirements; (ii) domestic consumption compared to export allocations; (iii) transport, storage, and processing pathways that influence food availability and its forms; and (iv) patterns of retail distribution and dietary intake across different population groups. Integrating this information would enable the estimation of risk and account for the fact that much of New Zealand's food production is exported. Integrating GIS-based layers of agricultural data with demographic and health datasets enables a better understanding of the challenges between food production and nutrient intake at regional and national levels. This approach could provide key insights for local and national governments in designing targeted interventions to address food security. In addition, the NZFPNDS could facilitate regional food system analysis by exploring the implications of urbanization, land-use change, and agricultural diversification on food availability and nutritional security.
International nutrient trade
In addition to its national applications, the NZFPNDS also offers opportunities for global and comparative research, allowing for benchmarking against international food systems and nutrient trade (Silvestrini et al., 2024). By integrating the database with global datasets such as FAOSTAT and WHO nutritional data, we can conduct cross-country comparisons on food system resilience, agricultural sustainability, and nutritional security (Fletcher et al., 2024). This international perspective is particularly valuable for identifying best practices and policy lessons that could inform the future evolution of NZ's food system. Furthermore, as a FAIR-aligned database (Findable, Accessible, Interoperable, and Reusable), the NZFPNDS serves as a model for structuring spatially explicit nutritional data, thereby fostering collaboration with global researchers, policymakers, and organizations.
Given its broad applicability across multiple disciplines, the NZFPNDS stands as a transformative research tool for understanding and addressing the challenges of food production, trade, and nutrient security. The ability to link agricultural production with national dietary needs through spatial data represents a critical step forward in evidence-based food system research. As NZ and the global community continue to face complex food security challenges, the insights derived from the NZFPNDS may support future efforts to guide policy, promote more sustainable food practices, and contribute to a better alignment between national food production and nutritional needs, with potential implications for improving population health over time.
Data availability statement
The New Zealand Food Production and Nutrition Data Stack (NZFPNDS) presented in this study can be found in online repositories. The names of the repositories and their URL links are given below. The LRIS Portal data stack contains the 19 downloadable spatial grids: https://lris.scinfo.org.nz/set/7422-nzfpnds-new-zealand-food-production-and-nutrition-data-stack/. Manaaki Whenua – Landcare Research GitHub contains the NZFPNDS workflow information and code: https://github.com/manaakiwhenua/NZFPNDSmanaakiwhenua/NZFPNDS.
Author contributions
CV: Conceptualization, Funding acquisition, Investigation, Methodology, Project administration, Supervision, Writing – original draft, Writing – review & editing. MB: Data curation, Formal analysis, Methodology, Validation, Visualization, Writing – original draft, Writing – review & editing.
Funding
The author(s) declare that financial support was received for the research and/or publication of this article. This study was supported by the Ministry for Business, Innovation and Employment (Strategic Science Investment Funding).
Conflict of interest
The authors declare that the research was conducted in the absence of any commercial or financial relationships that could be construed as a potential conflict of interest.
Generative AI statement
The author(s) declare that no Gen AI was used in the creation of this manuscript.
Any alternative text (alt text) provided alongside figures in this article has been generated by Frontiers with the support of artificial intelligence and reasonable efforts have been made to ensure accuracy, including review by the authors wherever possible. If you identify any issues, please contact us.
Publisher's note
All claims expressed in this article are solely those of the authors and do not necessarily represent those of their affiliated organizations, or those of the publisher, the editors and the reviewers. Any product that may be evaluated in this article, or claim that may be made by its manufacturer, is not guaranteed or endorsed by the publisher.
References
Barnsley, J. E., Chandrakumar, C., Gonzalez-Fischer, C., Eme, P. E., Bourke, B. E. P., Smith, N. W., et al. (2021). Lifetime climate impacts of diet transitions: a novel climate change accounting perspective. Sustainability 13:5568. doi: 10.3390/su13105568
Calje, E., and Skinner, J. (2017). The challenge of defining and treating anemia and iron deficiency in pregnancy: a study of New Zealand midwives' management of iron status in pregnancy and the postpartum period. Birth 44, 181–190. doi: 10.1111/birt.12282
Deharveng, G., Charrondière, U. R., Slimani, N., Southgate, D. A., and Riboli, E. (1999). Comparison of nutrients in the food composition tables available in the nine European countries participating in EPIC. European prospective investigation into cancer and nutrition. Eur. J. Clin. Nutr. 53, 60–79. doi: 10.1038/sj.ejcn.1600677
Drew, J., Cleghorn, C., Macmillan, A., and Mizdrak, A. (2020). Healthy and climate-friendly eating patterns in the New Zealand Context. Environ. Health Perspect. 128:17007. doi: 10.1289/EHP5996
Fletcher, A. J., Lozano, R., and McNabb, W. C. (2024). Analysis of global nutrient gaps and their potential to be closed through redistribution and increased supply. Front. Nutr. 11:1396549. doi: 10.3389/fnut.2024.1396549
Graham, R., Jackson, K., Masters-Awatere, B., and Stolte, O. (2022). Hidden hunger in a land of plenty: food insecurity in Aotearoa New Zealand. Glob. J. Community Psychol. Pract. 13, 1–20. doi: 10.17161/gjcpp.v13i2.20619
Greenfield, H., and Southgate, D. A. T. (2003). Food Composition Data: Production, Management, and Use. Rome: FAO.
Hobbs, M., Ahuriri-Driscoll, A., Marek, L., Campbell, M., Tomintz, M., and Kingham, S. (2019). Reducing health inequity for Māori people in New Zealand. Lancet 394, 1613–1614. doi: 10.1016/S0140-6736(19)30044-3
Jin, Y., Coad, J., Zhou, S. J., Skeaff, S., Benn, C., Kim, N., et al. (2020). Mother and infant nutrition investigation in New Zealand (MINI Project): protocol for an observational longitudinal cohort study. JMIR Res. Protoc. 9:e18560. doi: 10.2196/18560
Kidd, B., Enright, H., McKerchar, C., and Cleghorn, C. (2025). developing policy to support sustainable diets in Aotearoa New Zealand with stakeholders. Food Front. 1–10. doi: 10.1002/fft2.70096
Lawrence, J., Wreford, A., Blackett, P., Hall, D., Woodward, A., Awatere, S., et al. (2024). Climate change adaptation through an integrative lens in Aotearoa New Zealand. J. R. Soc. N. Z. 54, 491–522. doi: 10.1080/03036758.2023.2236033
Mann, J., Mhurchu, C. N., Sporle, A., Guilford, P., Cockram, J., and Stayner, C. (2024). Healthier Lives for all New Zealanders: Evidence for Equitable Health Outcomes in Aotearoa New Zealand. Dunedin: Healthier Lives - He Oranga Hauora National Science Challenge.
New Zealand Institute of Economic Research (2025). Agri-Food Supply Chain Modelling: Review of the Literature. A report for the AgResearch Group of the Bioeconomy Science Institute. Bioeconomy Science Institute, Wellington, New Zealand.
Oluwole, O., Ibidapo, O., Arowosola, T., Raji, F., Zandonadi, R. P., Alasqah, I., et al. (2023). Sustainable transformation agenda for enhanced global food and nutrition security: a narrative review. Front. Nutr. 10:1226538. doi: 10.3389/fnut.2023.1226538
Silvestrini, M. M., Smith, N. W., Fletcher, A. J., McNabb, W. C., and Sarti, F. M. (2024). Complex network analysis and health implications of nutrient trade. Glob. Food Sec. 40:100743. doi: 10.1016/j.gfs.2024.100743
Smith, N. W., Fletcher, A. J., Dave, L. A., Hill, J. P., and McNabb, W. C. (2021). Use of the DELTA model to understand the food system and global nutrition. J. Nutr. 151, 3253–3261. doi: 10.1093/jn/nxab199
Snow, V., Rodriguez, D., Dynes, R., Kaye-Blake, W., Mallawaarachchi, T., Zydenbos, S., et al. (2021). Resilience achieved via multiple compensating subsystems: the immediate impacts of COVID-19 control measures on the agri-food systems of Australia and New Zealand. Agric. Syst. 187:103025. doi: 10.1016/j.agsy.2020.103025
Tian, J., Bryksa, B. C., and Yada, R. Y. (2016). Feeding the world into the future – food and nutrition security: the role of food science and technology. Front. Life Sci. 9, 155–166. doi: 10.1080/21553769.2016.1174958
Keywords: food production, geospatial database, nutrient mapping, New Zealand agriculture, food systems
Citation: Vannier C and Barnes M (2025) A national-scale food production and nutrition dataset for New Zealand. Front. Sustain. Food Syst. 9:1626874. doi: 10.3389/fsufs.2025.1626874
Received: 12 May 2025; Accepted: 26 August 2025;
Published: 18 September 2025.
Edited by:
Viswanathan Pozhamkandath Karthiayani, Amrita Vishwa Vidyapeetham, IndiaReviewed by:
Cristina Cleghorn, University of Otago, Wellington, New ZealandMatt Boyd, Adapt Research Ltd., New Zealand
Copyright © 2025 Vannier and Barnes. This is an open-access article distributed under the terms of the Creative Commons Attribution License (CC BY). The use, distribution or reproduction in other forums is permitted, provided the original author(s) and the copyright owner(s) are credited and that the original publication in this journal is cited, in accordance with accepted academic practice. No use, distribution or reproduction is permitted which does not comply with these terms.
*Correspondence: Clémence Vannier, dmFubmllcmNAbGFuZGNhcmVyZXNlYXJjaC5jby5ueg==
†ORCID: Clémence Vannier orcid.org/0000-0003-4776-8319