 Minjie Teng
 Hua Wei1,2*
 Qunshan Tao
- 1School of Hospital Economics and Management, Anhui University of Chinese Medicine, Hefei, China
- 2Key Laboratory of Data Science and Innovative Development of Chinese Medicine in Anhui Province Philosophy and Social, Hefei, China
Introduction: In this study, we constructed a Dynamic Network SBM (DNSBM) model. Such a model is essential to gain deeper insights into the complex interplay among economic development, food safety, and health production.
Methods: Using panel data from 30 provinces in China (2017–2020), we integrated economic development, food safety, and health production into a unified efficiency assessment framework.
Results: Our findings reveal that China's overall efficiency is low (0.504), with significant regional heterogeneity, presenting a pattern of high in the east and low in the west; the efficiency of economic development (0.288) significantly lags behind the efficiency of health production (0.694); and the efficiency of food safety risk control is weak (the efficiency of food inspection failure rate, the number of foodborne illness incidents and patients are 0.694, 0.368, and 0.428, respectively).
Discussion: The DNSBM model breaks through the limitations of traditional static analysis and provides a dynamic assessment tool for emerging economies to reconcile the contradiction of “economic growth resource consumption public health”. China's experience highlights the central role of government-led multi-sectoral collaboration, technological innovation, and balanced regional development. The study calls for integrating food safety governance into the global agenda and building a global food safety network through enhanced international cooperation (e.g., drawing on European Union standards, sharing of agricultural regulatory and digital testing technologies) to promote synergistic and sustainable development of the economy, health, and the environment, and contribute to the realization of the United Nations 2030 Sustainable Development Goals (SDGs).
1 Introduction
As globalization accelerates, ensuring food safety has become a major challenge with far-reaching implications for the global economy, society, and public health. In recent years, food safety incidents have occurred frequently worldwide, such as the “horsemeat scandal” in Europe, the “radiation-contaminated food” incident in Japan, and the melamine-tainted milk powder incident in China. These incidents not only pose serious threats to public health but also have profound impacts on economic development and social stability. From a global perspective, Wilson (2003) noted that regions with a high incidence of food safety incidents align with the global migration of economic development centers. According to the Global Food Safety Index (GFSI) report published by the Economist Intelligence Unit, low- and middle-income countries generally have lower food safety indexes compared to developed countries (Jia and Jukes, 2013). This indicates that food safety is a global issue requiring international cooperation, not merely a domestic concern. Effective food safety governance is crucial for protecting public health and achieving the Sustainable Development Goals (SDGs).
In recent years, many countries and regions have prioritized food safety in their national strategies. They emphasize that improving the food safety risk governance system can meet public demands and promote sustainable economic and social development. As the world's largest developing country, China has made significant progress in food safety governance. However, due to resource overconsumption and environmental pollution during economic development (Xiong and Xu, 2021), food safety issues remain a serious challenge, constraining sustainable economic and social development. Notable incidents include the 2008 melamine-tainted milk powder scandal, the 2011 gutter oil incident, and the 2020 tainted sea cucumber event. These incidents reflect challenges in China's food safety landscape, including excessive food additives, pesticide residues, and the illegal use of banned substances (Lam et al., 2013). These issues affect public health and pose long-term developmental challenges for the country. The food industry's interconnected nature means that when one brand experiences food safety issues, the entire industry and related upstream and downstream sectors suffer negative impacts. This can trigger a series of chain reactions, including reduced production, corporate bankruptcies, and worker unemployment, ultimately affecting economic and social stability. Food safety is a critical public safety issue of global concern that requires urgent attention and action.
Studies on the relationship between food safety and health have focused on the effects of hazardous substances in food, food safety testing techniques, and the safety of food raw materials and products. These studies have also examined antimicrobial systems of food microorganisms and toxicology (Ruiz-Capillas and Herrero, 2019; Pires et al., 2020). However, these studies have not used empirical health economics models to examine the socioeconomic factors involved in food-related health issues. Additionally, other scholars have begun examining the intersection of economic development, food safety, and public health (Alsubaie and Berekaa, 2020; Pacholczyk-Sienicka, 2024; Schönfeldt et al., 2018; Londong et al., 2021). Nevertheless, studies of the economy-food nexus are typically conducted independently of health studies, and few approaches combine economics, food, and health to analyze their relationships in depth. The few economic-food-health studies that exist usually employ empirical methods, such as regression analysis. However, these methods do not sufficiently consider the relationship between resource inputs and outputs. Therefore, it is necessary to adopt efficiency analysis methods and construct a dynamic network SBM (DNSBM) efficiency model that integrates economic development, food safety, and health into a unified framework.
Based on these considerations, the study aims to assess economic development, food safety risk control, and health production efficiency. To achieve this, the study will comprehensively analyze data from 30 Chinese provinces from 2017 to 2020. This analysis will provide a new perspective and basis for global sustainable development. The findings reveal that China's overall efficiency is low. Economic development efficiency is significantly lower than health production efficiency, and there is ample room for improvement in food safety risk control. These findings are significant not only for China but also for other countries and regions. They call on countries around the world to pay attention to food safety risks and strengthen food safety governance to achieve sustainable economic, social, and environmental development. The paper is structured as follows: Section 2 surveys the theoretical foundations and research progress; Section 3 introduces the DNSBM model construction and data processing; Section 4 presents the empirical results; Section 5 discusses the policy implications and theoretical contributions; and Section 6 summarizes the study's conclusions and looks ahead future directions.
2 Literature review
By reviewing the relevant literature, we found that most academic research on economic development, food safety, and human health is conducted from one of the following four perspectives.
2.1 Economic development and food safety
Economic activities are closely related to food safety, especially in developing countries. In 1955, Kuznets proposed the Environmental Kuznets Curve (EKC) theory, which suggests an inverse U-shaped relationship between air pollution and economic growth. In the early stages of economic development, environmental quality deteriorates as per capita income rises. However, once income reaches a certain threshold, further economic growth promotes environmental improvement (Kuznets, 1955). Similarly, the Food-Safety Risk Kuznets Curve (FKC) theory may also be valid. Based on this theory, many scholars in China and abroad have conducted experimental tests on the FKC hypothesis to explore the relationship between economic growth and food safety. By comparing the number of food safety-related publications from 1970 to 2008 with the number of food safety incidents from 2004 to 2007 in China, it was found that economic growth is a determinant of food safety risk (Lin et al., 2009). It is believed that there may be an “inverted U-shaped” relationship between the two (Lin et al., 2009). Additionally, Yin et al. (2021) verified the “inverted U” relationship between food safety and economic growth using the negative indicator of food safety: food safety risk.
Meanwhile, food safety has an impact on economic development, in addition to economic development impacting food safety. For instance, Grace (2023) points out that food safety issues trigger negative economic and social consequences, constrain sustainable development, and hinder economic growth by eroding consumer confidence and affecting food consumption. Wu et al. (2021) explore how consumer perceptions of food safety and government regulation affect food safety and economic development. They emphasize the critical role of governmental agencies in ensuring food safety and quality and the importance of consumer trust in the food system for economic development. Similarly, Vipham et al. (2020) emphasized the importance of food safety for food security, providing insights into the relationship between food safety and economic development from the perspective of the livestock industry. They noted that food security cannot be achieved without food safety, which affects economic stability. Moreover, scaling up traditional fermentation methods for commercialization not only enhances regional nutrition but also creates significant economic development opportunities, while helping to address food safety and quality assurance challenges. This indicates that resolving food safety issues is crucial for achieving commercialization and driving economic development (Hawaz et al., 2025).
2.2 Economic development and human health
Many studies have demonstrated a significant correlation between economic growth and improvements in human health. Preston (1985) determined that the correlation between per capita income and longevity was cross-sectional. He noted that increases in national income led to significant increases in life expectancy in developing countries. Liu and Zhong (2022) noted that increases in per capita income improve health outcomes, with a stronger effect at higher income levels. Wang and Lu (2022) confirmed that economic growth improves health outcomes by raising living standards, improving public health environments, and facilitating medical technology improvements. Bul and Moracha (2020) used data from 1991 to 2015 to show that economic growth can significantly improve health outcomes in Sub-Saharan Africa. Castillo-Castillo et al. (2025) found that willingness to pay for park amenities varies with income levels, with higher-income communities typically valuing high-quality amenities that promote health. Conversely, Zhao et al. (2024) argued that urbanization and intensive socioeconomic growth result in large amounts of antibiotics being discharged into the soil, posing a threat to ecosystems and human health.
2.3 Food safety and human health
Food safety is the cornerstone of human health, and its importance is widely recognized globally (Jaffee et al., 2018). The World Health Organization reports that more than 2.2 million deaths occur annually due to diarrhea caused by pathogenic microorganisms, underscoring the critical importance of food safety for health and social wellbeing. Foodborne hazards can contaminate the food supply chain, thereby posing a threat to human health, as noted by Sun et al. (2024). Food safety is a key area of public health directly related to people of all ages, races, genders, and income levels around the globe because unsafe food can contain harmful bacteria, viruses, parasites, or chemicals that cause illnesses ranging from diarrhea to cancer. These illnesses affect about 600 million people and cause 420,000 deaths globally each year. Therefore, ensuring food safety is critical to preventing disease and reducing health burdens.
2.4 Economic development, food safety and human health
In recent years, researchers have begun studying the intersection of economic development, food safety, and human health. The relationship between economic growth, income inequality, and food safety risk was explored by Chen and Chen (2023). The analysis of provincial panel data in China from 2011 to 2020 was used to do this. They found an inverted U-shaped relationship between economic growth and food safety risk: when GDP per capita reaches RMB 58,104.59 (based on 2011 prices), food safety risk hits an inflection point. This study emphasizes the importance of considering economic growth and income inequality when formulating food safety policies to improve the effectiveness of food safety risk management and ensure population health. Additionally, Bilan et al. (2023) examined the impact of the novel coronavirus (COVID-19) on food security and its effect on the economic development of the region. Similarly, Liu et al. (2024) proposed a “status quo-income elasticity” framework to comprehensively evaluate dietary sustainability across 141 countries, covering nutritional intake, disease risk, and environmental impact. Their research indicates that economic growth alters dietary patterns, which in turn affects both human and environmental health.
Despite the growing body of literature on economic development, food security, and human health, most studies have focused on the relationship between two of these variables rather than all three. Additionally, strengthening the study of the dynamics of these three variables from an efficiency perspective is necessary. The few studies that have examined these linkages have used empirical methods, such as regression analysis. However, the results of these analyses do not sufficiently consider the internal structure of decision-making units or the dynamic impacts between time periods. To compensate for this lack of research, this paper uses a DNSBM to comprehensively evaluate the efficiency of economic development, health production, and food safety governance within the same framework and proposes improvement strategies.
3 Materials and methods
3.1 DNSBM model introduction
Simultaneously assessing economic, food safety, and health efficiency faces two major challenges. First, a framework is needed to integrate the interrelationships among economic development, food safety, and healthy promotion. Second, the methodology must be able to address undesirable outputs that occur at different stages. Studies have attempted to address these issues.
First, Charnes et al. (1978) developed the first DEA model (CCR) to solve the efficiency assessment problem. This model has been widely used. This non-parametric approach evaluates production efficiency by constructing optimal production boundaries for decision units through linear programming. Second, since the DEA model cannot handle undesired outputs, researchers have developed extended DEA models that transform inputs into desired and undesired outputs for a more comprehensive efficiency assessment (Zhou et al., 2006, 2007). Third, the Network Data Envelopment Analysis (NDEA) model, proposed by Färe et al. (2010), can better capture the internal structure of the production system. It decomposes the production process into multiple sub-production technologies (sub-decision units), thus opening the “black box” of traditional DEA or SBM models. Building on the work of Färe et al. (2010) and Tone and Tsutsui (2009) proposed a relaxation-based weighted NDEA model. However, the NDEA model improves the assessment of efficiency at various stages but does not consider inter-period continuity and cannot accurately measure long-term efficiency. To assess efficiency at different stages and periods simultaneously, Färe et al. (2007) introduced a carry-over variable into the dynamic model.
Based on the above research, Tone and Tsutsui (2014) proposed a weighted slack metric (Dynamic Network SBM) DEA model. In this model, each sector is considered a sub-decision unit, and each carry-over activity is considered a link to be analyzed using the dynamic DEA model. Thus, the DNSBM model is suitable for assessing economic, food, and health efficiency as it can integrate the three interrelated phases of economic development, food safety, and health promotion into a unified framework.
3.2 DNSBM model setting
Firstly, the DNSBM model we use is a method for evaluating relative efficiency. Then, we deal with N DMUs(j = 1,…,n), which are composed of k departments (k = 1,…,K) and span T time periods (t = 1,…,T). Next, we assume that the input and output quantities of department k are mk and rk. The connection between department k and department h is denoted as (k, h), and the set of all connections is denoted as L. Finally, the observed data is as follows.
3.2.1 Inputs and outputs
In time period t, the i-th input resource of department k of decision unit j is represented as: (i=1,…,mk; j=1,…,n; k=1,…,K; t=1,…,T). In time period t, the r-th output resource of department k of decision unit j is represented as: (r=1,…,rk; j=1,…,n; k=1,…,K; t=1,…,T). If some outputs are not needed, we treat them as k-frequency inputs.
3.2.2 Links
In period t, the connection between DMUj intermediate products from department k to department h is (j=1,…,n; l=1; k; Lhk; t=1,…,T), where Lhk is the number of connection items from k to h; Linkink is the number of connections as input for department k; Linkoutk is the number of connections as output for department k.
3.2.3 Carry-overs
The carryover of DMUj from period t to period t+1 in department k is (j=1,…,n; l=1,…,Lk; k=1,…,K; t=1,…,T−1), where Lk is the total number of carryover items in department k, and ngoodk and nbadk are the number of expected (good) and unexpected (bad) items in department k, respectively.
3.2.4 Objective function
Use the following procedures to evaluate overall efficiency:
In Equation 1, represents the overall efficiency value. When = 1, it means that the decision-making unit is relatively efficient. When < 1, it means that the decision-making unit is inefficient; with 1, 1, Wt ≥ 0(∀t), Wk ≥ 0(∀k), where Wt(t=1,…,T) is the weight of period t, and Wk (k=1,…,K) is the weight of department k.
These restrictions are as follows:
where
where (,…,)∈Rmk×n×T and (,…,)∈Rrk×n×T are input and output matrices, and and are respectively input/output slacks.
3.2.5 Term (period) and divisional efficiencies
The term (period) efficiency is defined by:
In Equation 3, represents the period efficiency value. When 1, it means that the decision-making unit is relatively efficient. When 1, it means that the decision-making unit is inefficient.
Department efficiency is defined as:
In Equation 4, represents the department efficiency value. When 1, it means that the decision-making unit is relatively efficient. When 1, it means that the decision-making unit is inefficient.
Term (period)-divisional efficiency is defined by:
In Equation 5, represents the term (period)-divisional value. When 1, this means that the decision unit is relatively effective. When 1, it means that the decision unit is ineffective.
In addition, we analyze three core food safety indicators: Food Inspection Failure Rate (FIFR), Foodborne Illness Incidents (FII), and Foodborne Illness Patients (FIP) to assess risk control efficiency (Hu and Wang, 2006).
When the input of the target food inspection disease incidence rate equals the actual input level, the food safety control efficiency equals 1, indicating a high overall efficiency; on the other hand, when the input of the target food inspection disease incidence rate is lower than the actual input level, the food safety control efficiency is lower than 1, indicating overall inefficiency.
3.3 Data and variables
3.3.1 Data source
In this study, 30 provinces in China (including autonomous regions and municipalities directly under the central government, excluding Hong Kong, Macau, Tibet, and Taiwan, which are excluded due to lack of data) were evaluated and divided into three regions: eastern, central, and western according to geographical differences (Supplementary Figure 1). The eastern region covers Beijing, Tianjin, Hebei, Shanghai, Hainan and other provinces; The central region includes Shanxi, Jilin, Heilongjiang, Anhui, Jiangxi, Henan and other provinces; The western region consists of Inner Mongolia, Chongqing, Guangxi and other provinces. In addition, the relevant data from 2017 to 2020 are derived from the “China Population and Employment Statistical Yearbook,” the “China Health and Health Yearbook,” the “China Statistical Yearbook,” and the official website of the State Administration for Market Regulation, covering China's economic and social development and food safety.
3.3.2 Variables selection
3.3.2.1 Variables of economic development stages
Regarding the input indicators, referring to previous research (Li et al., 2019), we choose to use labor and energy consumption as input indicators. Regarding the output indicators, we select Gross Domestic Product (GDP), per capita GDP, and average disposable income of all residents as output indicators (Dědeček and Dudzich, 2020).
3.3.2.2 Contact economic development stage and health production stage variables
To comprehensively and quantitatively reflect the quality control level of the food production stage and the actual impact of food safety problems on public health, this study selected three indicators: food inspection failure rate, foodborne illness incidents, and foodborne illness patients. These indicators effectively assess the risk control of food safety. In the DNSBM model, the undesirable outputs of the economic development stage (food inspection failure rate, foodborne illness incidents, and foodborne illness patients) are transferred to the health production stage as its undesirable inputs. This setup effectively captures the causal relationship between economic development and health production and organically links the two stages through connecting variables. Thus, the model reflects the impact of economic development on food safety and reveals the negative effect of food safety problems on health production. This allows for a comprehensive assessment of the dynamic relationship among economic development, food safety, and health production. According to Zhang et al. (2022), the multi-period carry-over variable is government health expenditure. This variable runs through the economic development stage's output and the health production stage's input, reflecting the dual role of policies in promoting economic development and enhancing healthy production efficiency. Additionally, this study expresses food safety control efficiency by dividing the target value calculated by the DNSBM model by the actual value. This method effectively measures the gap between the actual effect of food safety governance and the theoretical optimal value and provides a scientific basis for policy formulation.
3.3.2.3 Health production stage variables
In terms of input indicators, this paper only considers inputs that are directly used for healthcare. Based on relevant studies (Zhou et al., 2022; Top et al., 2020), the number of health technicians and hospital beds per 1,000 people were selected as input indicators. Regarding output indicators, the literature generally recognizes that the main indicators for measuring a population's health status include average life expectancy, disability-adjusted life expectancy, maternal mortality rate, and infant mortality rate (Murray and Lopez, 2003; Rutherford et al., 2010). However, due to the delay in releasing health statistics in China, the available data on life expectancy and disability-adjusted life expectancy does not accurately reflect the level of health production. Therefore, this paper selects maternal and perinatal mortality rates as the main output indicators. Note that the maternal and perinatal mortality rates do not directly reflect positive or negative trends in health output efficiency (Hadad et al., 2013). To measure health output more accurately, this paper uses the methodology of Sayem et al. (2019), which takes the inverse of these two indicators to transform them into maternal and perinatal survival rates. Figure 1 illustrates the intertemporal efficiency indicator and variable framework of the DNSBM model based on the above analysis.
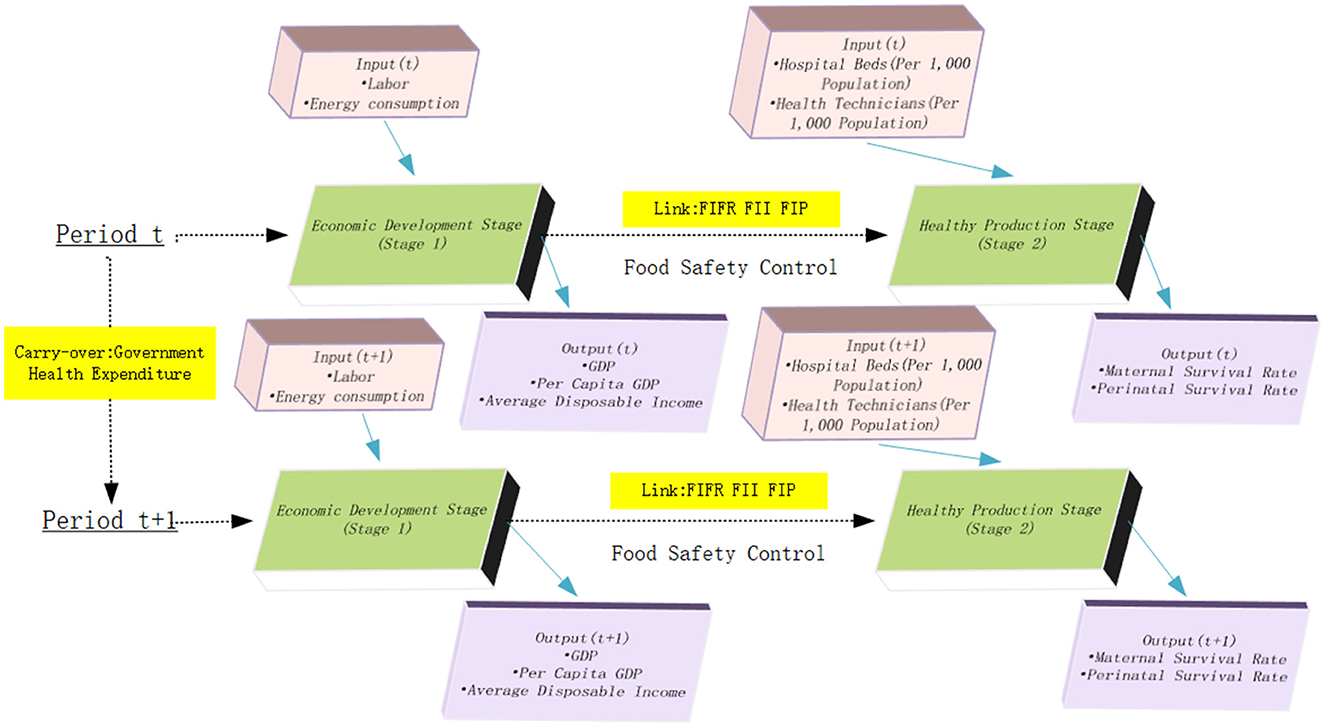
Figure 1. Dynamic and network SBM (DNSBM) model.
4 Empirical analysis
4.1 Statistical analysis of relevant variables
As shown in Supplementary Figure 2, labor input remained stable in terms of economic development indicators over the 4-year period from 2017 to 2020. Additionally, average energy consumption shows a slow upward trend, with the highest and lowest levels increasing steadily at a consistent growth rate. The highest GDP value has continued to rise since 2017, increasing by 1,950.3 billion between 2017 and 2020. Meanwhile, the lowest value increased moderately from 246.5 billion in 2017 to 301.0 billion in 2020. Overall, GDP has been trending slowly upward, increasing from 2769.3 billion in 2017 to 3360.1 billion in 2020. Similarly, both GDP and disposable income per capita have grown steadily from 2017 to 2020. GDP per capita increased from 59,358 yuan in 2017 to 71,271 yuan in 2020, while disposable income per capita grew by 6,159 yuan over the same period. These figures demonstrate China's enhanced productive capacity, gradually increasing provincial economic strength, and the translation of economic growth into increased income for residents. This reflects the positive effects of economic development and improvements in residents' quality of life.
Regarding health production indicators, the average, maximum, and minimum values for the number of health technicians and beds per 1,000 people have increased steadily and achieved significant overall growth. The average maternal survival rate per 100,000 pregnancies increased slightly from 0.86 in 2017 to 0.90 in 2020. However, the maximum value decreased from 0.99 in 2017 to 0.96 in 2020. The average perinatal survival rate showed an overall upward trend; however, the minimum value in 2020 was 0.91, a slight decrease from 2019. The average perinatal survival rate was 0.90 in 2020, a slight decrease from the previous year. These data suggest that, despite China's increasing investment in health resources year after year, the full potential for maximizing health outcomes has not yet been realized.
In terms of food safety indicators, the overall food sampling failure rate fluctuated downward, decreasing from an average of 2.09% in 2017 to 1.77% in 2020. Conversely, the average number of foodborne illness incidents and patients increased from 171 and 1,166, respectively, in 2017 to 236 and 1,248 in 2020. Notably, the highest values of the food sampling failure rate, number of incidents, and number of patients all show fluctuating increases. This indicates that, despite improvements in the overall food safety situation, significant safety hazards remain in certain areas or segments. Therefore, it is necessary to strengthen supervision and optimize testing techniques, especially for high-risk foods and weak links in supervision, to effectively control food safety risks and protect public health.
4.2 Empirical results analysis
4.2.1 Analysis of economic development efficiency
This study used the DNSBM model to measure the economic development efficiency of 30 provinces from 2017 to 2020. Labor and energy consumption were used as input indicators, and GDP, GDP per capita, and average disposable income were used as output indicators. The results (Table 1, Figure 2A) show that Beijing and Shanghai have the highest average economic development efficiency, while Hainan and Qinghai have an average efficiency of about 0.7, which is significantly higher than that of other provinces. Guangdong, Jiangsu, Tianjin, and Ningxia had economic development efficiencies between 0.4 and 0.6. Xinjiang had the lowest average economic development efficiency at 0.135, followed by Shandong at 0.156. These regions need to improve their economic development efficiency.
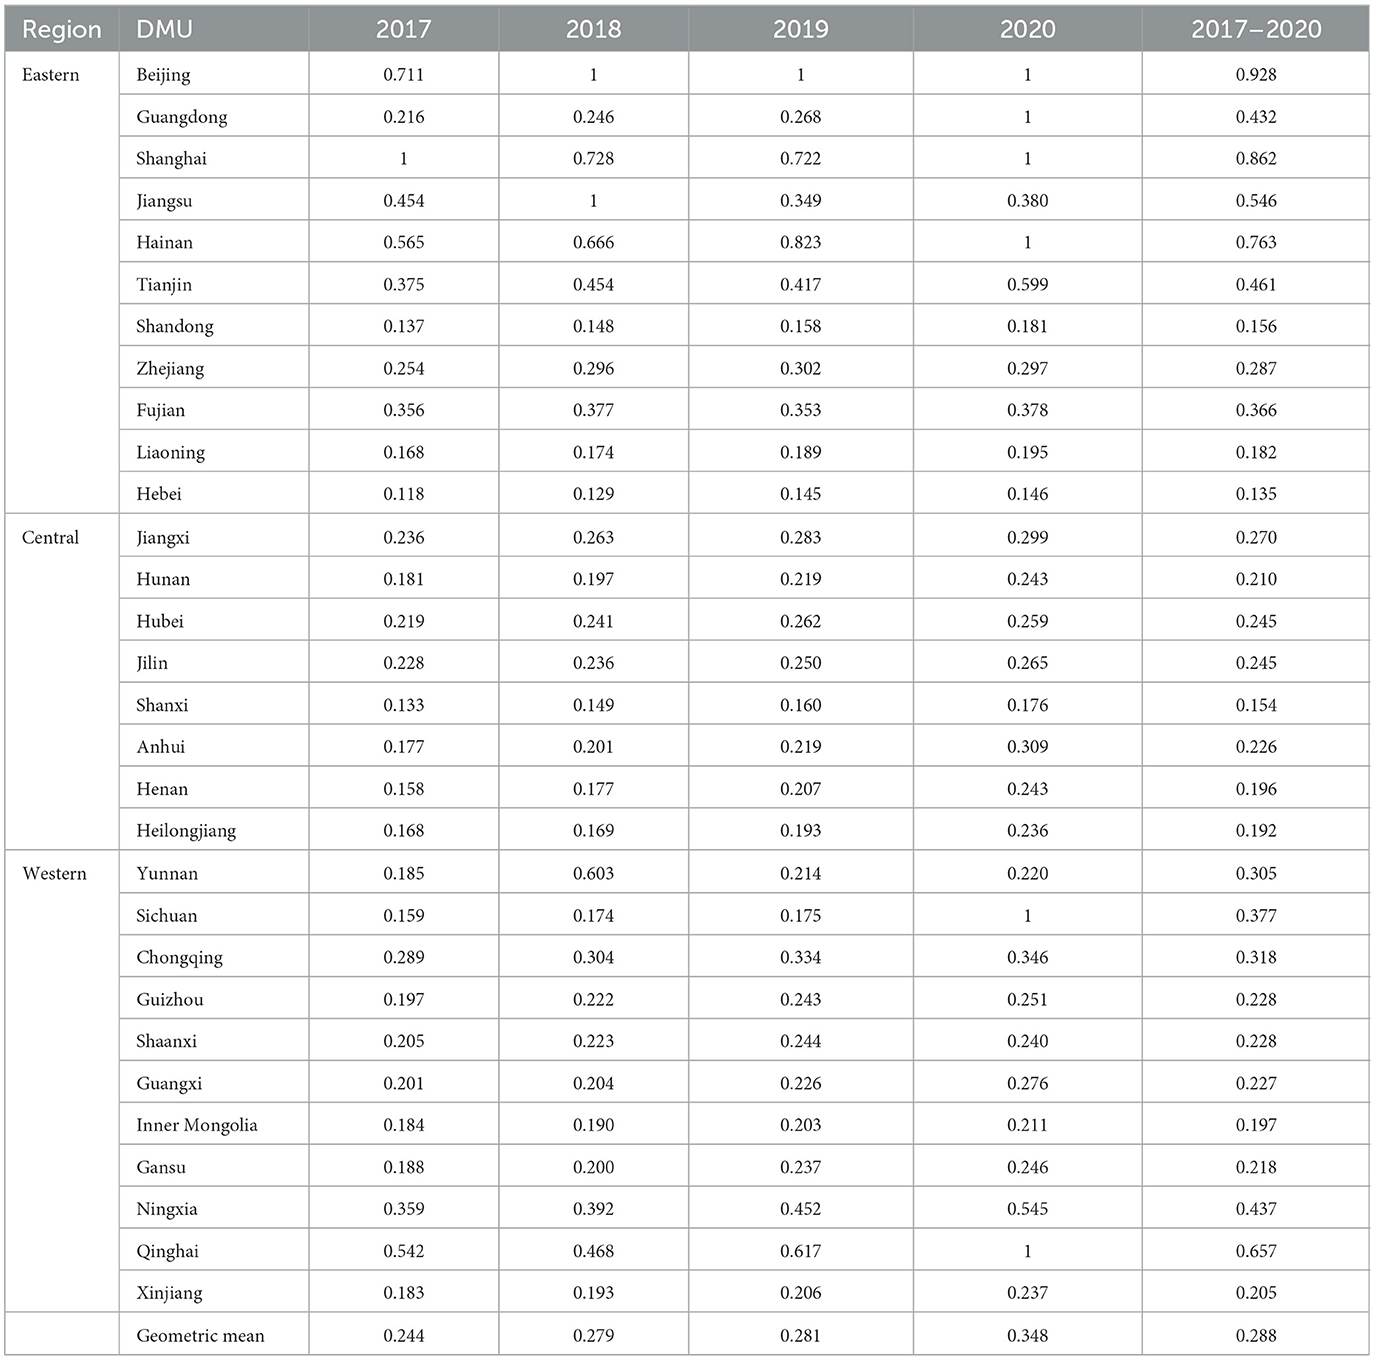
Table 1. Economic development efficiency, by province and region, 2017–2020.
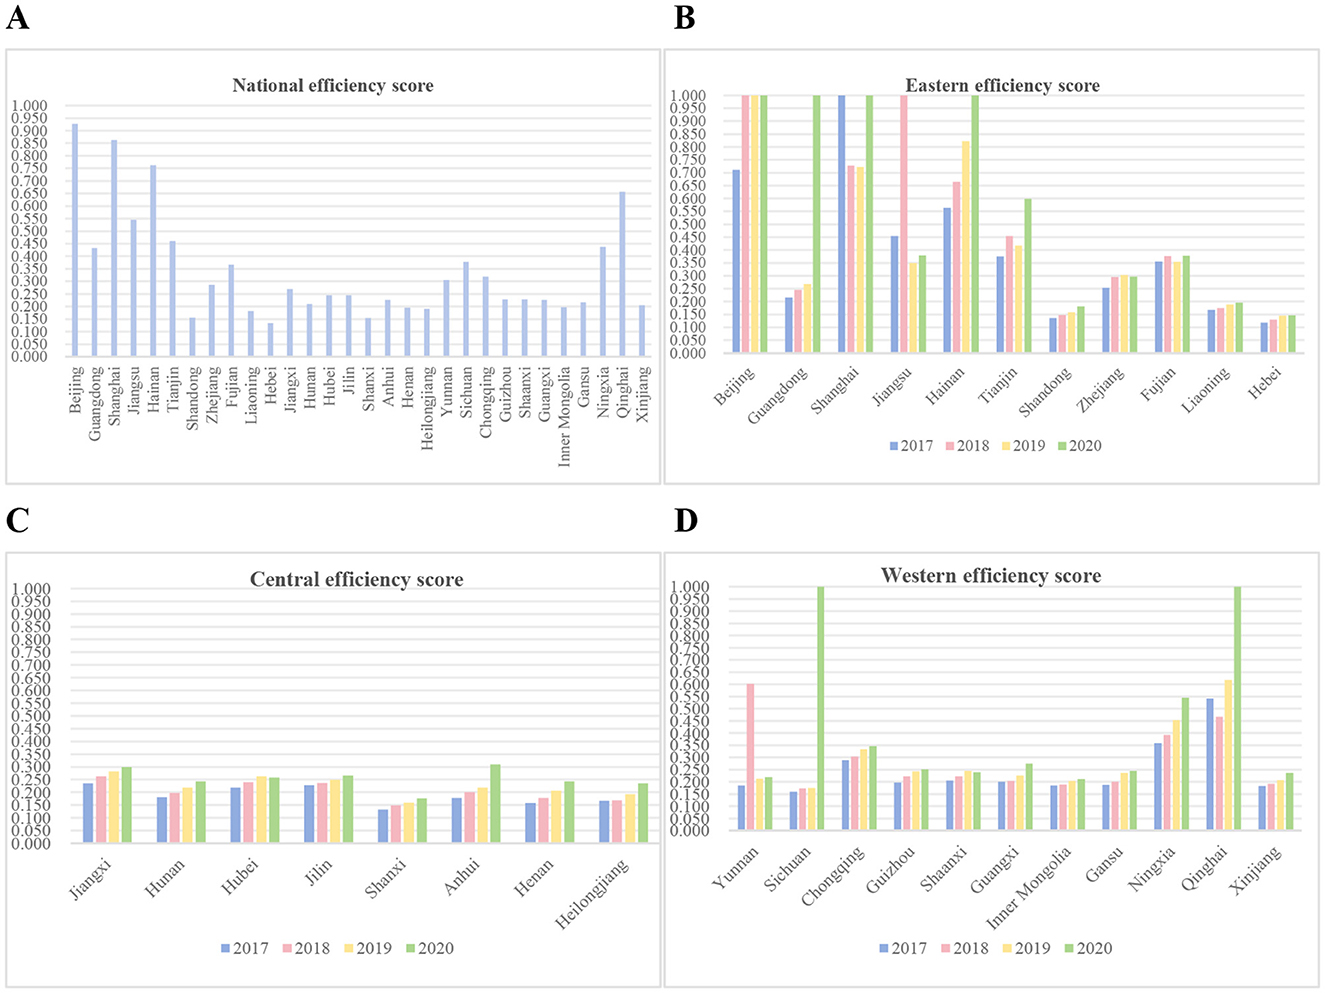
Figure 2. Economic development efficiency of various provinces and regions from 2017 to 2020. (A) Average economic development efficiency of 30 provinces in China from 2017 to 2020. (B) Economic development efficiency of 11 provinces in the eastern region from 2017 to 2020. (C) Economic development efficiency of 8 provinces in the central region from 2017 to 2020. (D) Economic development efficiency of 11 provinces in the western region from 2017 to 2020.
Regional differences in economic development efficiency are significant. In the eastern region, Beijing and Shanghai maintained an efficiency of 1 from 2017 to 2020, indicating efficient resource use and widespread economic benefits (Figure 2B). Guangdong's efficiency rose from 0.2 to 0.3 (2017–2019) to 1.0 in 2020, likely due to industrial upgrading driven by the “Guangdong-Hong Kong-Macao Greater Bay Area Construction” policy. Jiangsu's efficiency dropped from 1 in 2018 to 0.4 in 2020, possibly due to stricter environmental policies. The eastern region's leading efficiency is attributed to its favorable location, policy advantages (e.g., free trade zones), and high-quality resource allocation, which attract foreign investment and technology industries. Its high proportion of skilled labor and clean technology further reinforces this advantage. In the central region, Anhui has the highest efficiency, followed by Jiangxi. All central provinces show a consistent upward trend in efficiency from 2017 to 2020 (Figure 2C). In the western region, Sichuan and Qinghai reached an efficiency of 1 in 2020 after sustained efforts from 2017 to 2019 (Figure 2D). Most western provinces, except Ningxia and Chongqing, had efficiencies below 0.3. For instance, Xinjiang's efficiency remained around 0.2, dropping to 0.18. The low efficiency in the central and western regions is mainly due to a weak industrial base, resource-dependent industrial structure (e.g., energy dominance in Xinjiang), and inefficient policy implementation (e.g., lengthy approval processes). Additionally, labor outflow and low energy efficiency (e.g., Xinjiang's energy consumption per unit of GDP exceeds the national level by 30%) further contribute to inefficiency.
4.2.2 Analysis of health production efficiency
This study used the DNSBM model to measure the health production efficiency of 30 provinces from 2017 to 2020. The input indicators were the number of health technicians and beds per 1,000 people, and the output indicators were the maternal and perinatal survival rates. Only Tianjin has an average health production efficiency of 1, indicating high-quality medical services and a significant scale effect in health production (Table 2, Figure 3A). Additionally, Hainan, Jiangxi, Ningxia, and Qinghai have average health production efficiencies close to 0.9, reflecting relatively high-quality medical services in these regions. Other provinces generally have lower health production efficiencies. Shandong Province performed particularly poorly in 2018 and 2019, with efficiencies falling below 0.4. This suggests that the region has not effectively integrated economic development with health production and is in dire need of improvement. Table 2 shows health production efficiency by province and region from 2017 to 2020.
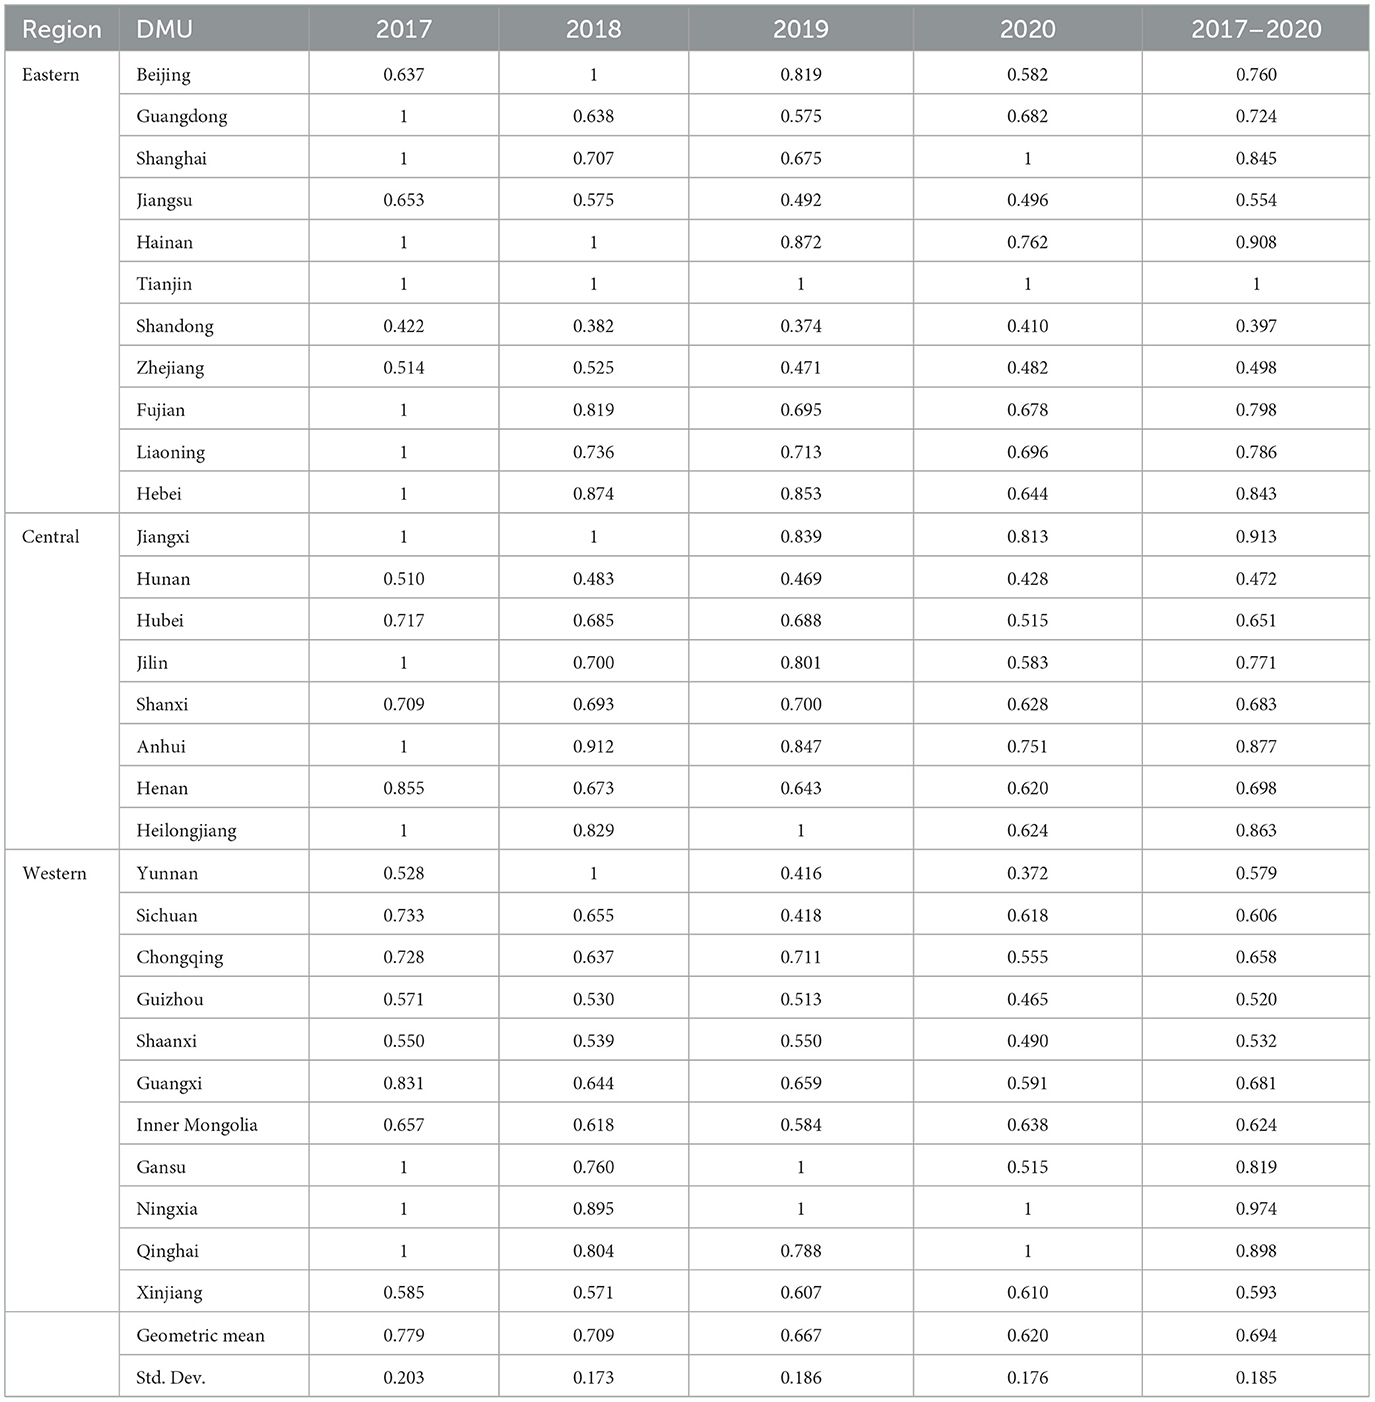
Table 2. Health production efficiency, by province and region, 2017–2020.
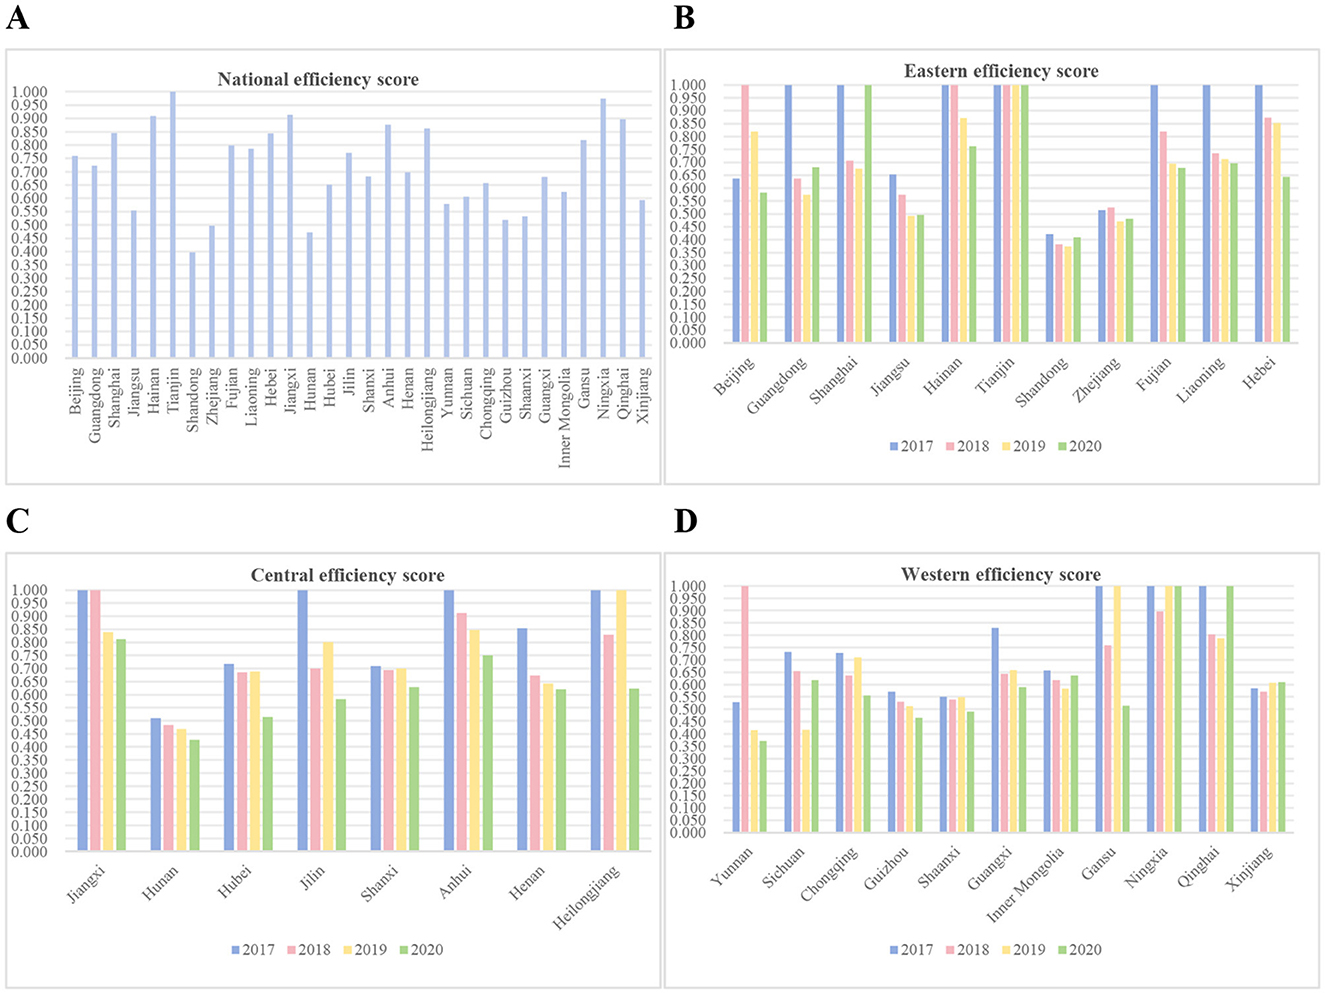
Figure 3. Health production efficiency of various provinces and regions from 2017 to 2020. (A) Average health production efficiency of 30 provinces in China from 2017 to 2020. (B) Health production efficiency of 11 provinces in the eastern region from 2017 to 2020. (C) Health production efficiency of 8 provinces in the central region from 2017 to 2020. (D) Health production efficiency of 11 provinces in the western region from 2017 to 2020.
There are significant regional differences in health production efficiency. Health production efficiency is generally higher in eastern provinces than in central and western regions (Figure 3B). However, some eastern provinces have comparable or even lower efficiency than central and western regions. For example, Shandong's health production efficiency has remained around 0.4 over the past 4 years due to lagging healthcare reforms. Most eastern provinces like Beijing and Guangdong had an efficiency of 1 in the early years but saw a decline to around 0.6 between 2019 and 2020. Shanghai experienced the most fluctuation, with efficiency dropping from 1 in 2017 to around 0.7 in 2018–2019 before rising back to 1 in 2020. In the central region, Jiangxi has the highest health production efficiency. Anhui, Heilongjiang, and Jilin have relatively low efficiency, mostly around 0.8 in the past 4 years (Figure 3C). Most central provinces showed a declining efficiency trend from 2017 to 2020, with Hunan's efficiency falling to 0.4 in 2020. In the western region, Ningxia has the highest health production efficiency at over 0.95, while Guizhou has the lowest at 0.52. Other western provinces like Yunnan, Shaanxi, and Xinjiang have efficiencies below 0.6, with Yunnan being the most volatile, dropping from 1.0 in 2018 to around 0.4 in 2019–2020 (Figure 3D). The higher health production efficiency in eastern China is attributed to high health insurance coverage (e.g., over 99% in Shanghai), advanced technology, and effective “tiered diagnosis and treatment” policies that optimize resource allocation. In contrast, efficiency in central and western regions is constrained by insufficient implementation of grassroots policies, lack of medical resources, and health talent loss. For instance, Gansu faces a 40% shortage of village doctors, and Henan has a 15% physician outflow rate.
4.2.3 Analysis of overall efficiency
We also used the DNSBM model to estimate the overall efficiency of 30 provinces from 2017 to 2020. Table 3 and Figure 4 show the calculation results.
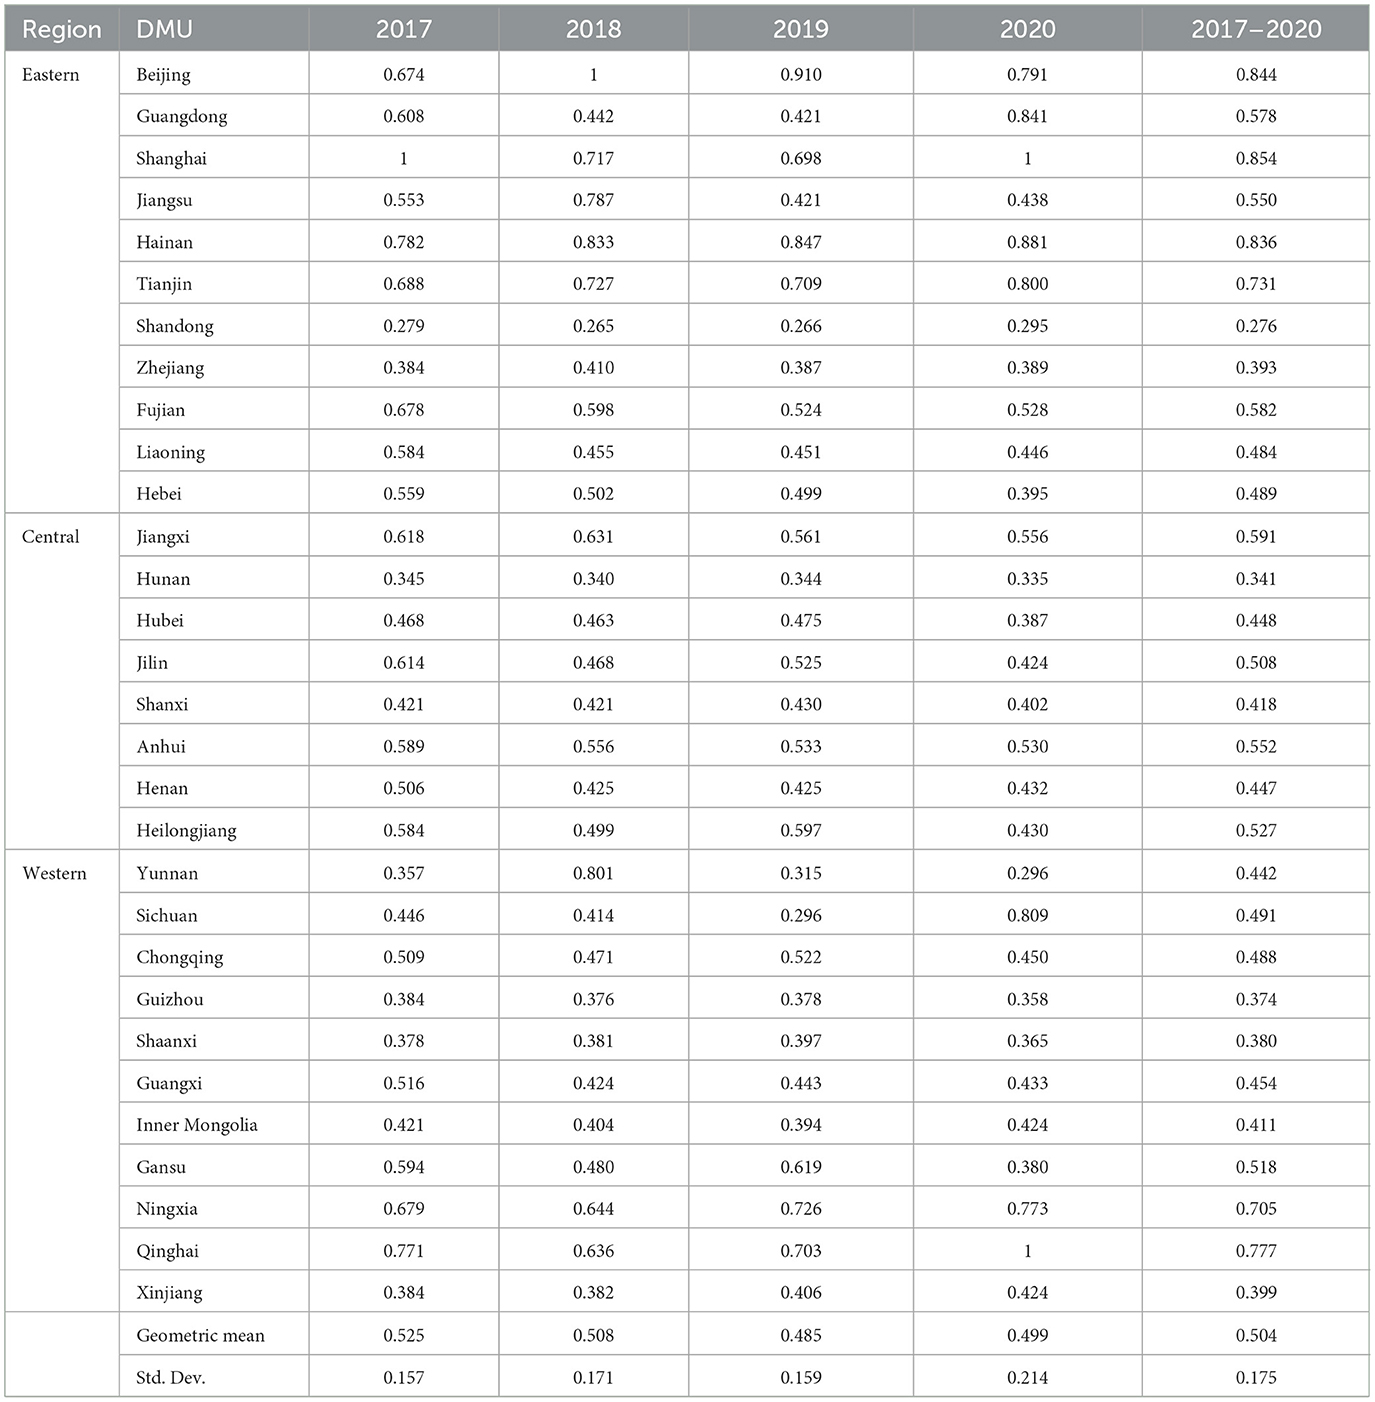
Table 3. Overall efficiency, by province and region, 2017–2020.
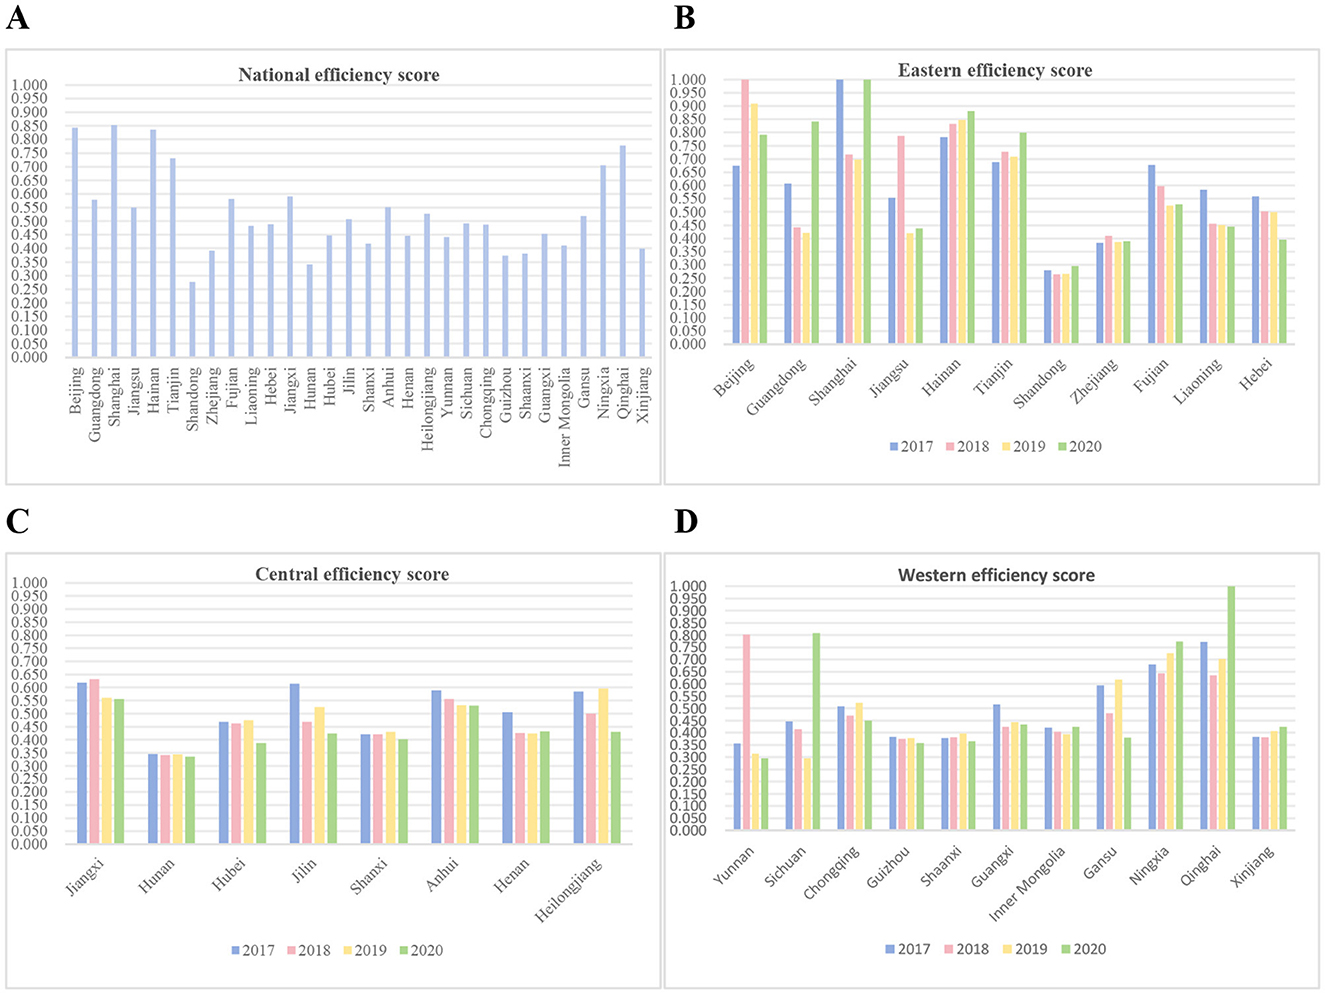
Figure 4. This figure shows the comprehensive efficiency of various provinces and regions from 2017 to 2020. (A) Presents the average comprehensive efficiency of 30 provinces in China from 2017 to 2020. (B–D) Respectively show the changes in comprehensive efficiency of 11 provinces in the eastern region, 8 provinces in the central region, and 11 provinces in the western region from 2017 to 2020.
The findings reveal significant differences in overall efficiency among the provinces (Figure 4A). For instance, Shanghai demonstrated the greatest resource utilization efficiency during the study period with an overall efficiency of 0.85, followed by Beijing and Hainan with efficiencies exceeding 0.8 (Figure 4B). However, Shanghai's efficiency fluctuated considerably during this period, reaching 1.0 in 2017, dropping to approximately 0.7 from 2018 to 2019, and rebounding to 1.0 in 2020. Beijing's efficiency reached 1.0 in 2018, but declined to 0.79 in the following 2 years. Guangdong and Tianjin showed an upward trend in overall efficiency from 2017 to 2020, approaching 0.8 in 2020. Among the provinces with low efficiency values (< 0.8), Tianjin, Ningxia, and Qinghai performed relatively well. Shandong did not reach the highest efficiency value of 0.3 in the past 4 years and performed the worst. Meanwhile, Guangdong, Jiangsu, Fujian, Jiangxi, Jilin, Anhui, Heilongjiang, and Gansu had efficiencies between 0.5 and 0.7 (Figure 4C). Zhejiang, Shanxi, Guizhou, Shaanxi, Inner Mongolia, and Xinjiang had efficiencies of around 0.4. These provinces therefore need to improve their overall efficiency.
In terms of time trends, the overall efficiency of the five provinces—Hainan, Tianjin, Ningxia, Qinghai, and Xinjiang—continues to rise. Qinghai had the largest increase, rising from 0.771 in 2017 to 1.0 in 2020 (Figure 4D). Tianjin had the second largest increase, rising from 0.688 in 2017 to 0.800 in 2020. The overall efficiency of four provinces—Beijing, Guangdong, Shandong, and Sichuan—shows a fluctuating upward trend. Sichuan had the largest increase, rising from 0.446 to 0.809; Shandong had the smallest increase, from 0.279 to 0.295. However, the overall efficiency of the remaining 21 provinces mostly declined, with only a few remaining essentially flat. Gansu and Jilin show the largest decreases: from 0.594 and 0.614 in 2017 to 0.380 and 0.424 in 2020, respectively. These results suggest that more provinces are experiencing decreases in efficiency than increases. Thus, most provinces need to make greater efforts toward economic development and health production.
4.2.4 Comparative analysis of overall efficiency and two-stage efficiency
The decline in health production efficiency during the period from 2017 to 2020 was the main reason for the overall efficiency decrease, while the improvement in economic development efficiency somewhat alleviated the downward trend of overall efficiency (Figure 5A). Specifically, health production efficiency showed negative growth in each year from 2017 to 2020 (Figure 5B). In contrast, economic development efficiency achieved positive growth (growth rate) in all years except 2018 to 2019.
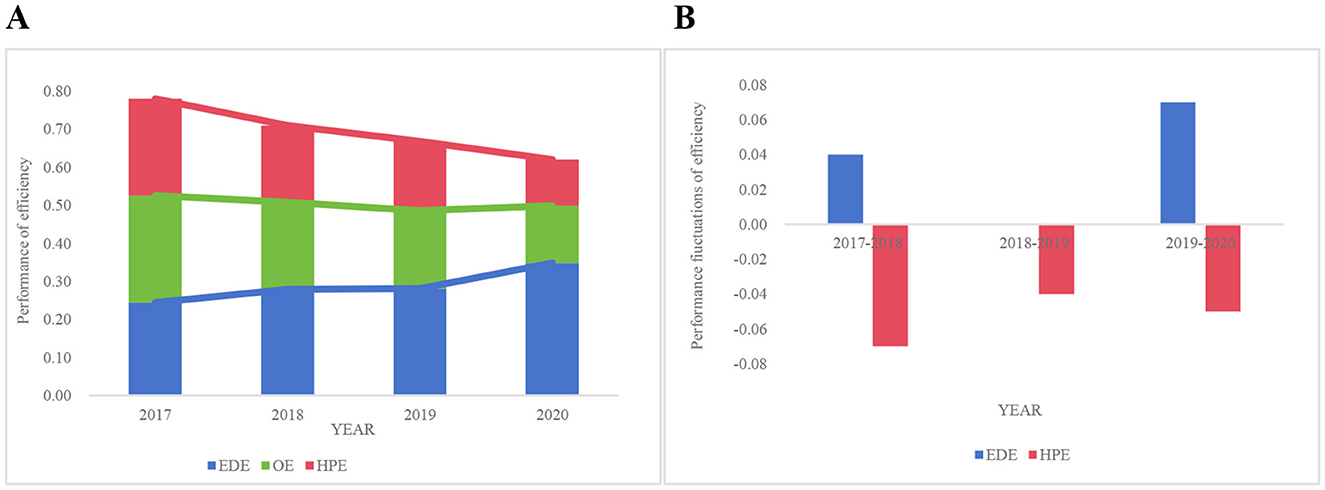
Figure 5. China's efficiency performance from 2017 to 2020. (A) China's Overall Efficiency (OE), Economic Development Efficiency (EDE) and Healthy Production Efficiency (HPE) during the period 2017–2020. (B) China's Economic Development Efficiency (EDE) and Healthy Production Efficiency (HPE) fluctuated between 2017 and 2020.
Normality and homogeneity of variance tests were conducted for economic development efficiency, health production efficiency, and overall efficiency. The results showed that economic development efficiency and overall efficiency were normally distributed, but the variances failed to meet the homogeneity of variance condition; thus, Welch ANOVA was employed for the analysis. In contrast, health production efficiency satisfied both normality and homogeneity of variance, so ANOVA was used to examine the efficiency differences among the eastern, central, and western regions. The p-values were compared with the predetermined confidence levels (α = 0.01, 0.05, and 0.10). From 2017 to 2020, the p-values for the economic development stages were below 0.05, indicating significant differences in economic development efficiency among the eastern, central, and western regions (Table 4). For the health production stage, however, no significant differences were found, possibly due to the short time span of the study and the delayed impact of food safety controls on health production. Significance was only demonstrated in 2020 for the total efficiency stage, suggesting that food safety controls may have positively coordinated economic development and health production from 2017 to 2020. This result further highlights the importance of strengthening food safety governance. Strengthening food safety governance is necessary not only to protect public health but also to improve the region's overall efficiency and promote coordinated regional development.
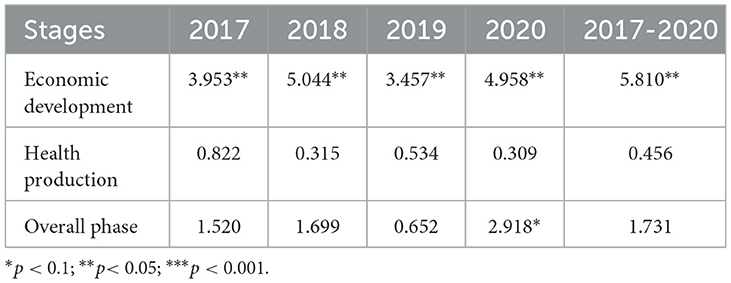
Table 4. Variance analysis results of the overall efficiency in the eastern, central, and western regions from 2017 to 2020.
Specifically, in terms of total efficiency, the Eastern region begins at a higher initial level and continues to extend its lead over the Western and Central regions throughout the study period (Figure 6A). This suggests that the Eastern region outperforms the Central and Western regions in terms of economic development and health production. Regional development imbalances are a growing concern in China. Nevertheless, the Chinese government has promoted the development of the Central and Western regions by introducing preferential policies and investing substantial resources to address this issue. Additionally, the efficiency of economic development has improved in all three regions (Figure 6B). The Eastern region initially had a relatively higher level of efficiency, suggesting that it performed better at using economic output to drive development. According to the survey results, the eastern region demonstrated superior economic development efficiency in 2020, and this advantage is expected to grow in the coming years. Regarding health productivity, all three regions show a continuous downward trend between 2017 and 2020 (Figure 6C). The eastern region had a higher sanitary production efficiency than the national average. The central region had a higher sanitary production efficiency than the east from 2017 to 2019 but a lower one in 2020. This indicates that the central region has been trying to catch up with the east to narrow the inter-regional gap.
Figure 6. Comparison of different levels of efficiency in three regions. (A) Overall efficiency comparison of China and three regions from 2017 to 2020. (B) Economic development efficiency comparison between China and the three major regions from 2017 to 2020. (C) Health production efficiency comparison between China and the three major regions from 2017 to 2020.
4.2.5 Food safety control efficiency analysis
Utilizing the DNSBM model, this study evaluated food safety control capacity across 30 Chinese provinces (2017–2020). Results revealed suboptimal national efficiency levels, with averages of 0.72 for food sampling failure rate, 0.45 for foodborne disease incidents, and 0.51 for affected patients—indicating substantial improvement potential. Provincial disparities were pronounced (Table 5): six provinces (20%) exceeded 0.9 efficiency in sampling failure rate control, while Shandong and Hunan performed weakest (< 0.4). Only three provinces (10%) achieved >0.8 efficiency for incident reduction; seven provinces (Jiangsu, Shandong, Zhejiang, Hunan, Guizhou, Shaanxi, Inner Mongolia) scored below 0.2. Regarding patient management, six provinces (20%) surpassed 0.8 efficiency, contrasting with four lowest performers (Jiangsu, Zhejiang, Shaanxi, Inner Mongolia) at < 0.2. These significant regional variations demonstrate China's considerable potential to mitigate systemic food safety risks. These provinces should be prioritized as key targets for interventions aimed at improving the overall level of food safety nationwide. Targeted interventions are urgently needed to address their specific efficiency gaps. For instance, Shandong faces significant challenges in controlling both the food sampling failure rate and the number of foodborne disease incidents, while Jiangsu exhibits inefficiencies in managing the number of foodborne disease incidents and patients. Notably, high-efficiency provinces are distributed across the eastern, central, and western regions. Among the seven provinces with the lowest efficiencies, three are located in the east, three in the west, and one in the central region. This distribution pattern indicates that regional economic development level is not necessarily positively correlated with food safety control capacity. In fact, economically developed eastern regions may face exacerbated food safety challenges due to their higher levels of industrialization and urbanization. Therefore, strengthening inter-regional cooperation and the exchange of best practices and expertise is critical to enhancing China's overall food safety control level.
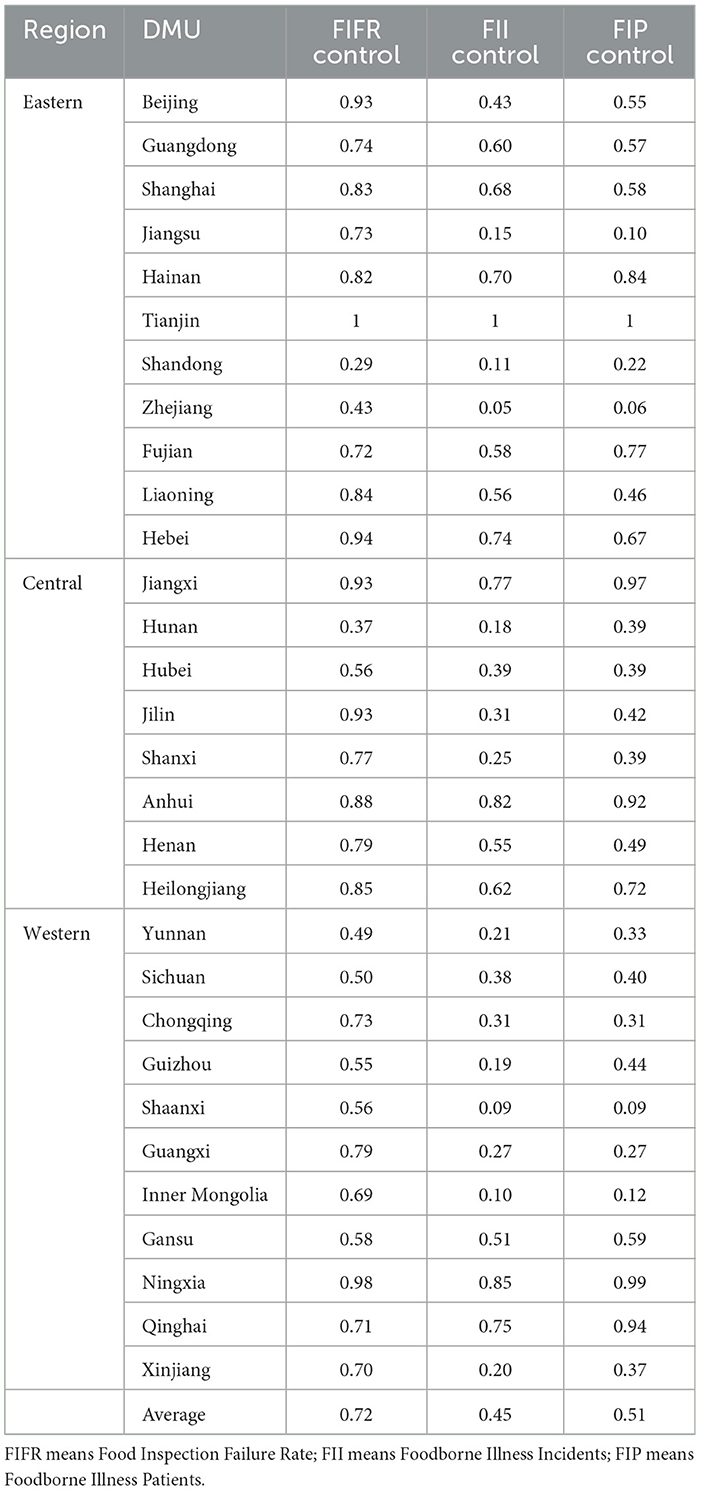
Table 5. Regional differences in the average food safety control efficiency in China from 2017 to 2020 (geometric mean).
This study applied the DNSBM model to various low-efficiency provinces to determine their target values for food safety risk control. However, after reviewing the relevant data, it was found that these provinces have significant gaps compared to high-efficiency provinces in terms of economic development, management capacity, and technology. This makes it difficult for these provinces to reach the targets calculated by the DNSBM model in a short period of time. Therefore, the food safety risk control targets set by the DNSBM model are considered long-term goals, which are more challenging for inefficient provinces to achieve in the short term. Table 6 illustrates this point by showing the actual and target values for each Chinese province in terms of food sampling failure rate, number of foodborne disease incidents, and number of patients, as well as the corresponding improvements.
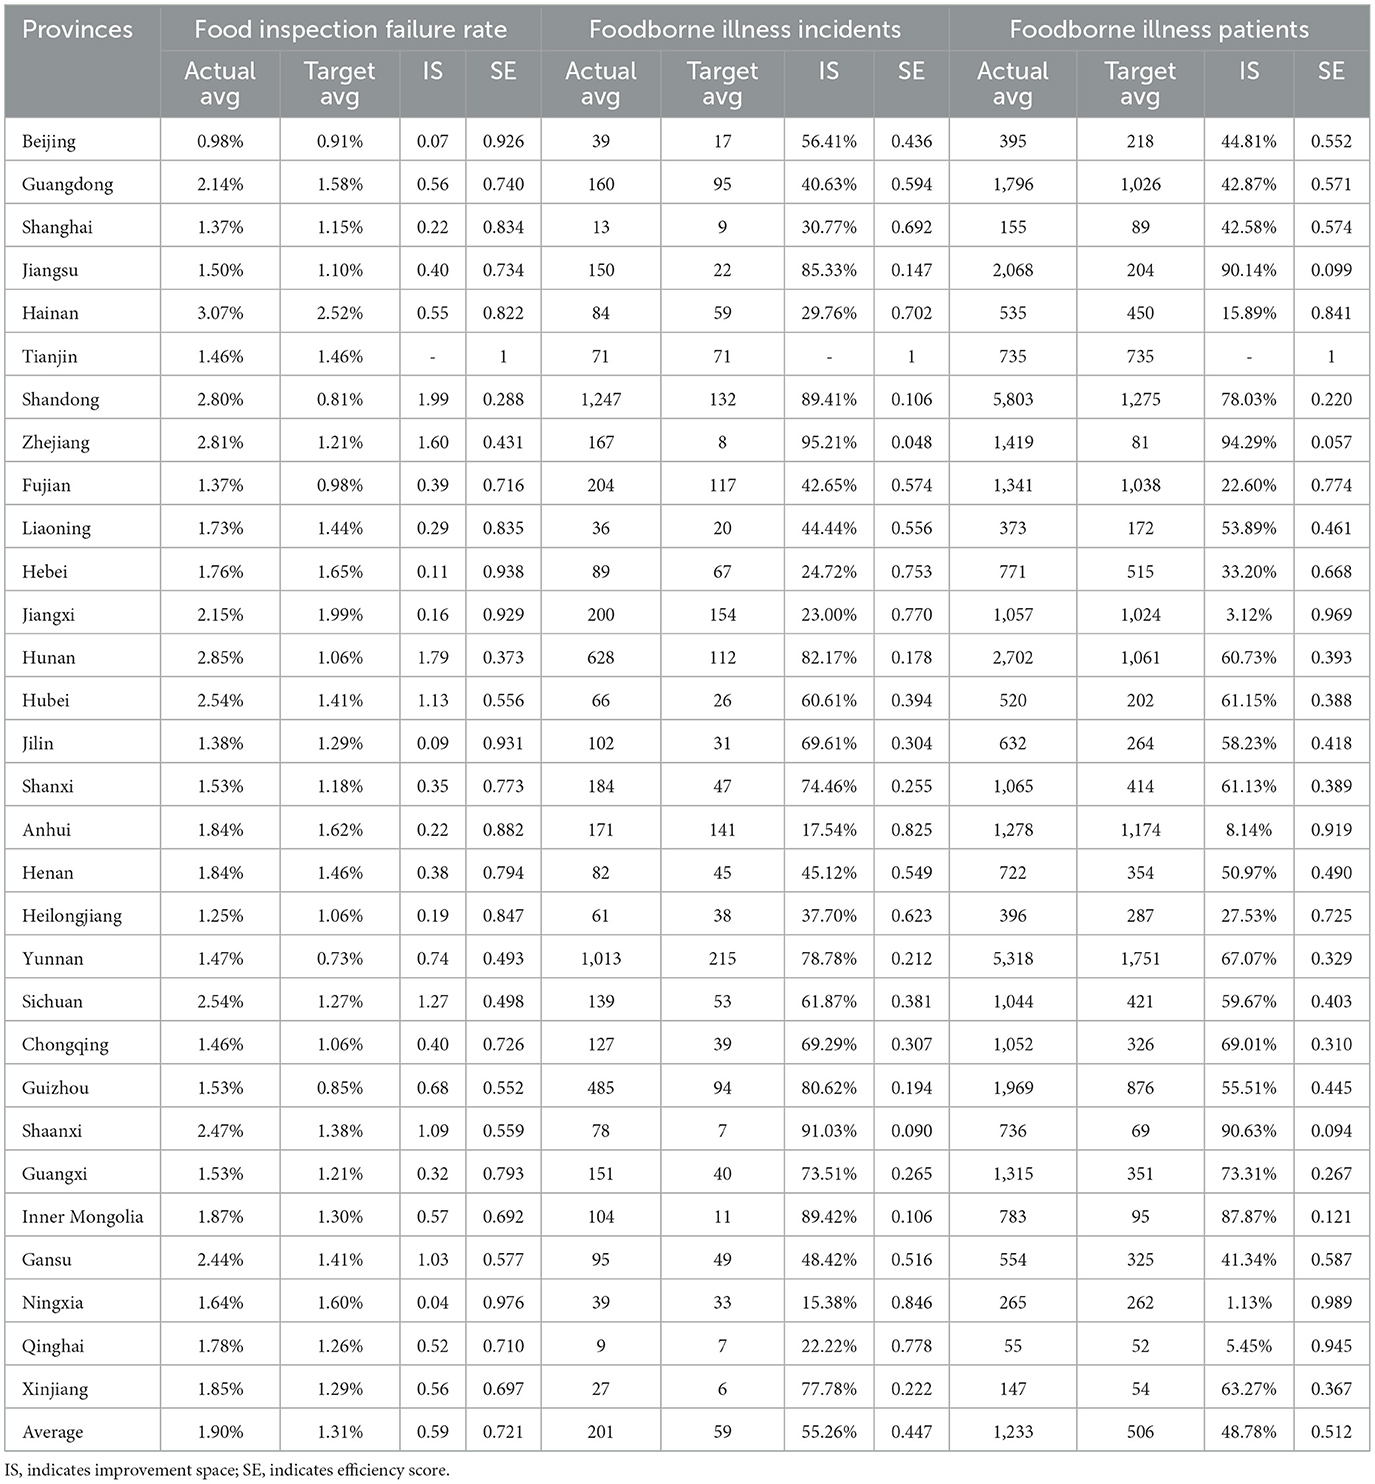
Table 6. Long-term food safety risk control targets of 30 provinces in China from 2017 to 2020.
Tianjin is the only province with a zero food safety risk control target, which can serve as a benchmark for other inefficient Chinese provinces (Table 6). For example, in Anhui Province, the control efficiencies for the food sampling failure rate, the number of foodborne disease incidents, and the number of patients are 0.882, 0.825, and 0.919, respectively. To reach a high level of efficiency, Anhui would need to reduce its food sampling failure rate by 0.22 percentage points (from 1.84% to 1.62%), reduce the number of foodborne disease incidents by 17.54% (from 171 to 141), and reduce the number of foodborne disease patients by 8.46% (from 1,278 to 1,174). The number of foodborne illnesses would decrease by 17.54%. Similarly, Qinghai Province's control efficiency in terms of the food sampling failure rate, the number of foodborne disease incidents, and the number of patients was 0.710, 0.778, and 0.945, respectively. Its targets were to reduce the food sampling failure rate from 1.78% to 1.26% (a 0.52 percentage point improvement), the number of foodborne disease incidents from 9 to 7 (a 22.22% improvement), and the number of foodborne disease patients from 55 to 52. These control targets for food safety risks are realistic for these two better-performing provinces. However, achieving the targets is not easy for some less efficient regions. For instance, Zhejiang Province's control efficiencies for the food sampling failure rate, number of foodborne disease incidents, and number of patients were 0.431, 0.048, and 0.057, respectively. To achieve the targets, these numbers need to be reduced by 56.94%, 95.21%, and 94.29%, respectively. Clearly, these targets are challenging for less efficient provinces to attain in a short period, so long-term and short-term targets must be established.
5 Discussion
Although there have been studies exploring the intersection between economic development, food safety, and human health (Malhotra et al., 2023; Friel and Baker, 2009), few have analyzed their interactions from an efficiency perspective. This study used the DNSBM model to evaluate the efficiency of economic development, food safety, and health production in 30 Chinese provinces from 2017 to 2020. This methodology overcomes the limitations of static analysis by taking into account time carry-over effects and regional differences. The study's results provide targeted recommendations for policy formulation, and the main findings are summarized below.
First, China's overall efficiency value for the two phases of economic production and health output from 2017 to 2020 is low at 0.504, indicating much room for improvement. This is mainly due to the failure to balance economic development and health production, as found in other studies (Shi et al., 2021). Specifically, the average annual efficiency of economic development (0.288) was significantly lower than that of health production (0.694). Therefore, greater efforts are needed to improve the effectiveness of economic resource utilization. Furthermore, there is a downward trend in overall efficiency values, primarily due to the decline in health production efficiency. Conversely, improvement in the efficiency of economic development is the main factor mitigating the decline in overall efficiency. These findings suggest that improving the efficiency of economic development rather than health production should be the main priority when attempting to enhance overall efficiency. This conclusion aligns with the results of other studies (Jiang et al., 2023). At the provincial level, significant differences in efficiency exist. Provinces such as Beijing and Shanghai are more efficient in terms of economic development and health production, with values close to or equal to one. In contrast, provinces such as Xinjiang and Inner Mongolia are less efficient in both areas. These differences can be attributed to variations in economic development, resource allocation, and policy implementation across regions. The eastern region, which is more economically developed, has higher economic productivity and better health outcomes. In contrast, the central and western regions, which are less developed, are less efficient. This underscores the necessity of implementing targeted policies to address regional disparities and encourage coordinated development. Additionally, economic development is more efficient than health production in Beijing and Shanghai, whereas in other provinces, economic development is less efficient than health production. One possible reason for this is that these regions prioritize the investment and optimization of public services, such as healthcare, during economic transformation. As part of the national strategy for a Healthy China, local governments have increased their investment in healthcare and prioritized the supply of basic medical services, thereby improving the efficiency of health production. Conversely, good health improves people's economic situation, boosts productivity, and helps them escape poverty, thereby contributing to the country's long-term development.
Second, the study reveals significant regional disparities in economic development efficiency in China, consistent with the findings of Liang and Zhao (2024). While the differences in health production efficiency between the eastern, central, and western regions are not significant, it is clear that the eastern and central regions have higher health production efficiency than the western region. Specifically, Beijing, Shanghai, and other eastern and central regions of China have higher economic development efficiency values. The east-central region's higher input-output efficiency is strongly supported by its higher level of economic development and superior health resource endowment (Yan et al., 2021). While these regions have food safety issues affecting population health, the positive effects of higher economic levels and health resources outweigh the negative effects (Lu et al., 2020). Therefore, these regions will likely maintain high levels of economic development and healthy output. In contrast, western regions (e.g., Xinjiang, Guizhou, and Shaanxi) have lower levels of economic development and health productivity. Their relatively weak industrial bases and imperfect industrial structures mean they lack the conditions necessary to fully utilize input variables (e.g., energy and labor), resulting in less efficient economic development. Additionally, healthcare resources in China are unevenly distributed, with high-quality resources increasingly concentrated in the east (Zhang et al., 2021). Due to a lack of financial resources, the western regions have underinvested in high-quality medical equipment and health professionals (Wang et al., 2023), thus limiting their health productivity.
This study reveals China's suboptimal food safety control efficiency (2017–2020), with national averages of 0.694 for sampling failure rates, 0.368 for foodborne disease incidents, and 0.428 for affected patients, indicating substantial improvement potential. Significant 2020 regional disparities demonstrate how efficiency imbalances constrain overall performance: high-efficiency regions bolster total efficiency by balancing economic development and production safety, whereas low-efficiency regions impede progress. To address this, we propose an interprovincial knowledge-transfer mechanism comprising: (1) Targeted benchmarking for sampling failure control—low-efficiency provinces learn from top performers (>0.9 efficiency) on risk-based sampling design, precision supervision, streamlined non-conforming product disposal, enterprise risk classification, and enhanced risk communication; (2) Collaborative partnerships for disease control—provinces with critical gaps in incident/patient management establish long-term collaborations with high-efficiency peers (>0.8) to strengthen catering oversight, enhance disease surveillance networks, advance pathogen detection/tracing, optimize emergency protocols, and expand professional/public education. Central coordination (State Council Food Safety Office/SAMR/NHC) must provide targeted funding, standardized frameworks, unified information platforms, and PDCA-embedded KPIs for evaluation, while provinces develop time-bound improvement plans with resource commitments. Critically, the development-governance-technical disparities between high/low-efficiency provinces imply DNSBM-modeled targets for underperformers should be treated as long-term objectives.
6 Conclusion
6.1 Major findings
China's rapid economic development has increased food safety risks, threatening public health and hindering sustainable socioeconomic development. Using the DNSBM model, this study assessed the dynamic linkages between economic development, food safety, and healthy production from an efficiency perspective and drew the following conclusions.
First, the national average comprehensive efficiency value is 0.504, indicating room for improvement. Economic development efficiency (0.288) is lower than health production efficiency (0.694), indicating China was effective in health production but not in economic development from 2017 to 2020. Growth in economic development efficiency was the main factor in overall efficiency improvement during the study period, while a decline in health production efficiency was the main obstacle.
Second, there are significant inter-provincial differences. The differences in economic development efficiency among the 30 provinces are statistically significant, while the differences in health production efficiency are not. Beijing and Shanghai have the highest economic development efficiency, with values close to or equal to one. Xinjiang, Inner Mongolia, Gansu, and Guizhou have the lowest efficiency, with values < 0.3. Tianjin has the highest health production efficiency, with a value of 1, while Shandong has the lowest, with a value of < 0.4. Overall, Beijing, Shanghai, and Hainan are the most efficient, with values >0.8, while Shandong is the least efficient, with a value < 0.3. The eastern region is the most efficient, followed by the central region; the western region is the least efficient.
Third, food safety risk control efficiency needs improvement. From 2017 to 2020, China's average control efficiencies for the food sampling failure rate, foodborne disease incidents, and patients were 0.694, 0.368, and 0.428, respectively, indicating significant room for improvement. There are significant differences in food safety risk control efficiency across regions. Regions with higher levels of economic development do not necessarily have higher food safety control efficiency.
6.2 Policy recommendations and prospects
6.2.1 Domestic recommendation
Based on the above conclusions, the following policy recommendations are proposed. First, optimize resource allocation to promote synergistic regional development. The central and local governments should increase investment in resources in the central and western regions, focusing on supporting infrastructure construction, education, scientific research and development, and healthcare. Second, encourage in-depth cooperation between the eastern region and the central and western regions to promote technology and industry transfer and realize complementary regional advantages. Second, enhance health productivity and promote sustainable health development. All regions should distribute healthcare resources according to population distribution and health needs to improve the efficiency of resource utilization. They should strengthen public health systems and improve their ability to prevent and control major diseases. They should also formulate corresponding preventive and intervention measures, especially in response to external factors impacting health, such as food safety. Finally, strengthen food safety governance to protect public health. The central government should select benchmark provinces based on their characteristics and set realistic food safety risk control targets and short- and long-term goals. The central government should also improve food safety laws and regulations, intensify crackdowns on illegal behavior, increase the frequency and scope of testing, and raise public awareness of food safety and self-protection.
6.2.2 Global suggestions
The issue of food safety is a global challenge that urgently requires a concerted response from all countries. China's rich experience in food safety governance offers valuable insights for other developing nations. For instance, China has successfully decreased the number of food safety incidents by strengthening government supervision and holding corporations accountable. In recent years, China has improved its food safety laws and regulations and strengthened its testing technology and regulatory system, resulting in significant improvements in food safety. At the same time, developed countries should actively provide technical assistance to developing countries by promoting advanced means such as rapid detection technology and blockchain traceability systems to help improve their food safety governance capacity. Additionally, international organizations such as the WHO and FAO should establish unified food safety standards and mitigate trade barriers and risk transmission caused by regulatory differences among countries. Through broad-based and in-depth international cooperation, countries can share resources, technology, and experience to improve global food safety and protect public health worldwide.
To enhance global food safety, countries must integrate food safety into their national sustainable development strategies and create policies that balance economic growth with public health. Specific measures include carefully formulating and strictly enforcing food safety laws and regulations according to national conditions. For example, in recent years, China has revised and improved its Food Safety Law, further clarifying the responsibilities and penalties of each party involved, resulting in a strong crackdown on food safety violations. Other countries can learn from China's “strictest supervision” model and impose severe penalties, such as high fines and market bans, on illegal enterprises to create a strong deterrent effect. Second, public awareness of food safety must be raised. To enhance public awareness of food safety, an important cornerstone of food safety governance, countries should carry out various publicity and educational activities. They should popularize food safety knowledge through digital platforms and other means to enhance the public's self-protection ability and encourage consumers to actively participate in food safety supervision. This will create a good atmosphere of common concern and participation from the whole society. China's “Food Safety Awareness Week” and Japan's food safety education programs, for example, have effectively raised public awareness of food safety, thereby reducing the incidence of foodborne illnesses. Food safety testing technology is key to ensuring food safety. Countries should invest more in testing equipment and technology, increase testing frequency and coverage, focus on high-risk foods and weak links, and support the use of AI and big data in testing. South Africa, for instance, has successfully predicted foodborne disease outbreaks using machine learning technology, significantly reducing health risks. The United States, with its advanced testing technology, can rapidly detect harmful substances in food and effectively control food safety risks.
6.3 Research prospects
This study provides China with empirical evidence to harmonize economic development, food safety, and healthy production. Its methodology and conclusions are also significant for global sustainable development. The constructed DNSBM model can dynamically assess multi-stage efficiency, overcoming the limitations of traditional regression analysis. It can be generalized to other countries, especially emerging economies such as India and Brazil, which face similar contradictions between economic growth, resource consumption, and public health. This model can help these countries identify efficiency shortcomings and formulate targeted policies. The model can be applied to other countries, particularly emerging economies that face similar conflicts between economic growth, resource consumption, and public health, such as India and Brazil. It can help these countries identify efficiency shortcomings and develop targeted policies. The study found that inefficient food safety risk control is a key constraint to overall efficiency and warns countries that food safety must be at the center of their development strategies. For instance, African countries could reduce chemical contamination by strengthening the regulation of agricultural inputs, and Latin American countries could reduce the risk of foodborne pathogens by improving cold chain logistics. China has made significant progress with its “Healthy China 2030” and “Food Safety Strategy,” and its experience demonstrates that government-led, multisectoral collaboration and technological innovation are key to successful governance. This can be achieved in the future through the “South-South Cooperation” platform. Through this platform, we can export governance experience and technology to developing countries while jointly researching and developing new testing technologies with developed countries to build a global food safety network. In conclusion, food safety governance is a global public good and a shared responsibility of all countries. To achieve sustainable economic, health, and environmental development, countries must transcend geographical and interest-based limitations and work together through policy synergy, technology sharing, and institutional innovation.
This study provides valuable insights, but it has a number of limitations. First, the selection of study indicators was based on available literature and data, which may not fully capture the complex relationship between economic development, food safety, and healthy production. Second, the time span of the study is relatively short; future studies could consider data from longer time periods to better capture dynamic changes. Third, this study focuses on efficiency assessment; future studies could explore factors affecting efficiency further, such as population density and consumption habits. Therefore, the selection of indicators and influencing factors will be studied in depth in the future.
Data availability statement
The raw data supporting the conclusions of this article will be made available by the authors, without undue reservation.
Author contributions
MT: Writing – review & editing, Methodology, Formal analysis, Writing – original draft. HW: Supervision, Writing – review & editing, Funding acquisition, Project administration. QT: Project administration, Formal analysis, Supervision, Writing – review & editing.
Funding
The author(s) declare that financial support was received for the research and/or publication of this article. The project was sponsored by 2022 Collaborative Innovation Projects in Anhui Province Universities, “Research on Data Integration and Governance of Anhui Traditional Chinese Medicine” (Project No: GXXT-2022-095) and 2022 Excellent Research Innovation Team of Anhui University (Social Science), “Excellent research team of Chinese medicine innovation and development” (Project No: 2022AH010039).
Conflict of interest
The authors declare that the research was conducted in the absence of any commercial or financial relationships that could be construed as a potential conflict of interest.
Generative AI statement
The author(s) declare that no Gen AI was used in the creation of this manuscript.
Publisher's note
All claims expressed in this article are solely those of the authors and do not necessarily represent those of their affiliated organizations, or those of the publisher, the editors and the reviewers. Any product that may be evaluated in this article, or claim that may be made by its manufacturer, is not guaranteed or endorsed by the publisher.
Supplementary material
The Supplementary Material for this article can be found online at: https://www.frontiersin.org/articles/10.3389/fsufs.2025.1629967/full#supplementary-material
References
Alsubaie, A. S. R., and Berekaa, M. M. (2020). Food safety in Saudi Arabia: a public health priority. Ann. Med. Health Sci. Res. 10, 1142–1147.
Bilan, Y., Vysochyna, A., Vasylieva, T., Grytsyshen, D., and Smutka, L. (2023). Impact of coronavirus disease (COVID-19) on food security: bibliometric analysis and empirical evidence. Front. Sustain. Food Syst. 7:1126454. doi: 10.3389/fsufs.2023.1126454
Bul, A. M., and Moracha, O. R. (2020). Effects of economic growth on health outcomes: a panel data study of sub-saharan Africa. Int. J. Sci. Bus. 4, 35–60. doi: 10.5281/zenodo.3736314
Castillo-Castillo, A., Walker, R., Keeler, B., Lonsdorf, E., and Ramer, H. (2025). Race and income moderate the effect of parks on housing prices in a segregated city. Landsc. Urban Plan. 259:105340. doi: 10.1016/j.landurbplan.2025.105340
Charnes, A., Cooper, W. W., and Rhodes, E. (1978). Measuring the efficiency of decision making units. Eur. J. Oper. Res. 2, 429–444. doi: 10.1016/0377-2217(78)90138-8
Chen, Y. Q., and Chen, Y. H. (2023). Economic growth, income inequality and food safety risk. Foods 12:3066. doi: 10.3390/foods12163066
Dědeček, R., and Dudzich, V. (2020). “Causes of limitations of GDP Per capita as an indicator of economic development,” in Proceedings of the Annual Conference on Finance and Accounting (New York, NY: Springer International Publishing), 41–59. doi: 10.1007/978-3-030-99873-8_4
Färe, R., Grosskopf, S., and Primont, D. (2010). Aggregation, Efficiency, and Measurement. Germany: Springer Science and Business Media.
Färe, R., Grosskopf, S., and Whittaker, G. (2007). “Network DEA,” in Modeling Data Irregularities and Structural Complexities in Data Envelopment Analysis, eds. W. D. Cook and J. Zhu (New York, NY: Springer), 209–240. doi: 10.1007/978-0-387-71607-7_12
Friel, S., and Baker, P. I. (2009). Equity, food security and health equity in the Asia Pacific region. Asia Pac. J. Clin. Nutr. 18, 620–632. doi: 10.3316/ielapa.712680552487788
Grace, D. (2023). Burden of foodborne disease in low-income and middle-income countries and opportunities for scaling food safety interventions. Food Security 15, 1475–1488. doi: 10.1007/s12571-023-01391-3
Hadad, S., Hadad, Y., and Simon-Tuval, T. (2013). Determinants of healthcare system's efficiency in OECD countries. Eur. J. Health Econ. 14, 253–265. doi: 10.1007/s10198-011-0366-3
Hawaz, H., Bottari, B., Scazzina, F., and Carini, E. (2025). Eastern African traditional fermented foods and beverages: advancements, challenges, and perspectives on food technology, nutrition, and safety. Compr. Rev. Food Sci. Food Saf. 24:e70137. doi: 10.1111/1541-4337.70137
Hu, J. L., and Wang, S. C. (2006). Total-factor energy efficiency of regions in China. Energy Policy 34, 3206–3217. doi: 10.1016/j.enpol.2005.06.015
Jaffee, S., Henson, S., Unnevehr, L., Grace, D., and Cassou, E. (2018). The Safe Food Imperative: Accelerating Progress in Low-and Middle-income Countries. Washington, DC: World Bank Publications. doi: 10.1596/978-1-4648-1345-0
Jia, C., and Jukes, D. (2013). The national food safety control system of China: a systematic review. Food Control 32, 236–245. doi: 10.1016/j.foodcont.2012.11.042
Jiang, L., Niu, H., Ru, Y., Tong, A., and Wang, Y. (2023). Can carbon finance promote high quality economic development: evidence from China. Heliyon 9:e23015. doi: 10.1016/j.heliyon.2023.e22698
Lam, H. M., Remais, J., Fung, M. C., Xu, L., and Sun, S. S. M. (2013). Food supply and food safety issues in China. Lancet 381, 2044–2053. doi: 10.1016/S0140-6736(13)60776-X
Li, Y., Chiu, Y. H., and Lin, T. Y. (2019). Research on new and traditional energy sources in OECD countries. Int. J. Environ. Res. Public Health 16:1122. doi: 10.3390/ijerph16071122
Liang, N., and Zhao, L. (2024). An Efficiency and coupling analysis of Chinese regional economic and environmental sustainability based on a super-SBM model and coupling coordination model. Sustainability 16:3818. doi: 10.3390/su16093818
Lin, Y. Y., Zeng, H., Li, G. C., and Ni, H. G. (2009). Economic development is ultimate determinant of food safety: a case study of China. Environ. Pollut. 158, 1185–1188. doi: 10.1016/j.envpol.2009.11.014
Liu, A., Hou, A., and Chai, L. (2024). Assessing human and environmental health in global diets from a perspective of economic growth. Sustain. Prod. Consum. 45, 306–315. doi: 10.1016/j.spc.2024.01.011
Liu, H., and Zhong, K. (2022). Relationship between health spending, life expectancy and renewable energy in China: a new evidence from the VECM approach. Front. Public Health 10:993546. doi: 10.3389/fpubh.2022.993546
Londong, J., Barth, M., and Söbke, H. (2021). Modeling and simulation of source separation in sanitation systems for reducing emissions of antimicrobial resistances. Water 13:3342. doi: 10.3390/w13233342
Lu, P., Wang, S., and Liu, H. (2020). Quantitative analysis of Chinese life expectancy and main factors. Gansu Med. J. 39, 74–78. doi: 10.15975/j.cnki.gsyy.2020.09.025
Malhotra, S. K., Vigneri, M., Cruz, N. A. O. D., MacDonald, H., and White, H. (2023). PROTOCOL: effectiveness of economic development interventions in humanitarian settings in low - and middle - income countries: a mixed - method systematic review. Campbell Syst. Rev. 19:e1357. doi: 10.1002/cl2.1357
Murray, C. J., and Lopez, A. D. (2003). Measuring the global burden of disease. Popul. Health Metr. 1, 1–15. doi: 10.1056/NEJMra1201534
Pacholczyk-Sienicka, B. (2024). Crimes against food: characteristics, health risk, and regulations. Food Energy Secur. 13:e70002. doi: 10.1002/fes3.70002
Pires, S. M., Thomsen, S. T., Nauta, M., Poulsen, M., and Jakobsen, L. S. (2020). Food safety implications of transitions toward sustainable healthy diets. Food Nutr. Bull. 41, 104S−124S. doi: 10.1177/0379572120953047
Preston, S. H. (1985). Mortality and development revisited. Popul. Bull. UN. 18, 34–40. doi: 10.1080/00963402.1985.11455888
Ruiz-Capillas, C., and Herrero, A. M. (2019). Impact of biogenic amines on food quality and safety. Foods 8:62. doi: 10.3390/foods8020062
Rutherford, M. E., Mulholland, K., and Hill, P. C. (2010). How access to health care relates to under-five mortality in sub-saharan Africa: systematic review. Trop. Med. Int. Health 15, 508–519. doi: 10.1111/j.1365-3156.2010.02497.x
Sayem, A., Md Zahid, H., Mary, M., Farzana, D., Mohammad Wahid, A., Md Mehedi, H., et al. (2019). Measuring the efficiency of health systems in asia: a data envelopment analysis. BMJ Open 9:e022155. doi: 10.1136/bmjopen-2018-022155
Schönfeldt, H. C., Hall, N., and Pretorius, B. (2018). The important role of food composition in policies and programmes for better public health: a South African case study. Food Chem. 238, 94–100. doi: 10.1016/j.foodchem.2016.12.067
Shi, Z., Huang, H., Chiu, Y.-H., Zhang, B., and Zhang, C. (2021). Linkage analysis of water resources, wastewater pollution, and health for regional sustainable development-using undesirable three-stage dynamic data envelopment analysis. Environ. Sci. Pollut. Res. 28, 19325–19350. doi: 10.1007/s11356-020-12067-2
Sun, F., Li, P., Wu, G., He, F., Liu, S., Shen, Y., et al. (2024). Carbon nanomaterials-based smart dual-mode sensors for colorimetric and fluorescence detection of foodborne hazards. Trends Food Sci. Technol. 147:104681. doi: 10.1016/j.tifs.2024.104681
Tone, K., and Tsutsui, M. (2009). Network DEA: a slacks-based measure approach. Eur. J. Oper. Res. 197, 243–252. doi: 10.1016/j.ejor.2008.05.027
Tone, K., and Tsutsui, M. (2014). Dynamic DEA with network structure: a slacks-based measure approach. Omega 42, 124–131. doi: 10.1016/j.omega.2013.04.002
Top, M., Konca, M., and Sapaz, B. (2020). Technical efficiency of healthcare systems in African countries: an application based on data envelopment analysis. Health Policy Technol. 9, 62–68. doi: 10.1016/j.hlpt.2019.11.010
Vipham, J. L., Amenu, K., Alonso, S., Ndahetuye, J. B., Zereyesus, Y., Nishimwe, K., et al. (2020). No food security without food safety: lessons from livestock related research. Glob. Food Sec. 26:100382. doi: 10.1016/j.gfs.2020.100382
Wang, T. H., and Lu, J. (2022). Does advanced human capital structure provide positive feedback on public health? Evidence from China. Front. Public Health 10:829716. doi: 10.3389/fpubh.2022.829716
Wang, Z., He, H., Liu, X., Wei, H., Feng, Q., and Wei, B. (2023). Health resource allocation in Western China from 2014 to 2018. Arch. Public Health 81:30. doi: 10.1186/s13690-023-01046-x
Wilson, N. (2003). “A review of empirical studies of the trade and economic effects of food-safety regulation,” in Food Safety Regulation in the European Union and the United States: Different Cultures, Different Laws, eds. P. Westerman and F. Billé (Dordrecht: Kluwer Academic Publishers).
Wu, W., Zhang, A., van Klinken, R. D., Schrobback, P., and Muller, J. M. (2021). Consumer trust in food and the food system: a critical review. Foods 10:2490. doi: 10.3390/foods10102490
Xiong, J., and Xu, D. (2021). Relationship between energy consumption, economic growth, and environmental pollution in China. Environ. Res. 194:110718. doi: 10.1016/j.envres.2021.110718
Yan, D., Wu, S., Zhou, S., Li, F., and Wang, Y. (2021). Healthy city development for Chinese cities under dramatic imbalance: evidence from 258 cities. Sustain. Cities Soc. 74:103157. doi: 10.1016/j.scs.2021.103157
Yin, S. J., Wang, J. B., and Wu, L. H. (2021). Does the food safety risk kuznets curve exist. evidence from the provincial food safety incidents reported on the internet. China Business Marketing 35, 3−15.
Zhang, R., Wei, Q., Li, A., and Chen, S. (2022). A new intermediate network data envelopment analysis model for evaluating China's sustainability. J. Clean. Prod. 356:131845. doi: 10.1016/j.jclepro.2022.131845
Zhang, X., Han, H., Chen, Y., Li, X., and Luo, G. (2021). A Study on the characteristics and influencing factors of hospital spatial distribution in China. J. Zhejiang Univ. 48, 84–92. doi: 10.3785/j.issn.1008-9497.2021.01.012
Zhao, F., Yang, L., Feng, Q., Ji, C., Li, M., Fang, L., et al. (2024). Regional disparities and social-ecological constraints of soil antibiotic pollution in urban agglomerations of China. Progress in Physical Geography: Earth and Environment 48, 536–550. doi: 10.1177/03091333241263796
Zhou, P., Ang, B. W., and Poh, K. L. (2006). Slacks-based efficiency measures for modeling environmental performance. Ecological Economics 60, 111–118. doi: 10.1016/j.ecolecon.2005.12.001
Zhou, P., Poh, K. L., and Ang, B. W. (2007). A non-radial DEA approach to measuring environmental performance. Eur. J. Oper. Res. 178, 1–9. doi: 10.1016/j.ejor.2006.04.038
Keywords: economic development, food safety, health production, efficiency analysis, DNSBM model
Citation: Teng M, Wei H and Tao Q (2025) Dynamic relationship among China's economic development, food safety and health production from a global perspective. Front. Sustain. Food Syst. 9:1629967. doi: 10.3389/fsufs.2025.1629967
Received: 23 May 2025; Accepted: 27 June 2025;
Published: 18 July 2025.
Edited by:
Abdelaziz Ed-Dra, Université Sultan Moulay Slimane, MoroccoReviewed by:
Yingjie Dai, Northeast Agricultural University, ChinaJózef Ober, Silesian University of Technology, Poland
Copyright © 2025 Teng, Wei and Tao. This is an open-access article distributed under the terms of the Creative Commons Attribution License (CC BY). The use, distribution or reproduction in other forums is permitted, provided the original author(s) and the copyright owner(s) are credited and that the original publication in this journal is cited, in accordance with accepted academic practice. No use, distribution or reproduction is permitted which does not comply with these terms.
*Correspondence: Hua Wei, MTI4NDY1ODU2M0BxcS5jb20=