 Yun Song1
 Kai-Hua Wang
- 1International Business School, Qingdao Huanghai University, Qingdao, China
- 2School of Economics, Qingdao University, Qingdao, China
- 3Department of Humanities and Tourism, Rizhao Polytechnic, Rizhao, China
- 4Department of Finance, Business Information Systems and Modelling, Faculty of Economics and Business Administration, West University of Timisoara, Timisoara, Romania
This study investigates spillovers among agricultural commodity future price (AFP), crude oil price (COP), and economic policy uncertainty (EPU) from China perspective, using quantile connectedness method. The empirical findings indicate that AFP, COP, and EPU exhibit significantly elevated volatility connectedness at extreme quantiles compared to median levels, revealing intensified cross-market contagion during economic uncertainty and tail events. Moreover, the dynamic characteristics of AFP, COP, and EPU are empirically validated, while historical crises are shown to amplify these spillover mechanisms substantially. The key innovation lies in integrating EPU within the COP-AFP analytical paradigm, where dynamic quantile shifts capture their interdependencies across market conditions, thereby expanding the theoretical scope. Thus, this research further provides policies, such as agricultural market monitoring mechanism and international economic cooperation, for multiple market participants.
1 Introduction
Crude oil is regarded as one crucial natural resource in economic activities, people’s daily lives, and social development (Wang et al., 2023; Alsharif, 2024), thus its price volatility attracts significant concern (Tunc et al., 2022; Wang K. H. et al., 2022; Jiang et al., 2018). For example, in January 2020, crude oil prices (COP) peaked at $63.67 per barrel, plummeted to $26.64 by April, and surged to $112.46 in March 2022. The huge price fluctuation not only affects the prices of agricultural production materials like fertilizers, but also impacts the transportation costs of agricultural products (Zakaria et al., 2021; Benlagha and Abdelmalek, 2024). That further transmits to agricultural commodity price, such as soybean price increased sharply from $843.03 per ton to $1557.19, and then decreased to $1242.83 per ton within 2021. The continual fluctuations of agricultural commodity prices have greatly weakened the security of the world’s food security, and economic and social stability (de Araujo et al., 2020; Amolegbe et al., 2021; Bossman et al., 2023). Thus, countries have to adjust their economic policies to cope with the huge price volatility of oil and agricultural commodity, which exacerbated economic policy uncertainty (EPU) (Wen et al., 2021; Tunc et al., 2022; Shahbaz et al., 2023). Especially, in the context of global market integration and commodity market financialization, especially during COVID-19, the international economic situation was changeable and EPU fluctuated greatly (Beyer et al., 2023; Li S. et al., 2024). This situation has enhanced information spillover and the risk transmission between the markets for oil and agricultural commodities, which has led to price movements that are more volatile (Zhou et al., 2022). Therefore, we consider EPU when discussing the connection between COP and agricultural commodity futures price (AFP), with a view to achieving results that are more comprehensive. This study is of great significance for business cycle analyses, policy formulation and risk management.
The current literatures widely discuss the pairwise relationship among oil price (COP), economic policy uncertainty (EPU), and agricultural commodity market. Firstly, the literatures commonly argued that EPU have an obvious impact on the market for agricultural commodities (Frimpong et al., 2021; Hu et al., 2023), and this relationship may be nonlinear (Long et al., 2023; Bossman et al., 2023). Some special papers concern China, and argue China’s EPU on agricultural commodity market is asymmetric (Feng et al., 2022), term-dependent (Wu et al., 2023), and heterogeneity of agricultural commodities (Jiang et al., 2023). Secondly, the literatures widely discussed the COP and agricultural commodity market. On one hand, the COP and agricultural commodity market are tightly related (Tiwari et al., 2022; Zeng et al., 2024), and this link asymmetric and time-varying (Hung, 2021; Wang et al., 2023; Sun et al., 2023). One the other hand, some studies hold that the relationship is not observed in global world (Qiu et al., 2012; Reboredo, 2012), and in certain countries such as South African and China (Fowowe, 2016; Luo and Ji, 2018). Thirdly, the literatures extensively investigate the bidirectional relationship between EPU and COP. The first research stream argue that COP owns significant effect on the EPU (Rehman, 2018), but this effect may be positively (Wang et al., 2022a) or negatively (Shahbaz et al., 2023). The second research stream indicate that EPU’s influence on the COP is obvious (Apostolakis et al., 2021; Zhang et al., 2023), and term-dependent (Sun et al., 2020; Wang et al., 2022b; Wang et al., 2023). To sum up, the current literatures initially discussed EPU, COP and agricultural commodities markets, but some research gaps need to be addressed as following: (1) The previous literatures focus on pairwise relationships, and lack a unified framework that incorporates these variables through influencing mechanism. (2) Linear relationship among variables is commonly utilized that is not fully conform to reality, thus nonlinear discussion is necessary. (3) China is one of most important participants in global oil and agricultural market, but few studies link China’s EPU with these two markets, thus lack of policy reference significance.
China is a rising economy, and the associated characteristics make it a fascinating subject for study. First, China confronts obvious uncertainties of economic policies. The Sino-US trade dispute, EU anti-dumping investigation, and other trade protectionism make China confront serious external economic environment, and causes it frequently adjust economic policies (Wang and Shi, 2022; Afonso et al., 2024). In addition, China’s economic growth has slowed recently, and the country has experienced problems associated with a deep-seated structural imbalance (Dai and Peng, 2022; Li R. et al., 2024), thus new round of reforms such as speed change and structural optimization, are carried out, which exacerbated the uncertainties of economic policy. Second, China is having trouble with the world oil market. China’s oil production is limited, and rapid economic growth has driven a rapid increase in crude oil demand (Zaghdoudi et al., 2023; Pan et al., 2024; Wang et al., 2025a). It has turned into the biggest net crude oil importer worldwide since 2013. In 2020, it imported 542.39 million tons of oil and depended upon crude oil imports for more than 73% of its total oil usage (Long and Zhang, 2022). Furthermore, China is in a delicate situation since it lacks the ability to actively control the price of crude oil and can only passively accept variations in that price (Yan and Cheung, 2024; Wang X. et al., 2025). Third, China is a major importer of agricultural commodities. In 2019, the number of imported agricultural commodities reached 133.1 billion US dollars, surpassing the European Union and the U.S., and becoming the world’s largest importer of agricultural commodities (Yu et al., 2023). From 2005 to 2020, China’s monthly agricultural imports grew from approximately 2 billion USD to more than 14 billion USD (Zhang et al., 2022). For example, the grain import volume has increased from 3.444 million tons to 65.376 million tons in 2021, with an average yearly growth of 15.9%. To sum up, China owns special features in oil market, economic policy agricultural commodity market, and EPU, which provides realistic basis for discussing these variables from China’s perspective.
Our paper has several marginal contributions. First, this paper establishes a unified theoretical analysis framework based on influencing mechanisms. Since no established theory that definitively explains the relationships among EPU, COP and agricultural commodity prices (Hu et al., 2023; Wang et al., 2023; Benlagha and Abdelmalek, 2024), we utilize production costs, market demand and other influencing mechanism to link them. We further discuss spillover at different market conditions (normal and extreme), and recognize time-varying response to significant events, which enriches the theoretical framework. Second, since literatures specially considers EPU for developed countries (Bossman et al., 2023; Alamah et al., 2024), this paper specially considers China, and discusses its EPU roles in global energy and agricultural market. China owns the largest population, occupies the second largest economic entity, and also the most important energy and agricultural products importer. Thus, China is relatively more vulnerable to international price volatility, and its economic policy uncertainty may opposite affect international commodity price. That can enrich researches related to China’s practical research, and further enhance theoretical research. Third, this paper is beneficial for exploring the spillover among different markets under different market condition and time that uses recently developed quantile-VAR spillover method, instead of single time aspect (Shahbaz et al., 2023; Che et al., 2024). That can provide ideas for policy-makers to adopt a set of practical policy tools to maintain price stability. Investors and other stakeholders can better manage risk exposure and create portfolio strategies to prevent unforeseen future losses by having a better understanding of the mechanics of market volatility spillovers.
This article assesses the volatility spillovers among China’s economic policy uncertainty, oil price, and agricultural commodity prices from 2005: M01 to 2022: M04, using a quantile connectedness approach. The main empirical result is that EPU is much more strongly correlated with other variables under extreme conditions than it is under normal conditions. In turbulent periods, EPU, corn prices and cotton prices are the most interconnected, and the COP is closely related to the prices of all agricultural commodities. Meanwhile, under the normal market, the COP is most closely related to soybean prices, and under the positive market, the COP is most closely related to wheat prices. Furthermore, the time-varying characteristics of variables are confirmed and major crisis events intensify the spillover effect. We find that in extreme markets, variables frequently switch roles between transmitter and receiver. Meanwhile in a normal state, EPU is the obvious receiver.
The paper is structured as below. Section 2 offers an overview of the pertinent studies, and Section 3 establishes the theoretical framework. Section 4 discusses the research methods. The next section shows the data sources and descriptions. Section 6 consists of the empirical findings and related discussion. Section 7 provides concluding remarks and policies.
2 Literature review
2.1 EPU and agricultural commodities
A substantial corpus of the literature investigates how EPU affects agricultural commodities. Wang et al. (2017) indicated that trade policy, dollar depreciation and the financial crisis events that triggered the EPU increase are have an increasing impact on global agricultural product prices. Czudaj (2020) showed that time-dependent uncertainty affects trader expectations in agricultural futures markets. Frimpong et al. (2021) found that global EPU is the driving factor for the fluctuation in agricultural commodities prices and poses risks to the stability of agricultural markets. Long et al. (2023) confirmed that the impacts of global EPU on agricultural commodity prices are long-term asymmetric and positively correlated. Platania et al. (2022) discovered that the public’s high attention to EPU intensifies the impact of social media activities, thus triggering a deeper reaction to the agricultural commodity market. Bossman et al. (2023) showed that agricultural commodities primarily serve as diversifiers of the effects of EPU and only show limited hedging capabilities against the downside risks generated by the USEPU. Differently, Alamah et al. (2024) point out that wheat price variations are not consistently predicted by changes in the U.S. EPU.
Some studies on EPU and agricultural commodities are related to China. Xiao et al. (2019) found that wheat prices are less affected by China’s EPU than are corn and soybean prices. Zhu et al. (2020) indicated that domestic EPU has a considerable adverse effect on the return rate of agricultural product futures in bear markets. Li and Li (2021) verified that the EPU of China significantly harms the sustainability of its net agricultural product imports. Wen et al. (2021) showed that in the medium term, the negative impact of EPU on China’s grain prices outweighs the favorable benefit. Feng et al. (2022) proved that between agricultural futures prices and EPU in the U. S. and China, there is anti-persistent and asymmetric multifractal cross-correlation. Wu et al. (2023) indicated that commodities, geopolitical risk, and EPU are more closely related over the long run than they are over the short term.
2.2 COP and agricultural commodities
The relationship between crude oil prices and agricultural commodities markets has been the subject of numerous research. Aynur (2013) showed that the causalities between the Brent COP and the agricultural commodity price is bidirectional in the long term. Lucotte (2016) and Mensi et al. (2017) indicated that the COP influence on agricultural commodity prices has increased since the 2006 food crisis. Su et al. (2019) confirmed that the prices of oil and agricultural commodities are positively correlated, time-varying, and causally related. Dahl et al. (2020) showed that during times of economic unrest, the two-way spillover and asymmetric information flow between crude oil and agricultural commodity futures become more intense. Hung (2021) showed that the spillover of agricultural commodities to the COP varies significantly over time, with the price spillover impact being especially visible during the COVID-19 crisis. Tiwari et al. (2022) observed that the agricultural commodity price is extremely susceptible to the impact of the oil market. Zeng et al. (2024) indicated that for the main agricultural commodity indices, crude oil volatility primarily acts as a net recipient of risk spillover effects.
Conversely, some studies do not support the above view. Qiu et al. (2012) noted that prices of agricultural products are mostly determined by market supply and demand, not the COP. Reboredo (2012) provided evidence of a limited tail reliance, which implies that high oil price volatility has minimal impact on agriculture markets. Gardebroek and Hernandez (2013) assessed the interdependence of the oil, ethanol and corn markets and found no volatility effect of oil price on the corn market. Fowowe (2016) confirmed that COP and agricultural product prices in South African countries do not correlate in the short or long term. Luo and Ji (2018) demonstrated that the volatility spillover impact between the US COP and China’s agricultural commodities prices is exceedingly low. Naeem et al. (2022) showed that oil was a safe haven for metals and agricultural commodities before the global financial crisis (GFC), but it lost this ability during the GFC.
2.3 Crude oil price and EPU
Related studies have investigated the linkage between EPU and COP. The first aspect is the research on the COP influence on EPU. Kang and Ratti (2013) reported that EPU is negatively impacted by the COP increase brought on by shifts in the oil market’s demand. Rehman (2018) showed that The EPU of Spain, Japan, and India is significantly impacted by the worldwide COP shock. Hailemariam et al. (2019) demonstrated that crude oil prices rose EPU following the global financial crisis. Wang et al. (2022a) found that the COP has varying EPU effects on various BRICS countries, and the COP fluctuation significantly and positively affects only India’s EPU in the long term. Shahbaz et al. (2023) showed that the long-run linkage between oil prices and EPU is positive in Australia, negative in the U.S., and insignificant in Singapore.
The second aspect concerns the study of EPU’s influence on the COP. Aloui et al. (2016) indicated that only during the Great Recession and the financial crisis did higher EPU significantly increase crude oil returns. Apostolakis et al. (2021) demonstrated that crude oil prices are net recipients of EPU shock spillovers. Wang et al. (2022b) found that short-term fluctuations in the COP are caused by uncertainties in global economic policy, but long-term changes are more crucial. Some studies have also shown an interaction between them. Antonakakis et al. (2014) found that the impact between COP fluctuations and EPU have a mutually negative reaction. Sun et al. (2020) indicated that in the short term, the linkage between EPU and the COP is weak, but it gradually grows with time. Tunc et al. (2022) showed that the mutual effect of oil prices and EPU is not invariant but changes with time. Zhang et al. (2023) indicated that the EPU index is a useful tool for predicting volatility in the crude oil market.
Large number of the existing researches commonly focus on paired relationship of EPU and agricultural commodities (Frimpong et al., 2021; Long et al., 2023; Alamah et al., 2024), COP and agricultural commodities (Umar et al., 2021; Tiwari et al., 2022; Zeng et al., 2024), and EPU and the COP (Sun et al., 2020; Shahzad et al., 2021a, 2021b; Shahbaz et al., 2023), which lacks of a unified theoretical framework. Besides, the researches also ignored the difference between the extreme conditions and the normal state, paying little attention to the information contagion effect among the three variables. In order to address the mentioned issue, this paper tries to establish a theoretical framework for these variables through influencing mechanisms, and provides theoretical support for following empirical analysis. In addition, we utilize quantile connectedness to comprehensively analyze dynamic spillover and connectedness among EPU, the COP and the agricultural commodities price under different conditions and periods. Doing so can provide directional strategies for stabilizing commodity prices, and formulating appropriate economic policies.
3 Theoretical framework
This section provides detailed theoretical framework, containing economic policy uncertainty (EPU), agricultural commodities prices (AFP) and crude oil price (COP), and their impact paths are visualized in Figure 1.
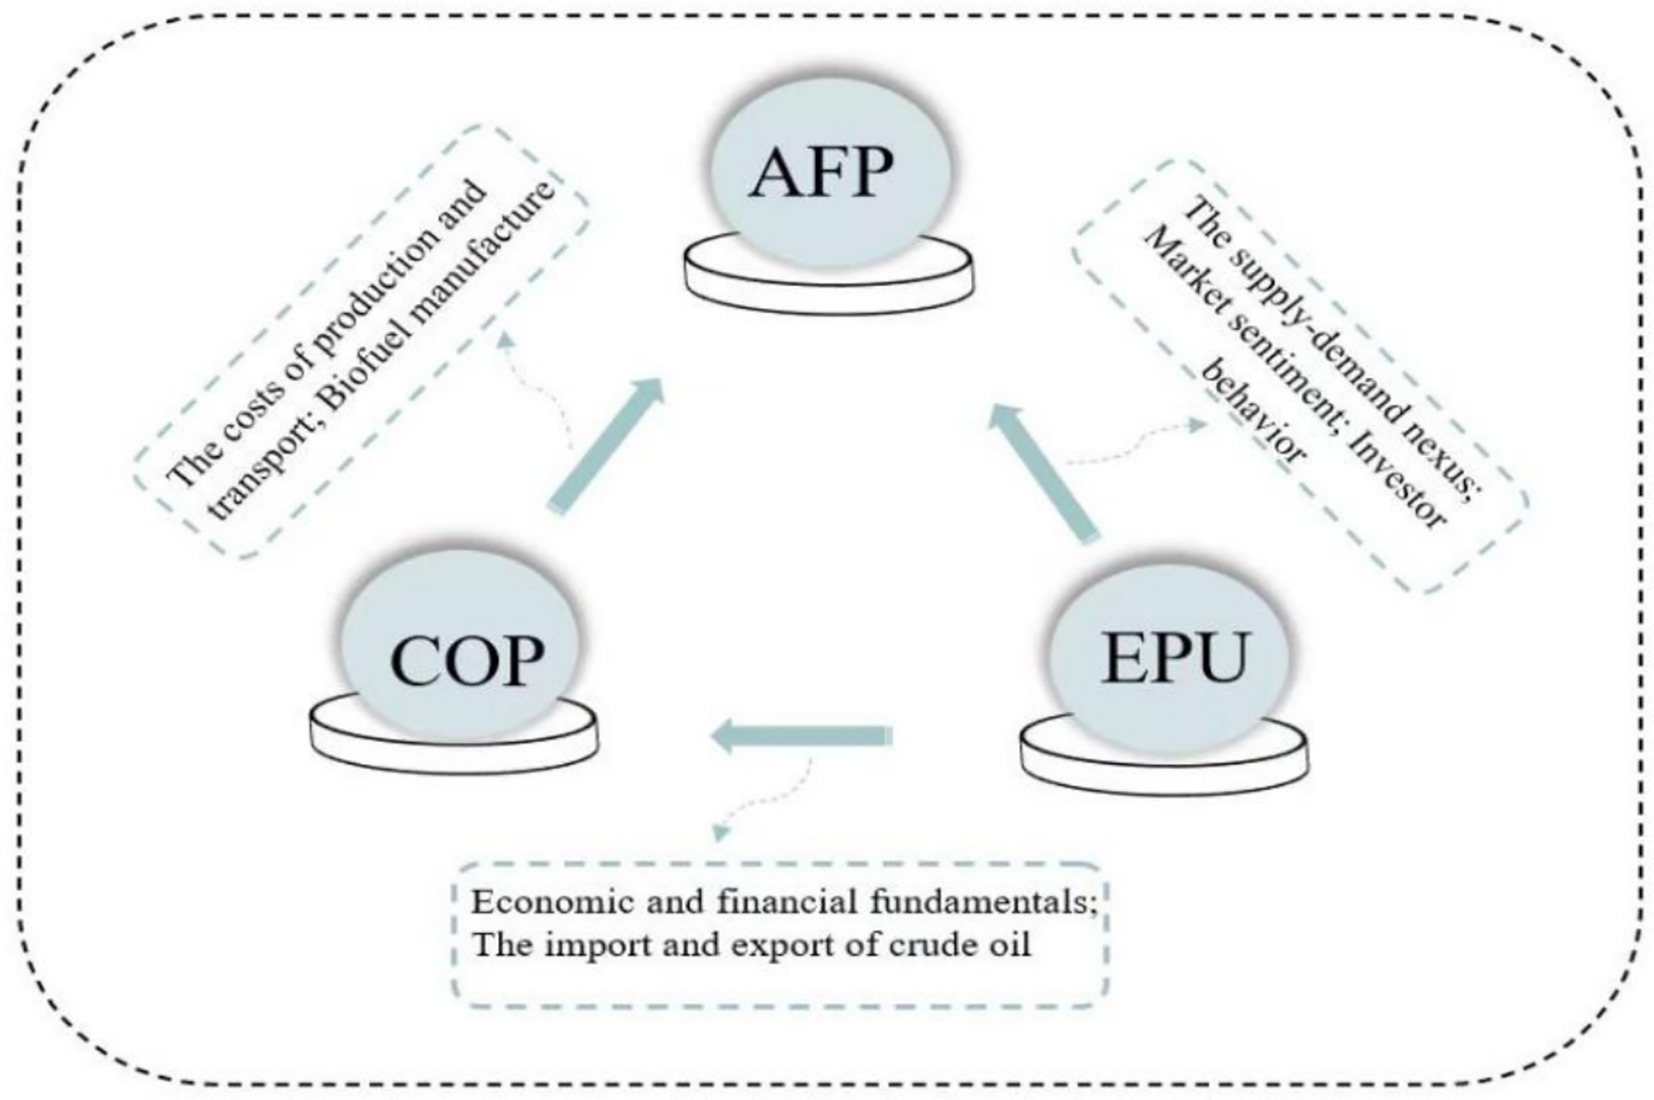
Figure 1. The influencing mechanism among COP, AFP, and EPU.
The first influencing mechanism is for EPU and AFP. First, the EPU would change the supply–demand nexus of the agricultural commodity. Generally, high EPU is associated with economic risk, agricultural-exporting nations decreased their exports to protect their domestic food security, which decreased the availability of agricultural products on the global market (Long et al., 2023; Su et al., 2023). Oppositely, the economic and food concern makes agricultural-importing countries import more agricultural products for stockpiles (Long et al., 2023). Therefore, the limited supply and increased demand will cause prices of agricultural commodity to rise. Second, EPU would affect the psychological expectations of market participants. If the policy information is not completely effective, the EPU degree will be amplified, leading to some unpredictable behaviors (Bagh et al., 2024a), such as delay investment and consumption, which directly affect agricultural commodity market, and further cause AFP fluctuations (Bakas and Triantafyllou, 2018; Li et al., 2023). Third, EPU would affect investment portfolios, resulting in price fluctuations. Commodity futures are utilized as safe havens and hedges in portfolios to decrease risks in high EPU environments (Ren et al., 2022; Xiang and Borjigin, 2024). In general, shocks from policy uncertainty increase chance of bad events and lower returns, prompting stakeholders to seek a risk premium, which ultimately influences market sentiment and investor behavior, leading to price fluctuations (Li et al., 2023). Thus, this paper presents the following Hypothesis:
Hypothesis 1: EPU would exacerbate fluctuations of the AFP through demand shocks, psychological expectations and investment portfolios.
The second influencing mechanism is related to the COP and AFP. First, COP would change agricultural costs in production and transport. The rising COP raises the cost of many energy-intensive inputs, such as fertilizers and agricultural equipment, thus pushing up the production cost and ultimately leading to increased agricultural commodity prices (Raza et al., 2022; Trari-Medjaoui and Mezouri, 2024). For instance, early in 2008, the price of crude oil saw a sharp increase, which had a ripple effect on other important agricultural commodities and caused their prices to revert (Mensi et al., 2025). Second, COP changes would affect the use of biofuels as a substitute. Environmental issues obtain increasing attention (Bagh et al., 2024b), the COP would affect biofuel manufacture (Mokni and Ben-Salha, 2020), and biofuels are extracted mainly from agricultural commodities such as soybean and corn (Wang E. Z. et al., 2022). In particular, rising oil prices may increase demand for the vegetable, sugarcane, and maize oils needed to make biodiesel and ethanol, which would raise their costs (Wei et al., 2024). Consequently, due to oil price volatility, a substantial amount of land is re-allocated for biofuels, which inevitably influences AFP (Tiwari et al., 2022). Thus, this paper offers the following Hypothesis:
Hypothesis 2: COP would intensify volatility of the AFP through affecting costs of agricultural inputs and biofuels utilization.
The third influencing mechanism is related to the EPU and COP. First, EPU would affect economic and financial fundamentals. The stable EPU is generally accompanied by economic expansion, the increase in production activities raises the crude oil demand and affects the COP (Liu F. et al., 2023). Furthermore, as oil market financialization is becoming the core factor determining the COP, EPU influences the COP by changing the behaviors of financial market participants (Ma et al., 2019). Second, EPU would affect decision-making in crude oil imports and exports. EPU contains information about many sources of uncertainty, including trade conflicts, financial crises and geopolitical risks (Wu et al., 2023). The EUP increase caused by such sources may hinder the import and export of crude oil and thus affect the COP. Conversely, drastic COP fluctuations can influence EPU. COP fluctuations cause changes in inflation, prices, manufacturing costs, investment, and consumption (Liu X. et al., 2023). These issues require policy-makers to implement new economic policies, leading to higher EPU. Therefore, this paper provides the following hypotheses:
Hypothesis 3: EPU would amplify variations of the COP through affecting macroeconomy and decision-making of oil import and export.
4 Quantile vector-autoregressive (QVAR) connectedness method
In this study, we utilize quantile connectedness methodology to capture the spillover connectedness among variables across different quantiles. We first define basic QVAR model in following Equation 1:
where depicts n × 1 dimensional dependent variable vectors, and n represents the number of variables. is the quantile, and ranges from 0 to 1. Generally, the quantiles between 0.1 and 0.9, with 0.1 separating each quantile, are the main emphasis. is an n × 1 dimensional vector of intercepts. The lag length of p is determined by Akaike Information Criterion (AIC). represents the n × n parameter matrix at quantile . represents the n × 1 dimensional regression residual vectors at quantile .
The QVAR model was then rewritten as a moving average representation to start the quantile forecast error variance decomposition, which is shown in Equation 2:
Where refers to the set of information that can be used at time t - 1, with being an n × n identity matrix and for i < 0.
Then, we will conduct a generalized forecast error variance decomposition (GFEVD) procedure to calculate the degree of influence one variable has on another. As a result, the H-step-ahead GFEVD can be expressed mathematically as:
Where quantifies the impact of the k th idiosyncratic shock, , to the H-step-ahead forecast error variance of the j th variable. For brevity, we denote this as . Subsequently, Equation 3 can be expressed as:
By construction, it holds that and . Using Equation 4, the connectedness index is defined as Equations 5–8:
Where represents the total connectedness index at the quantile, capturing the overall level of interdependence across all assets. reflects the outward connectedness of asset j, measuring the extent to which shocks originating from this asset propagate to others. Conversely, assesses the inward connectedness of asset i, indicating how much it is affected by shocks from others. , which evaluates the net effect of an asset within the system. In contrast to a negative value, which indicates the asset is the net recipient of the shock from the system, a positive net value indicates the asset is the net transmitter of the shock.
This method extends the mean-based vector-autoregression (VAR) method of Diebold and Yilmaz (2012) and Diebold and Yılmaz (2014), and examines spillover effects under different quantiles to deal with normal and extreme market conditions (Hoque et al., 2024). This approach provides a flexible framework and successfully depicts the various impacts of tail events and tail dependence between variables in various quantiles (Samarakoon and Pradhan, 2026; Wang et al., 2024). It thereby enables the analysis of non-linear shock propagation and asymmetrical mutual influences under various market scenarios (Bulut and Marangoz, 2025). The QVAR connectedness method has widely utilized in energy market uncertainty (Zhou et al., 2025), digital assets (Alnafisah et al., 2025), carbon markets (Bouteska et al., 2025) and other fields. As a result, the quantile spillover approach offers our study a strong instrument to investigate the complex connections between various marketplaces.
5 Data sources and description
Our sample ranges from 2005: M01 to 2022: M04. This paper selects the monthly data of three variables: economic policy uncertainty (EPU), the crude oil price (COP) and the agricultural commodities future price (AFP). In 2005, China started using a managed floating exchange rate regime, which caused the RMB to steadily appreciate. In addition, EPU has surged as a result of some Chinese events, including the 2009 fiscal plan worth $4 trillion, the 2015 stock market crash, and the 2018 Trade War. The time span of the data also includes major international events such as the COVID-19, Sino–US trade friction, the European sovereign debt crisis, and the global financial crisis. The first variable is China’s economic policy uncertainty (EPU). The EPU index was first created by Baker et al. (2016) and can be found at http://www.policyuncertainty.com. The index is widely used in Wen et al. (2021) and Zhu et al. (2022). The crude oil price (COP) is the second variable. Following Hau et al. (2020) and Dai P. F. et al. (2022), we utilize the Brent crude oil futures price to reflect actual oil price volatility, and the raw data are collected from the Wind database. The third variable is the agricultural commodity futures price (AFP), including soybeans (SFP), corn (CFP), wheat (WFP) and cotton (COFP), which are sourced from the Chicago Board of Trade and the New York Futures Exchange. We select them to measure agricultural prices because many studies also do so (Kumar et al., 2021; Dai Y. S. et al., 2022). Table 1 indicates descriptive analysis for variables. Since the data must be stable and adhere to normality, the first-order difference of logarithm is taken for all variables (Wang et al., 2025b).
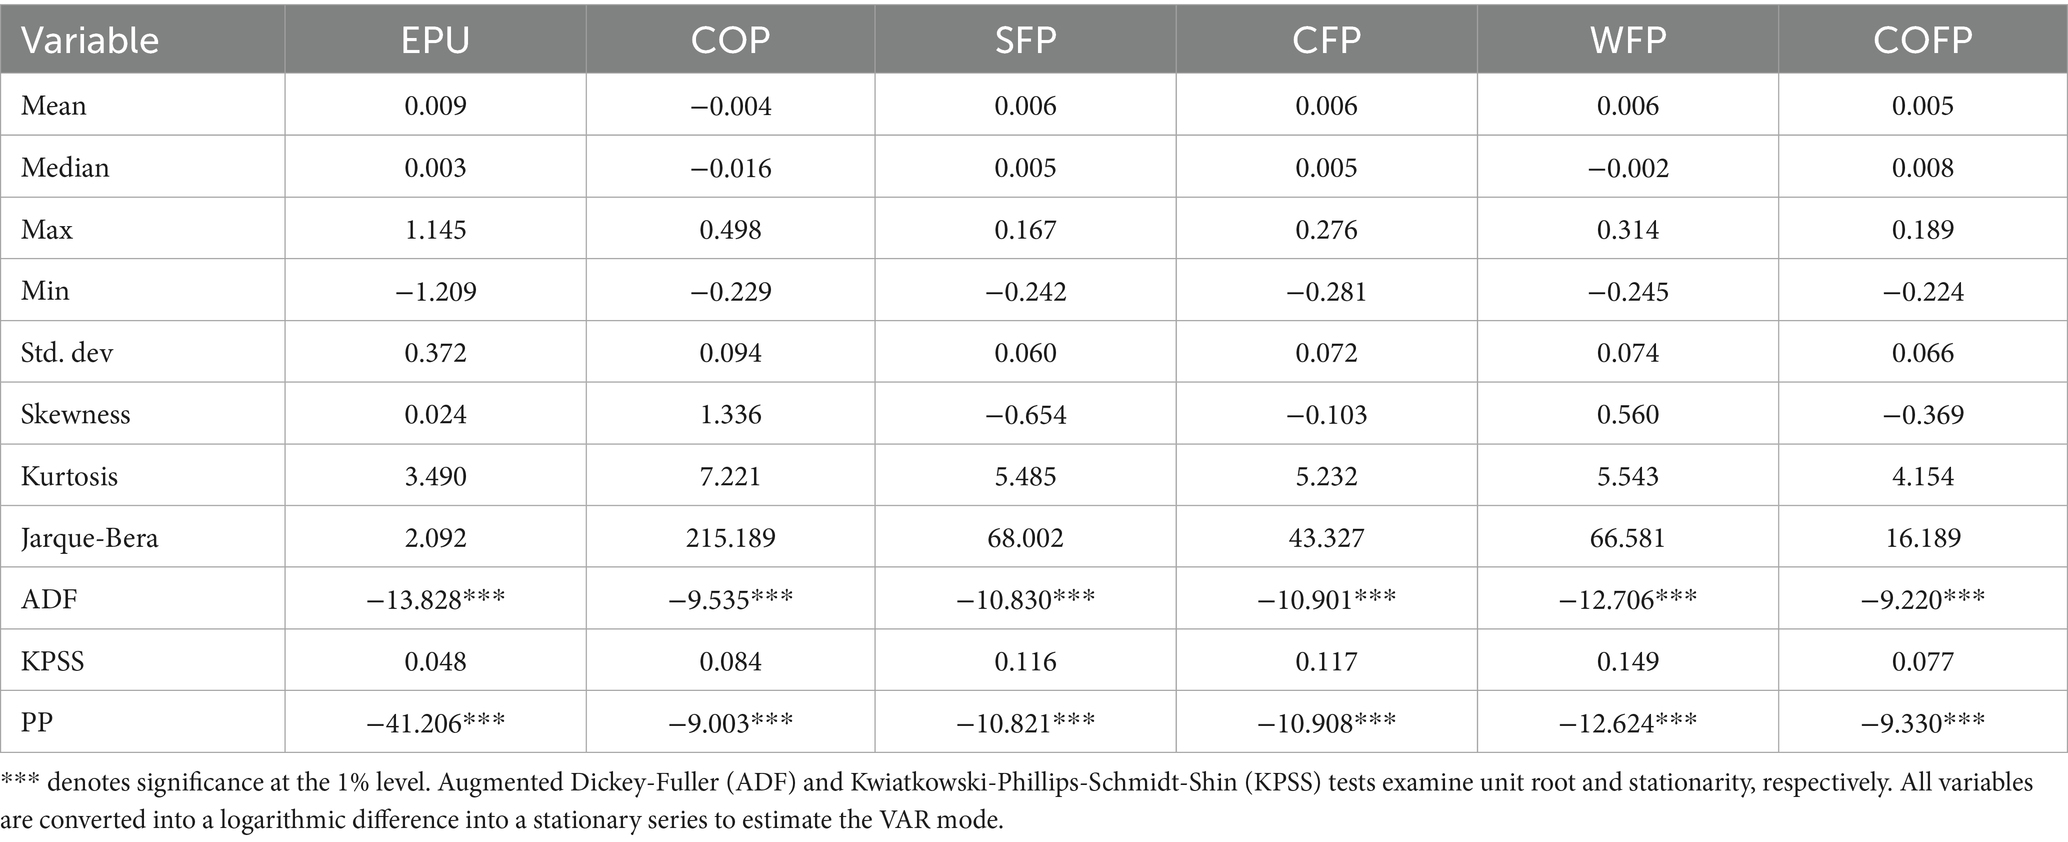
Table 1. Descriptive statistics and unit root test.
According to Table 1, the COFP had the lowest average value, and the average SFP, CFP and WFP values were all 0.006 when considering only the agricultural commodity market. Compared to the other variables, the EPU’s standard deviation was higher at 0.372, indicating that it fluctuates more than the AFP and COP. Except for the WFP, all futures prices for agricultural commodities exhibited negative skewness, demonstrating that the distribution’s left side’s tail is fatter than its right. The kurtosis of EPU, the COP and all agricultural commodity futures prices exceeded 3, proving the apparent leptokurtosis features of these variables. The Jarque–Bera test statistics revealed that the indicators followed a normal distribution at a significance level of 1%. Moreover, the results of the ADF and KPSS tests showed that all parameters were stationary, supporting the viability of adopting a vector autoregressive model for the analysis.
Figure 2 shows the fluctuation trend of EPU, the COP and the AFP. In 2005, China introduced a managed floating exchange-rate mechanism and a share-trading reform and the U.S. levied a punitive tax of 27.5% on its imports, thus increasing EPU. The global financial crisis in 2008 caused EPU first to increase and then to decrease. In January 2017, Donald Trump’s inauguration brought EPU to its peak. In 2018, Sino–US trade frictions intensified the EPU increase, bringing it to a new peak. In 2020, the COVID-19 pandemic promoted an uptick in EPU. EPU dramatically dropped with the onset of the post-pandemic era and the steady impact of China’s preventative and control measures. The COP shows a fluctuating trend and synchronizes with EPU at some time points. Affected by the financial crisis in 2008, the COP decreased significantly. From 2014 to the beginning of 2016, the COP fell precipitously as a result of developments like the shale oil revolution and the Russia-Ukraine conflict. At the beginning of 2020, owing to the COVID-19 epidemic and the conflict over energy prices, the COP experienced an unprecedented decrease. After April, as global public health events began to be controlled, OPEC tightened its control over oil production and the global economy recovered, the oil price gradually rebounded. The AFP fluctuated greatly overall. In 2006, extreme weather, the COP increase and the development of biofuels led to a sharp AFP increase. In 2008, affected by the global financial crisis, the AFP showed a significant downward trend. In 2010, extreme weather and trade protection policies led to a general increase in the AFP. In 2014, the global grain and soybean harvest, the strengthening US currency and the erratic growth of China’s economy caused the AFP to fall to the lowest level in recent years. After May 2020, the risk of global grain production reduction and trade chain disruption caused the AFP to gradually increase to a new peak.
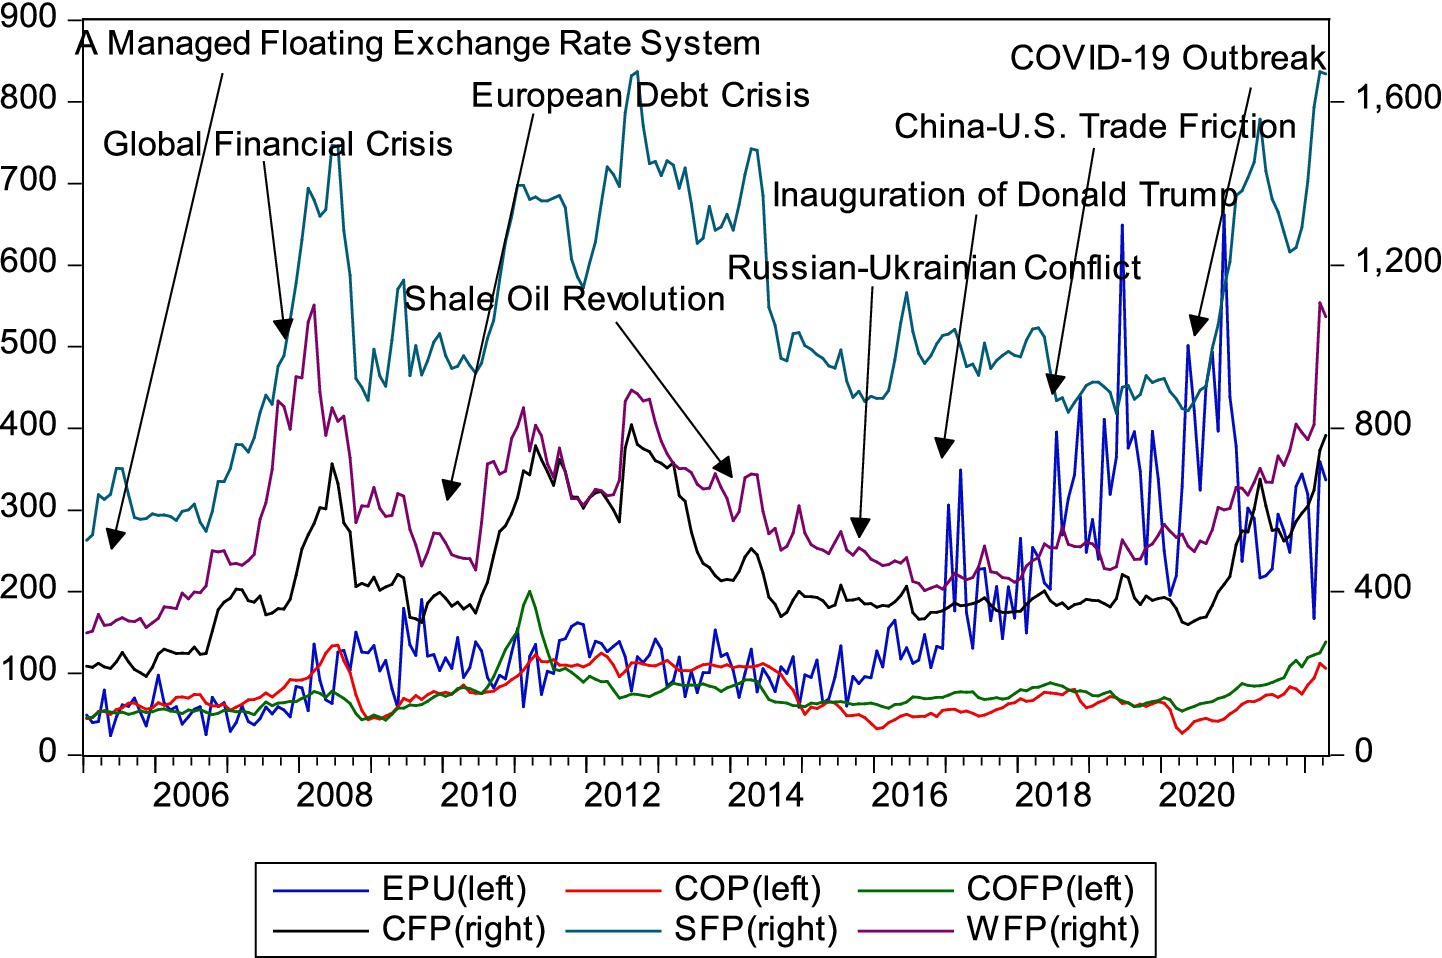
Figure 2. The trends of EPU, COP, and AFP.
6 Empirical analyses
The quantile VAR model in Equation (1) is used to construct a number of connectivity metrics. These consist of the total connectedness index (TCI) (Equation 5), directional TO (Equation 6), directional FROM (Equation 7), net connectedness index (NCI) (Equation 8) and pairwise connectedness index (TCI) (Equation 5).
6.1 Static analysis
The volatility spillovers TO and FROM are shown in Tables 2–4 for all variables at quantiles 0.5 (median), 0.1 (lower), and 0.9 (upper), respectively. When compared to the lower (67.5%) and upper quantiles (66.3%), the median quantile’s (37.5%) overall connectedness was significantly lower. The outcome is consistent with the concept that extreme quantile (distribution tails) volatility is more increased. This finding suggests that in extreme cases, the spillover connectedness among EPU, the COP and the AFP is tighter. Major crises, including the global financial crisis, the European debt crisis, Sino-US trade conflict, and the COVID-19, have occurred globally, and the contagion effect of the economy and commodity markets has continued to strengthen (Wang et al., 2023). For example, the COVID-19 affected the expectations and emotions of market participants, and lead to abrupt fluctuations in the commodity futures market (Guru et al., 2024). In addition, commodity prices, especially for basic commodities such as crude oil and agricultural commodities, can provide useful information for economic policy-making (Wang et al., 2021; Chen et al., 2024). In response to the sharp rise in agricultural prices, China abolished agricultural taxes, increased financial subsidies, and enhanced the application of emerging information technologies. Besides, China also develops ladder pricing mechanism, launches financial subsidies, optimize monetary policies such as establishing green finance system, for coping with oil price volatility (Jiang and Cheng, 2021). Therefore, under extreme conditions, the degree of the information spillover for EPU, the COP and the AFP is enhanced.
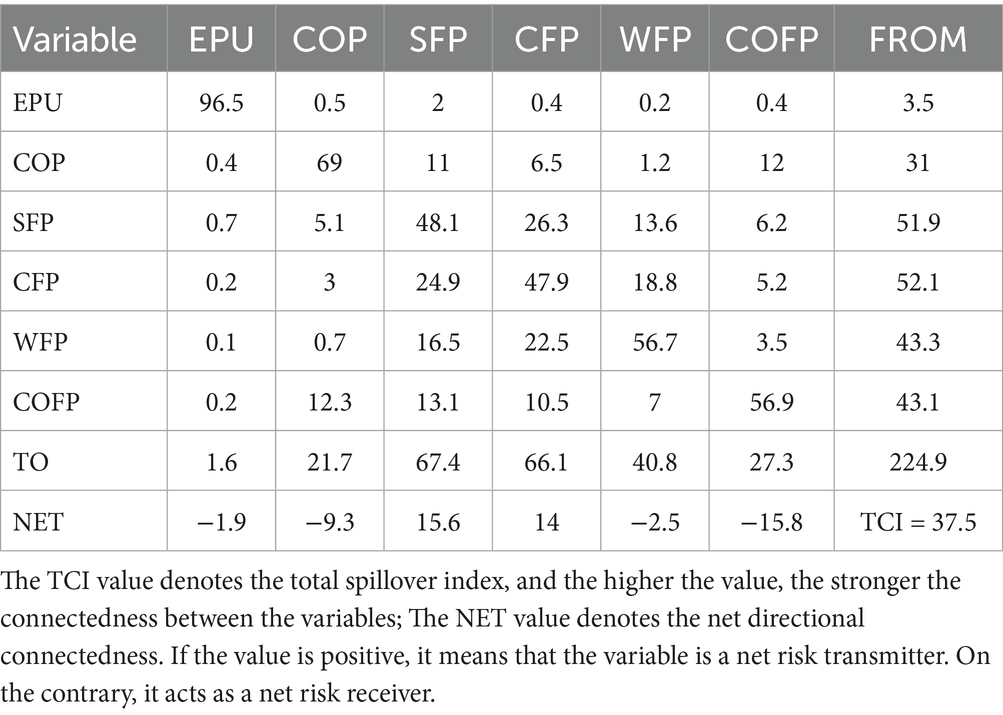
Table 2. Volatility spillovers estimated at the median quantile (τ = 0.5).
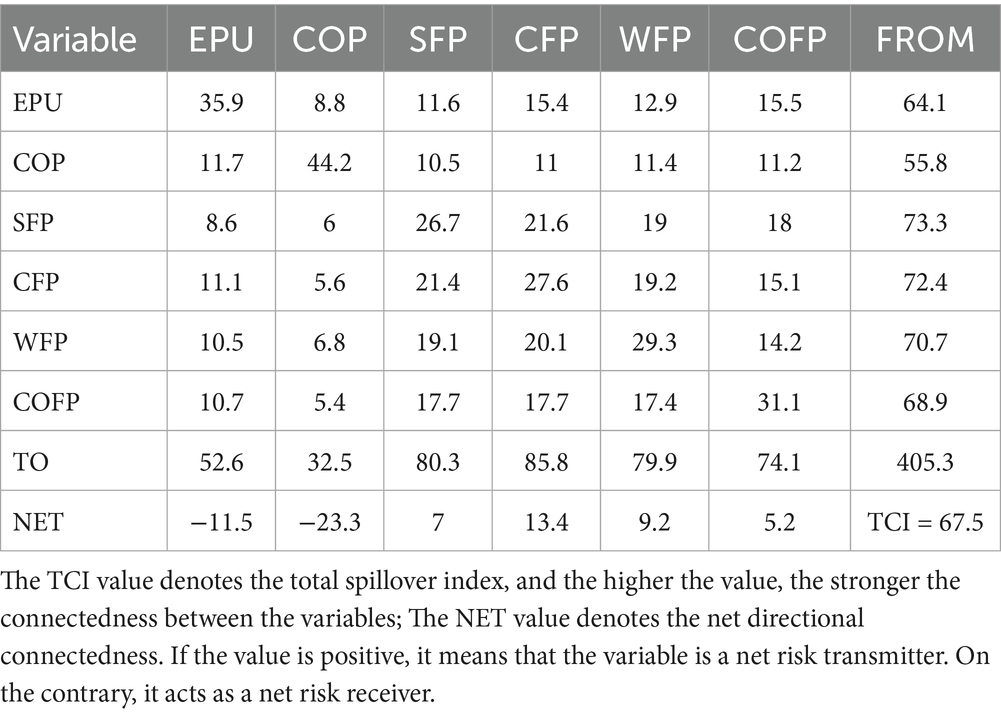
Table 3. Volatility spillovers estimated at the lower quantile (τ = 0.1).
Table 4. Volatility spillovers estimated at the higher quantile (τ = 0.9).
Furthermore, we found an interesting feature in which the sign of the net overflow for some variables changed when we switched between the quantiles. We use receivers and transmitters to describe the variable identities. Their economic significance is the amount of information that a variable receives or transmits to the markets of the other variables. For example, in the 0.1 and 0.9 quantiles, the WFP sent information, and in the 0.5 quantile, it accepted shocks. Information was received by the COFP in the upper and median quantiles, and it was transmitted in the lower quantile. The asymmetrical nature of the volatility connection between EPU, the COP, and the AFP is demonstrated by these findings. The net volatility spillovers for the remaining two agricultural commodities (CFP and SFP), EPU and the COP exhibited consistent behaviors across all conditional quantiles. EPU and the COP were recipients of a net overflow of information in all quantiles. Especially in an extremely negative market, price fluctuations in the agricultural market (SFP, CFP, WFP and COFP) affect EPU and the COP. Commodity prices can reflect real-time information on economic conditions and are an effective reference for making economic policies (Zhu et al., 2020). For example, the increasing oil price directly raise production and living costs, brings structural changes in an economy, which forces the government to adjust its economic policies (Diaz et al., 2024). Therefore, fluctuations in the price of agricultural commodities will transmit economic information to EPU. We also observed that both the SFP and the CFP were information transmitters at all three quantiles, and EPU was a net information receiver. The largest importer and consumer of soybeans worldwide is China, whose dependence on imports reached more than 80% in 2021 (Yao et al., 2020). Facing the SFP fluctuation, China formulated some new economic measures to balance the market for agricultural commodities. Therefore, the risk impact of the SFP on China’s EPU can be explained. In addition, the COFP was a strong receiver of information in the middle quantile. Therefore, in normal times, policy-makers and stakeholders are more concerned about COFP volatility.
The network diagram in Figure 3 plots separately the pairwise network–directional connectedness between all variables. The net connectedness was significantly higher at the low and high quantiles than it was at the median quantile. The line representing the connectedness in the low and high quantiles was thicker than were those in the middle quantile. For example, the connectedness of EPU, the COP and the AFP were darker in color in the corresponding network lines at the 0.1 and 0.5 quantiles, which indicates that the spillover linkages of the three markets were stronger in extreme environments. Therefore, from the perspective of network connectedness, the relationship between the variables in the quantiles was significantly different. We observed that EPU had little association with the other variables in the 0.5 quantile; however, in the 0.1 and 0.9 quantiles, the associated variables (COP and AFP) increased significantly, and the association was stronger. This result shows that in extreme environments, especially extremely adverse conditions, EPU had a stronger role in communicating information with the crude oil and agricultural commodity markets. Since China is the world’s largest crude oil importer, the COP fluctuation is an important factor affecting its EPU (Sun et al., 2020). China formulates policies to counteract the detrimental consequences of the systemic risks and latent contagion effects in response to the COP fluctuations. In addition, the influence of China’s EPU on global markets intensified sharply during the 2008 financial crisis, which may also explain the increased EPU spillover effects with the other two variables under extreme markets (Liu Z. et al., 2023). Furthermore, price stabilization is the main goal of macroeconomic policy. As agricultural products are essential inputs in the manufacture of numerous commodities, AFP fluctuations will have a direct impact on production costs and affect commodity prices. Consequently, fluctuations in agricultural commodity prices will prompt the government to adjust economic policies, which explains the spillover effect of the AFP on EPU.
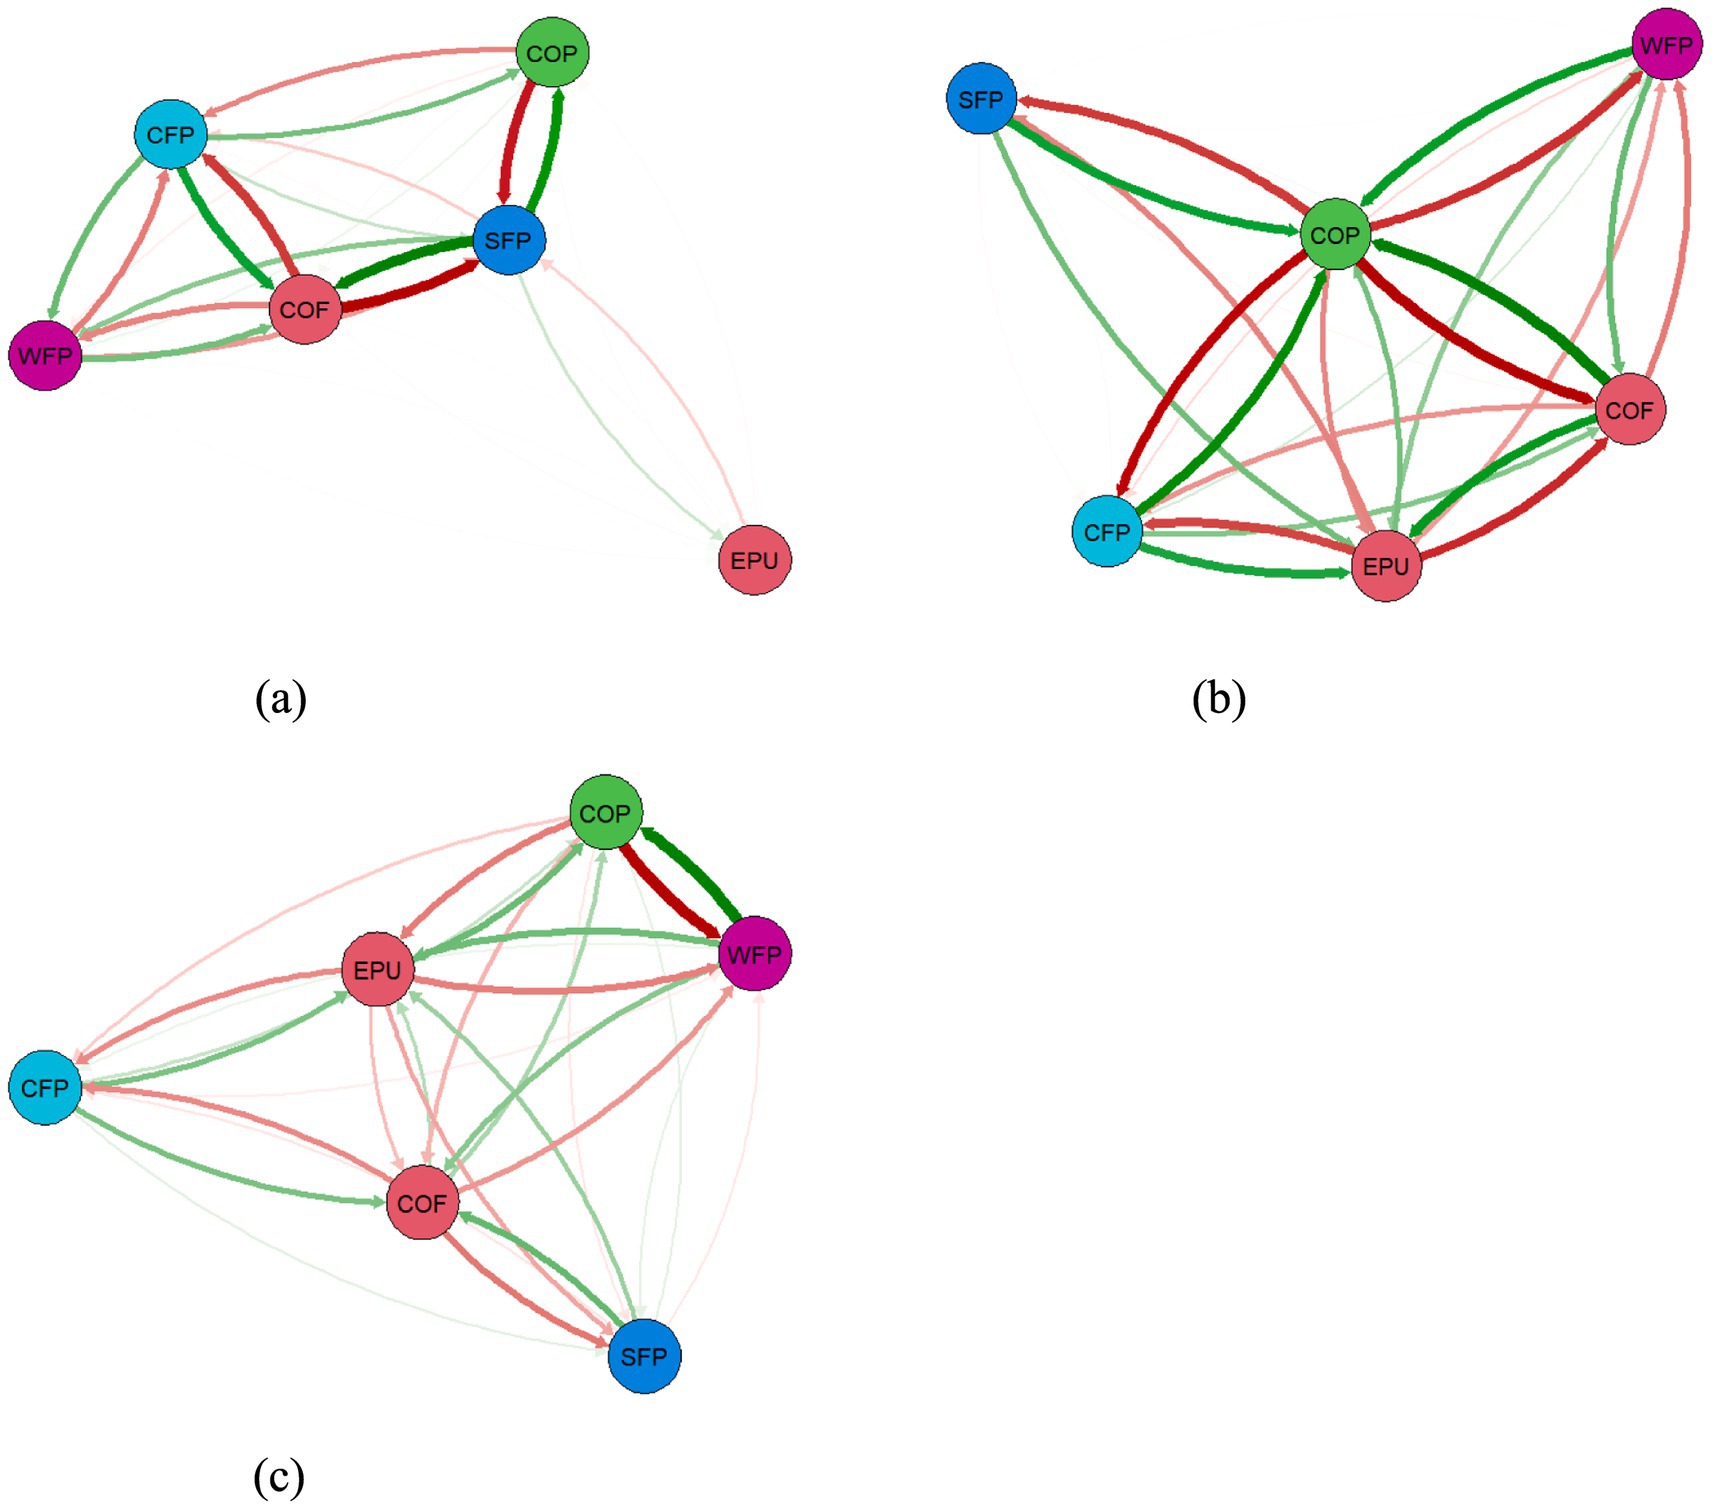
Figure 3. Full-sample volatility connectedness networks. (a) 50th quantile. (b) 10th quantile. (c) 90th quantile.
However, the presumption that the connectedness of EPU, the COP and the AFP would be constant throughout the sample period is a key flaw in the static analysis. This assumption ignores changes in the correlations created by financial market volatility and political events. Commodity futures markets evolve, making it challenging to use fixed parameter models for the whole sample period (Diebold and Yılmaz, 2014). To solve this problem, we observe the time-varying connectedness measures.
6.2 Time-varying connectedness
In this section, we perform a rolling analysis using Quantile-VAR to obtain temporal spillover variations under different conditional distributions. The TCI displays the total volatility spillover among variables in the spillover network system. When the TCI value is larger, the system has a higher connectedness level. The temporal changes in the TCI at the 0.5, 0.1, and 0.9 quantiles are shown in Figures 4a–c.
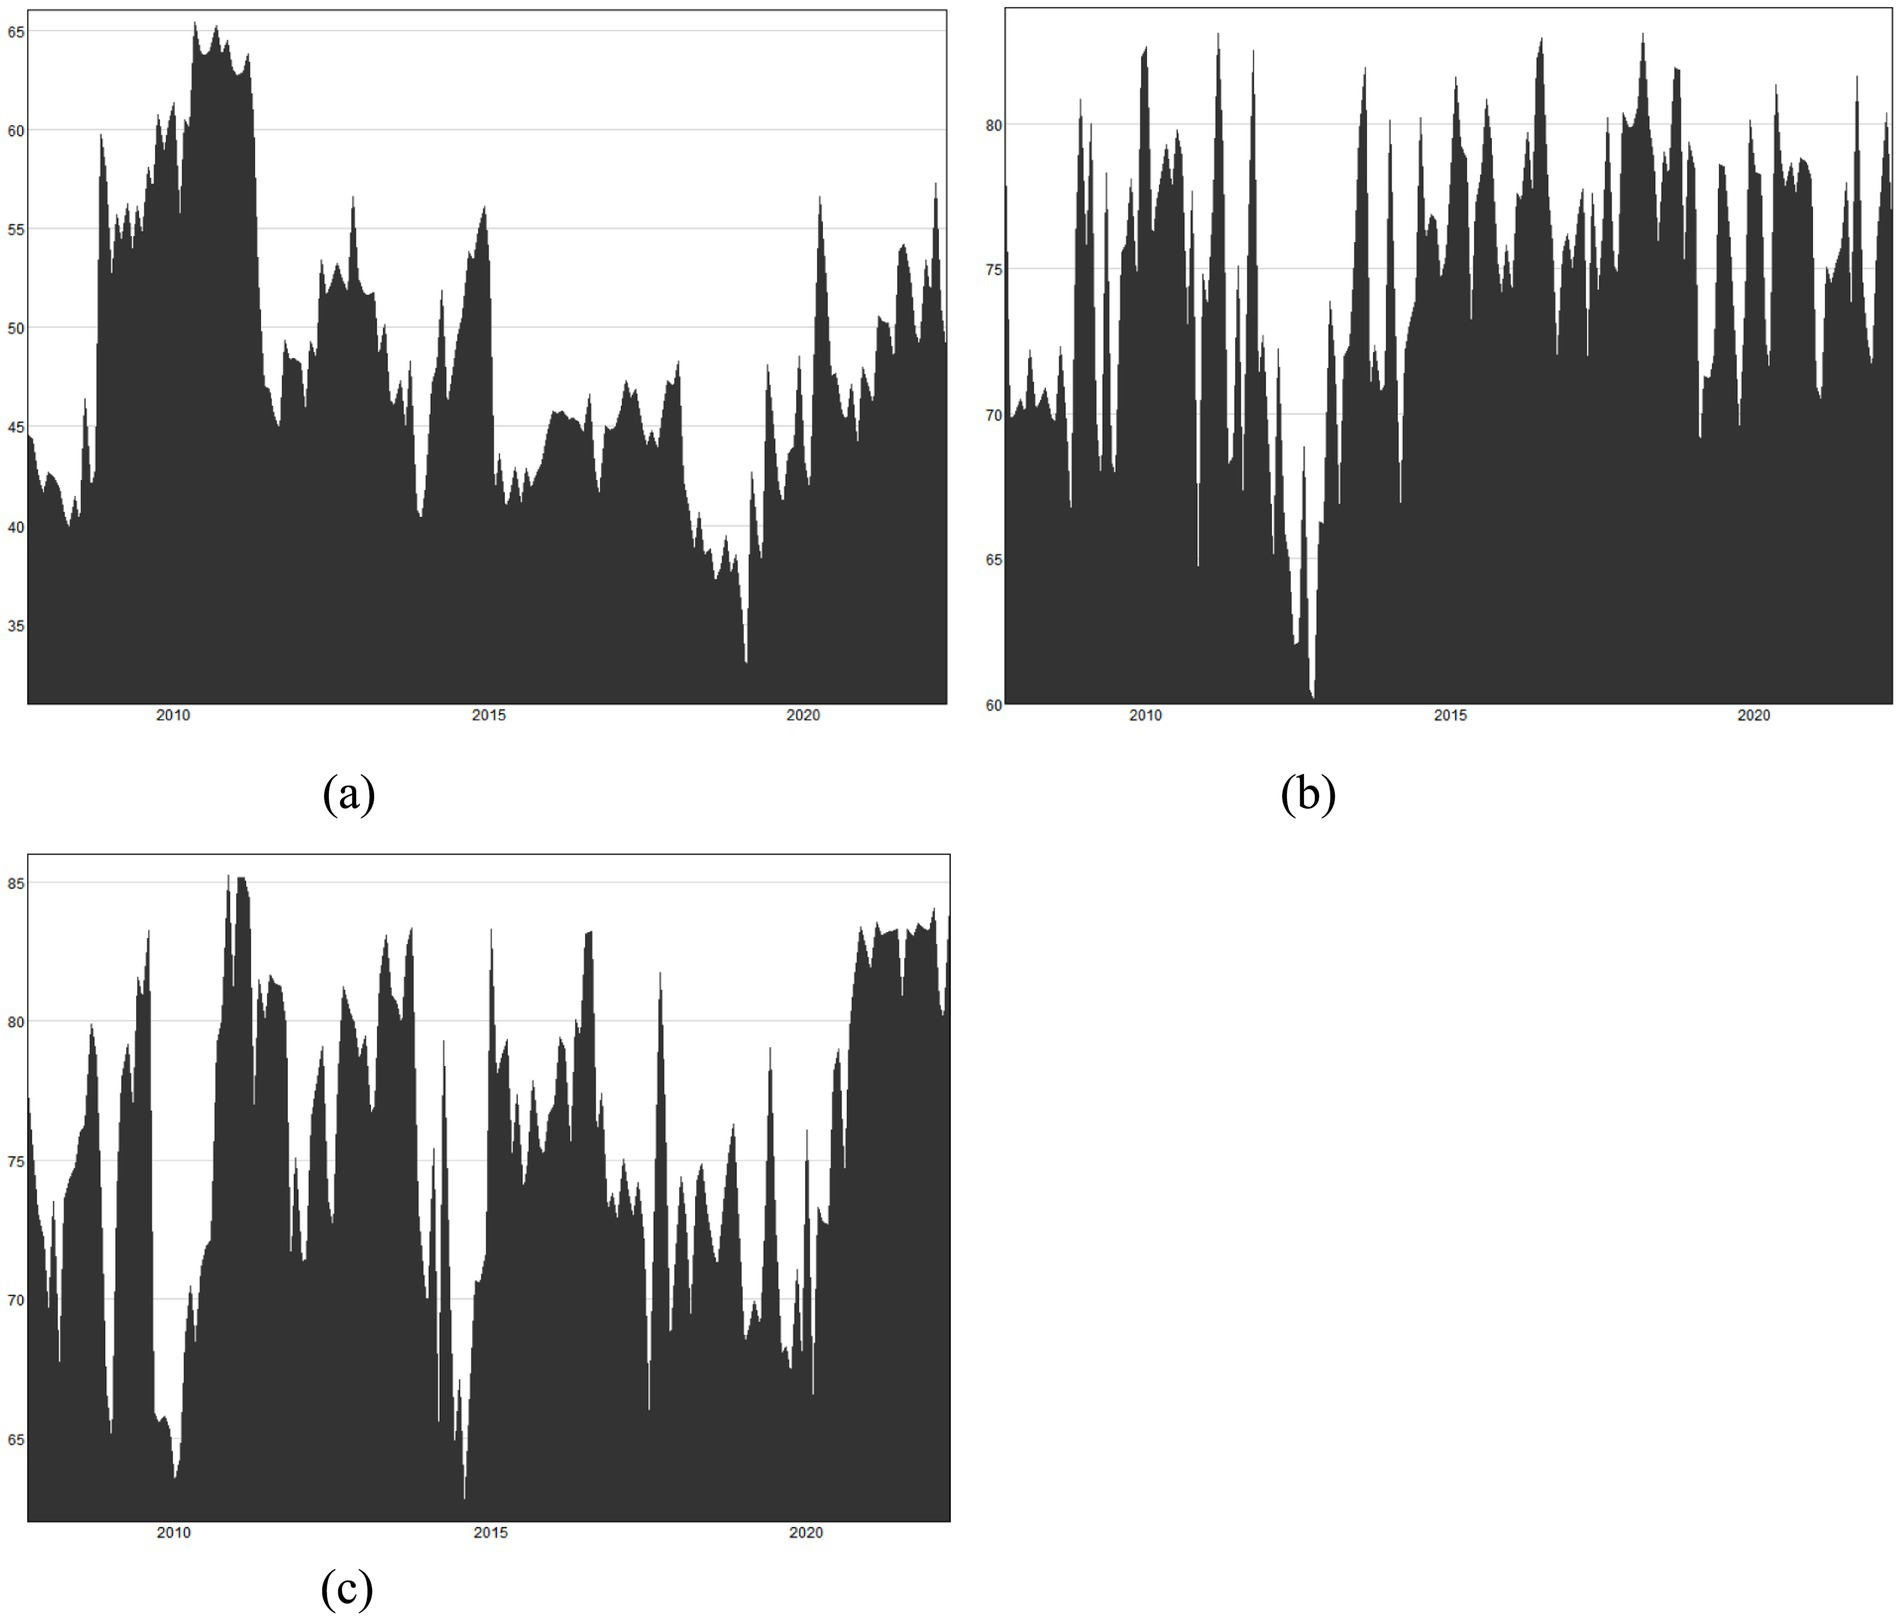
Figure 4. Dynamic rolling window connectedness. (a) 50th quantile. (b) 10th quantile. (c) 90th quantile.
Clearly, the results suggest that the TCI is time varying, with significantly higher connectivity levels in the low (0.1) and high (0.9) quantiles than it has in the median quantile (0.5). The TCI for the median quantile exhibited a fairly wide fluctuation, ranging from 35 to 65%. Conversely, the low (from 65 to 83%) and high quantiles (from 65 to 85%) changed much less over time. These results reconfirm the asymmetric and time-varying volatility spillovers among the variables in the different quantiles of the volatility distribution. From 2008 and 2012, the spillovers peaked, reaching as high as 80%. Trade and financial liberalization strengthened the price spillover effect between different commodity categories (Farid et al., 2022). Agricultural market suffers a widespread price upward, due to extreme weather such as Hurricane Katrina and heatwave in the U.S., and severe flood in India, which reduces the production of staple crops such as corn and rice. Besides, some nations have put trade restrictions in place to promote imports and limit agricultural exports. The Argentine government increased the export taxes on wheat and soybeans from 20 to 28% and 27.5 to 35%, respectively, in November 2007. Meanwhile, during this period, the 2008 global financial crisis and the 2011–2012 Eurozone crisis spread to the global economy, which significantly increased the spillover effects of EPU, the COP and the AFP. From 2013 to 2014, the global economy recovered, and the TCI overall decreased (Shahzad et al., 2017), in contrast to the high TCI found under extreme shocks. Before 2016, the volatility spillover was consistently high, mainly due to EPU, which might be the result of multiple factors. Examples include growing fears of a slowdown in China’s economy in 2012, increasing anxiety about the shadow banking system, the breakdown of stock market in August 2015, and political strikes in November 2016. The TCI across the quantiles decreased significantly from 2017 to 2019. This result can account for the more pronounced benefits of agricultural commodity market diversification in times of crisis, such as the Organization of Petroleum Exporting Countries (OPEC) price reduction agreement and ongoing hostile Sino–U.S. relation. After COVID-19 began in early 2020, dynamic spillovers began to increase significantly, more notably in extreme markets.
6.3 Net total and pairwise spillover
The net directional connection causes each variable’s volatility to impact the system as a whole. Figure 5 shows the correlation of the rolling net volatility connectivity for the three levels of volatility conditions (average, very low, and very high). This analysis helps separate the variables into the net transmitters and the net receivers of systemic risk and information. Unlike the classification we provide in Section 6.2, this section’s dynamic methodology makes it possible to identify the potential transitions between the two variables. Over time, they can act as both net transmitters and net receivers of shocks in the system. For each variable, the positive (negative) values represent the net transfer (receiver) effects.
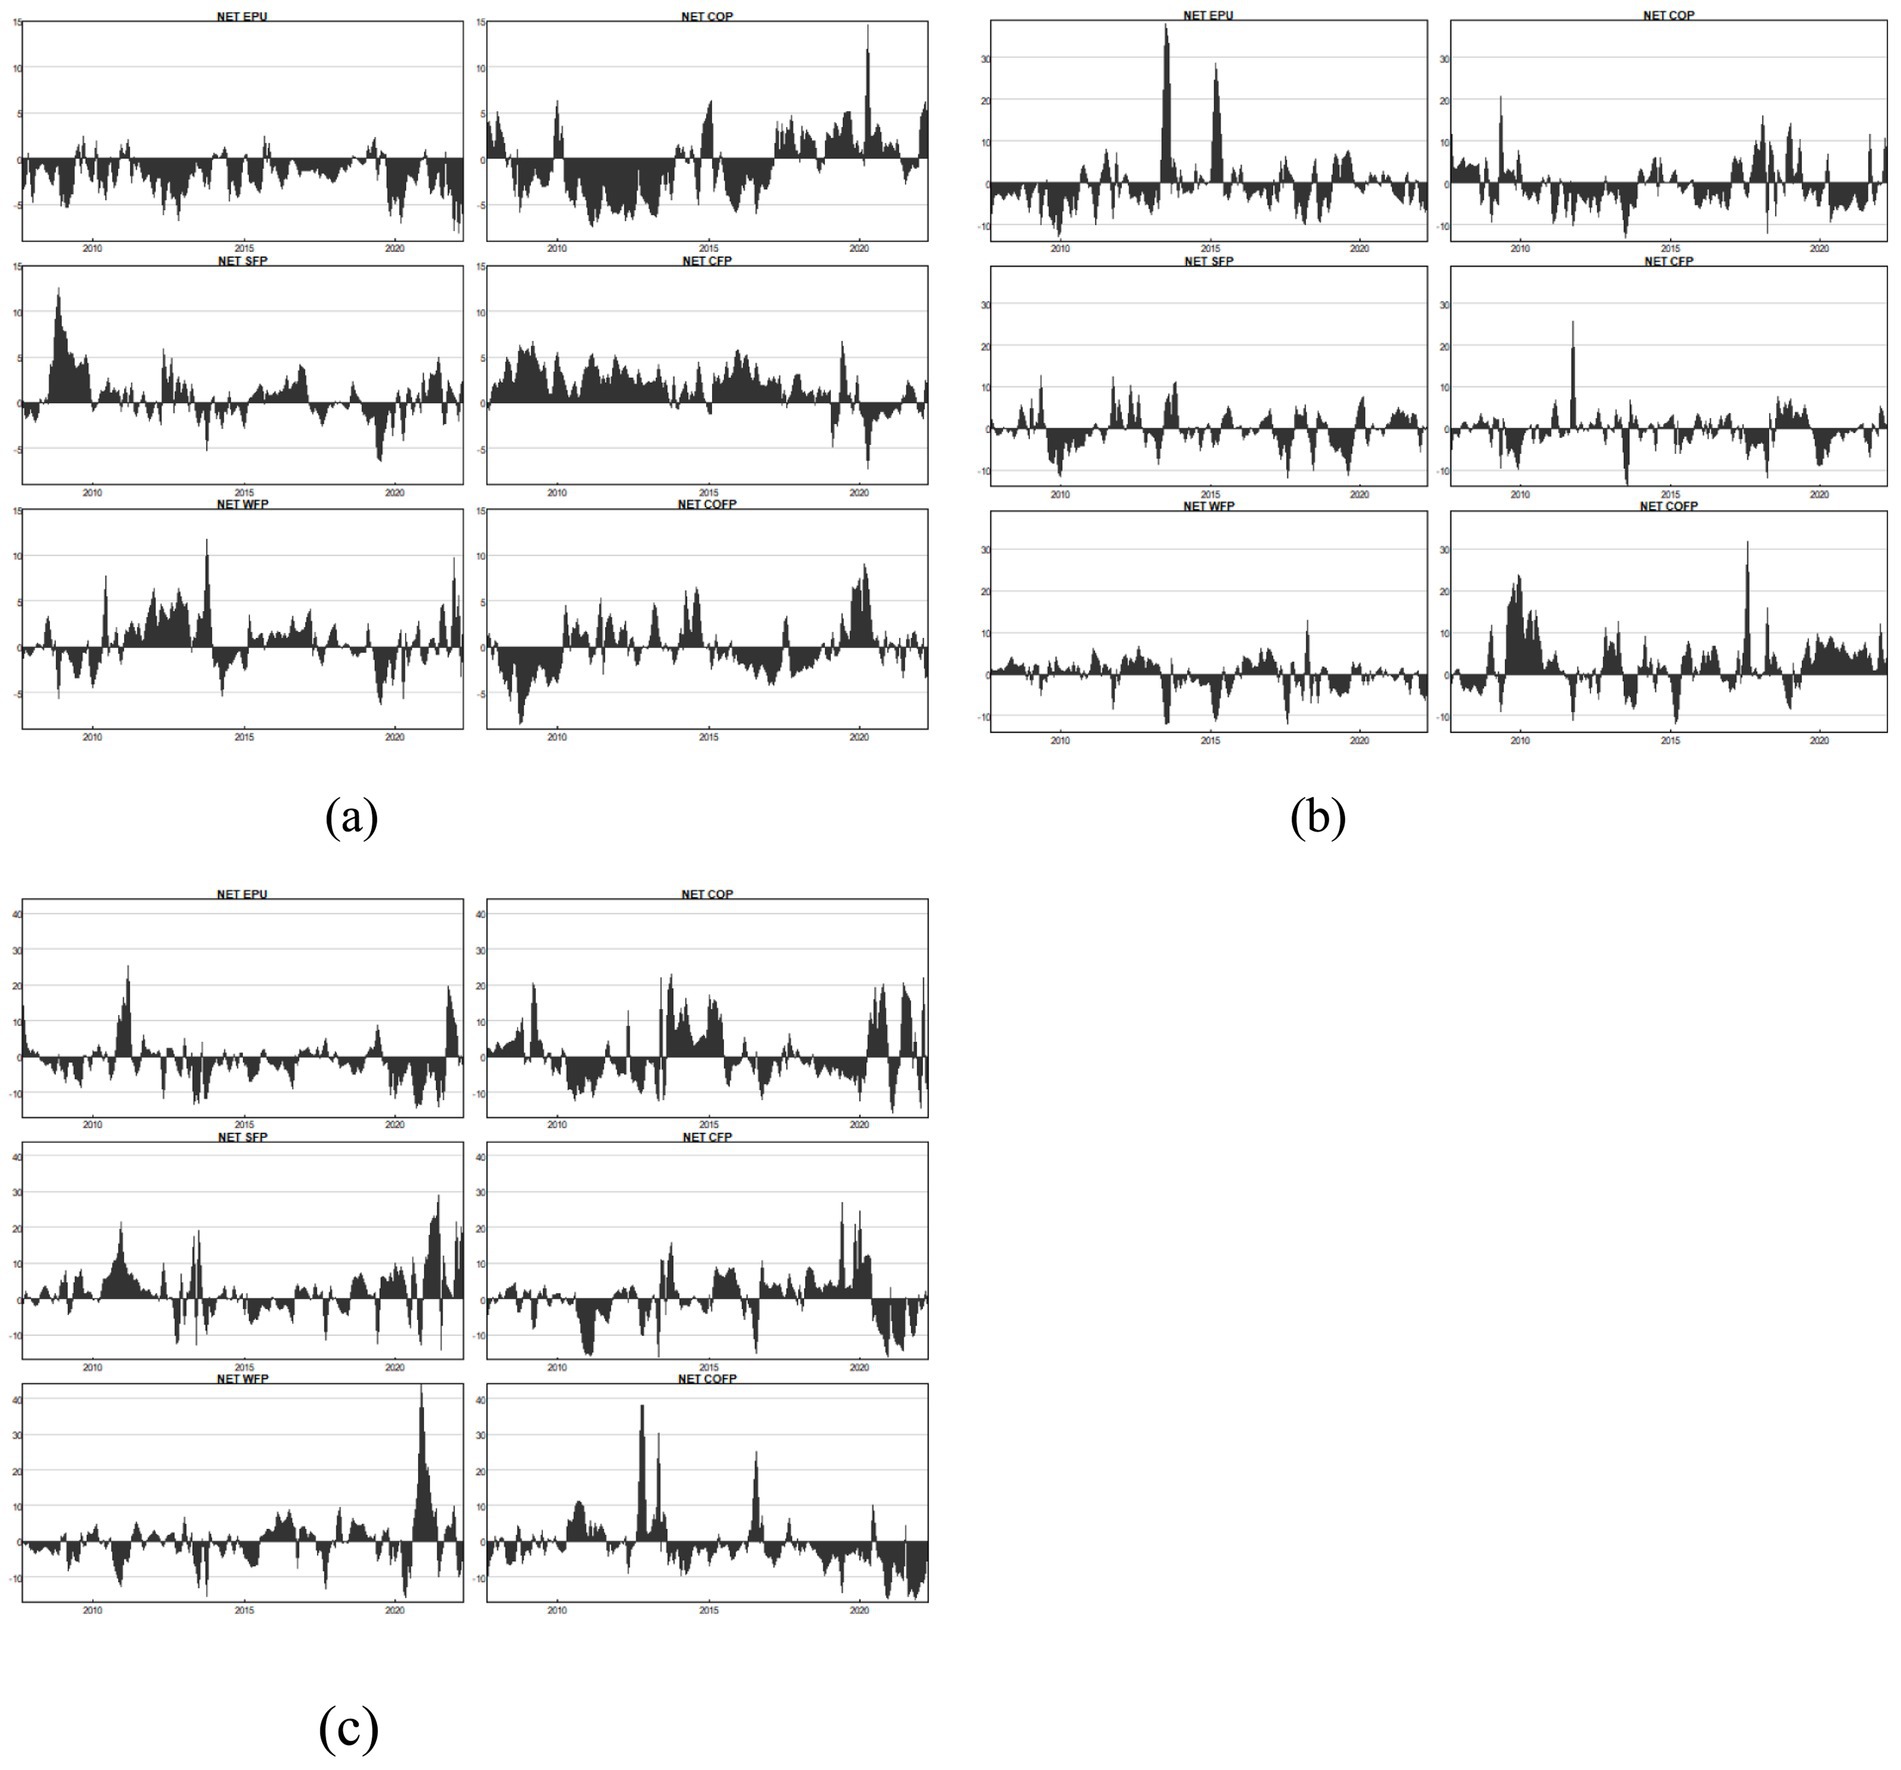
Figure 5. Dynamic rolling window NET connectedness. (a) 50th quantile. (b) 10th quantile. (c) 90th quantile.
Figure 5a shows that under normal economic conditions, the CFP was an obvious transmitter, EPU was an obvious receiver, and the other variables were not significant during the whole period. The patterns of net volatility spillovers, however, were significantly different for extreme events (in the upper and lower quantiles), with more of them than for regular markets. In extreme negative conditions, as shown in Figure 5b, EPU was a clear recipient of risk and information between 2007 and 2011. Shocks to China could result from a few significant events, including the 2008 bankruptcy of Lehman Brothers, the European financial crisis, and the United States’ fresh round of quantitative easing policy (Huang and Luk, 2020). China has adopted some economic policies to counteract such shocks, such as the 4 trillion fiscal plan in 2009. In addition, EPU showed a significantly high spillover effect in 2015. The unexpected devaluation of the Renminbi in August 2015 and exchange rate reform may have contributed to this spillover. In addition, the COP was an obvious transmitter of risks and information in approximately 2008 and 2018. The subprime mortgage crisis in 2008 triggered foam and price fluctuations in the oil market. The COP reached a historical high of more than $140 per barrel before the crisis and then decreased to approximately $40 per barrel after the crisis (Zhang et al., 2019). In addition, geopolitical events and OPEC production cuts drove oil price volatility in 2018, which can explain the increase in the COP spillovers in these two periods. Under a favorable economic environment, as shown in Figure 5c, EPU was almost always the information receiver. China’s economic development is vulnerable to commodity supply and demand constraints, because 21% of its food imports were used to produce food domestically in 2022 (Ma and Zhao, 2024). From $9.9 billion in 2001 to $126 billion in 2018, China’s agricultural imports have grown since joining the World commerce Organization (WTO), making up 8.3% of the world’s food commerce (Sun et al., 2021). This situation causes EPU to accept the spillover effect of bulk commodities (Song et al., 2022).
These results provide new insights into shock propagation due to extreme market volatility. Figures 5a–c depict the variability in the variable’s net volatility spillover index over time. Moreover, we provide evidence that the connectivity networks assessed under conditional averages are not suitable to reflect the connectivity spillovers caused by large-scale positive/negative shocks. During crises, the spillover effects of various markets intensify, which emphasizes the importance of prudential supervision and oversight mechanisms on the AFP, the COP and EPU. Thus, if past patterns focused on average network connectivity continue, investors and regulators will ignore the transmitters of volatility in extreme environments. Thus, investors and regulators should continually monitor the dynamic spillover effects caused by the fluctuations of EPU, the COP, and the AFP in extreme situations.
Next, we study the network pairwise connectivity results in Figure 6. We concentrate on the spillover effects related to EPU and the COP to further determine their importance in the agricultural commodity price network. Figures 6a,b show that the COP and the AFP also had a spillover effect. During the serious epidemic period of COVID-19, the low market price led to a decrease in oil production. This situation may increase the prices of agricultural products used to produce biofuels, such as soybean and corn (Rajput et al., 2021). One possible explanation for the rise in agricultural commodity prices is the rise in the use of biofuel. For instance, global biofuel production increased from 228 thousand barrels per day in 1986 to 2,771 thousand barrels per day in 2019, an almost 12-fold increase (Wei et al., 2024). Meanwhile, many countries have launched biofuel plans to reduce fossil oil, and solve energy and environmental issues, which brings changes in agricultural commodities (Karkowska and Urjasz, 2024). The COP and AFP are closely linked by the substitution of biofuels for oil (Tiwari et al., 2022). In addition, the COP affects the AFP by affecting the cost of agricultural product production and shipping (Liu et al., 2019). After 2020, the spillover effects of both the normal and the negative conditions showed opposite directions. Therefore, the COP and AFP are highly correlated, but the overflow direction is affected by different fundamentals. We mainly focus on volatility in extreme environments. As shown in Figure 6b, the SFP had a spillover effect on EPU in quite a few periods, while the CFP had less of a spillover effect on EPU. Less than 25% of China is self-sufficient in terms of soybeans (Li J. et al., 2017; Li N. et al., 2017); thus, soybean prices are vulnerable to the influence of importing countries. Therefore, China adjusted its economic policy to respond to the SFP changes, which explains why EPU is more affected by the SFP. In comparison, China’s wheat self-sufficiency rate exceeds 95%, which is not easily disturbed by external risks and will not cause EPU fluctuations, which is consistent with our empirical results.
Figure 6. Dynamic net pairwise directional connectedness. (a) 50th quantile. (b) 10th quantile. (c) 90th quantile.
6.4 Robustness test
This paper further applies four different robustness tests to ensure the validity of empirical results, including altering estimating method, adding other variables, replacing variables, and changing forecast horizon and rolling window size.
6.4.1 Altering estimating method
This paper employs quantile Granger causality test (Mayer et al., 2025), as an alternative method to QVAR, to investigate the relationship among EPU, COP, SFP, CFP, WFP and COFP under different quantiles. This method reveals the predictive ability of explanatory variables for response variables by assisting in the identification of particular quantile ranges where causal linkages between the variables hold (Chen and Sun, 2023). To ensure comparability, we select three representative quantiles—0.1, 0.5, and 0.9—for analysis. The results, summarized in Table 5, indicate the presence of significant causal linkages in most cases, with the magnitude of coefficients increasing at the extreme quantiles (0.1 and 0.9). These findings align with the baseline results, suggesting stronger inter-variable connections and offering a solid foundation for following spillover analysis.
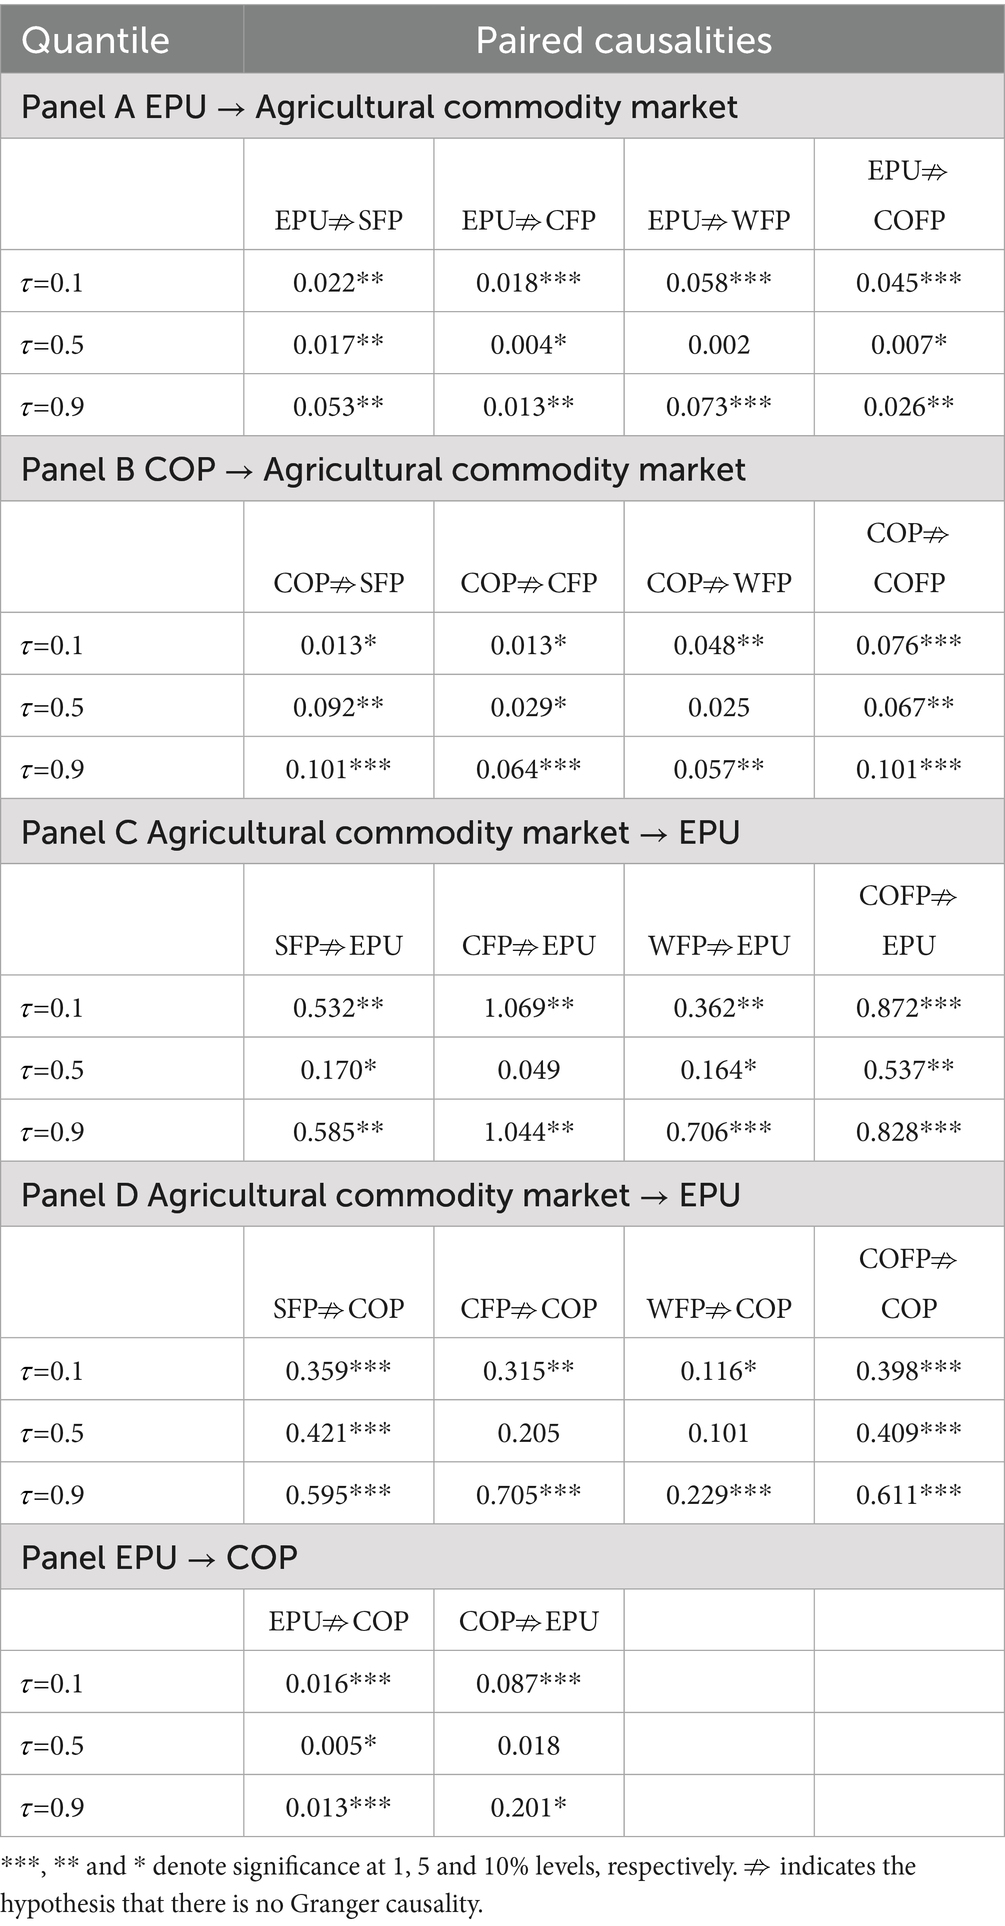
Table 5. Quantile Granger causality.
6.4.2 Adding other variables
Building on the characteristics of agricultural commodity and energy markets, and drawing on Karkowska and Urjasz (2024) as well as Awartani and Maghyereh (2025), this study further incorporates geopolitical risk (GPR) and the US dollar index (USI) into QVAR framework across different quantiles. The proposed model, specified as Model (1), is presented in Table 6. For simplicity and clarity, only the NET index is reported to determine whether a variable functions as a net transmitter or receiver in spillover system. The results show that EPU and COP were net receivers of information spillovers across all quantiles, with spillover effects intensifying at extreme quantiles. These findings align with the baseline results and demonstrate robustness.
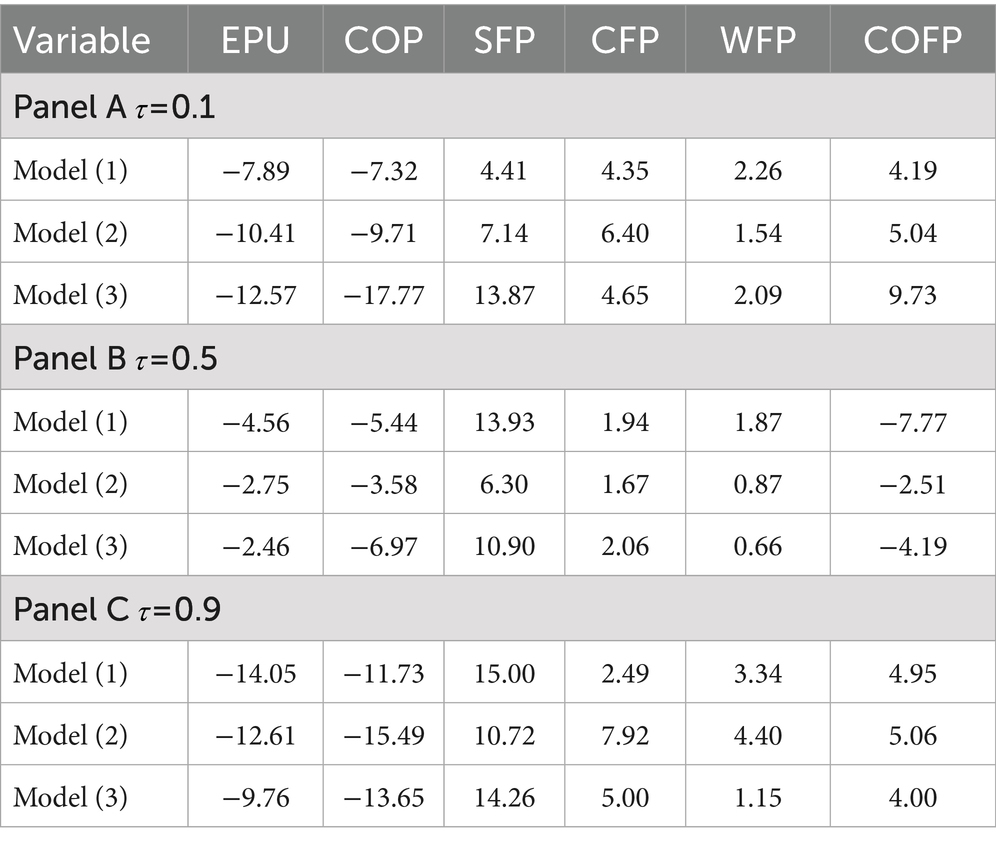
Table 6. Robustness tests for NET index.
6.4.3 Replacing variables
To confirm the validity of our results, we replace several variables, including the EPU and COP. Following Iregui et al. (2025), who note that West Texas Intermediate (WTI) serves as the benchmark oil price for most crude oil produced or sold in the U.S and represents another global benchmark alongside Brent crude, this study employs COP* as an alternative oil price measure. Meanwhile, drawing on Wang (2024), we adopt a new EPU* index in terms of mainland Chinese newspapers—namely, Renmin Daily and Guangming Daily—instead of the South China Morning Post from Hong Kong. Model (2) presents the new QVAR framework, and the corresponding results are displayed in Table 6. These updated results indicate that the net effects (NET) of both EPU and COP remain negative and increase in magnitude at extreme quantiles, in line with the baseline results, confirming the validity of our findings.
6.4.4 Changing forecast horizon and rolling window size
This work, following Liu X. et al. (2023), performs a sensitivity analysis to investigate if the empirical results are influenced by different choices of rolling window size and prediction horizon in order to further validate the dependability of our findings. In the baseline specification, the rolling window and forecast horizon are set to 100 and 10, respectively. For robustness, we re-estimate the model using extended settings—specifically, a rolling window of 150 and a forecast horizon of 15. The new QVAR model, denoted as Model (3), is presented in Table 6. The findings demonstrate that the NET index’s behavior and magnitude are mostly in line with what was achieved with the original setup, confirming the reliability of our conclusions.
7 Discussion
This paper draws some important conclusions, which provides implications for multiple participants. First, considering the receiving role of EPU, as policy maker and implementer, government should take effective measures. China must optimize and diversify its import structure for energy and agricultural products to reduce reliance on a single source. Additionally, prioritizing energy security and food security is essential; this can be accomplished by creating new agriculture and energy technologies. Furthermore, the government should carefully evaluate the necessity of policy adjustments, grounded in long-term development strategies and the need for macroeconomic stability, to minimize frequent and significant changes to policies and systems. Second, considering the different roles of commodity markets, investors should can better choose and adjust their investment strategies and establish a reasonable asset allocation system in the process of portfolio investment in the financial market. When a portfolio includes both energy and agriculture, the different correlation between COP and AFP may affect the diversification effect of the portfolio, thereby affecting its returns. This is especially crucial when there is financial instability, since investors should pay close attention to the dangers of market spillover, treating spillover effects as a significant factor influencing portfolio returns for more effective risk management. Last, the spillover among COP, AFP, and EPU exhibits dynamics, especially during extreme events where the risk correlation increases. Thus, corporate and institutional investors should set up new risk prevention principle of “too interconnected to fail,” rather than “too big to fail.” Corporate risk management should establish a risk control framework and a risk warning network to identify the categories of risks that trigger the warning mechanisms, especially for significant incidents.
8 Conclusion and policy implications
The study utilized the quantile connectedness approach to estimate the spillover effects among EPU, the COP, and the AFP to quantify the association structure and time-varying properties. The empirical findings indicate that in extreme cases, total spillovers increase sharply. The CFP and WFP are the main transmitters in the lower quantile, while EPU and the COP are the main receivers in the upper and lower quantiles. Under different economic fundamentals, the spillover effects among the variables will also change. In turbulent times, EPU, the COFP and the CFP have the strongest interconnection, and the COP is closely related to all agricultural commodity prices, while the normal market is the COP and SFP, and the prosperous times are the COP and WFP. In the time-varying analysis, EPU is the receiver of information in a negative market. Compared with the upper and middle quantiles, the lower quantiles have the most volatile net spillovers.
This paper’s innovation lies in its inaugural integration of EPU into the theoretical framework of COP and AFP volatility, thereby enhancing the understanding of volatility spillover among these variables. It expands the research landscape by focusing on developing countries characterized by large populations and susceptibility to fluctuations in both AFP and international COP. Furthermore, this study transcends conventional analyses of connectivity among COP, EPU, and AFP by employing a model that accounts for average shocks, revealing distinct and more comprehensive interactions and contagion effects in extreme market conditions. Additionally, this paper places a greater emphasis on practical significance by connecting empirical findings from various stakeholders, including government entities, investors, and organizations, across different domains such as quantile analysis and temporal factors.
This paper provides recommendations for policy-makers and investors. First, the government should improve the agricultural commodity market monitoring and early warning mechanism to manage the impact of the sharp COP fluctuations. Sensitive policy interventions will help stabilize commodity prices and provide appropriate and efficient response measures in the event of a major emergency. According to different economic fundamentals (positive, negative and normal markets), policy-makers should decide whether to adopt economic policy interventions and agricultural subsidy systems to protect investors and farmers from the adverse effects of price volatility. In a relatively calm economic environment, macroeconomic policy formulation needs to be more cautious, as external shocks might compromise the effectiveness of these interventions. Second, investors in oil and agricultural markets should not only focus on intermarket shocks, but risk spillovers between markets are also important. When managing risk and designing an optimal portfolio strategy, investors should pay attention to the connectivity between commodities. They should also adjust their asset-allocation strategies according to different economic environments to protect their own interests. Especially in extreme markets in which the economy is highly uncertain, prudent risk-management tools need to be strengthened. Additionally, investors should focus especially on the agricultural commodities utilized to produce alternative energy when crude oil prices are fluctuating. Third, international organizations should formulate reasonable energy strategies to stabilize crude oil prices within a reasonable range. For example, OPEC can take production-reduction measures to prevent oil prices from plummeting. The International Energy Agency should establish strategic oil reserves and strengthen collaboration between oil importers and exporters. Moreover, international organizations should coordinate the economic and oil policies of countries, improve the global oil production and transportation cooperation action system, and stabilize international relations to ensure the stable supply of crude oil.
The assessment of agricultural commodity futures prices, derived from the Chicago Board of Trade and the New York Futures Exchange, may be biased due to limitations in data availability and authority, particularly regarding China’s influence. The EPU index was created using just newspapers from the Chinese mainland, overlooking the evaluation of foreign media perspectives. Future studies should aim to develop a more comprehensive EPU index that includes both domestic and international news sources. Additionally, as China seeks to enhance its commodity market, leveraging mature data becomes essential once the market size reaches a certain threshold. Expanding the research to include comparisons with other countries, both developed and developing, as well as oil-exporting and importing nations, could provide valuable insights into differences in energy and agriculture markets.
Data availability statement
The original contributions presented in the study are included in the article/supplementary material, further inquiries can be directed to the corresponding author.
Author contributions
YS: Writing – original draft. K-HW: Writing – review & editing. H-WL: Formal analysis, Writing – review & editing. N-CM: Methodology, Writing – review & editing, Data curation.
Funding
The author(s) declare that financial support was received for the research and/or publication of this article. This work was supported by “Economics and Policy Options for Climate Change Risk and Global Environmental Governance” (CF 193/28.11.2022, Funding Contract no. 760078/23.05.2023), within Romania’s National Recovery and Resilience Plan (PNRR)—Pillar III, Component C9, Investment I8 (PNRR/2022/C9/MCID/I8)—Development of a program to attract highly specialised human resources from abroad in research, development and innovation activities.
Conflict of interest
The authors declare that the research was conducted in the absence of any commercial or financial relationships that could be construed as a potential conflict of interest.
Generative AI statement
The authors declare that Gen AI was used in the creation of this manuscript.
Any alternative text (alt text) provided alongside figures in this article has been generated by Frontiers with the support of artificial intelligence and reasonable efforts have been made to ensure accuracy, including review by the authors wherever possible. If you identify any issues, please contact us.
Publisher’s note
All claims expressed in this article are solely those of the authors and do not necessarily represent those of their affiliated organizations, or those of the publisher, the editors and the reviewers. Any product that may be evaluated in this article, or claim that may be made by its manufacturer, is not guaranteed or endorsed by the publisher.
References
Afonso, A., Mignon, V., and Saadaoui, J. (2024). On the time-varying impact of China’s bilateral political relations on its trading partners: “Doux commerce” or “trade follows the flag”? China Econ. Rev. 85:102184. doi: 10.1016/j.chieco.2024.102184
Alamah, Z., Elgammal, W., and Fakih, A. (2024). Does twitter economic uncertainty matter for wheat prices? Econ. Lett. 234:111463. doi: 10.1016/j.econlet.2023.111463
Alnafisah, H., Almansour, B. Y., Elabed, W., and Jeribi, A. (2025). Spillover dynamics of digital assets during economic and political crises. Res. Int. Bus. Finance 75:102770. doi: 10.1016/j.ribaf.2025.102770
Aloui, R., Rangan, G., and Stephen, M. M. (2016). Uncertainty and crude oil returns. Energy Econ. 55, 92–100. doi: 10.1016/j.eneco.2016.01.012
Alsharif, M. (2024). How does oil price uncertainty affect the stability of conventional and Islamic banks in major oil-exporting countries? Evidence from the GCC region. Financ. Res. Lett. 69:106161. doi: 10.1016/j.frl.2024.106161
Amolegbe, K. B., Upton, J., Bageant, E., and Blom, S. (2021). Food price volatility and household food security: evidence from Nigeria. Food Policy 102:102061. doi: 10.1016/j.foodpol.2021.102061
Antonakakis, N., Chatziantoniou, I., and Filis, G. (2014). Dynamic spillovers of oil price shocks and economic policy uncertainty. Energy Econ. 44, 433–447. doi: 10.1016/j.eneco.2014.05.007
Apostolakis, G. N., Floros, C., Gkillas, K., and Wohar, M. (2021). Financial stress, economic policy uncertainty, and oil price uncertainty. Energy Econ. 104:105686. doi: 10.1016/j.eneco.2021.105686
Awartani, B., and Maghyereh, A. (2025). The value of cross market volatility in improving the forecast accuracy of risk in the gold, the dollar and the oil futures markets. Financ. Res. Lett. 83:107668. doi: 10.1016/j.frl.2025.107668
Aynur, P. (2013). Structural breaks, cointegration, and causality by VECM analysis of crude oil and food price. Int. J. Energy Econ. Policy 3, 238–246.
Bagh, T., Jiang, F., and Khan, M. (2024b). From risk to resilience: climate change risk, ESG investments engagement and firm’s value. Heliyon 10:e26757. doi: 10.1016/j.heliyon.2024.e26757
Bagh, T., Zhou, B., Alawi, S. M., and Azam, R. (2024a). ESG resilience: exploring the non-linear effects of ESG performance on firms sustainable growth. Res. Int. Bus. Finance 70:102305. doi: 10.1016/j.ribaf.2024.102305
Bakas, D., and Triantafyllou, A. (2018). The impact of uncertainty shocks on the volatility of commodity prices. J. Int. Money Finance 87, 96–111. doi: 10.1016/j.jimonfin.2018.06.001
Baker, S. R., Bloom, N., and Davis, S. J. (2016). Measuring economic policy uncertainty. Q. J. Econ. 131, 1593–1636. doi: 10.1093/qje/qjw024
Benlagha, N., and Abdelmalek, W. (2024). Dynamic connectedness between energy and agricultural commodities: insights from the COVID-19 pandemic and Russia–Ukraine conflict. Eurasian Econ. Rev. 14, 781–825. doi: 10.1007/s40822-024-00279-7
Beyer, R. C. M., Jain, T., and Sinha, S. (2023). Lights out? COVID-19 containment policies and economic activity. J. Asian Econ. 85:101589. doi: 10.1016/j.asieco.2023.101589
Bossman, A., Gubareva, M., and Teplova, T. (2023). Asymmetric effects of market uncertainties on agricultural commodities. Energy Econ. 127:107080. doi: 10.1016/j.eneco.2023.107080
Bouteska, A., Rahman, M., Hassan, M. K., and Sanchez, B. A. (2025). Re-examining the nexus between Chinese carbon markets with energy and non-energy commodity markets in a novel risk spillover network approach. Pac. Basin Financ. J. 92:102820. doi: 10.1016/j.pacfin.2025.102820
Bulut, E., and Marangoz, C. (2025). Exploring the impact of economic recession indicators on global financial markets: a QVAR analysis. Int. Rev. Financ. Anal. 99:103966. doi: 10.1016/j.irfa.2025.103966
Che, M., Wang, L., and Li, Y. (2024). Global economic policy uncertainty and oil price uncertainty: which is more important for global economic activity? Energy 310:133305. doi: 10.1016/j.energy.2024.133305
Chen, D., Gummi, U. M., Lu, S., and Hassan, A. (2024). Oil price, economic policy uncertainty and food prices in oil-exporting and oil-importing developing economies. Econ. Change Restruct. 57:151. doi: 10.1007/s10644-024-09733-7
Chen, B., and Sun, Y. (2023). Extreme risk contagion between international crude oil and China’s energy-intensive sectors: new evidence from quantile granger causality and spillover methods. Energy 285:129468. doi: 10.1016/j.energy.2023.129468
Czudaj, R. L. (2020). The role of uncertainty on agricultural futures markets momentum trading and volatility. Stud. Nonlinear Dyn. Econom. 24:20180054. doi: 10.1515/snde-2018-0054
Dahl, R. E., Oglend, A., and Yahya, M. (2020). Dynamics of volatility spillover in commodity markets: linking crude oil to agriculture. J. Commod. Mark. 20:100111. doi: 10.1016/j.jcomm.2019.100111
Dai, Y. S., Huynh, N. Q. A., Zheng, Q.-H., and Zhou, W.-X. (2022). Correlation structure analysis of the global agricultural futures market. Res. Int. Bus. Finance 61:101677. doi: 10.1016/j.ribaf.2022.101677
Dai, Z., and Peng, Y. (2022). Economic policy uncertainty and stock market sector time-varying spillover effect: evidence from China. N. Am. J. Econ. Finance 62:101745. doi: 10.1016/j.najef.2022.101745
Dai, P. F., Xiong, X., Zhang, J., and Zhou, W.-X. (2022). The role of global economic policy uncertainty in predicting crude oil futures volatility: evidence from a two-factor GARCH-MIDAS model. Resour. Policy 78:102849. doi: 10.1016/j.resourpol.2022.102849
de Araujo, F. H. A., Bejan, L., Stosic, B., and Stosic, T. (2020). An analysis of Brazilian agricultural commodities using permutation-information theory quantifiers: the influence of food crisis. Chaos Solitons Fractals 139:110081. doi: 10.1016/j.chaos.2020.110081
Diaz, E. M., Cunado, J., and Gracia, F. P. (2024). Global drivers of inflation: the role of supply chain disruptions and commodity price shocks. Econ. Model. 140:106860. doi: 10.1016/j.econmod.2024.106860
Diebold, F. X., and Yilmaz, K. (2012). Better to give than to receive: predictive directional measurement of volatility spillovers. Int. J. Forecast. 28, 57–66. doi: 10.1016/j.ijforecast.2011.02.006
Diebold, F. X., and Yılmaz, K. (2014). On the network topology of variance decompositions: measuring the connectedness of financial firms. J. Econom. 182, 119–134. doi: 10.1016/j.jeconom.2014.04.012
Farid, S., Naeem, M. A., Paltrinieri, A., and Nepal, R. (2022). Impact of COVID-19 on the quantile connectedness between energy, metals and agriculture commodities. Energy Econ. 109:105962. doi: 10.1016/j.eneco.2022.105962
Feng, Y.-S., Li, Y., and Cao, B.-M. (2022). Asymmetric multifractal cross-correlations between economic policy uncertainty and agricultural futures prices. Fluct. Noise Lett. 21:2250035. doi: 10.1142/S0219477522500353
Fowowe, B. (2016). Do oil prices drive agricultural commodity prices? Evidence from South Africa. Energy 104, 149–157. doi: 10.1016/j.energy.2016.03.101
Frimpong, S., Gyamfi, E. N., Ishaq, Z., Kwaku Agyei, S., Agyapong, D., Adam, A. M., et al. (2021). Can global economic policy uncertainty drive the interdependence of agricultural commodity prices? Evidence from partial wavelet coherence analysis. Complexity 2021, 1–13. doi: 10.1155/2021/8848424
Gardebroek, C., and Hernandez, M. A. (2013). Do energy prices stimulate food price volatility? Examining volatility transmission between US oil, ethanol and corn markets. Energy Econ. 40, 119–129. doi: 10.1016/j.eneco.2013.06.013
Guru, B. K., Yadav, I. S., and Nayak, R. (2024). Effects of COVID-19 on investor sentiment: evidence from commodity futures using Google search volume index. Asia-Pacific Finan. Markets. 32, 871–891. doi: 10.1007/s10690-024-09474-7
Hailemariam, A., Smyth, R., and Zhang, X. (2019). Oil prices and economic policy uncertainty: evidence from a nonparametric panel data model. Energy Econ. 83, 40–51. doi: 10.1016/j.eneco.2019.06.010
Hau, L., Zhu, H., Huang, R., and Ma, X. (2020). Heterogeneous dependence between crude oil price volatility and China’s agriculture commodity futures: evidence from quantile-on-quantile regression. Energy 213:118781. doi: 10.1016/j.energy.2020.118781
Hoque, M. E., Billah, M., Kapar, B., and Naeem, M. A. (2024). Quantifying the volatility spillover dynamics between financial stress and US financial sectors: evidence from QVAR connectedness. Int. Rev. Financ. Anal. 95:103434. doi: 10.1016/j.irfa.2024.103434
Hu, G., Liu, S., Wu, G., Hu, P., Li, R., and Chen, L. (2023). Economic policy uncertainty, geopolitical risks, and the heterogeneity of commodity price fluctuations in China --an empirical study based on TVP-SV-VAR model. Resourc. Policy 85:104009. doi: 10.1016/j.resourpol.2023.104009
Huang, Y., and Luk, P. (2020). Measuring economic policy uncertainty in China. China Econ. Rev. 59:101367. doi: 10.1016/j.chieco.2019.101367
Hung, N. T. (2021). Oil prices and agricultural commodity markets: evidence from pre and during COVID-19 outbreak. Resourc. Policy 73:102236. doi: 10.1016/j.resourpol.2021.102236
Iregui, A. M., Núñez, H. M., and Otero, J. (2025). Testing the efficiency of oil price forecast revisions in times of COVID-19 and the Russia–Ukraine conflict. J. Commod. Mark. 40:100513. doi: 10.1016/j.jcomm.2025.100513
Jiang, Y., Ao, Z., and Mo, B. (2023). The risk spillover between China’s economic policy uncertainty and commodity markets: evidence from frequency spillover and quantile connectedness approaches. N. Am. J. Econ. Financ. 66:101905. doi: 10.1016/j.najef.2023.10190
Jiang, Q., and Cheng, S. (2021). How the fiscal and monetary policy uncertainty of China respond to global oil price volatility: a multi-regime-on-scale approach. Resour. Policy 72:102121. doi: 10.1016/j.resourpol.2021.102121
Jiang, Y., Lao, J., Mo, B., and Nie, H. (2018). Dynamic linkages among global oil market, agricultural raw material markets and metal markets: an application of wavelet and copula approaches. Physica A 508, 265–279. doi: 10.1016/j.physa.2018.05.092
Kang, W., and Ratti, R. A. (2013). Oil shocks, policy uncertainty and stock market return. J. Int. Financ. Mark. Inst. Money 26, 305–318. doi: 10.1016/j.intfin.2013.07.001
Karkowska, R., and Urjasz, S. (2024). Importance of geopolitical risk in volatility structure: new evidence from biofuels, crude oil, and grains commodity markets. J. Commod. Mark. 36:100440. doi: 10.1016/j.jcomm.2024.100440
Kumar, S., Tiwari, A. K., Raheem, I. D., and Hille, E. (2021). Time-varying dependence structure between oil and agricultural commodity markets: a dependence-switching CoVaR copula approach. Resourc. Policy 72:102049. doi: 10.1016/j.resourpol.2021.102049
Li, N., Ker, A., Sam, A. G., and Aradhyula, S. (2017). Modeling regime-dependent agricultural commodity price volatilities. Agric. Econ. 48, 683–691. doi: 10.1111/agec.12366
Li, Y., and Li, J. (2021). How does China’s economic policy uncertainty affect the sustainability of its net grain imports? Sustainability 13:6899. doi: 10.3390/su13126899
Li, J., Li, C., and Chavas, J.-P. (2017). Food price bubbles and government intervention: is China different? Can. J. Agric. Econ. 65, 135–157. doi: 10.1111/cjag.12106
Li, S., Li, M., and Fu, R. (2024). A sustainable pandemic response: the impact of COVID-19 vaccination coverage on economic policy uncertainty. Int. Rev. Econ. Finance 92, 316–332. doi: 10.1016/j.iref.2024.02.055
Li, H., Li, Y., and Guo, L. (2023). Extreme risk spillover effect and dynamic linkages between uncertainty and commodity markets: a comparison between China and America. Resour. Policy 85:103839. doi: 10.1016/j.resourpol.2023.103839
Li, R., Yang, H., and Zhang, J. (2024). Agricultural tax reform, capital investment, and structural transformation in China. Struct. Change Econ. Dyn. 71, 509–522. doi: 10.1016/j.strueco.2024.08.016
Liu, X. D., Pan, F., Yuan, L., and Chen, Y.-w. (2019). The dependence structure between crude oil futures prices and Chinese agricultural commodity futures prices: measurement based on Markov-switching GRG copula. Energy 182, 999–1012. doi: 10.1016/j.energy.2019.06.071
Liu, F., Shao, S., Li, X., Pan, N., and Qi, Y. (2023). Economic policy uncertainty, jump dynamics, and oil price volatility. Energy Econ. 120:106635. doi: 10.1016/j.eneco.2023.106635
Liu, X., Wojewodzki, M., Cai, Y., and Sharma, S. (2023). The dynamic relationships between carbon prices and policy uncertainties. Technol. Forecast. Soc. Change 188:122325. doi: 10.1016/j.techfore.2023.122325
Liu, Z., Zhu, T., Duan, Z., Xuan, S., Ding, Z., and Wu, S. (2023). Time-varying impacts of oil price shocks on China’s stock market under economic policy uncertainty. Appl. Econ. 55, 963–989. doi: 10.1080/00036846.2022.2095342
Long, S., Li, J., and Luo, T. (2023). The asymmetric impact of global economic policy uncertainty on international grain prices. J. Commod. Mark. 30:100273. doi: 10.1016/j.jcomm.2022.100273
Long, S., and Zhang, R. (2022). The asymmetric effects of international oil prices, oil price uncertainty and income on urban residents’ consumption in China. Econ. Anal. Policy 74, 789–805. doi: 10.1016/j.eap.2022.04.008
Lucotte, Y. (2016). Co-movements between crude oil and food prices: a post-commodity boom perspective. Econ. Lett. 147, 142–147. doi: 10.1016/j.econlet.2016.08.032
Luo, J., and Ji, Q. (2018). High-frequency volatility connectedness between the US crude oil market and China's agricultural commodity markets. Energy Econ. 76, 424–438. doi: 10.1016/j.eneco.2018.10.031
Ma, Y.-r., Ji, Q., and Pan, J. (2019). Oil financialization and volatility forecast: evidence from multidimensional predictors. J. Forecast. 38, 564–581. doi: 10.1002/for.2577
Ma, K., and Zhao, L. (2024). The impact of new energy transportation means on China’s food import. Res. Transp. Econ. 103:101386. doi: 10.1016/j.retrec.2023.101386
Mayer, A., Wied, D., and Troster, V. (2025). Quantile granger causality in the presence of instability. J. Econom. 249:105992. doi: 10.1016/j.jeconom.2025.105992
Mensi, W., Rehman, W. U., Gok, R., Gemici, E., and Vo, X. V. (2025). Risk spillovers and diversification benefits between crude oil and agricultural commodity futures markets. Res. Int. Bus. Finance 73:102579. doi: 10.1016/j.ribaf.2024.102579
Mensi, W., Tiwari, A., Bouri, E., Roubaud, D., and Al-Yahyaee, K. H. (2017). The dependence structure across oil, wheat, and corn: a wavelet-based copula approach using implied volatility indexes. Energy Econ. 66, 122–139. doi: 10.1016/j.eneco.2017.06.007
Mokni, K., and Ben-Salha, O. (2020). Asymmetric causality in quantiles analysis of the oil-food nexus since the 1960s. Resour. Policy 69:101874. doi: 10.1016/j.resourpol.2020.101874
Naeem, M. A., Hasan, M., Arif, M., Suleman, M. T., and Kang, S. H. (2022). Oil and gold as a hedge and safe-haven for metals and agricultural commodities with portfolio implications. Energy Econ. 105:105758. doi: 10.1016/j.eneco.2021.105758
Pan, C., Huang, Y., and Lee, C. (2024). The dynamic effects of oil supply shock on China: evidence from the TVP-proxy-VAR approach. Socio Econ. Plan. Sci. 95:102026. doi: 10.1016/j.seps.2024.102026
Platania, F., Hernandez, C. T., and Arreola, F. (2022). Social media communication during natural disasters and the impact on the agricultural market. Technol. Forecast. Soc. Change 179:121594. doi: 10.1016/j.techfore.2022.121594
Qiu, C., Colson, G., Escalante, C., and Wetzstein, M. (2012). Considering macroeconomic indicators in the food before fuel nexus. Energy Econ. 34, 2021–2028. doi: 10.1016/j.eneco.2012.08.018
Rajput, H., Changotra, R., Rajput, P., Gautam, S., Gollakota, A. R. K., and Arora, A. S. (2021). A shock like no other: coronavirus rattles commodity markets. Environ. Dev. Sustain. 23, 6564–6575. doi: 10.1007/s10668-020-00934-4
Raza, S. A., Guesmi, K., Belaid, F., and Shah, N. (2022). Time-frequency causality and connectedness between oil price shocks and the world food prices. Res. Int. Bus. Finance 62:101730. doi: 10.1016/j.ribaf.2022.101730
Reboredo, J. C. (2012). Do food and oil prices co-move? Energy Policy 49, 456–467. doi: 10.1016/j.enpol.2012.06.035
Rehman, M. U. (2018). Do oil shocks predict economic policy uncertainty? Physica A 498, 123–136. doi: 10.1016/j.physa.2017.12.133
Ren, Y., Tan, A., Zhu, H., and Zhao, W. (2022). Does economic policy uncertainty drive nonlinear risk spillover in the commodity futures market? Int. Rev. Financ. Anal. 81:102084. doi: 10.1016/j.irfa.2022.102084
Samarakoon, S., and Pradhan, R. P. (2026). How do return and volatility spillovers shape futures markets? Insights from index, commodity, and carbon emission futures. Renew. Energy 256:124110. doi: 10.1016/j.renene.2025.124110
Shahbaz, M., Sharif, A., Belaid, F., and Vo, X. V. (2023). Long-run co-variability between oil prices and economic policy uncertainty. Int. J. Financ. Econ. 28, 1308–1326. doi: 10.1002/ijfe.2478
Shahzad, S. J. H., Bouri, E., Kristoufek, L., and Saeed, T. (2021b). Impact of the COVID-19 outbreak on the US equity sectors: evidence from quantile return spillovers. Financ. Innov. 7:14. doi: 10.1186/s40854-021-00228-2
Shahzad, S. J. H., Ferrer, R., Ballester, L., and Umar, Z. (2017). Risk transmission between Islamic and conventional stock markets: a return and volatility spillover analysis. Int. Rev. Financ. Anal. 52, 9–26. doi: 10.1016/j.irfa.2017.04.005
Shahzad, S. J. H., Gupta, R., Demirer, R., and Pierdzioch, C. (2021a). Oil shocks and directional predictability of macroeconomic uncertainties of developed economies: evidence from high-frequency data. Scot. J. Polit. Econ. 69, 169–185. doi: 10.1111/sjpe.12280
Song, L., Tian, G., and Jiang, Y. (2022). Connectedness of commodity, exchange rate and categorical economic policy uncertainties-evidence from China. N. Am. J. Econ. Finance 60:101656. doi: 10.1016/j.najef.2022.101656
Su, F., Chen, S., and Fahad, S. (2023). Towards the impact of economic policy uncertainty on food security: introducing a comprehensive heterogeneous framework for assessment. J. Clean. Prod. 386:135792. doi: 10.1016/j.jclepro.2022.135792
Su, C.-W., Wang, X.-Q., Tao, R., and Oana-Ramona, L. (2019). Do oil prices drive agricultural commodity prices? Further evidence in a global bio-energy context. Energy 172, 691–701. doi: 10.1016/j.energy.2019.02.028
Sun, X., Chen, X., Wang, J., and Li, J. (2020). Multi-scale interactions between economic policy uncertainty and oil prices in time-frequency domains. N. Am. J. Econ. Financ. 51:100854. doi: 10.1016/j.najef.2018.10.002
Sun, Y., Gao, P., Raza, S. A., Shah, N., and Sharif, A. (2023). The asymmetric effects of oil price shocks on the world food prices: fresh evidence from quantile-on-quantile regression approach. Energy 270:126812. doi: 10.1016/j.energy.2023.126812
Sun, D., Liu, Y., Grant, J., Long, Y., Wang, X., and Xie, C. (2021). Impact of food safety regulations on agricultural trade: evidence from China’s import refusal data. Food Policy 105:102185. doi: 10.1016/j.foodpol.2021.102185
Tiwari, A. K., Abakah, E. J. A., Adewuyi, A. O., and Lee, C.-C. (2022). Quantile risk spillovers between energy and agricultural commodity markets: evidence from pre and during COVID-19 outbreak. Energy Econ. 113:106235. doi: 10.1016/j.eneco.2022.106235
Trari-Medjaoui, H., and Mezouri, E. (2024). Asymmetric impacts of crude oil Price on agricultural commodities during the Russian-Ukrainian crisis. Int. J. Finance 37, 21–39.
Tunc, A., Kocoglu, M., and Aslan, A. (2022). Time-varying characteristics of the simultaneous interactions between economic uncertainty, international oil prices and GDP: a novel approach for Germany. Resour. Policy 77:102658. doi: 10.1016/j.resourpol.2022.102658
Umar, Z., Jareño, F., and Escribano, A. (2021). Agricultural commodity markets and oil prices: an analysis of the dynamic return and volatility connectedness. Resour. Policy 73:102147. doi: 10.1016/j.resourpol.2021.102147
Wang, K. (2024). Economic policy uncertainty and green finance: evidence from frequency and quantile aspects. Econ. Change Restruct. 57:1. doi: 10.1007/s10644-024-09579-z
Wang, Y., Cheng, S., and Cao, Y. (2022a). How does economic policy uncertainty respond to the global oil price fluctuations? Evidence from BRICS countries. Resourc. Policy 79:103025. doi: 10.1016/j.resourpol.2022.103025
Wang, L., Duan, W., Qu, D., and Wang, S. (2017). What matters for global food price volatility? Empir. Econ. 54, 1549–1572. doi: 10.1007/s00181-017-1311-9
Wang, K., Jiang, X., and Li, X. (2025b). Digital revolution meets ESG: can AI, blockchain and cloud computing enhance ESG performance? Oecon. Copernic. 16, 593–641. doi: 10.24136/oc.3629
Wang, E. Z., Lee, C.-C., and Li, Y. (2022). Assessing the impact of industrial robots on manufacturing energy intensity in 38 countries. Energy Econ. 105:105748. doi: 10.1016/j.eneco.2021.105748
Wang, K., Li, S., Lobonţ, O., and Moldovan, N. (2025a). Is green innovation the “Golden ticket” in achieving energy security and sustainable development? Econ. Anal. Policy 87, 297–314. doi: 10.1016/j.eap.2025.06.016
Wang, X., and Shi, B. (2022). Transmission and diffusion effect of Sino-US trade friction along global value chains. Financ. Res. Lett. 46:102057. doi: 10.1016/j.frl.2021.102057
Wang, K., Su, C., Umar, M., and Lobont, O. (2023). Oil price shocks, economic policy uncertainty and green finance: a case of China. Technol. Econ. Dev. Econ. 29, 500–517. doi: 10.3846/tede.2022.17999
Wang, K. H., Su, C. W., Xiao, Y., and Liu, L. (2022). Is the oil price a barometer of China's automobile market? From a wavelet-based quantile-on-quantile regression perspective. Energy 240:122501. doi: 10.1016/j.energy.2021.122501
Wang, K., Umar, M., Akram, R., and Caglar, E. (2021). Is technological innovation making world “greener”? An evidence from changing growth story of China. Technol. Forecast. Soc. Change 165:120516. doi: 10.1016/j.techfore.2020.120516
Wang, X., Wang, K., Safi, A., and Umar, M. (2025). How is artificial intelligence technology transforming energy security? New evidence from global supply chains. Oecon. Copern. 16, 15–38. doi: 10.24136/oc.3488
Wang, Y., Wei, M., Bashir, U., and Zhou, C. (2022b). Geopolitical risk, economic policy uncertainty and global oil price volatility - an empirical study based on quantile causality nonparametric test and wavelet coherence. Energy Strateg. Rev. 41:100851. doi: 10.1016/j.esr.2022.100851
Wang, K., Wen, C., Xu, B., and Li, X. (2024). Receiver or transmitter? Unlocking the role of green technology innovation in sustainable development, energy, and carbon markets. Technol. Soc. 79:102703. doi: 10.1016/j.techsoc.2024.102703
Wei, Y., Qiu, F., An, H., Zhang, X., Li, C., and Guo, X. (2024). Exogenous oil supply shocks and global agricultural commodity prices: the role of biofuels. Int. Rev. Econ. Finance 92, 394–414. doi: 10.1016/j.iref.2024.02.011
Wen, J., Khalid, S., Mahmood, H., and Zakaria, M. (2021). Symmetric and asymmetric impact of economic policy uncertainty on food prices in China: a new evidence. Resour. Policy 74:102247. doi: 10.1016/j.resourpol.2021.102247
Wu, X., Cui, H., and Wang, L. (2023). Forecasting oil futures price volatility with economic policy uncertainty: a CARR-MIDAS model. Appl. Econ. Lett. 30, 120–125. doi: 10.1080/13504851.2021.1977232
Xiang, Y., and Borjigin, S. (2024). High–low volatility spillover network between economic policy uncertainty and commodity futures markets. J. Futures Mark. 44, 1295–1319. doi: 10.1002/fut.22511
Xiao, X., Tian, Q., Hou, S., and Li, C. (2019). Economic policy uncertainty and grain futures price volatility: evidence from China. China Agric. Econ. Rev. 11, 642–654. doi: 10.1108/CAER-11-2018-0224
Yan, W., and Cheung, A. (2024). Connectedness among Chinese climate policy uncertainty, exchange rate, Chinese and international crude oil markets: insights from time and frequency domain analyses of high order moments. N. Am. J. Econ. Financ. 73:102175. doi: 10.1016/j.najef.2024.102175
Yao, H., Zuo, X., Zuo, D., Lin, H., Huang, X., and Zang, C. (2020). Study on soybean potential productivity and food security in China under the influence of COVID-19 outbreak. Geogr. Sustain. 1, 163–171. doi: 10.1016/j.geosus.2020.06.002
Yu, M., Fan, J., Wang, H., and Wang, J. (2023). US trade policy uncertainty on Chinese agricultural imports and exports: an aggregate and product-level analysis. Int. Rev. Econ. Finance 84, 70–83. doi: 10.1016/j.iref.2022.10.018
Zaghdoudi, T., Tissaoui, K., Maaloul, M. H., Bahou, Y., and Kammoun, N. (2023). Asymmetric connectedness between oil price, coal and renewable energy consumption in China: evidence from Fourier NARDL approach. Energy 285:129416. doi: 10.1016/j.energy.2023.129416
Zakaria, M., Khiam, S., and Mahmood, H. (2021). Influence of oil prices on inflation in South Asia: some new evidence. Resour. Policy 71:102014. doi: 10.1016/j.resourpol.2021.102014
Zeng, H., Xu, W., and Lu, R. (2024). Quantile frequency connectedness between crude oil volatility, geopolitical risk and major agriculture and livestock markets. Appl. Econ. 57, 3345–3360. doi: 10.1080/00036846.2024.2337778
Zhang, Z., Brizmohun, R., Li, G., and Wang, P. (2022). Does economic policy uncertainty undermine stability of agricultural imports? Evidence from China. PLoS One 17:e0265279. doi: 10.1371/journal.pone.0265279
Zhang, Y., He, M., Wang, Y., and Liang, C. (2023). Global economic policy uncertainty aligned: an informative predictor for crude oil market volatility. Int. J. Forecast. 39, 1318–1332. doi: 10.1016/j.ijforecast.2022.07.002
Zhang, D., Lei, L., Ji, Q., and Kutan, A. M. (2019). Economic policy uncertainty in the US and China and their impact on the global markets. Econ. Model. 79, 47–56. doi: 10.1016/J.ECONMOD.2018.09.028
Zhou, J., Li, Z., and Liu, Z. (2025). Oil market uncertainty and China’s macroeconomy: causality-in-quantiles test and quantile spillover effects analysis. Energy Econ. 148:108618. doi: 10.1016/j.eneco.2025.108618
Zhou, Y., Liu, Z., and Wu, S. (2022). The global economic policy uncertainty spillover analysis: in the background of COVID-19 pandemic. Res. Int. Bus. Financ. 61:101666. doi: 10.1016/j.ribaf.2022.101666
Zhu, H., Chen, Y., Ren, Y., Xing, Z., and Hau, L. (2022). Time-frequency causality and dependence structure between crude oil, EPU and Chinese industry stock: evidence from multiscale quantile perspectives. N. Am. J. Econ. Financ. 61:101698. doi: 10.1016/j.najef.2022.101698
Keywords: agricultural commodity price, crude oil price, economic policy uncertainty, quantile connectedness, quantile spillover
Citation: Song Y, Wang K-H, Liu H-W and Moldovan N-C (2025) Mapping China’s triple interlinkage: a quantile connectedness analysis of agricultural, energy, and policy shocks. Front. Sustain. Food Syst. 9:1630441. doi: 10.3389/fsufs.2025.1630441
Edited by:
Michal Dominik Stasiak, Poznań University of Economics and Business, PolandReviewed by:
Żaneta Kinga Staszak, Politechnika Poznanska, PolandHarish Nayak G. H., University of Agricultural Sciences, India
Copyright © 2025 Song, Wang, Liu and Moldovan. This is an open-access article distributed under the terms of the Creative Commons Attribution License (CC BY). The use, distribution or reproduction in other forums is permitted, provided the original author(s) and the copyright owner(s) are credited and that the original publication in this journal is cited, in accordance with accepted academic practice. No use, distribution or reproduction is permitted which does not comply with these terms.
*Correspondence: Kai-Hua Wang, d2FuZ2thaWh1YTIwMTNAMTYzLmNvbQ==