 Caixia Shangguan1†
 Ruijundi Ma1*†
 Yan Lu1Hui Zhang1Mingjin Tian1Yongzhong Teng1Li Jing1Xia Zhang1Hongbin Liu1Ke Li1Xingxing Mei2
- 1Institute of Agricultural Economics and Rural Development, Henan Academy of Agricultural Sciences, Zhengzhou, Henan, China
- 2School of Economics and Trade, Henan University of Animal Husbandry and Economy, Zhengzhou, Henan, China
Introduction: Grain production is an essential component in food security and plays a key role in environmental sustainability. However, a significant gap remains in understanding the evolutionary trends of sustainable, stable, and green grain production, as well as the key obstacle factors in different regions hindering their achievement. This study contributes by refining the conceptualization of these three dimensions through the lens of coordinated development and by constructing a composite index system tailored to China’s agricultural context. Specifically, it offers a quantitative assessment of grain production performance for China, identifies structural and obstacle factors by regional spatiotemporal analysis.
Methods: This study explores the spatiotemporal evolution of grain production in China from 2000 to 2022, focusing on sustainable, stable and green levels, while identifying key obstacle factors at each stage. An index system was constructed based on three subsystems: sustainable, stable, and green production. The entropy-weighted TOPSIS method and the obstacle degree model were employed to assess production levels and determine critical constraints, while ArcGIS was used to visualize the spatial distribution across China’s nine major agricultural regions.
Results: The results reveal that Grain production followed a development trend of initial decline, slow recovery, and rapid growth, with significant differences in the subsystems. The sustainable production index showed an upward trend, while the stable production index fluctuated between decline and rise. The green production index experienced rapid decline, followed by stable fluctuations and subsequent rapid growth. Spatiotemporal analysis revealed a clear northward shift in comprehensive grain production levels, indicating a “northward expansion and southward retreat” pattern from 2000 to 2022. The dynamic evolution of obstacle factors from 2000 to 2022 reveals the deep contradictions and challenges faced by China’s sustainable and stable green grain production. Regionally, barriers have shifted from reliance on fiscal support to greater emphasis on local fiscal capacity and resource efficiency.
Discussion: Based on existing literature, theoretical analysis, and empirical results, this study proposes policy recommendations including improving yield per unit area and the innovation of scale operation, promoting integrated regional development through a high-quality grain industry model, and advancing digital empowerment and financial coordination to support the full production cycle. This study provides valuable insights for strengthening the foundation of national food security comprehensively and strategically.
1 Introduction
Sustainable, stable, and green grain production forms the foundation for ensuring a steady and secure supply of essential agricultural products. Although China’s grain output reached 695 million tons in 2023 and surpassed the 700-million-ton milestone in 2024, grain production has entered a period marked by increasing uncertainty and unpredictability. This phase is characterized by several pressing challenges: the tension between limited potential for enhancing grain production capacity and the rigidly growing demand; the mismatch between the quality of grain varieties and the evolving consumption patterns of the population; low production efficiency versus the need to incentivize producers; the need to balance grain production with that of other agricultural product; and the conflict between spatiotemporal distribution of grain production and the sustainable utilization of resources and the environment (Li W. et al., 2024; Li Y. et al., 2024; Yu et al., 2019). Consequently, it is crucial to evaluate the levels of sustainable, stable, and green grain production in China and identify the influencing factors of obstacles, which provide valuable insights for strengthening the foundation of national food security comprehensively and strategically.
This paper examines grain production from three critical dimensions: sustainability, stability, and green. Recent research on grain production sustainability emphasizes the integration of economic efficiency, environmental responsibility, and social wellbeing, where approaches such as total factor productivity (TFP) analysis and low-carbon strategies have been used to evaluate the impact of carbon emissions in grain systems (Wang et al., 2025). Agricultural productive services and the efficient use of water and soil resources are also identified as essential to improving farm profitability and sustainable resource use, particularly in regions like Northeast China (Han et al., 2024; Zhang F. et al., 2023; Zhang H. et al., 2023). Maintaining soil fertility and nutrient balance is consistently underscored as critical to meeting future demands for food, fiber, and energy (Harries et al., 2021; Anghinoni et al., 2021), reinforcing the argument for a holistic, systems-based approach to sustainability that encompasses both environmental protection and economic viability (Purvis et al., 2019). In parallel, research on the stability of grain production examines how institutional and environmental factors influence the consistency of grain output. Studies have shown that land consolidation policies, when tailored to regional crop characteristics, can significantly enhance production stability (Xie et al., 2020). Moreover, investments in storage technology, training, and pest management are essential for reducing post-harvest losses and ensuring long-term food security (Tushar et al., 2023; Coradi and Lemes, 2018). Economic instruments such as grain subsidies also play a stabilizing role, while empirical evidence suggests that higher productivity is associated with more stable yields, indicating a synergy between production efficiency and resilience (Raseduzzaman and Jensen, 2017; Zhang et al., 2021) Green production research is increasingly recognized for reducing the environmental impact of grain production by focusing on environmentally friendly practices and technologies. Life cycle analysis and spatial emission modeling offer comprehensive assessments of the carbon intensity of grain production across China, providing a basis for identifying key emission drivers and guiding mitigation strategies (Zhang et al., 2017; Tian et al., 2021). Further, green efficiency models such as SBM highlight the role of technological progress and management innovation in improving green total factor productivity (Gong et al., 2023; Zhang F. et al., 2023; Zhang H. et al., 2023). The promotion of green technologies in areas such as seed development has been shown to lower carbon emissions while supporting overall productivity growth (Guo and Zhang, 2023). Collectively, the extensive literature on the sustainability, stability, and green of grain production underscores the necessity of integrating these dimensions into a unified, systematic evaluation framework to assess grain production performance.
According to the relevant theoretical research and the definition of food security by the International Food and Agriculture Organization, grain production is defined as a relative output capacity determined by a combination of policy and non-policy factors within a specific timeframe, region, and level of technological development (Li et al., 2014). Grain production is influenced by economic, structural, environmental, and technological factors. From an economic and structural perspective, eco-efficiency in grain production is closely associated with the level of economic development, the configuration of agricultural structures, the urban–rural income gap, and the distribution of labor (Li W. et al., 2024; Li Y. et al., 2024). Socioeconomic disparities across regions also play a critical role in shaping national grain policies and production geography, contributing to a northward shift in China’s grain-producing regions (Xue et al., 2024). Environmental constraints, particularly those driven by climate change, pose significant risks to grain production by affecting crop yields, planting structures, and water resource availability (Lu et al., 2019). The environmental efficiency of grain systems is further hindered by factors such as carbon emissions and pollution, while human capital, labor mobility, and technological advancement have been shown to enhance efficiency outcomes (Xu et al., 2021). Methodologically, life cycle assessments offer valuable tools for quantifying the environmental impact of grain production and guiding more sustainable practices (Roer et al., 2012). Technological innovation, particularly in the form of digital agriculture, is increasingly recognized as a driver of sustainable growth, improving production efficiency and promoting environmentally responsible farming systems (Wang et al., 2024). Moreover, spatiotemporal approaches have become central to agricultural research, enabling the assessment of both regional disparities and dynamic trends in productivity, land use, and sustainability. Temporal studies often employ time-series models and productivity indices to examine changes in efficiency and technological progress (Driscoll and Kraay, 1998; Shah et al., 2024). Spatial analyses, using GIS and spatial econometrics, reveal persistent inequalities in agricultural performance driven by ecological conditions, infrastructure gaps, and policy support (Zhan et al., 2025; Lang et al., 2025). Overall, these studies illustrate the multifaceted and dynamic nature of grain development, underscoring the need for integrated approaches that address both production capacity and ecological sustainability.
Existing research has developed multi-dimensional perspectives and systematic evaluation frameworks, providing valuable insights for this study. However, a significant gap remains in understanding the evolutionary trends of sustainable, stable, and green grain production, as well as the key obstacle factors in different regions hindering their achievement. This study contributes by refining the conceptualization of these three dimensions through the lens of coordinated development and by constructing a composite index system tailored to China’s agricultural context. Specifically, it offers a quantitative assessment of grain production performance for China, identifies structural and obstacle factors by regional spatiotemporal analysis, and proposes targeted strategies for improvement. The paper is structured as follows: Sections 2, 3 outline the conceptual framework and methodological approach, Sections 4, 5 present empirical findings and discuss the results, and Section 6 draws conclusions and provides policy implications. This study establishes a solid foundation for enhancing food security through a comprehensive and strategic approach.
2 Construction of the indicator system
Faced with significant farmland degradation, shortages of water and soil resources, and immense pressure on resources and the environment, it is crucial to ensure the sustainability, stability, and green development of grain production. Sustainability focuses on economic security, requiring policies that guarantee fair returns for producers and strengthen the economic capacity of major grain-producing regions, especially key counties, without limiting their development due to production responsibilities (Jiao et al., 2016). This dimension of sustainability encompasses three key aspects: financial support, grain production profitability, and local fiscal capacity. Financial support primarily refers to government investment in agriculture, which serves as a crucial foundation for sustainable grain production. Profitability of grain production can be measured by indicators such as the agricultural input price index, labor input and net profit per mu for four major grains (Volsi et al., 2022). These factors directly affect farmers’ income from grain cultivation. Among them, higher input prices and increased labor requirements tend to reduce profitability and are thus considered negative indicators. Local fiscal capacity refers to the level of fiscal revenue and expenditure at the county level in China (Zhang et al., 2021). Given China’s institutional context, county-level governments play an important role in regulating and supporting grain production through fiscal transfers and targeted subsidies. Stability represents supply security, requiring a domestic focus on balancing grain quantity, optimizing structure, and enhancing disaster resilience to achieve basic self-sufficiency in cereals and absolute security in staple grains (Xie et al., 2020). Specifically, the stability of grain quantity is assessed by indicators such as per capita grain availability, fluctuations in total grain output, and yield per unit area (Li W. et al., 2024; Li Y. et al., 2024). Structural stability is measured by the proportion of total cultivated land allocated to grain crops. Disaster resilience is evaluated by the proportion of yield loss caused by natural disasters, which reflects the extent to which agricultural production is affected (Tushar et al., 2023). External dependence is captured by the grain self-sufficiency rate, with a higher rate indicating greater stability. Among these factors, fluctuations in total output and the severity of disaster-induced losses exert a negative impact on grain stability and are consequently categorized as negative indicators. Green development prioritizes ecological security, promoting safe and nutritious grain production through resource-efficient and environmentally friendly practices to ensure long-term sustainability (Xu et al., 2025). Resource use efficiency is represented by indicators such as the cultivated land retention rate and the proportion of water-saving irrigation practices (Lu et al., 2024). Environmental security is evaluated based on the intensity of agricultural input use, with particular emphasis on the application rates of chemical fertilizers and pesticides per unit area. Given their potential to adversely affect environmental health, these inputs are categorized as negative indicators (Xu et al., 2021).
Based on the conceptual explanations above and following the principles of comprehensiveness, dynamism, operability, comparability, and data availability in selecting indicators, this study incorporates insights from existing research. It constructs an evaluation index system comprising three first-level indicators, nine second-level indicators, and 16 third-level indicators, as detailed in Table 1. The three first-level indicators are sustainable, stable, and green grain production. Sustainable production is assessed through financial support, profitability of grain production, and local fiscal capacity, with six indicators: government agricultural funding, agricultural input price index, labor input per mu for four major grains, net profit per mu, average fiscal revenue of the county, and average fiscal expenditure of the county. Stable production focuses on total quantity, structure, disaster resilience, and external dependence, measured by six indicators: per capita grain availability, fluctuation rate of total grain output, yield per unit area, proportion of grain planting area, proportion of crop yield reduction, and grain self-sufficiency rate. Green production emphasizes ecological security and resource conservation, measured by four indicators: fertilizer usage per unit area, pesticide usage per unit area, land retention rate, and the proportion of water-saving irrigation area.
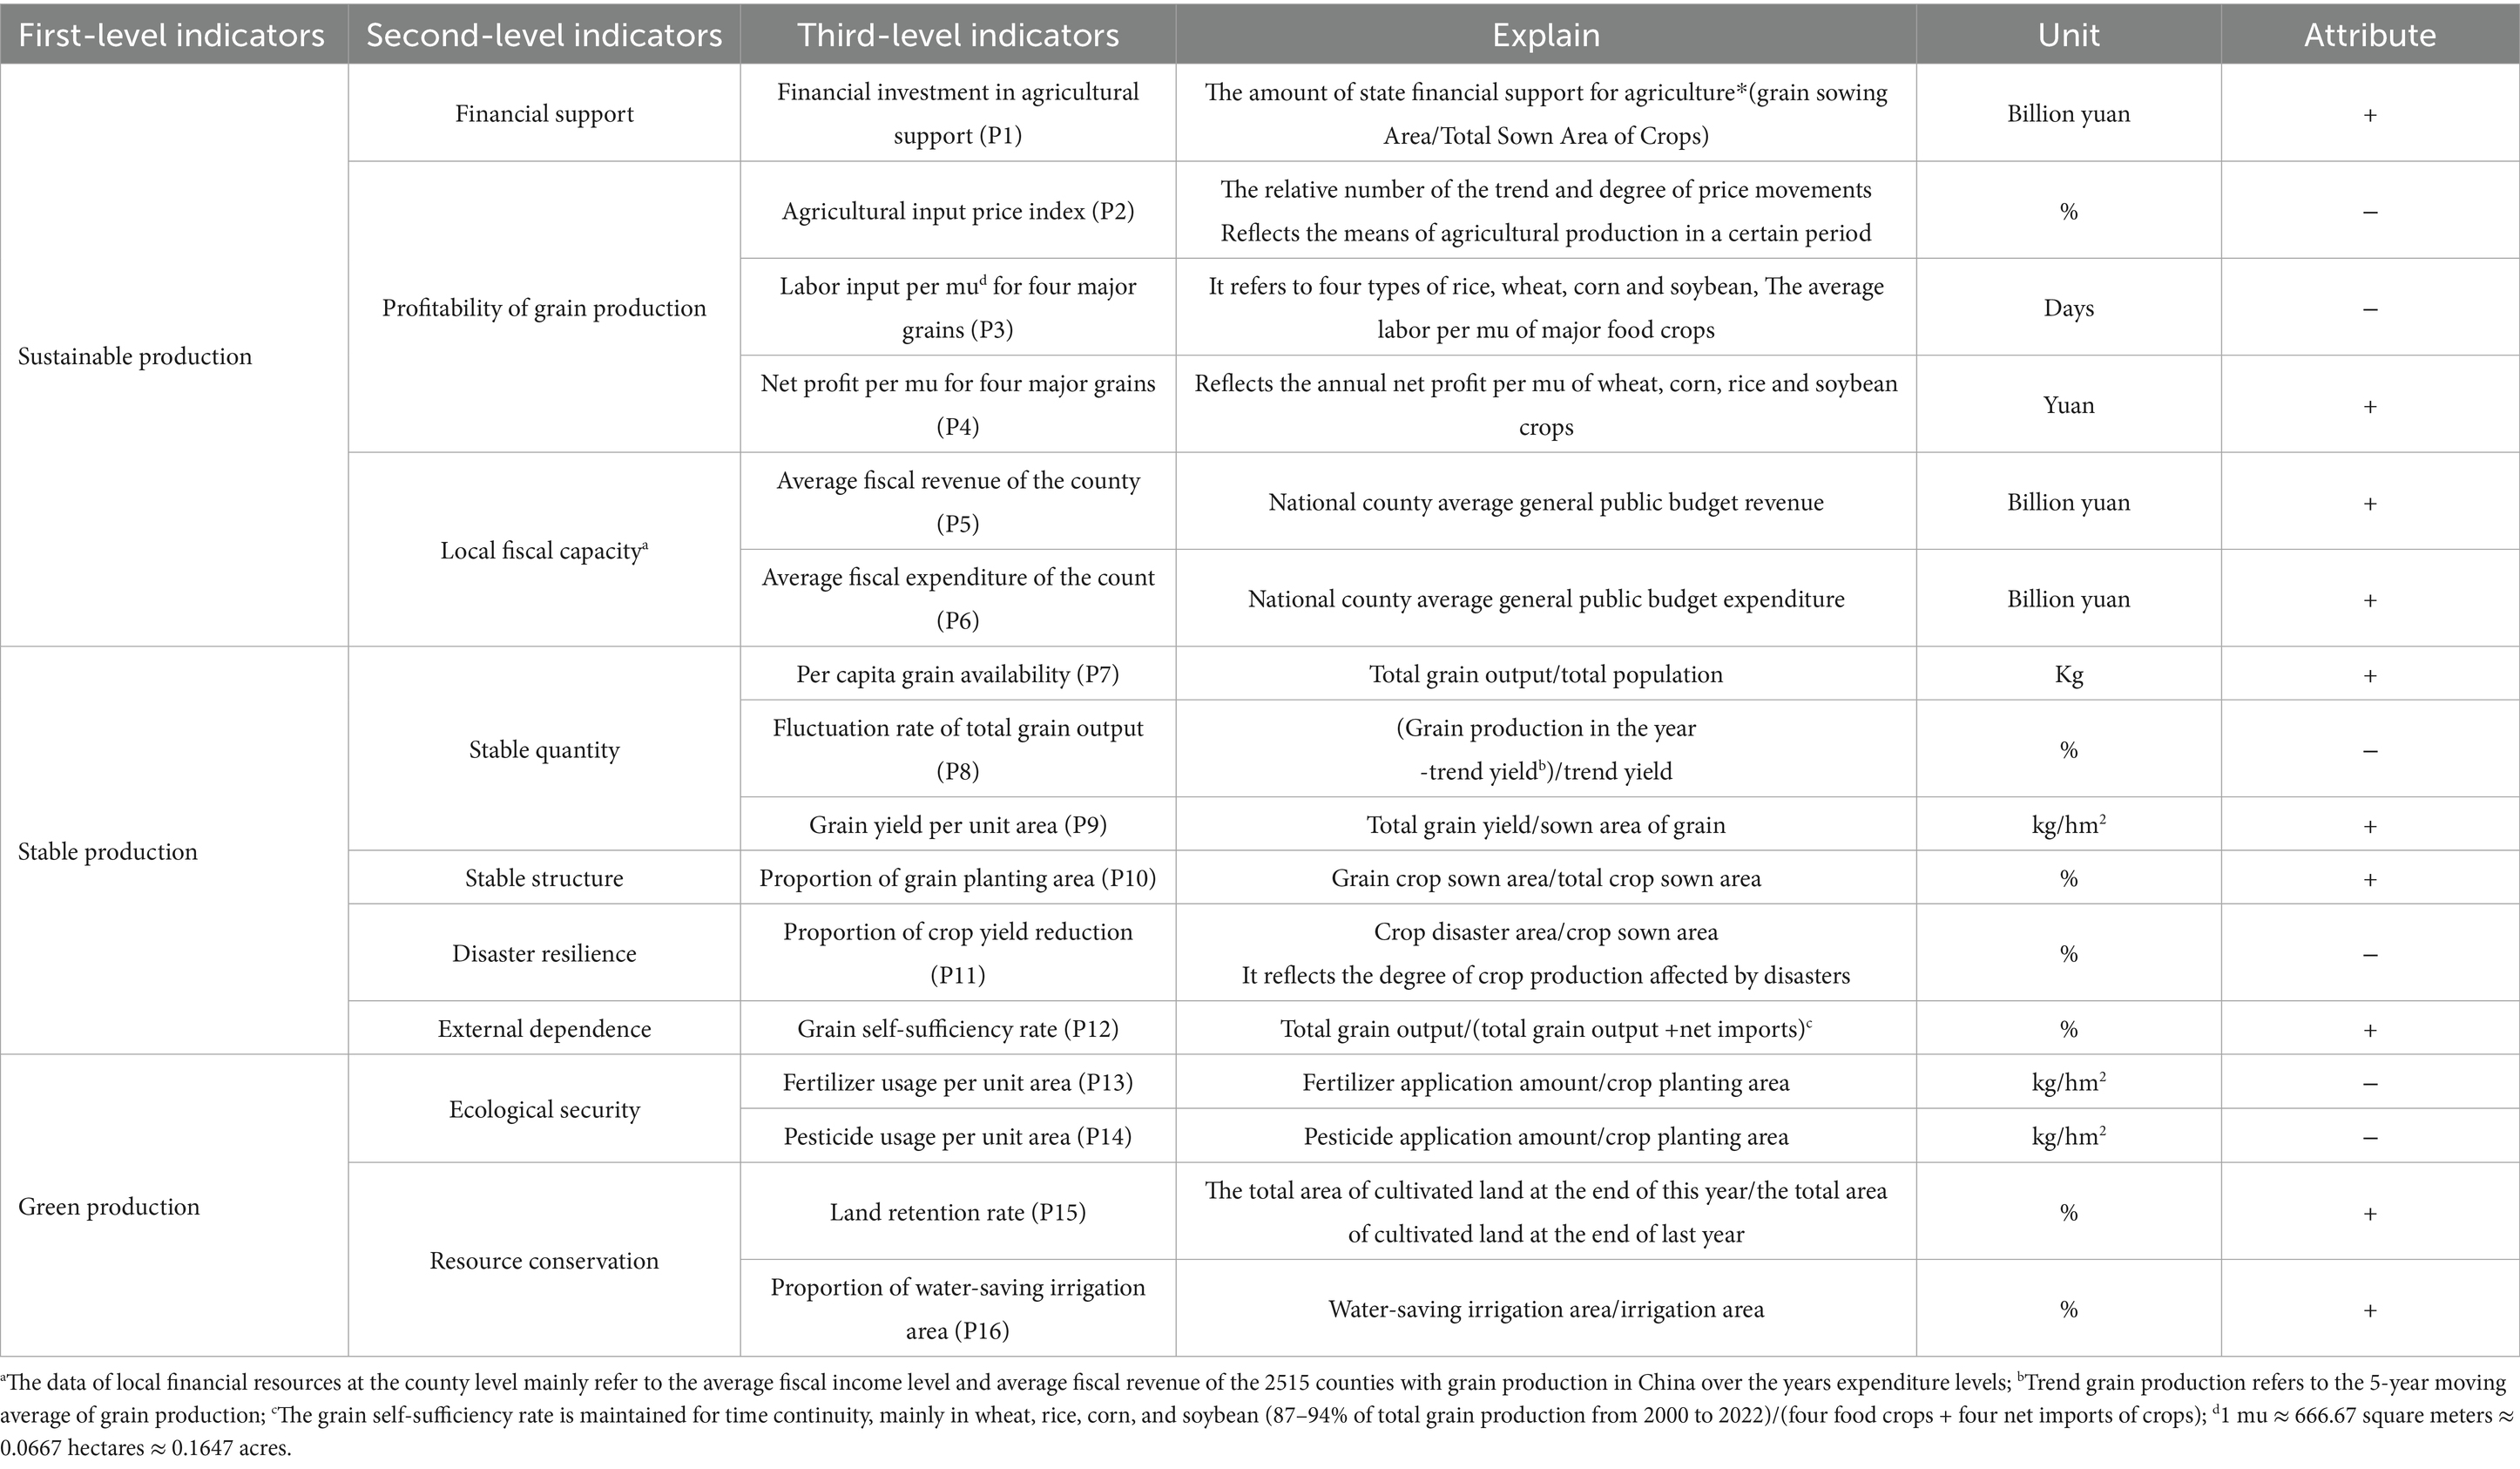
Table 1. Evaluation index system of sustainable and stable green grain production level.
3 Data collection and research methods
3.1 Data collection
The data utilized in this study covers the period from 2000 to 2022, primarily sourced from the China Statistical Yearbook, China Rural Statistical Yearbook, Compilation of National Agricultural Product Cost and Return Data, China County (City) Socio-Economic Statistical Yearbook, CEI data and provincial statistical yearbooks. Import and export data for wheat, rice, corn, and soybeans are obtained from the Food and Agriculture Organization (FAO) database. Linear interpolation was employed to address missing data (Jin et al., 2024). In addition, based on the Comprehensive Agricultural Regionalization of China formulated by the National Agricultural Regionalization Committee, China is divided into nine major agricultural regions (excluding Hong Kong, Macau and Taiwan): the Northern Arid and Semi-Arid Region (NASAR), the Northeast China Plain (NCP), the Yunnan-Guizhou Plateau (YGP), Southern China (SC), the Sichuan Basin and surrounding areas (SBSR), the Middle-Lower Yangtze Plain (MLYP), the Qinghai-Tibet Plateau (QTP), the Loess Plateau (LP), and the Huang-Huai-Hai Plain (HHHP).
3.2 Research methods
This part describes entropy weight method, TOPSIS model and diagnostic model of obstacle factors to measure the grain production levels and obstacle factors in China.
3.2.1 Entropy weight method
The entropy method is used to measure the weight of the index of sustainable and stable green production level of grain, mainly because the influence of subjective factors can be eliminated, and then the index weight is objectively assigned according to the information entropy. Considering the inconsistency of the measurement units of the indicators, the indicators were standardized before calculation, and the positive and negative indicators were treated with a non-negative treatment of 0.01 (Xiong et al., 2024), and the index weights were calculated according to the contribution, entropy and difference coefficient of the indicators. The details are as follows:
Forward indicator:
Negative indicator:
In the above formula (Equations 1–6), is the value of the jth indicator for the ith evaluated subject after processing. Pij is the weight (contribution) of the ith evaluator under the jth indicator. ej and gj are the entropy and the difference coefficient of the jth indicator. wj is the weight of the jth indicator accounts for all indicators.
3.2.2 Entropy-weighted TOPSIS model
The TOPSIS (Technique for Order Preference by Similarity to Ideal Solution) model offers clear advantages in multi-criteria decision-making, particularly its intuitive geometric interpretation of measuring alternatives’ relative closeness to both positive and negative ideal solutions. Its computational simplicity, transparent ranking logic, and ability to handle both quantitative and qualitative data make it widely applicable in fields such as supply chain evaluation and policy analysis. However, the model has notable limitations: its results are sensitive to subjective weight assignments and normalization methods, potentially introducing bias. The reliance on Euclidean distance also overlooks interdependencies among criteria, while the linearity assumption may not hold for complex nonlinear relationships. Despite these constraints, when calibrated adequately with robust weighting schemes and preprocessing steps, TOPSIS remains a valuable tool for comparative assessment of finite alternatives under multiple conflicting criteria (dos Santos et al., 2019; Çelikbilek and Tüysüz, 2020).
By establishing a weighted decision evaluation matrix to determine the positive and negative ideal solutions of each indicator, calculate the distance from the sustained and stable green production level of grain to the best state and the worst state in each year, and finally calculate the sticking progress, characterize the proximity of the grain sustained and stable green production goal to the optimal plan, the value is between [0,1], and the larger the value, the closer the sustained and stable green production level of grain is to the optimal level.
In the above formula (Equations 7–12), is the weighted decision evaluation matrix, and are the best and worst states of all indicators, and are the distance of each year’s value to the best state and the worst state, Tj is the post progress.
3.2.3 Diagnostic model of obstacle factors
The diagnostic model of obstacle factors for sustainable and stable green production of grain is the ratio of the deviation of each index and the contribution of the factor to the total target. The factor contribution degree indicates the contribution of a single indicator to the overall goal (sustained and stable green production of grain), which is generally expressed by the weight of the index, and the deviation degree of the indicator is the difference between the optimal target value of sustained and stable green production of grain and the actual value of each index. The degree of obstacle indicates the degree of impact of each indicator on the sustained and stable green production of grain, and the specific calculation formula is as follows:
In the above formula (Equation 13), Ii is the indicator deviation, where . is the weight of each indicator.
4 Spatiotemporal evolution analysis of grain production levels
This study applies the entropy-weighted TOPSIS model to calculate the progress scores of the overall level of sustainable and stable grain production from 2000 to 2022, as well as the progress scores for the three subsystems: sustainable production, stable production, and green production, as shown in Figure 1. To investigate the spatiotemporal evolution of grain production levels in China, data from 2000, 2010, 2015, and 2022 were selected as representative time points. The comprehensive grain production levels were classified using the Natural Breaks (Jenks) method in ArcGIS, resulting in four categories: low-value areas, medium-value areas, medium–high-value areas, and high-value areas, as illustrated in Figure 2.
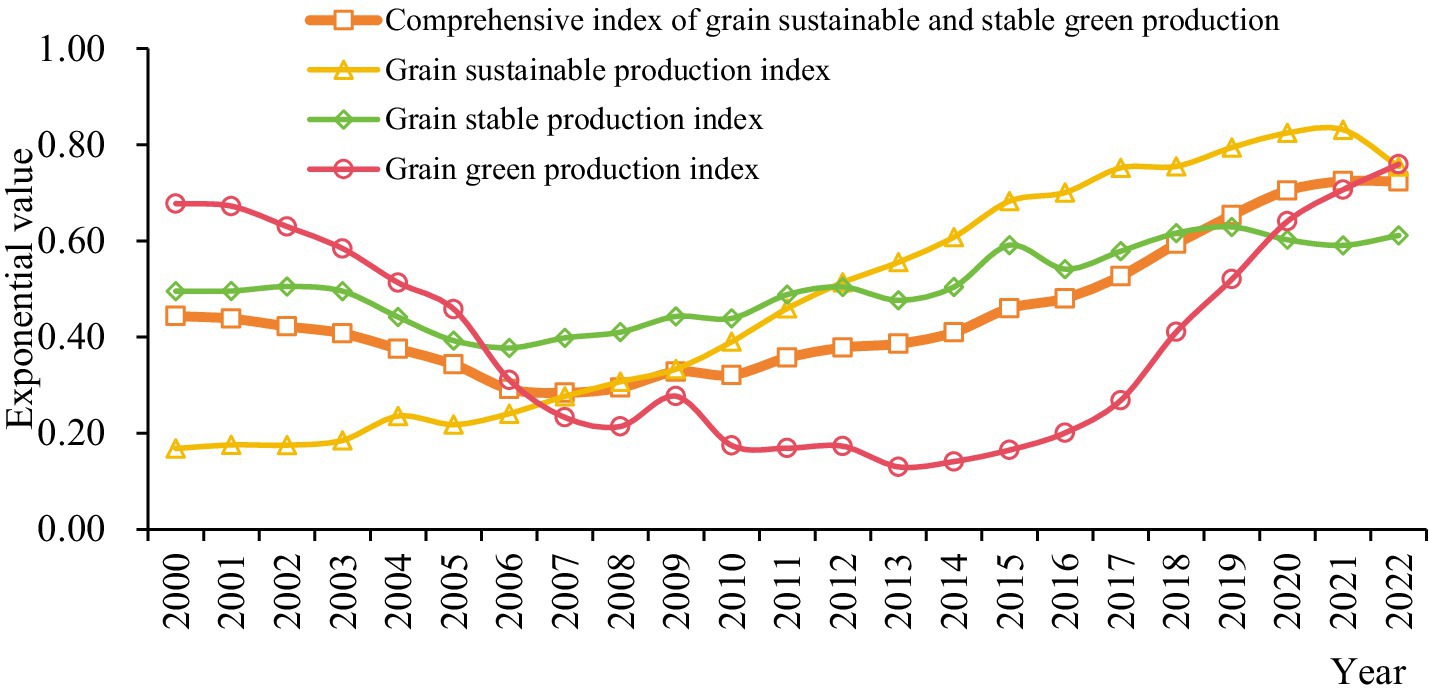
Figure 1. The trend of grain sustainable and stable green production comprehensive index and each subsystem index.
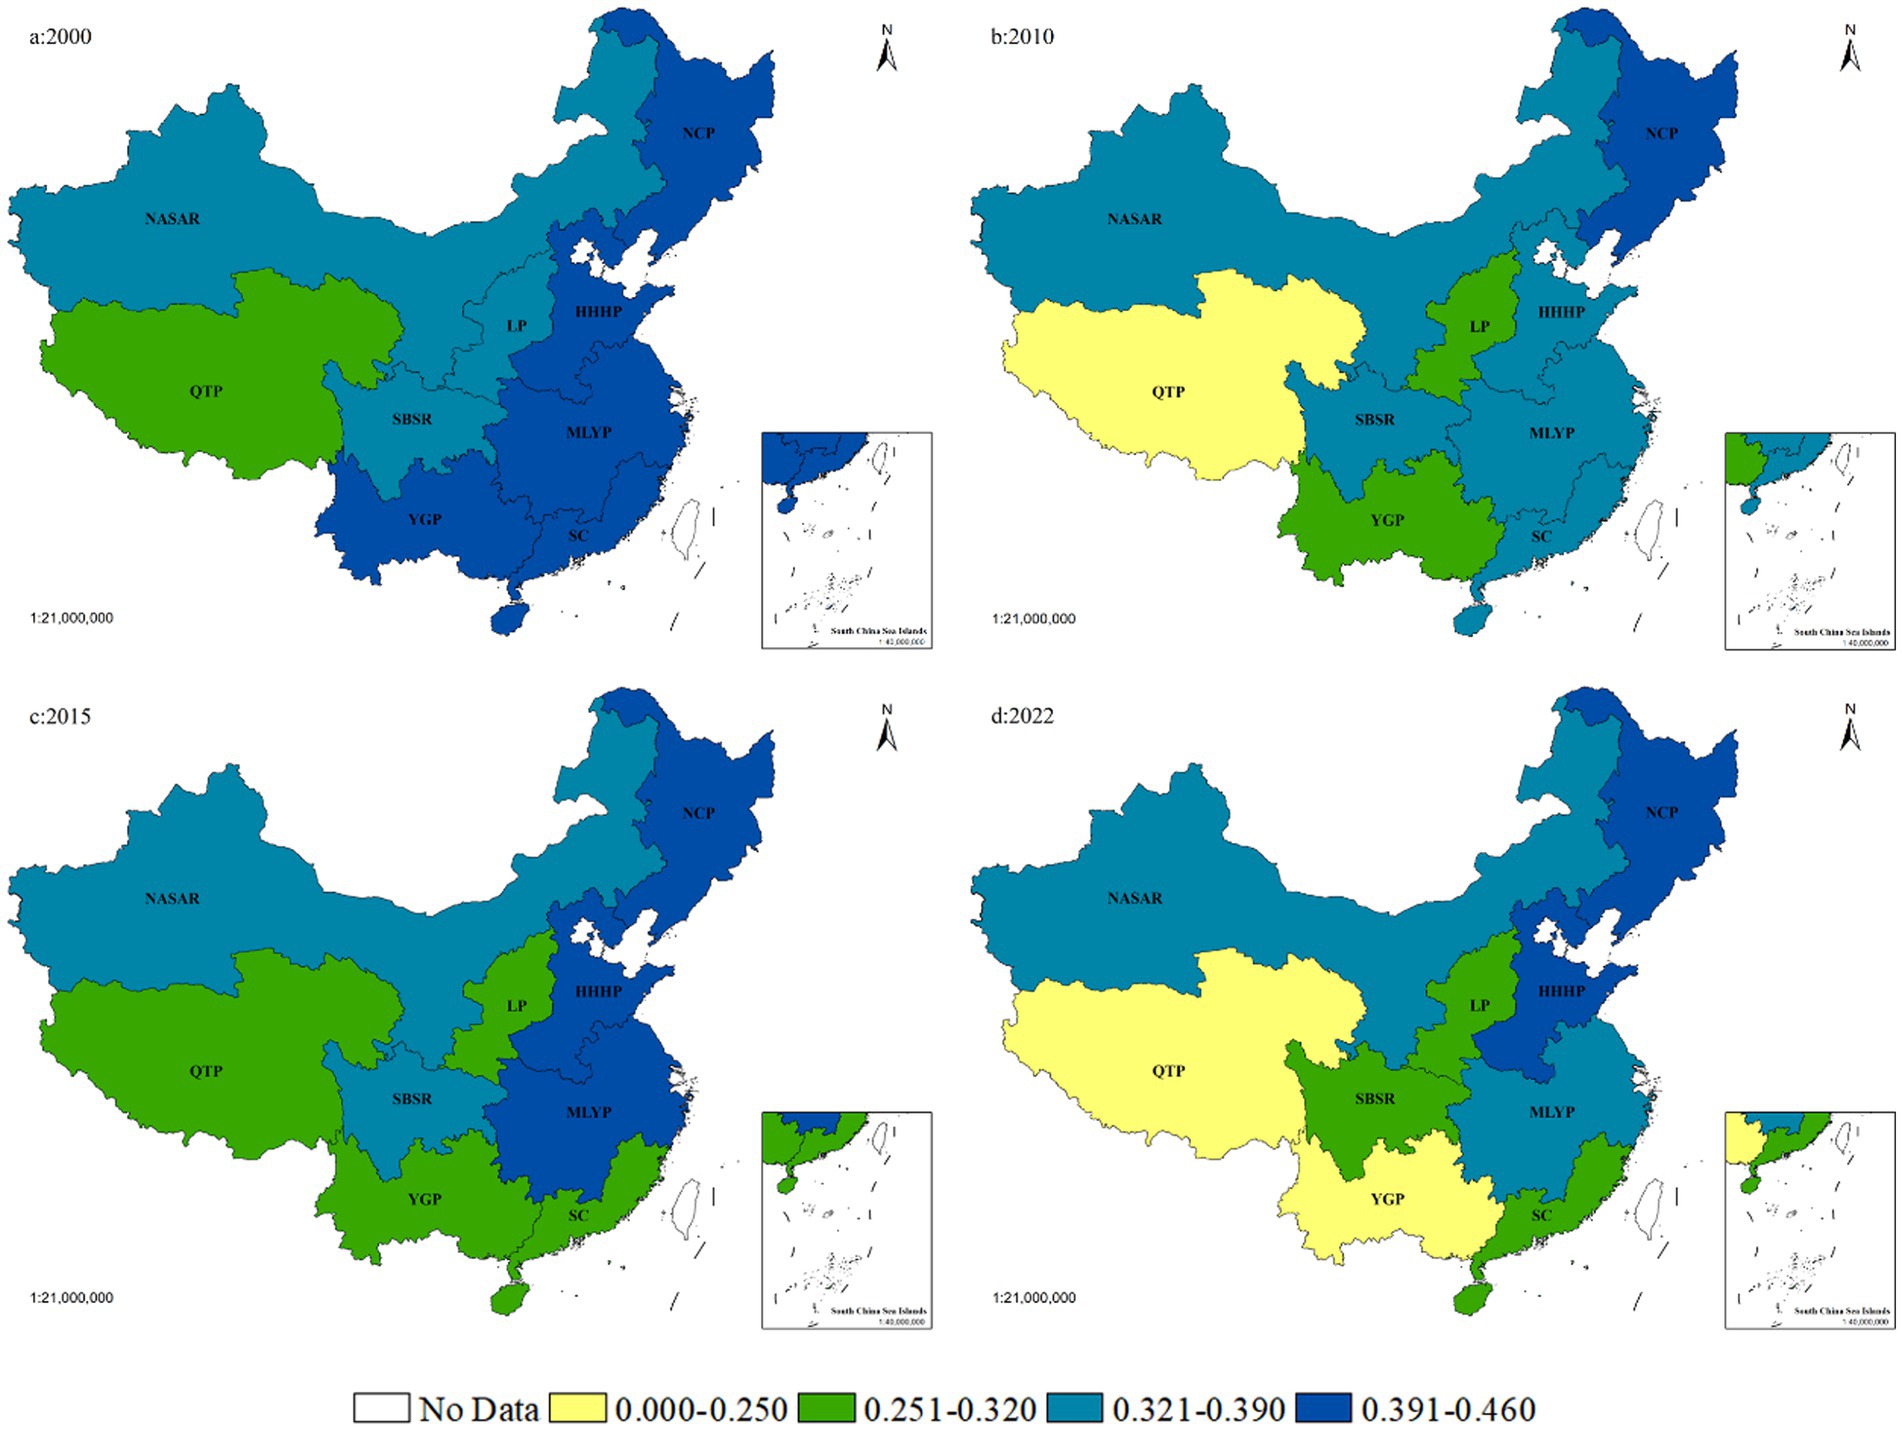
Figure 2. The evolution of spatial and temporal patterns of comprehensive grain production levels in nine major agricultural regions of China. (i) Map base derived from the Standard Map GS (2024)0650, Ministry of Natural Resources of China. (ii) The boundaries have not been modified.
4.1 Temporal evolution analysis of the comprehensive grain production index
From the perspective of trend analysis, the level of sustainable, stable, and green grain production in China exhibits a development pattern characterized by an initial decline, followed by a gradual increase, and then a rapid rise. This process can be divided into three distinct stages: rapid decline stage (2000–2007), slow recovery stage (2008–2013) and rapid growth stage (2014–2022).
During the rapid decline stage, the comprehensive index of sustainable and stable green grain production steadily declined from 0.44 to 0.28, with an average annual decrease of 6.17%. This trend occurred primarily during a phase when China’s food security policy prioritized grain output and farmers’ income, while placing relatively less emphasis on resource and environmental constraints. As the price of agricultural inputs continued to rise rapidly, using the year 2000 as the base, the price index had climbed to 132.23 by 2007, meanwhile, confronted with a reduction in grain planting area and intensifying pressure to maintain self-sufficiency, producers compensated for resource limitations through heightened dependence on chemical fertilizers and pesticides, characterized by rising application rates per unit area. This resulted in considerable environmental degradation.
During the slow recovery stage, the comprehensive index of sustainable and stable green grain production increased gradually from 0.29 to 0.39, with an average annual growth rate of 5.55%. This improvement primarily reflected the shift in national policy priorities amid the global food price crisis, which prioritized the security of grain supply quantity. Policy efforts focused on stimulating production enthusiasm, stabilizing sown areas, and increasing yield per unit area, yielding significant results. Specifically, per capita grain availability rose from 403.38 kg to 462.49 kg, and total grain output increased from 528.7 million tons to 630.5 million tons. However, this rapid quantitative growth largely continued the previous model that came at the expense of the ecological environment. The net fertilizer usage per unit area rose from 335.26 kg/hm2 to 359.11 kg/hm2, and pesticide usage per unit area increased from 10.70 kg/hm2 to 10.95 kg/hm2, leading to environmental challenges such as soil acidification and non-point source pollution.
During the rapid growth stage, the comprehensive index of sustainable and stable green grain production surged from 0.41 to 0.72, with an average annual growth rate of 7.37%. This growth aligns with transformative policy initiatives introduced following the 18th National Congress of the Communist Party of China. China implemented its strictest cultivated land protection regime, rigorously safeguarding both the quantity and quality of farmland. This secured the foundation for achieving sustainability and stability in grain production. The state vigorously pursued the “Zero Growth Action Plan in Chemical Fertilizer and Pesticide Use,” effectively reversing the trend of worsening agricultural non-point source pollution. Government agencies advanced the “High-Quality Grain Project,” significantly enhancing grain quality and supply chain resilience while maintaining output levels. These measures promote the successful transformation of the national food security strategy to connotative sustainable development. However, since 2020, the comprehensive index has stagnated within the range of 0.70–0.72, reflecting the superposition of external shocks such as long-term structural contradictions and epidemics. Key contributing factors include the limited adoption of green technologies among smallholder farmers, the lack of effective mechanisms for production efficiency and ecological compensation, and the fragmentation of industrial chains, which has undermined systemic resilience. Addressing these issues requires a multi-faceted strategy encompassing the development of high-standard farmland, the enhancement of production capacity, and the promotion of innovative and integrated business models.
4.2 Temporal evolution analysis of grain production subsystems
The index of sustainable grain production within the subsystem is generally increasing. From 2000 to 2021, the sustainable grain production index steadily increased from 0.17 to 0.83, with an average annual growth rate of 7.90%. This upward trend reflects the consistent prioritization of “sustainability” in national food production policies. A series of foundational and farmer-oriented measures, including the abolition of agricultural taxes, implementation of agricultural support and protection subsidies, the promotion of agricultural insurance, and continuing to increase transfer payments, effectively incentivized both farmers and local governments to maintain long-term engagement in grain cultivation. But, the price index for agricultural inputs has more than doubled, while the average net profit per mu for the four major grains has experienced only modest increases over the past 22 years. This highlights that under the rigid constraint of a large population and limited arable land, relying on production subsidies and policy support, and it cannot remain insufficient to fundamentally resolve the deeper challenge faced by smallholder farmers achieving prosperity through grain cultivation. Meanwhile, issues such as “high-yield, poor counties” and the disparity between grain production and wealth generation persist. It demonstrates the strong positive externalities of grain production, safeguarding national food security, and the absence of an efficient, self-reinforcing synergy between this imperative and endogenous county-level economic development.
The stable grain production index of the subsystem showed a trend of fluctuating decline and recovery. From 2000 to 2006, this period coincided with China’s early years after joining the World Trade Organization (WTO), when the country faced dual pressures from global market volatility and increasingly severe extreme weather events. At that time, the domestic policy framework for disaster prevention and mitigation infrastructure, market risk buffering mechanisms, and the promotion of adaptive technology were still underdeveloped. Consequently, total grain output exhibited substantial volatility, ranging from −9.9 to 8.56%. The proportion of crop areas affected by disasters also increased during this period, reaching 16.19% in 2006. From 2000 to 2006, the stable grain production index rose from 0.40 to 0.61. This shift was directly triggered by the global food crisis of 2007, after which the Chinese government elevated “stability” to a core strategic objective and systematically established a comprehensive support framework. First, a strong defense against natural risks was built. The government substantially increased investment to promote large-scale construction of high-standard farmland and the modernization of irrigation infrastructure. At the same time, it actively promoted high-yield, stress-resistant crop varieties, along with green and stable production technologies such as water-and fertilizer-saving practices. These targeted efforts significantly improved agricultural disaster prevention and mitigation capacity, resulting in a systematic reduction of crop damage areas, which have since remained at a low and stable range between 2% and.
4%. The production foundation and technological support were reinforced. The continuation and reinforcement of agricultural support and protection subsidies, along with the implementation of minimum purchase price policies, effectively stabilized grain crop planting areas, maintaining a critical threshold of over 69%. Additionally, the deep implementation of the agricultural science and technology development strategy, including the widespread promotion of improved seed varieties and cultivation methods, significantly strengthened the stability and sustainability of crop yields. The synergistic effects of this policy mix have markedly enhanced the systemic risk resistance of grain production, while the substantial narrowing and sustained reduction in the annual volatility of grain output, which stabilized below 3% during 2017–2022.
The green grain production index of the subsystem showed three stages of rapid decline, fluctuating stability, and rapid increase, which was consistent with the evolution trend of the comprehensive index. A turning point occurred in 2015 when the Chinese government established three critical agricultural sustainability targets, which promoted the green grain production index to rise rapidly from 0.27 in 2017 to 0.76 in 2022, with an impressive average annual growth rate of 23.12%. Specifically, the state controls the total agricultural water usage while actively promoting water-efficient agriculture and adopts the reduction of chemical fertilizer and pesticide application through implementation of the “Zero Growth Action Plan.” Driven by this series of robust policies, fertilizer usage per unit area decreased at an average annual rate of 3.24%, while pesticide usage per unit area dropped by 6.79% annually, contributing to the rapid improvement of the green grain production index during the third phase.
4.3 Spatial distribution characteristics of comprehensive grain production levels
Spatial distribution is a crucial approach to evaluating the evolutionary development of regional grain production. In this study, ArcGIS was employed to visualize the spatial patterns of the comprehensive grain production index across China’s nine major agricultural regions. Using the Natural Breaks (Jenks) classification method, the index values were divided into four categories: low-value zones (0–0.250), medium-value zones (0.251–0.320), medium–high-value zones (0.321–0.390), and high-value zones (0.391-0.460). This classification served as the standard for assessing the levels of grain production across regions, as shown in Figure 2.
Results indicate a clear northward shift in China’s grain production levels between 2000 and 2022, reflecting a spatial restructuring pattern of “northward expansion and southern retreat.” As can be seen in Figure 2, the Northeast Plain, the Huang-Huai-Hai Plain, and the Middle-Lower Yangtze Plain consistently maintained medium-high to high composite index values. Provinces such as Heilongjiang, Jiangsu, and Shandong have maintained leading positions due to their favorable natural endowments, abundant agricultural resources, and advanced levels of agricultural modernization. The Huang-Huai-Hai Plain exhibited a “V-shaped” recovery pattern, with the index rebounding from a low of 0.367 in 2010 to 0.397 in 2022. This recovery is closely linked to the implementation of comprehensive groundwater management and the development of high-standard farmland. In contrast, the Southern China region experienced a significant decline in grain production capacity, primarily due to rapid urbanization, farmland loss, and agricultural structural adjustments. Similarly, the Yunnan-Guizhou Plateau saw substantial regression, driven by fragile ecosystems and the outflow of key production factors such as labor. The grain production index in these two regions fell from 0.460 and 0.408 in 2000 to 0.257 and 0.214 in 2022, respectively, shifting from high-value zones to medium–low or low-value zones. It highlights the contrasting trend of strengthened production capacity in northern core regions versus the relative decline in southern marginal areas. Meanwhile, the Northern Arid and Semi-Arid Region remained relatively stable, with province like Xinjiang and Inner Mongolia maintaining medium-high index values, supported by the adoption of water-saving irrigation and stress-tolerant crop varieties. The Qinghai–Tibet Plateau and the Loess Plateau, however, continue to lag due to climatic limitations and poor land quality, remaining in the low-value zones and medium-value zones by 2022.
It is noteworthy that the average comprehensive grain production index across nine agricultural regions remains below 0.5, indicating generally low performance levels. This can be attributed to China’s ongoing transition toward more scaled, industrialized, and environmentally sustainable agricultural systems. Key challenges include the bottleneck of small-scale peasant economic efficiency, the weak resistance to extreme weather risks, the prominent structural contradictions under the tight balance of total grain, the high concentration of regional grain production and the reduction of grain supply resilience. Future efforts should focus on scaling service systems, advancing digital agricultural technologies, and institutional innovation. Strategic initiatives such as the national grain security industrial belt and horizontal benefit-sharing mechanisms should be leveraged to strengthen core production zones. Meanwhile, ecologically fragile regions must pursue differentiated development pathways aligned with their local resource endowments.
5 Spatiotemporal analysis of obstacle factors in grain production
5.1 Analysis of obstacle factors in comprehensive grain production
Utilizing the obstacle diagnosis model, this study identifies the primary factors impeding sustainable, stable, and green grain production from 2000 to 2022. The top five obstacles are ranked by their obstacle degrees, with higher values signifying greater hindrance to achieving sustainable and stable green production, as detailed in Table 2.
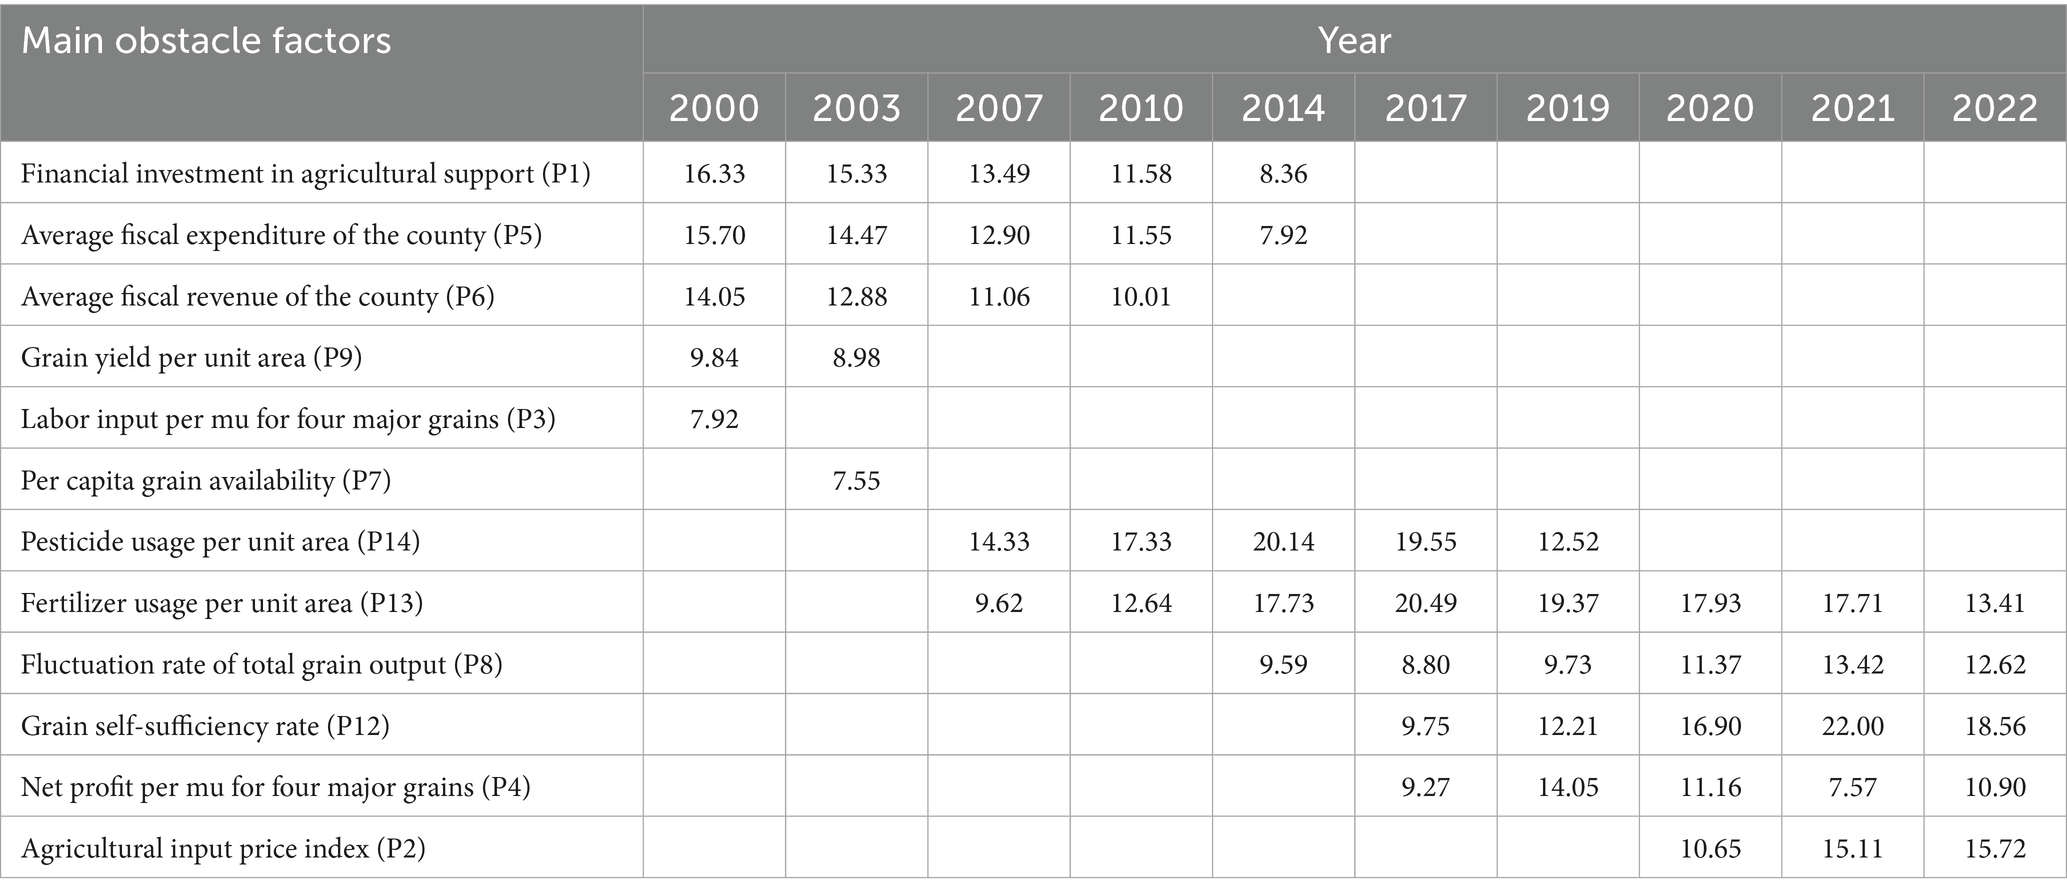
Table 2. The top five obstacle factors and obstacle degree of sustainable and stable green production of grain in China (%).
5.1.1 Changes in key obstacle factors from 2000 to 2014
The primary obstacles to sustainable, stable, and green grain production between 2000 and 2014 were financial investment in agricultural support for agriculture, average fiscal expenditure of the county, and average fiscal revenue of the county. However, their barrier impact gradually declined, with obstacle degrees decreasing from 16.33, 15.70, and 14.05% in 2000 to 8.36, 7.92, and 6.00% in 2014. This decline can be attributed to the economic conditions of the early 2000s when China’s economic development level was low, and both national and local governments prioritized urban and industrial growth, leaving limited financial resources to support grain production. This lack of support became a key obstacle to sustainable grain production. After 2003, in response to a sharp decline in total grain output for five consecutive years, the state provided rewards and subsidies to major grain-producing counties through transfer payments, encouraging local governments to prioritize grain production (He et al., 2017; Zhang et al., 2021). It can be seen that these policy responses have significant passive and compensatory characteristics, and did not fundamentally resolve agriculture’s structurally disadvantaged position in national fiscal allocation. Furthermore, after 2007, the obstacle degrees of pesticide and fertilizer usage per unit area rose sharply, increasing from 14.33 and 9.62% in 2007 to 20.14 and 17.73% in 2014, making them the top two obstacles. This marked escalation clearly indicates the emergence of a heavy reliance on chemical inputs as a means to achieve yield targets, which rapidly evolved into the most significant barrier to sustainable agricultural practices.
5.1.2 Changes in key obstacle factors from 2015 to 2019
The results show that from 2015 to 2019, the top five factors obstructing sustainable and stable green grain production were pesticide usage per unit area, fertilizer usage per unit area, fluctuation rate of total grain output, grain self-sufficiency rate, and net profit per mu of the four major grain types. Among these, the obstacle degrees of pesticide usage per unit area and fertilizer usage per unit area showed a consistent decline, decreasing from 21.28 and 19.68% in 2015 to 12.52 and 17.37% in 2019. Meanwhile, this period exposed sharper emerging contradictions, as the obstacle degrees for the grain self-sufficiency rate and net profit per mu of the four major grain types continued to rise, increasing from 7.62 and 7.15% in 2015 to 12.21 and 14.05% in 2019. It illustrates an intensifying trade-off between maintaining domestic grain self-sufficiency and ensuring reasonable profitability for producers under increasingly stringent resource and environmental constraints. In this phase, while policy measures began to address the quantity of chemical inputs, they fell short in tackling core issues related to production quality and system resilience. This reveals a governance dilemma wherein singular environmental policy objectives lack sufficient integration with broader goals such as food security and farmers’ income improvement.
5.1.3 Changes in key obstacle factors from 2020 to 2022
In this period, the configuration of key obstacles in sustainable, stable, and green grain production became increasingly complex. Although the continued implementation of earlier policies led to a steady decline in fertilizer usage per unit area, chemical fertilizer remained the most prominent barrier. The amount of pesticide use per unit area dropped out of the top five obstacle factors, which highlights the effectiveness of measures such as scientific pesticide application and integrated pest management in reducing reliance on pesticides. At the same time, key obstacle factors such as grain self-sufficiency rate, the fluctuation rate of total grain output, and net profit per mu of the four main grains remained elevated, while the agricultural input price index emerged as a new top-five barrier. Together, these factors reveal the multidimensional and systemic pressures currently facing green grain production. These pressures include disruptions to self-sufficiency caused by international supply chain volatility, heightened yield risks due to extreme weather events, and escalating input costs that further erode already thin profit margins for grain farmers.
5.2 Analysis of obstacle degrees in grain production subsystems
As can be seen in Figure 3, the analysis examines the temporal changes in the obstacle degrees across the three subsystems. From 2000 to 2022, the sustainable grain production subsystem exhibited the highest average obstacle degree at 39.94%, followed by the green grain production subsystem at 33.48% and the stable grain production subsystem at 26.58%. It highlights a core contradiction in China’s food security system, which is the long-standing reliance on high inputs such as fiscal and resource investment, to sustain production increasingly clashes with the growing systemic pressures of ensuring environmental sustainability and supply stability.
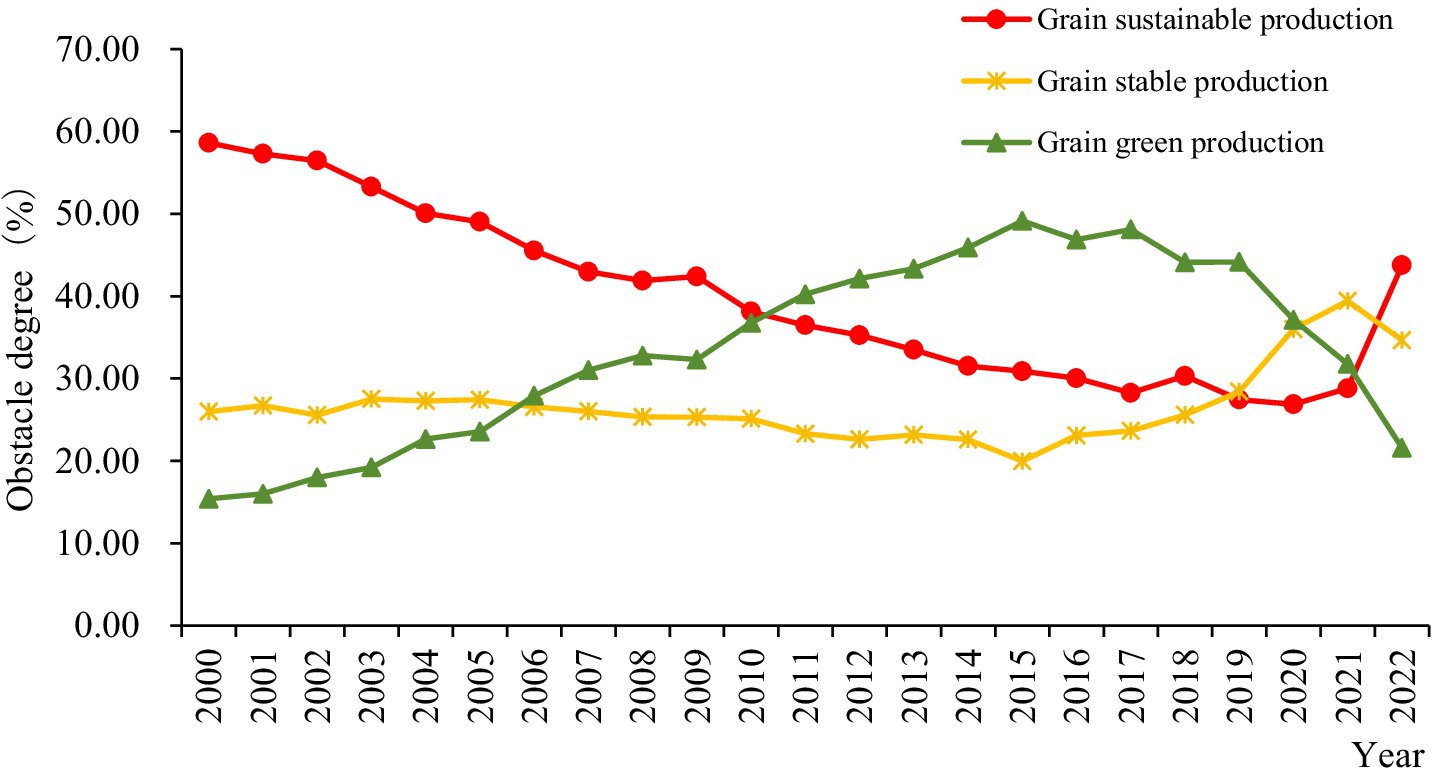
Figure 3. The obstacle degree of each subsystem of grain sustainable and stable green production from 2000 to 2022.
The obstacle degree of the sustainable grain production subsystem showed a continuous decline from 58.62% in 2000 to 26.87% in 2020. This reflects the government’s increasing financial support for agriculture through various subsidy policies and transfer payment mechanisms, such as incentive funds for major grain-producing counties. However, the sharp rebound in the obstacle degree from 28.80% in 2021 to 43.75% in 2022 serves as a stark warning signal. It reversal not only confirms the widely discussed marginal diminishing returns of fiscal policy incentives but also reveals the growing vulnerability of this approach in the face of emerging challenges. Surging prices of agricultural inputs, rising opportunity costs of land and labor, and the dilution of subsidy impacts under small-scale farming operations are rapidly weakening the effectiveness of fiscal investments. Therefore, it is necessary to explore a long-term mechanism to reduce production costs and increase total factor productivity, so as to enhance the resilience and sustainability of food production.
The stable grain production subsystem showed relatively steady obstacle degrees from 2000 to 2018, fluctuating slightly in 2003 and 2016 but generally remaining between 22 and 27%. This stability reflects the nation’s efforts to enhance grain yield and mitigate crop disaster risks through technological innovation, ensuring a stable and secure grain supply despite population growth. From 2019 to 2022, however, the subsystem’s obstacle degree fluctuated significantly, rising from 28.41% in 2019 to 39.43% in 2021 before declining to 34.66% in 2022. This volatility underscores the subsystem’s vulnerability in the face of multiple compounding challenges: a structural decline in self-sufficiency rates across major grain crops, a rise in the frequency and intensity of extreme weather events, and heightened risks from international supply chain disruptions, such as those caused by the COVID-19 pandemic and geopolitical conflicts affecting trade and agricultural input availability (Li and Lin, 2023).
The green grain production subsystem experienced a significant rise in its obstacle degree between 2010 and 2017, surpassing both the sustainable and stable grain production subsystems. It increased from 15.40% in 2010 to 48.10% in 2017. This indicates that while the input of agricultural materials such as fertilizers and pesticides contributed to continuous growth in grain production, it also caused non-point source pollution of the soil, impeding green grain production. However, following the implementation of the “Zero Growth Action Plan in Chemical Fertilizer and Pesticide Use,” the obstacle degree of the green grain production subsystem began to decline, dropping from 44.11% in 2018 to 21.59% in 2022. However, this reduction was primarily driven by control over input volumes and may not necessarily indicate a parallel decline in ecological risks. Issues such as delayed recovery of soil organic matter and biodiversity suggest that improvements in input efficiency have not yet translated into comprehensive environmental restoration.
5.3 Spatiotemporal analysis of obstacle factors of grain production levels by regions
This section conducts a spatiotemporal analysis of the evolving trends of obstacle factors to the sustainable, stable and green grain production levels across the nine major agricultural regions of China, as illustrated in Table 3.
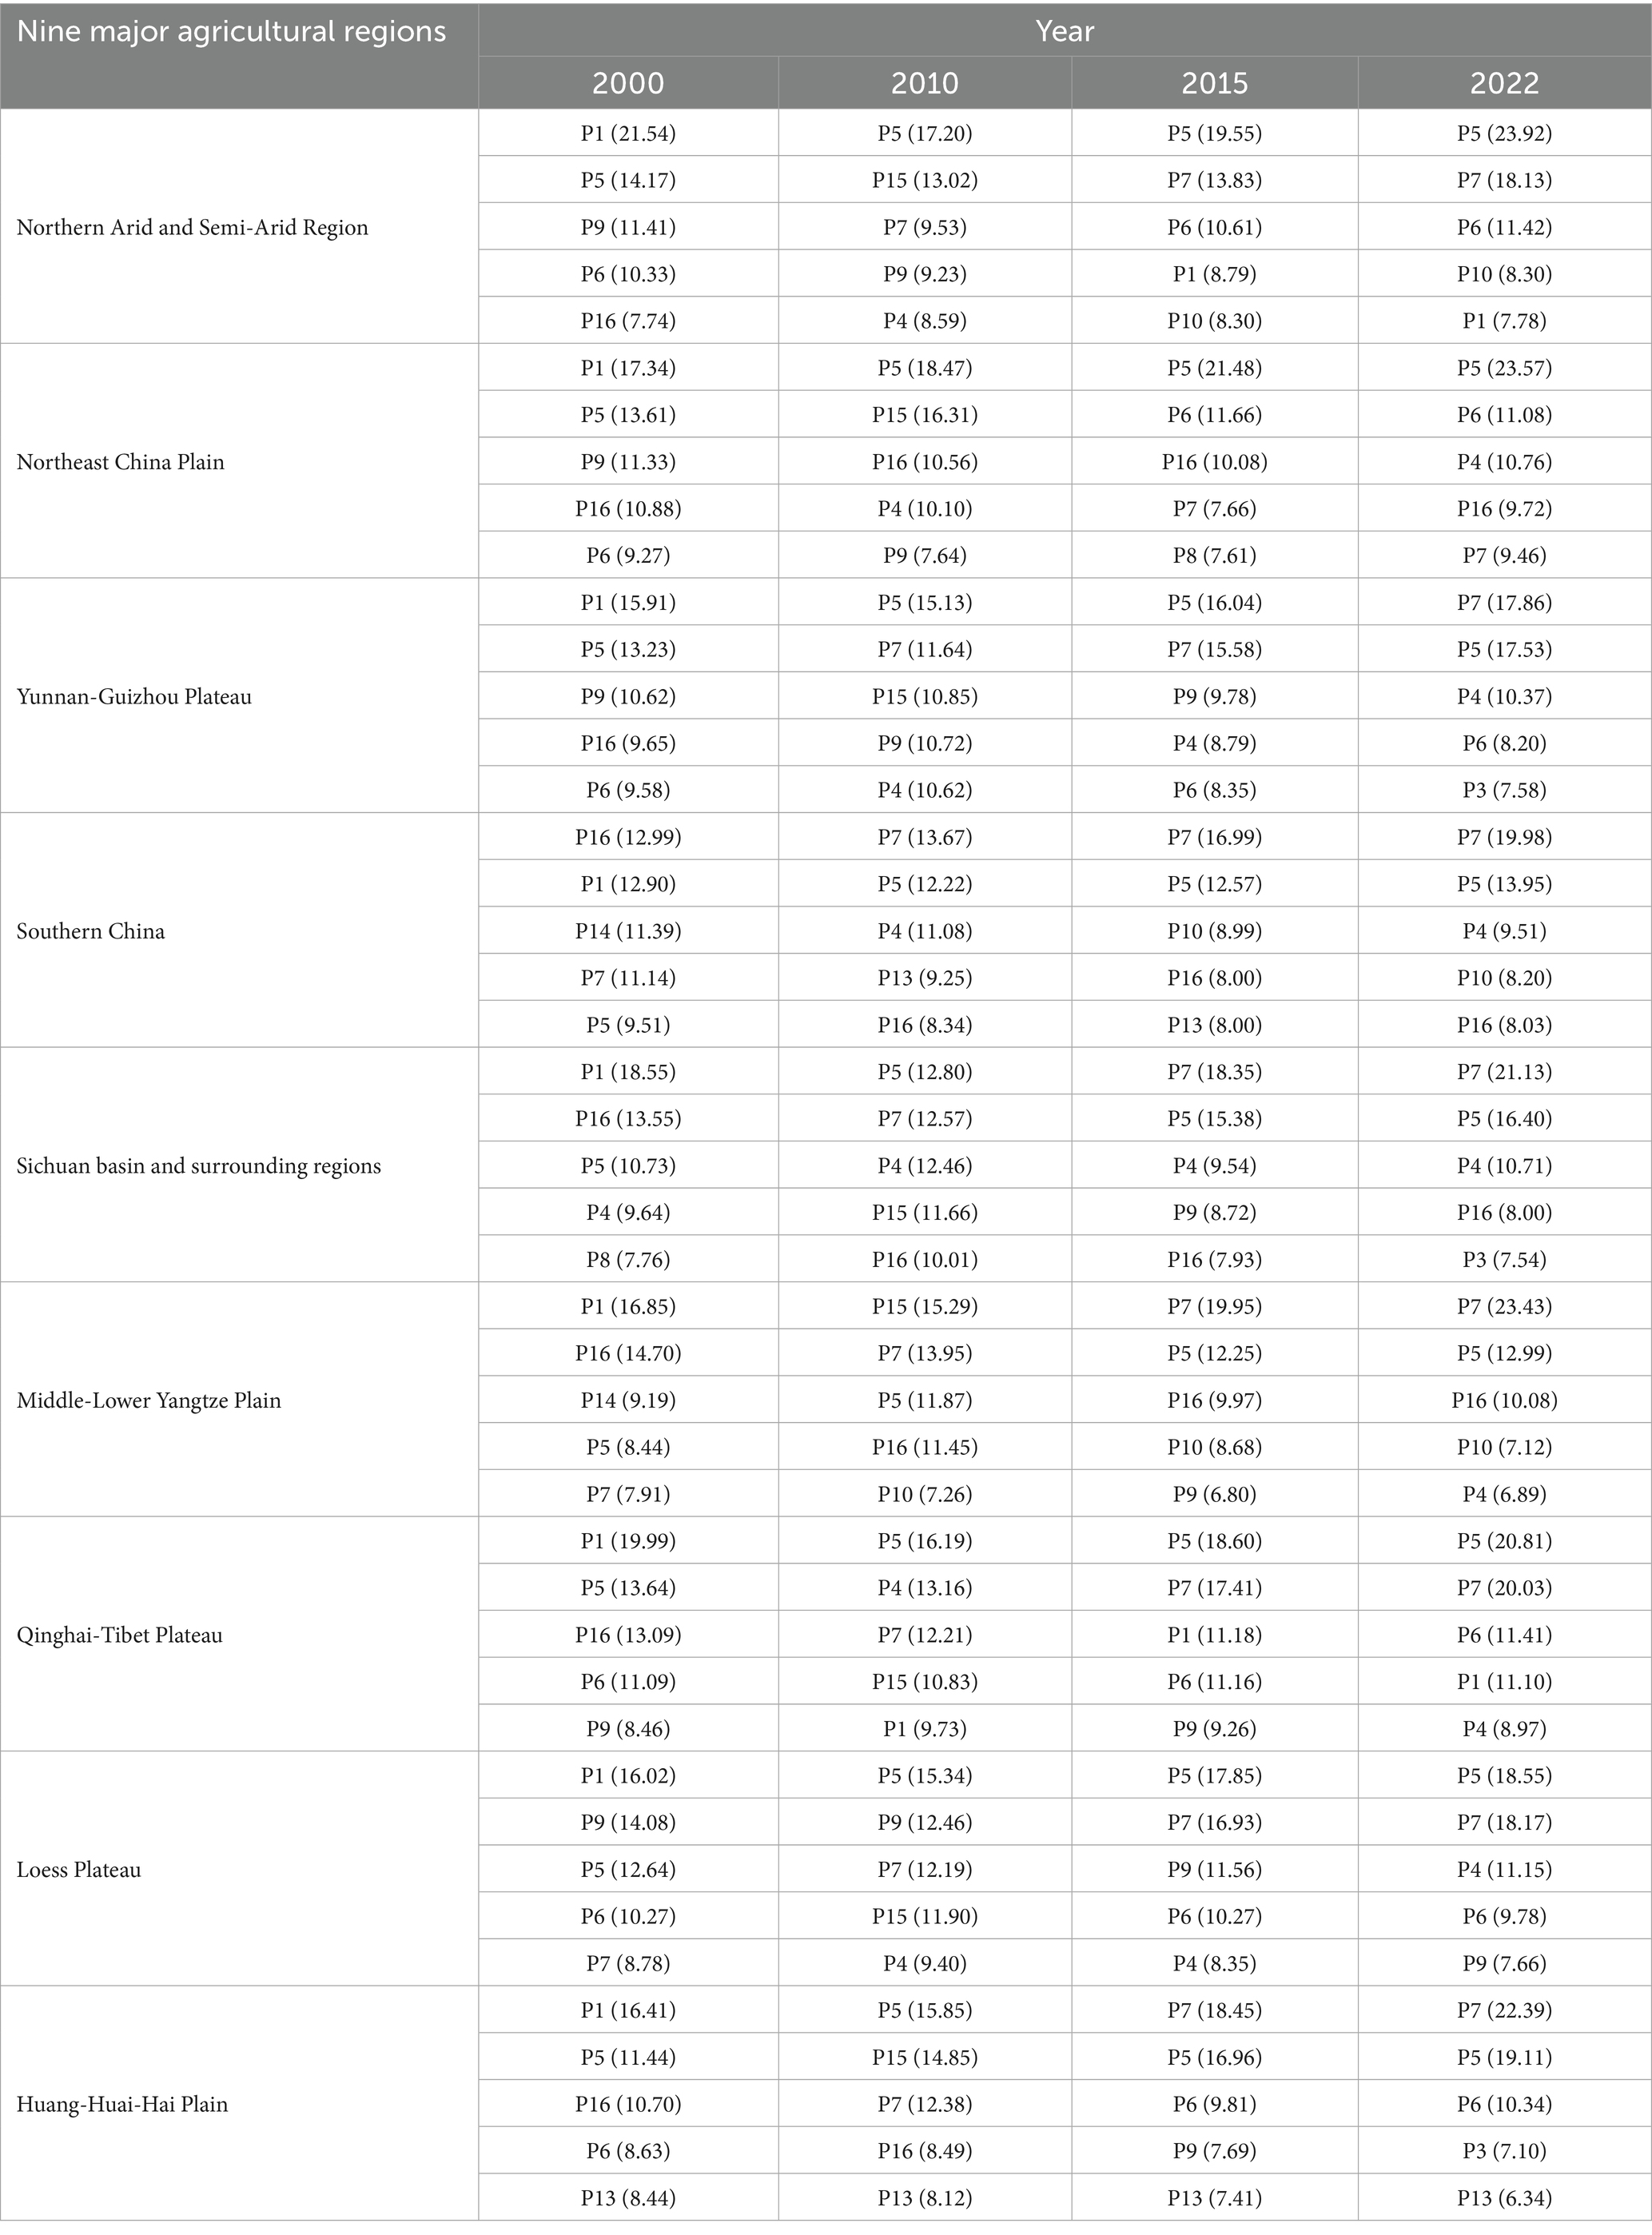
Table 3. The top five obstacle factors and obstacle degree of grain sustainable and stable green production levels in nine major agricultural regions of China (%).
5.3.1 Temporal analysis of obstacle factors of grain production levels by regions
From a temporal perspective, the structure of obstacle factors has undergone significant transformation. In 2000, direct fiscal support was the dominant limiting factor in most regions. For instance, in the Northern Arid and Semi-Arid Region, the obstacle degree of financial investment in agricultural support (P1) reached 21.54%, but steadily declined to 7.91% by 2022. This trend suggests a diversification of local agricultural financing methods despite increased central government investment. Concurrently, the importance of local fiscal capacity has grown. The obstacle degree of the average fiscal revenue of the county (P5) increased from 10–15% in 2000 to approximately 20% in 2022, with the Northeast Plain rising from 13.61 to 23.53%. This shift underscores the emerging constraint of local government fiscal capacity within the context of broader regional economic development. On the other hand, there were significant changes observed in resource limitations and production efficiency metrics.
While factors such as the proportion of water-saving irrigation (P16) and land retention rate (P15) remain prominent constraints in many regions, their overall obstacle degrees have declined. This reflects advancements in infrastructure and the adoption of modern irrigation technologies. For instance, in the middle and lower reaches of the Yangtze River, the obstacle degree of P16 decreased from 14.70% in 2010 to 9.28% in 2022. Meanwhile, indicators related to production efficiency like grain yield per unit area (P9) and net profit per mu for four major grains (P4), gained prominence in certain regions, indicating a growing emphasis on technological upgrading and crop structure optimization. Overall, the temporal progression indicates a transition from a development model driven by input to one that prioritizes the enhancement of quality, efficiency, and the sustainable utilization of resources.
5.3.2 Spatial analysis of obstacle factors of grain production levels by regions
From a spatial perspective, the findings reveal distinct development trajectories and structural differences across China’s agricultural regions. In ecologically fragile regions such as the Northern Arid and Semi-Arid Region, the Loess Plateau, and the Qinghai–Tibet Plateau, fiscal investment and water availability remain the core constraints on grain production due to harsh natural conditions.
In the Northern Arid and Semi-Arid Region, limited financial investment in agricultural support (P1) and low grain yield per unit area (P9) were the main obstacle factors in 2000. With the implementation of national subsidy policies and the advancement of agricultural mechanization, the obstacle degree of financial investment in agricultural support (P1) declined significantly, while the obstacle degree of the average fiscal revenue of the county (P5) rose from 14.17% in 2000 to 21.99% in 2022, indicating a shift in constraint structure. This trend is even more pronounced in the Qinghai–Tibet Plateau, where the obstacle degree of financial investment in agricultural support (P1) dropped from 19.99% in 2000 to 9.96% in 2022, reflecting a reduced dependency on government aid. However, the region still suffers from underdeveloped agricultural technology and poor transportation infrastructure, with low per capita grain output and net profitability continuing to limit development. In the Loess Plateau, low grain yield per unit area (P9) and financial investment in agricultural support (P1) were dominant obstacle factors in 2000. By 2022, the primary barriers shifted to the average fiscal revenue of the county (P5) and per capita grain availability (P7). These regions generally face severe shortages of water, arable land, and labor. While fiscal inputs helped alleviate basic subsistence challenges in the early stage, limited local fiscal capacity has emerged as a new bottleneck amid modest economic growth.
In traditional grain-producing areas, namely the Northeast Plain, the Huang-Huai-Hai Plain, and the Middle-Lower Yangtze Plain, the structure of obstacle factors reflects a balance among economic capacity, agricultural efficiency, and environmental pressures. In the Northeast Plain, financial investment in agricultural support (P1) and grain yield per unit area (P9) were the primary obstacle factors in 2000. By 2022, the leading obstacles shifted to average fiscal revenue of the county (P5) and net profit per mu for four major grains (P4), indicating increasing demands for agricultural scale expansion and efficiency enhancement. The Huang-Huai-Hai Plain, constrained in 2000 by limited mechanization and water-saving investment, was primarily hindered by financial investment in agricultural support (P1). After 2010, indicators such as land retention rate (P15) and local fiscal capacity gained prominence. By 2022, the obstacle degree of average fiscal revenue of the county (P5) had reached 19.70%, reflecting a shift in constraints as rural land tenure reforms matured and issues of land scarcity and income stability became central. In the Middle-Lower Yangtze Plain, financial investment in agricultural support (P1) and proportion of water-saving irrigation area (P16) were the main obstacle factors in 2000. Although challenges related to per capita grain availability and water-saving irrigation persist, fiscal constraints have become increasingly significant. In 2022, the obstacle degree of average fiscal revenue of the county (P5) rose to 12.15%. The disparities in agricultural mechanization levels and the uneven development between urban and rural areas impact these plains. Despite these challenges, the structure of obstacles is being progressively optimized, facilitating the stable advancement of mechanization and large-scale operations.
In southern mountainous regions including the Yunnan–Guizhou Plateau, Southern China, and the Sichuan Basin and surrounding regions, grain production is primarily constrained by natural conditions and industrial structure. In the Yunnan–Guizhou Plateau, limited arable land and low modernization levels have kept agriculture reliant on subsidies and labor-intensive practices. Financial investment in agricultural support (P1) and grain yield per unit area (P9) were key constraints in 2000, replaced in 2022 by average fiscal revenue of the county (P5) and net profit per mu for four major grains (P4). Southern China, though climatically favorable, faces land scarcity and complex cropping systems. Early obstacle factors such as proportion of water-saving irrigation area (P16) and pesticide usage per unit area (P14) shifted to economic factors like financial investment in agricultural support (P1) and net profit per mu for four major grains (P4) by 2022, reflecting the need to balance profitability and environmental sustainability. The Sichuan Basin and surrounding regions, despite abundant water, is limited by terraced topography. Constraints evolved from financial investment in agricultural support (P1) and proportion of water-saving irrigation area (P16) in 2000 to per capita grain availability (P7) and average fiscal revenue of the county (P5) in 2022, highlighting growing pressure from population and industrial transition. Overall, these regions face complex, heterogeneous constraints driven by terrain, resource endowment, and infrastructure gaps, hindering progress toward green and efficient grain production.
From 2000 to 2022, grain production constraints in China’s major agricultural regions shifted from reliance on central subsidies to greater emphasis on local fiscal capacity and resource efficiency. While early subsidies supported production growth, long-term stability now depends on local governance and technological advancement. Declining resource constraint weights indicate progress, but continued investment in land and water conservation is needed. Rising efficiency-related constraints reflect the push for green, high-yield agriculture. Regionally, the northwest requires sustained external support, core grain areas must enhance land quality and mechanization, and southern mountainous zones need ecological compensation and structural adjustment.
6 Conclusions, policy implications, and limitations
This paper analyzes the evolution of China’s sustainable and stable green grain production from 2000 to 2022, identifies key obstacle factors affecting its development, and provides quantitative insights to support the stable and secure supply of essential agricultural products. This paper constructs an indicator system based on three subsystems: sustainable grain production, stable grain production, and green grain production. Using the entropy-weighted TOPSIS model and the obstacle degree model, it measures the level of China’s sustainable and stable green grain production and diagnoses the main obstacles affecting its development from 2000 to 2022. The results reveal that China’s sustainable and stable green grain production went through a process of initial decline, followed by gradual increase, and then rapid growth. The evolution trends of the subsystems show significant differences. The sustainable production index showed an overall upward trend, the stable production index experienced periods of fluctuation and decline followed by fluctuation and increase, while the green production index underwent rapid decline, stable fluctuation, and rapid increase in three distinct stages. This study further analyzes the spatial distribution of comprehensive grain production across China’s nine major agricultural regions. Results show a clear spatial shift from south to north between 2000 and 2022, highlighting a “northward expansion and southern retreat” trend in grain production capacity. Moreover, the dynamic evolution of obstacle factors from 2000 to 2022 reveals the deep contradictions and challenges faced by China’s sustainable and stable green grain production. From the temporal and spatial analysis, the obstacle factors of grain production levels in China’s nine major agricultural regions from 2000 to 2022 have shifted from a focus on fiscal agricultural support to a more balanced emphasis on local fiscal capacity and resource efficiency. The marginal effect of fiscal policy is decreasing, and there are limitations in promoting the synergy between the endogenous power of county economy and the high-quality development of grain industry. Although the reduction of chemical fertilizers and pesticides has achieved results, the green transformation of grain is facing multiple bottlenecks such as technology promotion, market mechanism and smallholder behavior cognition. The decline in food self-sufficiency rate, rising costs and profit squeeze highlight the capricious vulnerability of China’s food production system under external shocks such as extreme weather and tight international supply chains. This highlights the government’s ongoing efforts to mobilize both national and local resources and promote green production methods to ensure a stable and secure grain supply.
Based on existing literature, theoretical analysis, and empirical results, this study proposes the following policy recommendations for the sustainable, stable and green development of grain production.
1. To enhance grain production, efforts should focus on high-standard farmland integrated with green, efficient technologies, including water-saving irrigation, resilient varieties, and smart mechanization. Region-specific demonstration zones should be developed to improve yield, resource use, and sustainability. Meanwhile, China should promote context-specific, moderate-scale agricultural models suited to its rural structure, enabling smallholders to participate in modernization.
2. To resolve the dilemma of high grain output but low fiscal revenue in counties, a high-quality development framework should be established for the grain industry characterized. This involves integrating industrial, supply, and value chains, and relocating advanced processing, logistics, and manufacturing to production areas to form a synergistic system of production, processing, and supporting industries. This will transform grain regions into growth hubs, increasing local revenue and farmer incomes. Additionally, national R&D resources should be directed to key grain areas to strengthen technology transfer and innovation.
3. Innovating the digital empowerment and financial coordination mechanism can establish a comprehensive risk protection system for the entire grain production cycle. By equipping new agricultural operators with technologies such as drones, remote sensing, IoT, BeiDou, and AI, production can be precisely managed and fully traceable. These digital tools generate reliable credit and asset data, enabling financial institutions to accurately assess risks and lending capacity, thus addressing long-standing challenges like collateral shortages and high risk-control costs in agricultural finance.
A fundamental limitation of this study lies in its geographical focus. By concentrating on China’s nine major agricultural regions, the analysis may overlook important intra-regional variations. Future research should consider more granular spatial units, such as provinces or counties, to capture localized dynamics and better inform region-specific policy interventions.
Data availability statement
The original contributions presented in the study are included in the article/supplementary material, further inquiries can be directed to the corresponding author.
Author contributions
CS: Conceptualization, Methodology, Software, Validation, Visualization, Writing – original draft. RM: Conceptualization, Formal analysis, Validation, Writing – original draft, Writing – review & editing. YL: Formal analysis, Visualization, Writing – original draft. HZ: Data curation, Writing – review & editing. MT: Formal analysis, Writing – original draft. YT: Supervision, Writing – review & editing. LJ: Investigation, Writing – review & editing. XZ: Investigation, Writing – review & editing. HL: Software, Writing – review & editing. KL: Data curation, Writing – review & editing. XM: Validation, Writing – review & editing.
Funding
The author(s) declare that financial support was received for the research and/or publication of this article. This work was supported by the Strategic Research and Consulting Project of the Chinese Academy of Engineering (grant no. 2023-XY-31), the Key Soft Science Project of Henan Province (grant no. 242400411015), the Independent Innovation Project of Henan Academy of Agricultural Sciences (grant no. 2025ZC140), and Henan Academy of Agricultural Sciences Special Project to Enhance Rural Revitalization Capabilities (grant no. 2025-09).
Conflict of interest
The authors declare that the research was conducted in the absence of any commercial or financial relationships that could be construed as a potential conflict of interest.
Generative AI statement
The authors declare that no Gen AI was used in the creation of this manuscript.
Publisher’s note
All claims expressed in this article are solely those of the authors and do not necessarily represent those of their affiliated organizations, or those of the publisher, the editors and the reviewers. Any product that may be evaluated in this article, or claim that may be made by its manufacturer, is not guaranteed or endorsed by the publisher.
References
Anghinoni, G., Anghinoni, F. B. G., Tormena, C. A., Braccini, A. L., de Carvalho, I., Mendes, L. Z., et al. (2021). Conservation agriculture strengthen sustainability of Brazilian grain production and food security. Land Use Policy 108:105591. doi: 10.1016/J.LANDUSEPOL.2021.105591
Çelikbilek, Y., and Tüysüz, F. (2020). An in-depth review of theory of the TOPSIS method: an experimental analysis. J. Manag. Anal. 7, 281–300. doi: 10.1080/23270012.2020.1748528
Coradi, P. C., and Lemes, Â. F. C. (2018). Validation of an experimental prototype of thick-layer fixed bed dryer and determination of the quality of the dried soybean grains. Acta Scientiarum-Agronomy 40:35285. doi: 10.4025/actasciagron.v40i1.35285
dos Santos, B. M., Godoy, L. P., and Campos, L. M. (2019). Performance evaluation of green suppliers using entropy-TOPSIS-F. J. Clean. Prod. 207, 498–509. doi: 10.1016/J.JCLEPRO.2018.09.235
Driscoll, J. C., and Kraay, A. C. (1998). Consistent covariance matrix estimation with spatially dependent panel data. Rev. Econ. Stat. 80, 549–560. doi: 10.1162/003465398557825
Gong, S., Wang, B., Zhigang, Y., and Cui, Z. (2023). Does seed industry innovation in developing countries contribute to sustainable development of grain green production? Evidence from China. J. Clean. Prod. 406:137029. doi: 10.1016/J.JCLEPRO.2023.137029
Guo, Z., and Zhang, X. (2023). Carbon reduction effect of agricultural green production technology: a new evidence from China. Sci. Total Environ. 874:162483. doi: 10.1016/J.SCITOTENV.2023.162483
Han, G., Cui, W., Chen, X., and Gao, Q. (2024). The sustainability of grain production: the impact of agricultural productive services on farmers’ grain profits. Front Sust Food Syst 8:1430643. doi: 10.3389/fsufs.2024.1430643
Harries, M., Flower, K. C., and Scanlan, C. A. (2021). Sustainability of nutrient Management in Grain Production Systems of south-West Australia. Crop Pasture Sci 72, 197–212. doi: 10.1071/CP20403
He, C., Liu, Z., Min, X., Ma, Q., and Dou, Y. (2017). Urban expansion brought stress to food security in China: evidence from decreased cropland net primary productivity. Sci. Total Environ. 576, 660–670. doi: 10.1016/J.SCITOTENV.2016.10.107
Jiao, X., Yang, L., Wu, X., Li, H., Cheng, L., Zhang, C., et al. (2016). Grain production versus resource and environmental costs: towards increasing sustainability of nutrient use in China. J Exp Botany 67, 4935–4949. doi: 10.1093/jxb/erw282
Jin, M., Feng, Y., Wang, S., Chen, N., and Cao, F. (2024). Can the development of the rural digital economy reduce agricultural carbon emissions? A spatiotemporal empirical study based on China’s provinces. Sci. Total Environ. 939:173437. doi: 10.1016/j.scitotenv.2024.173437
Lang, H., Zhang, H., Zezhou, W., and Chen, X. (2025). Impact of high-speed rail on green space coverage in China: from the spatial spillover effect and regional disparity perspectives. Transp. Res. A Policy Pract. 192:104343. doi: 10.1016/J.TRA.2024.104343
Li, W., Guo, J., Tang, Y., and Zhang, P. (2024). Resilience of agricultural development in China’s major grain-producing areas under the double security goals of ‘grain ecology’. Environ. Sci. Pollut. Res. Int. 31, 5881–5895. doi: 10.1007/s11356-023-31316-8
Li, J., and Lin, Q. (2023). Threshold effects of green technology application on sustainable grain production: evidence from China. Front. Plant Sci. 14:1107970. doi: 10.3389/fpls.2023.1107970
Li, Y., You, X., Sun, X., and Chen, J. (2024). Dynamic assessment and pathway optimization of agricultural modernization in China under the sustainability framework: an empirical study based on dynamic QCA analysis. J. Clean. Prod. 479:144072. doi: 10.1016/J.JCLEPRO.2024.144072
Li, Y., Zhang, W., Ma, L., Liang, W., Shen, J., Davies, W. J., et al. (2014). An analysis of China’s grain production: looking Back and looking forward. Food Energy Security 3, 19–32. doi: 10.1002/fes3.41
Lu, S., Bai, X., Li, W., and Wang, N. (2019). Impacts of climate change on water resources and grain production. Technol. Forecast. Soc. Chang. 143, 76–84. doi: 10.1016/J.TECHFORE.2019.01.015
Lu, H., Chen, Y., and Luo, J. (2024). Development of green and low-carbon agriculture through grain production agglomeration and agricultural environmental efficiency improvement in China. J. Clean. Prod. 442:141128. doi: 10.1016/J.JCLEPRO.2024.141128
Purvis, B., Mao, Y., and Robinson, D. (2019). Three pillars of sustainability: in search of conceptual origins. Environ. Conserv. 14, 681–695. doi: 10.1017/S0376892900011449
Raseduzzaman, M., and Jensen, E. S. (2017). Does intercropping enhance yield stability in arable crop production? A Meta-analysis. Eur. J. Agron. 91, 25–33. doi: 10.1016/J.EJA.2017.09.009
Roer, A. G., Korsaeth, A., Henriksen, T. M., Michelsen, O., and Strømman, A. H. (2012). The influence of system boundaries on life cycle assessment of grain production in central Southeast Norway. Agric. Syst. 111, 75–84. doi: 10.1016/J.AGSY.2012.05.007
Shah, W. U., Hassan, G. H., Yasmeen, R., Yan, H., and Qi, Y. (2024). Impact of agricultural technological innovation on Total-factor agricultural water usage efficiency: evidence from 31 Chinese provinces. Agric. Water Manag. 299:108905. doi: 10.1016/J.AGWAT.2024.108905
Tian, P., Li, D., Hongwei, L., Feng, S., and Nie, Q. (2021). Trends, distribution, and impact factors of carbon footprints of Main grains production in China. J. Clean. Prod. 278:123347. doi: 10.1016/J.JCLEPRO.2020.123347
Tushar, S. R., Alam, M. F. B., Zaman, S. M., Garza-Reyes, J. A., Mainul Bari, A. B. M., and Karmaker, C. L. (2023). Analysis of the factors influencing the stability of stored grains: implications for agricultural sustainability and food security. Sust Operations Computers 4, 40–52. doi: 10.1016/J.SUSOC.2023.04.003
Volsi, B., Higashi, G. E., Bordin, I., and Telles, T. S. (2022). The diversification of species in crop rotation increases the profitability of grain production systems. Sci. Rep. 12:19849. doi: 10.1038/s41598-022-23718-4
Wang, R., Deng, X., Gao, Y., and Chen, J. (2025). Does regional economic development drive sustainable grain production growth in China? Evidence from spatiotemporal perspective on low-carbon Total factor productivity. Socio Econ. Plan. Sci. 98:102129. doi: 10.1016/J.SEPS.2024.102129
Wang, W., Huang, Z., Zhuoying, F., Jia, L., Li, Q., and Song, J. (2024). Impact of digital technology adoption on technological innovation in grain production. J. Innov. Knowl. 9:100520. doi: 10.1016/J.JIK.2024.100520
Xie, X. X., Zhang, A. L., Cai, Y. Y., and Zhang, Y. (2020). How government-led land consolidation efforts achieve grain production stability? An empirical analysis in Hubei Province, China. Land Use Policy 97:104756. doi: 10.1016/J.LANDUSEPOL.2020.104756
Xiong, Z., Huang, Y., and Yang, L. (2024). Rural revitalization in China: measurement indicators, regional differences and dynamic evolution. Heliyon 10:e29880. doi: 10.1016/J.HELIYON.2024.E29880
Xu, H., Ma, B., and Gao, Q. (2021). Assessing the environmental efficiency of grain production and their spatial effects: case study of major grain production areas in China. Front. Environ. Sci. 9:774343. doi: 10.3389/fenvs.2021.774343
Xu, K., Yi, X., and Zhou, L. (2025). Impacts of agricultural production services on green grain production efficiency: factors allocation perspective. J. Environ. Manag. 380:125136. doi: 10.1016/J.JENVMAN.2025.125136
Xue, S., Fang, Z., van Riper, C., He, W., Li, X., Zhang, F., et al. (2024). Ensuring China’s food security in a geographical shift of its grain production: driving factors, threats, and solutions. Resour. Conserv. Recycl. 210:107845. doi: 10.1016/J.RESCONREC.2024.107845
Yu, X., Sun, J. X., Sun, S. K., Yang, F., Lu, Y. J., Wang, Y. B., et al. (2019). A comprehensive analysis of regional grain production characteristics in China from the scale and efficiency perspectives. J. Clean. Prod. 212, 610–621. doi: 10.1016/J.JCLEPRO.2018.12.063
Zhan, X., Zhao, Y., Zhang, H., Long, Y., and Shao, C. (2025). Spatiotemporal variation and regional disparities analysis of county-level sustainable development in China. Sust Prod Consumption 57, 1–15. doi: 10.1016/J.SPC.2025.05.006
Zhang, H., Qin, Y., Jinlong, X., and Ren, W. (2023). Analysis of the evolution characteristics and impact factors of green production efficiency of grain in China. Land 12:852. doi: 10.3390/land12040852
Zhang, D., Shen, J., Zhang, F., Li, Y. E., and Zhang, W. (2017). Carbon footprint of grain production in China. Sci. Rep. 7:4182. doi: 10.1038/s41598-017-04182-x
Zhang, D., Wang, H., Lou, S., and Zhong, S. (2021). Research on grain production efficiency in China’s Main grain producing areas from the perspective of financial support. PLoS One 16:247610. doi: 10.1371/journal.pone.0247610
Keywords: grain production levels, obstacle factors, entropy-weighted TOPSIS model, assessment analysis, regional spatiotemporal analysis
Citation: Shangguan C, Ma R, Lu Y, Zhang H, Tian M, Teng Y, Jing L, Zhang X, Liu H, Li K and Mei X (2025) Assessment of grain production levels and analysis of obstacle factors in China: a sustainable, stable and green perspective. Front. Sustain. Food Syst. 9:1631845. doi: 10.3389/fsufs.2025.1631845
Edited by:
Yang Kong, Hohai University, ChinaReviewed by:
Ebrahim Endris, Woldia University, EthiopiaYinglei Deng, Hunan Women’s University, China
Copyright © 2025 Shangguan, Ma, Lu, Zhang, Tian, Teng, Jing, Zhang, Liu, Li and Mei. This is an open-access article distributed under the terms of the Creative Commons Attribution License (CC BY). The use, distribution or reproduction in other forums is permitted, provided the original author(s) and the copyright owner(s) are credited and that the original publication in this journal is cited, in accordance with accepted academic practice. No use, distribution or reproduction is permitted which does not comply with these terms.
*Correspondence: Ruijundi Ma, MTgwMzc0NTExODlAMTYzLmNvbQ==
†These authors have contributed equally to this work and share first authorship