 Xiaofan Wang1†
 Lili Yao
- 1Huanghuai University, Zhumadian, China
- 2Northwest A&F University, Xianyang, China
The Chinese government’s “30–60” carbon reduction target demonstrates its NDCs (Nationally Determined Contributions) regarding global climate issues. At the same time, the global food security situation is at risk of a new wave of uncertainty; balancing ecological and economic benefits has become a realistic problem that China’s arable land utilization needs to consider. This study examines the carbon emissions and net carbon sinks associated with cropland utilization across 31 provinces, cities, and districts in China over the period from 1991 to 2022. It provides a comprehensive accounting of these metrics and elucidates their spatiotemporal evolution characteristics. Furthermore, by employing an enhanced Tapio coupling index, the research delves into the intricate relationship between the net carbon sink of cropland utilization and grain yield, offering valuable insights into their interdependencies. The study found that: (1) China’s carbon emissions from arable land use on a downward trend after 2016; Between 1991 and 2022, there has been a notable decline in the number of Tier 1 and Tier 2 carbon-emitting provinces and municipalities in China. Specifically, the count has reduced from 21 provinces and municipalities, which included Inner Mongolia, Ningxia, Heilongjiang, and Jilin in 1991, to 13 provinces and municipalities by 2022. (2) China’s net carbon sinks from arable land use are now in a high growth phase; the net carbon sinks of each province have increased significantly compared with the previous one, and the high average annual net carbon sinks are spatially dispersed. (3) Most of the provinces in the main grain-producing regions are located in high-sink and high-yield areas; the net carbon sink has been coupled with grain production since 2004, and the coupling status of each province is more diversified. Based on the above findings, targeted optimization strategies are proposed from the perspective of low-carbon and high-yield use of arable land, and strategies for high-quality development of green agriculture are actively explored and implemented.
1 Introduction
China became the world’s largest emitter of carbon dioxide in 2007, a change that has led to China beginning to face more significant international pressure on climate change. The latest report by the IPCC (Intergovernmental Panel on Climate Chan) reveals that climate hazards are expected to increase globally, making low-carbon development imperative. In 2020, China proposed the “30•60”1 carbon reduction targets. Introducing this policy target implies that China’s economic development must be compromised in terms of low-carbon living for a considerable period. The utilization of arable land is closely linked to global warming. On the one hand, arable activities are one of the noticeable sources of greenhouse gas emissions, with statistics showing that greenhouse gases produced by agricultural and forestry activities and changes in land use account for about 17% of the total global greenhouse gas emissions (Boston Consulting Group (BCG) and XAG, 2022). In addition, using arable land can also damage the ecosystem, affecting the soil’s carbon sequestration capacity and releasing more carbon into the atmosphere, increasing greenhouse gas emissions. On the other hand, using arable land has carbon sink attributes, and the growth of crops can absorb and fix carbon dioxide through photosynthesis (Benbi, 2018). At the same time, China’s rule of law approach to food security in 2023 will put food security at the forefront, and greenhouse gas emissions from the use of arable land will continue to climb as food demand grows due to increased global uncertainty. Therefore, accounting for, analyzing, and researching the carbon emissions, net carbon sinks of arable land utilization in China, and their relationship with grain yield is of great significance for implementing carbon reduction measures while ensuring food security, which also benefits the global carbon emission reduction strategy.
At present, research on carbon emissions and net carbon sinks from cropland use in academia mostly focuses on carbon source/sink measurement, spatial and temporal characteristic laws, decomposition of influencing factors, and analysis of the relationship between environmental and economic indicators. In terms of carbon source/sink measurement, the relevant accounting methods for carbon sources broadly include model simulation (Begum et al., 2018), emission coefficients (Wang Y. et al., 2024; Wang L. et al., 2024; Wang X. et al., 2024), mass-balance method (Fiehn et al., 2020), and field experiments (Shi and Umair, 2024; Mathew et al., 2017; Béziat et al., 2009), etc., accounting covers testing only one type of carbon source (Guenet et al., 2021), testing multiple types of carbon sources (Guo et al., 2024; Xu et al., 2021; Tubiello et al., 2013), accounting based on the life cycle (Wang et al., 2019; Xia et al., 2016) to test the total carbon emissions from cropland utilization; the accounting of carbon sinks is mainly based on the economic yield, carbon sequestration rate, water content and economic coefficients calculated for crop carbon sinks on cropland (Wang Y. et al., 2024; Wang L. et al., 2024; Wang X. et al., 2024). In terms of spatial and temporal patterns, although the testing methods vary widely and no consistent conclusion has been reached, scholars generally agree that the global net carbon sink has shown an increasing trend in recent decades (Wei et al., 2024), and there are significant inter-regional differences in the net carbon sinks of Chinese provinces, and that the net carbon sinks are closely related to the structure of agricultural production (Wang Y. et al., 2024; Wang L. et al., 2024; Wang X. et al., 2024). In order to determine the causes affecting the carbon sources, scholars used the STARPAT model (Cui et al., 2022), LMDI decomposition model, spatial econometric model (Wang Y. et al., 2024; Wang L. et al., 2024; Wang X. et al., 2024; Wu et al., 2024), multimediation effect model (Ma et al., 2022), structural equation model SEM (Niu et al., 2021), and other methods to select key factors from all relevant aspects of social, economic, and agricultural production that affect carbon source and sinks for testing, and concluded that factors such as changes in agricultural demographics, the scale of land management, agricultural technology inputs, long-term rice expansion, and different farming systems and methods (Ma et al., 2022; Wu et al., 2024; Ciais et al., 2011; Zhao et al., 2024; Guo et al., 2024) have a direct impact on carbon emissions or net carbon sinks. In terms of the relationship between carbon emissions and economic indicators, scholars have examined the coupling or decoupling effects of carbon emissions with economic development (Pilatowska and Wlodarczyk, 2018; Mikayilov et al., 2018), food production (Wu et al., 2021) and other aspects using Tapio decoupling model, coupling coordination model and other methods; in terms of the carbon sink effects, the main focus has been on the importance of agricultural carbon sinks for the environment (Hastuti et al., 2022; Wei et al., 2024) and the carbon sink effects of certain types of species of plants (Anthony et al., 2023). The above research results demonstrate the effects and trends of the transformation of arable land use as a carbon source-sink, and suggest targeted optimization measures.
Based on the above policy context and literature background, the current research results still leave room for further exploration: (1) There is a lack of research on the net carbon sink effect of arable land use based on the Chinese perspective. Previous studies are mostly based on provincial and regional perspectives (Liu et al., 2021; Wang et al., 2021), and there are fewer systematic studies at the national scale. (2) Insufficient attention has been paid to the relationship between net carbon sinks from arable land use and food production. Previous studies have focused on carbon emissions from arable land use, and studies on net carbon sinks have focused on analyses of their relationship with agricultural economy (Li et al., 2022), and less on food production. Therefore, this paper portrays the temporal changes and spatial distribution patterns of carbon emissions and net carbon sinks by accounting for carbon emissions, carbon sequestration, and net carbon sinks from arable land utilization in 31 provinces (districts and cities) in China on this basis, it explores the coupling relationship between net carbon sinks and grain yields, and proposes corresponding optimization measures, so as to provide references for scientifically guiding the high-quality development of green agriculture in various regions, and to realize the ecological benefits and economic benefits. The potential marginal contributions of this study are as follows: First, it supplements the research on the relationship between net carbon sequestration in cropland use and grain yield. Building on existing studies that analyze the relationship between carbon emissions and grain production, this paper characterizes the coupling status of net carbon sequestration and grain yield at the national, regional, and provincial levels from a low-carbon and high-yield perspective. Second, it extends the application boundary of the Tapio coupling index. For the two positively correlated indicators of net carbon sequestration and grain yield, this work has redefined eight types of coupling status, which can be applied to the discussion of the relationship between ecological and economic benefit indicators.
2 Methods and data
2.1 Methodology for accounting carbon emissions from arable land use
Based on China’s current land-using policy and its characteristics of arable land utilization, carbon emissions are mainly manifested as direct or indirect greenhouse gas emissions produced by growers in the cultivation process. Firstly, carbon emissions from farming inputs (fertilizers, pesticides, agricultural films); secondly, carbon emissions from energy consumed by farming (diesel, electricity); and thirdly, organic carbon released by the destruction of soil organic carbon pools due to the act of tilling in the process of cultivation. The existing literature has not established a unified method for calculating carbon emissions from cultivated land use. However, agricultural carbon emission inventories, based on the authoritative IPCC guidelines and a unified accounting framework, are widely used for cross-regional comparisons. Referring to previous studies (Ding et al., 2019; Dubey and Lal, 2009; West and Marland, 2002) and authoritative laboratory data, the calculation of carbon emissions from cultivated land use is shown in equation 1, with carbon sources and emission factors listed in Table 1.
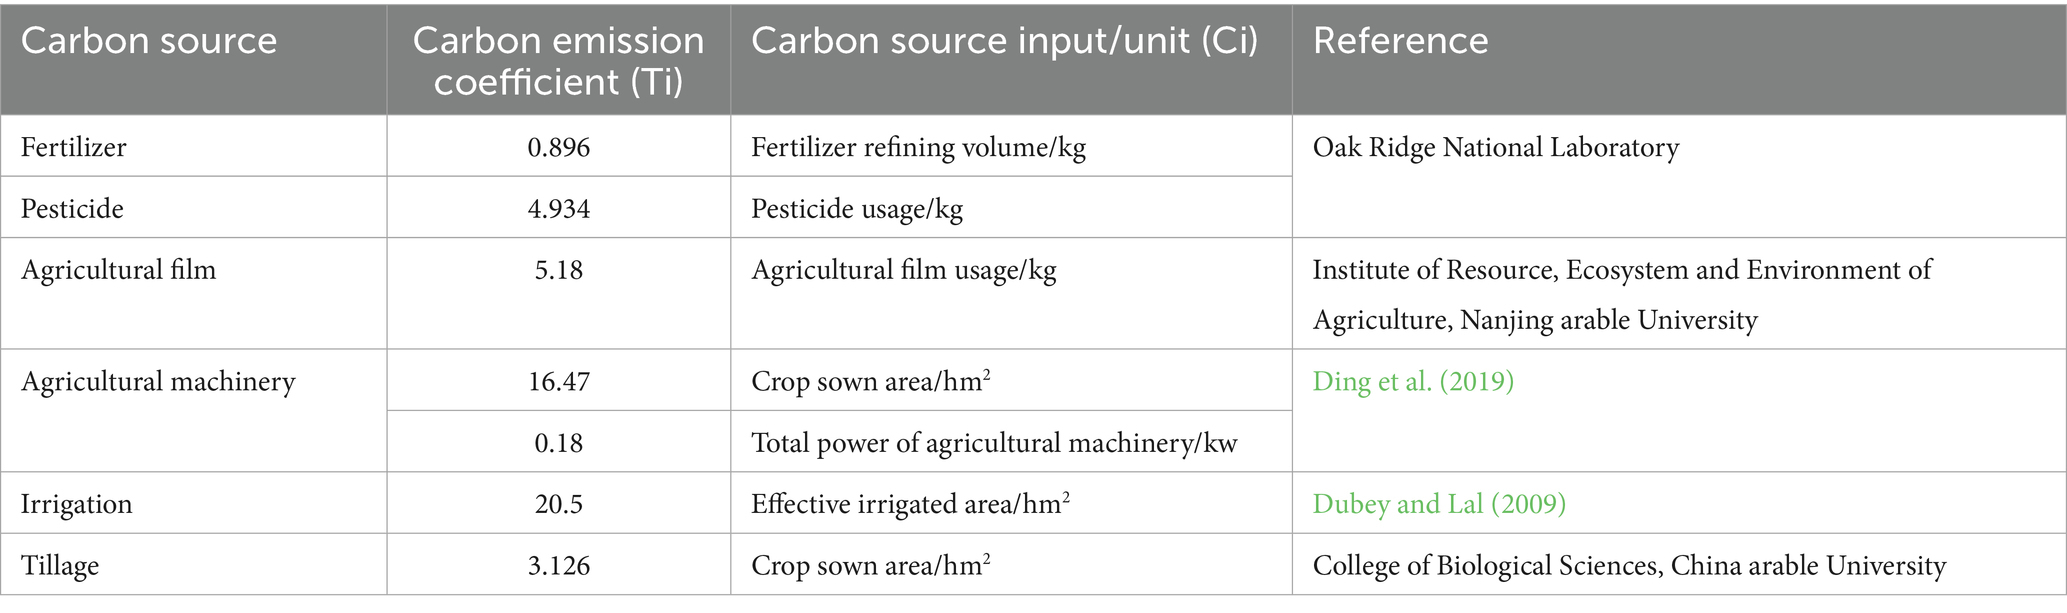
Table 1. Arable land utilization carbon sources and emission coefficient.
Where C is the total carbon emission from arable land utilization (in tons); Ci and Ti are the inputs and emission factors, respectively, for carbon source i (Table 1).
2.2 Carbon sequestration accounting methodology for arable land use
Cultivated land utilizing carbon sequestration refers to crops on cultivated land capturing and synthesizing airborne carbon into carbohydrates through photosynthesis. Based on the IPCC Guidelines for National Greenhouse Gas Inventories and related studies (Wang Y. et al., 2024; Wang L. et al., 2024; Wang X. et al., 2024), the widely used cultivated land carbon sequestration model was adopted to calculate the total carbon sequestration of crops on cultivated land, as shown in Equation 2. The economic coefficients and carbon sequestration rates of major crops in cultivated land (Table 2) were derived from literature (Li et al., 2022) and the Provincial Greenhouse Gas Inventory Guidelines.
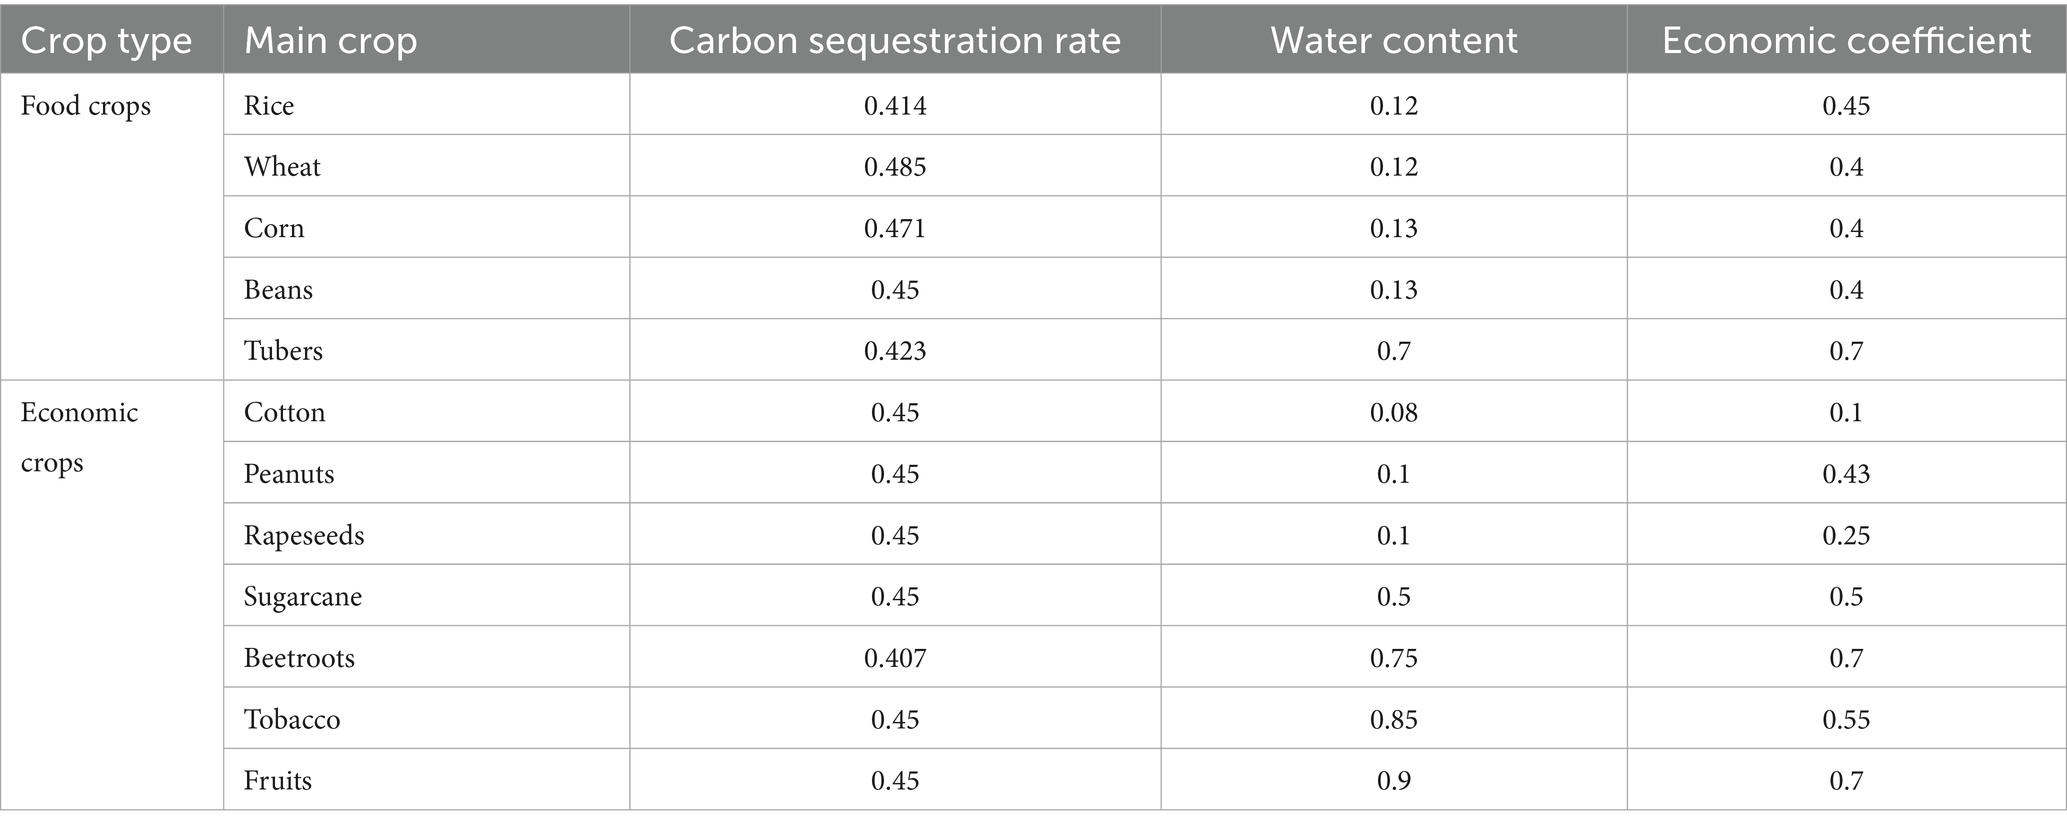
Table 2. Data related to carbon sequestration calculations.
Where Z is the carbon uptake by photosynthesis of the crop during the reproductive period; Di, δi, γi, and Hi are the economic yield, carbon sequestration rate, water content, and economic coefficient of crop i, respectively, as shown in Table 2.
2.3 Methodology for accounting for net carbon sinks from arable land use
Since arable land utilization has dual attributes, the net carbon sink is the balance of carbon sequestration (Z) minus carbon emissions (C) from arable land utilization. The net carbon sink (S) is calculated as shown in equation 3.
When carbon uptake exceeds carbon emissions, i.e., when S is greater than 0, the utilization of arable land is a carbon sink effect; when carbon uptake is lower than carbon emissions, i.e., when S is less than 0, the utilization of arable land is a carbon source effect; when carbon uptake is equal to carbon emissions, i.e., when S = 0, the utilization of arable land realizes carbon balance.
2.4 Coupling index based on Tapio’s decoupling concept
The term “decoupling” originally comes from the field of physics, referring to the state where the relationship between two or more physical quantities no longer exists, that is, a state of decoupling. At the end of the 20th century, Weizsäcker and Schmidt-Bleek from the Wuppertal Institute in Germany proposed the “4-/10-fold decoupling” target (Weizsäcker et al., 1997), advocating to increase global resource use efficiency four-fold and that of developed countries 10-fold through technological progress within 50 years, thereby achieving decoupling between resource consumption and economic growth. Since then, two relatively classic decoupling models have been developed:
1. OECD Decoupling Factor (OECD, 2002). The OECD (Organization for Economic Co-operation and Development) Environment Institute used decoupling to describe the disconnection between economic growth and environmental pollution, or to make the rates of change of the two asynchronous. There are two types of decoupling: absolute decoupling and relative decoupling. The specific calculation is the ratio of the current environmental load indicator to the economic driving force indicator divided by the ratio of the base period environmental load indicator to the economic driving force indicator.
2. Tapio Model (Tapio, 2005). Given the simplicity of the decoupling types proposed by the OECD and the dilemma in choosing the base period when calculating the decoupling index, Tapio introduced the concept of decoupling elasticity and refined the decoupling types in 2005, based on the OECD. Eight decoupling states (weak decoupling, strong decoupling, weak negative decoupling, strong negative decoupling, expansion negative decoupling, expansion connection, recession decoupling, and recession connection) were established to reflect the sensitivity of environmental pressure changes to economic growth. In Tapio’s decoupling types, strong decoupling is the ideal state, indicating a reduction in environmental pressure while the economy grows.
Considering that the Tapio decoupling index focuses on the relationship between two counter-directional indicators, while net carbon sink and grain yield are co-directional indicators, representing the ecological and economic benefits of cropland use respectively, it is not appropriate to directly apply the concept and classification criteria of the Tapio decoupling index. Therefore, this paper redefines the coupling index of cropland use net carbon sink and grain yield based on the original Tapio decoupling index, with the calculation formula shown in equation 4.
Where ε is the coupling index, reflecting the growth elasticity of food production of the net carbon sink utilized by arable land. δS and δA are changes in net carbon sinks and food production, respectively; Si and Ai are net carbon sinks and food production for the current period, respectively; S0 and A0 are net carbon sinks and food production for the base period, respectively. As shown in Figure 1, there are eight coupling states based on the relationship between net carbon sinks in arable land use and food production.
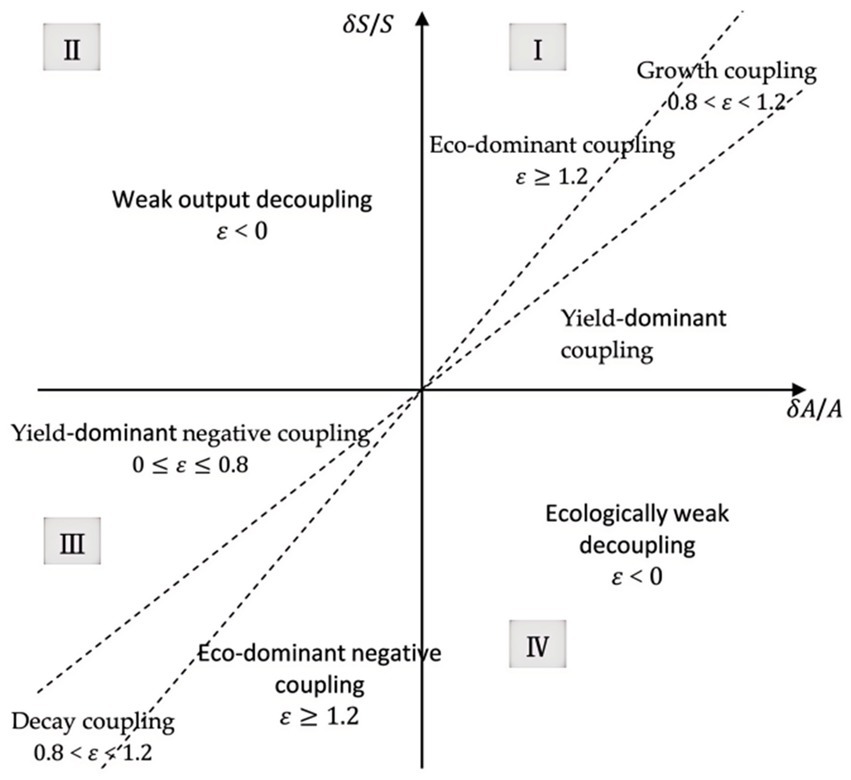
Figure 1. Types of coupling of net carbon sinks between arable land use and grain production.
As depicted in Figure 1, there are eight possible coupling states based on the relationship between cropland use net carbon sinks and food production. The growth coupling index in the first quadrant ranges from 0.8 to 1.2, indicating that the growth rates of net carbon sinks and food production are closely aligned. The ecologically dominant coupling index is higher than 1.2, suggesting that the growth rate of net carbon sinks exceeds that of food production. Conversely, the yield-dominant coupling index, which is between 0 and 0.8, indicates that the growth rate of net carbon sinks is lower than that of food production.
The indices of yield-weakened decoupling and ecological-weakened decoupling, located in the second and fourth quadrants, respectively, are both less than 0. This implies that there is a negative relationship between the growth of net carbon sinks and the decline of grain production, and vice versa. The index of recession coupling, found in the third quadrant, ranges from 0.8 to 1.2, indicating that the rate of reduction of net carbon sinks is consistent with the rate of reduction of grain production. The index of ecologically dominant negative coupling is higher than 1.2, suggesting that the rate of decline of the net carbon sink exceeds the rate of decline of food production. Finally, the negative coupling index of the yield-dominant type, which ranges from 0 to 0.8, indicates that the rate of decline of the net carbon sink is lower than the rate of decline of food production. Unlike the Tapio decoupling index, the coupling index studies two co-directional indicators, and its ideal relationship is synchronous increase, that is, positive coupling. Therefore, the states in the first quadrant are superior to those in the second, third, and fourth quadrants. In the first quadrant, relatively speaking, growth coupling is better than ecological dominance coupling and yield dominance coupling, and is the optimal state.
2.5 Data source
The data used for China’s 31 provinces (districts and cities) are from the China Rural Statistical Yearbook (1990–2023) and provincial and regional statistical yearbooks, excluding Taiwan, Hong Kong, and Macao. As shown in Table 3, among the relevant indicators affecting carbon emissions, the standard deviation of the total power of agricultural machinery is the largest, indicating that there are evident differences in the use of agricultural machinery for farming in each province, which can be used as a critical area of concern for low-carbon emission reduction.
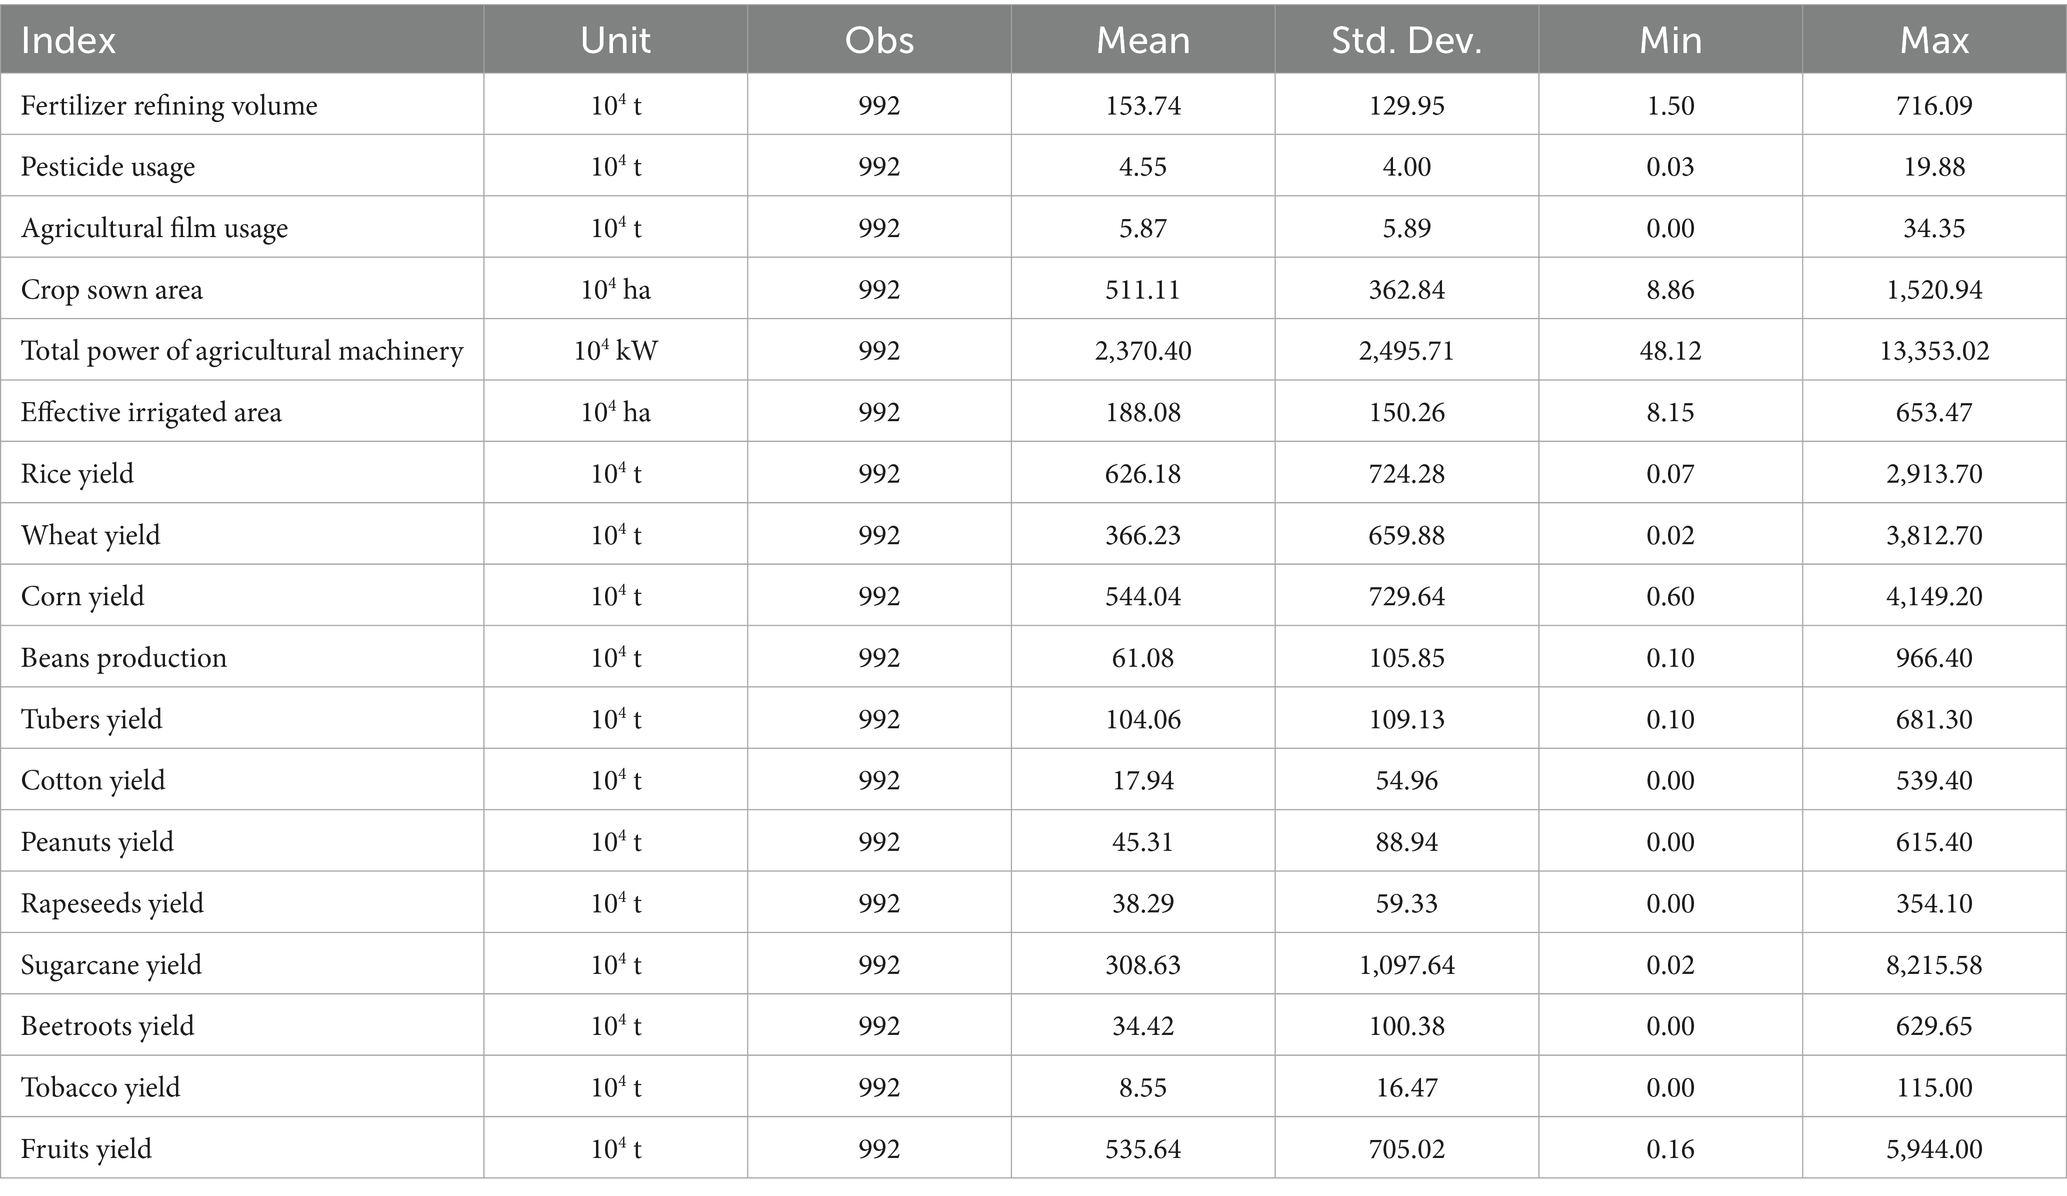
Table 3. Descriptive statistics of data relevant to the calculation of net carbon sinks, 1991–2022.
3 Results and analyses
3.1 Spatial and temporal variations in carbon emissions from arable land use
3.1.1 Chronological change in carbon emissions from arable land use
From 1991 to 2015, China’s carbon emissions from arable land use showed an upward trend and then turned into negative growth after 2016, and the total carbon emissions began to decline (Figure 2). This conclusion is consistent with existing research (Wang Y. et al., 2024; Wang L. et al., 2024; Wang X. et al., 2024). The main reason for the negative growth in cropland carbon emissions in 2016 is that the government introduced several ecological protection policies targeting the agricultural environment, such as the zero-growth policy for chemical fertilizers and pesticides, as well as subsidies for the protection and quality improvement of farmland. From the point of time, China’s carbon emissions from arable land use were 36.9707 million tonnes in 1991, and their value will be 68.6452 million tonnes in 2022, nearly doubling the total carbon emissions. The growth rate of carbon emissions fluctuates greatly from year to year, from a maximum of about 8% to the current negative value. The lowest growth rate is −4.06% in 2019, which shows the development potential and possibility of green and low-carbon agriculture in China and also indicates that the concept of green development put forward by the Chinese government has been put into practice in the field of agricultural production. The momentum of development has been gradually improving. In addition, after analyzing the carbon source factors affecting carbon emissions, it was found that the average annual growth rates of chemical fertilizers, pesticides, agricultural machinery, agricultural films, agricultural irrigation, and tilling were 1.98, 1.59, 0.57, 3.75, 1.26, and 0.42%, respectively, and that the chemicalization and mechanization of agriculture had caused an increase in the use of arable land to emit carbon.
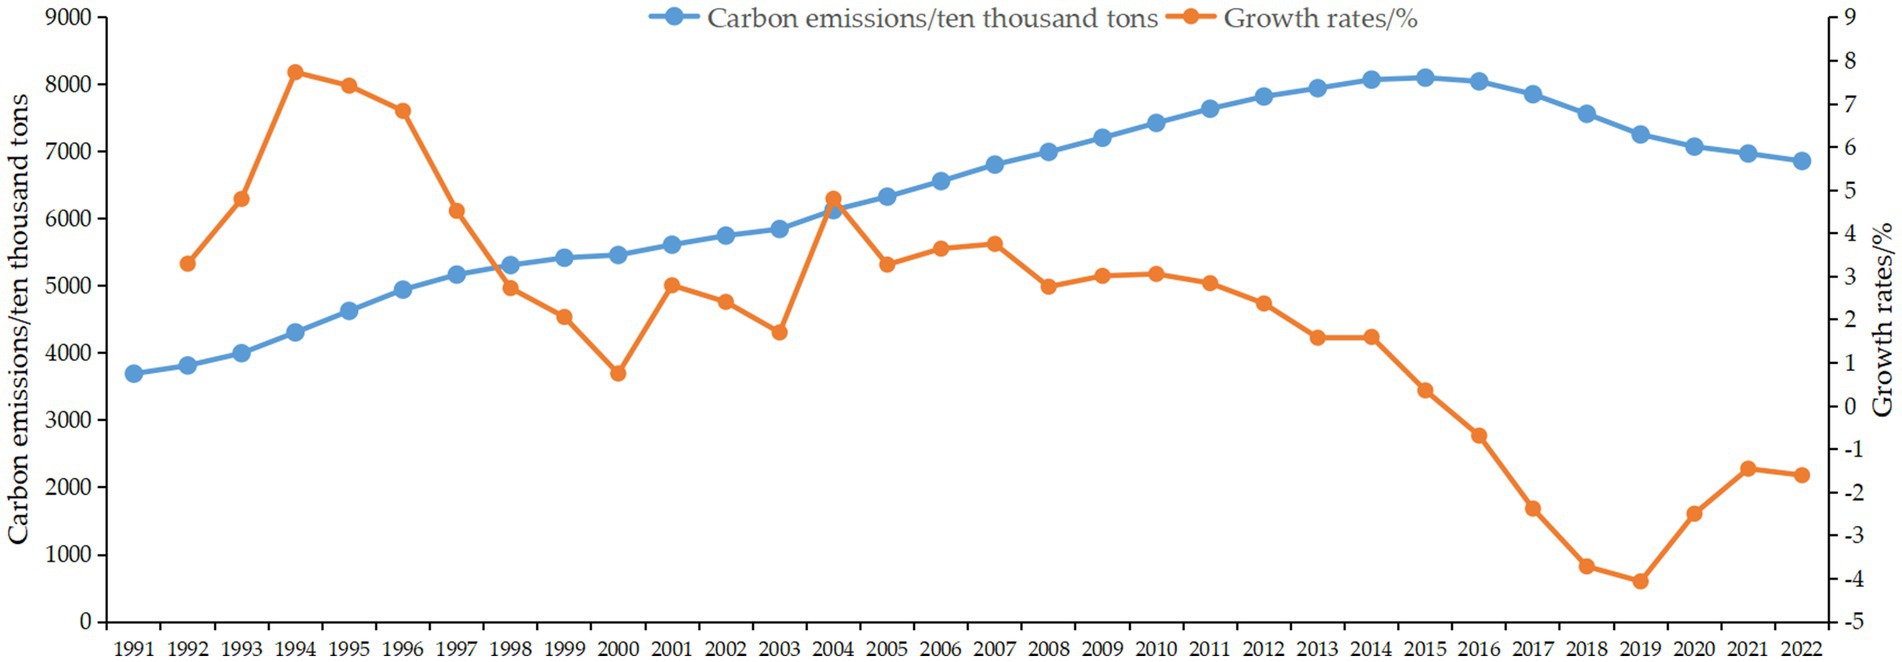
Figure 2. Time series of carbon emissions and growth rate of arable land utilization in China, 1991–2022.
3.1.2 Spatial distribution of carbon emissions from arable land use
Figures 3A–D shows China’s carbon emissions in 1991, 2000, 2010, and 2022, respectively. Meanwhile, to compare the changes in carbon emissions of each province in the above 4 years, the carbon emissions were classified into 5, 4, 3, 2, and 1 from high to low using the natural discontinuity method.
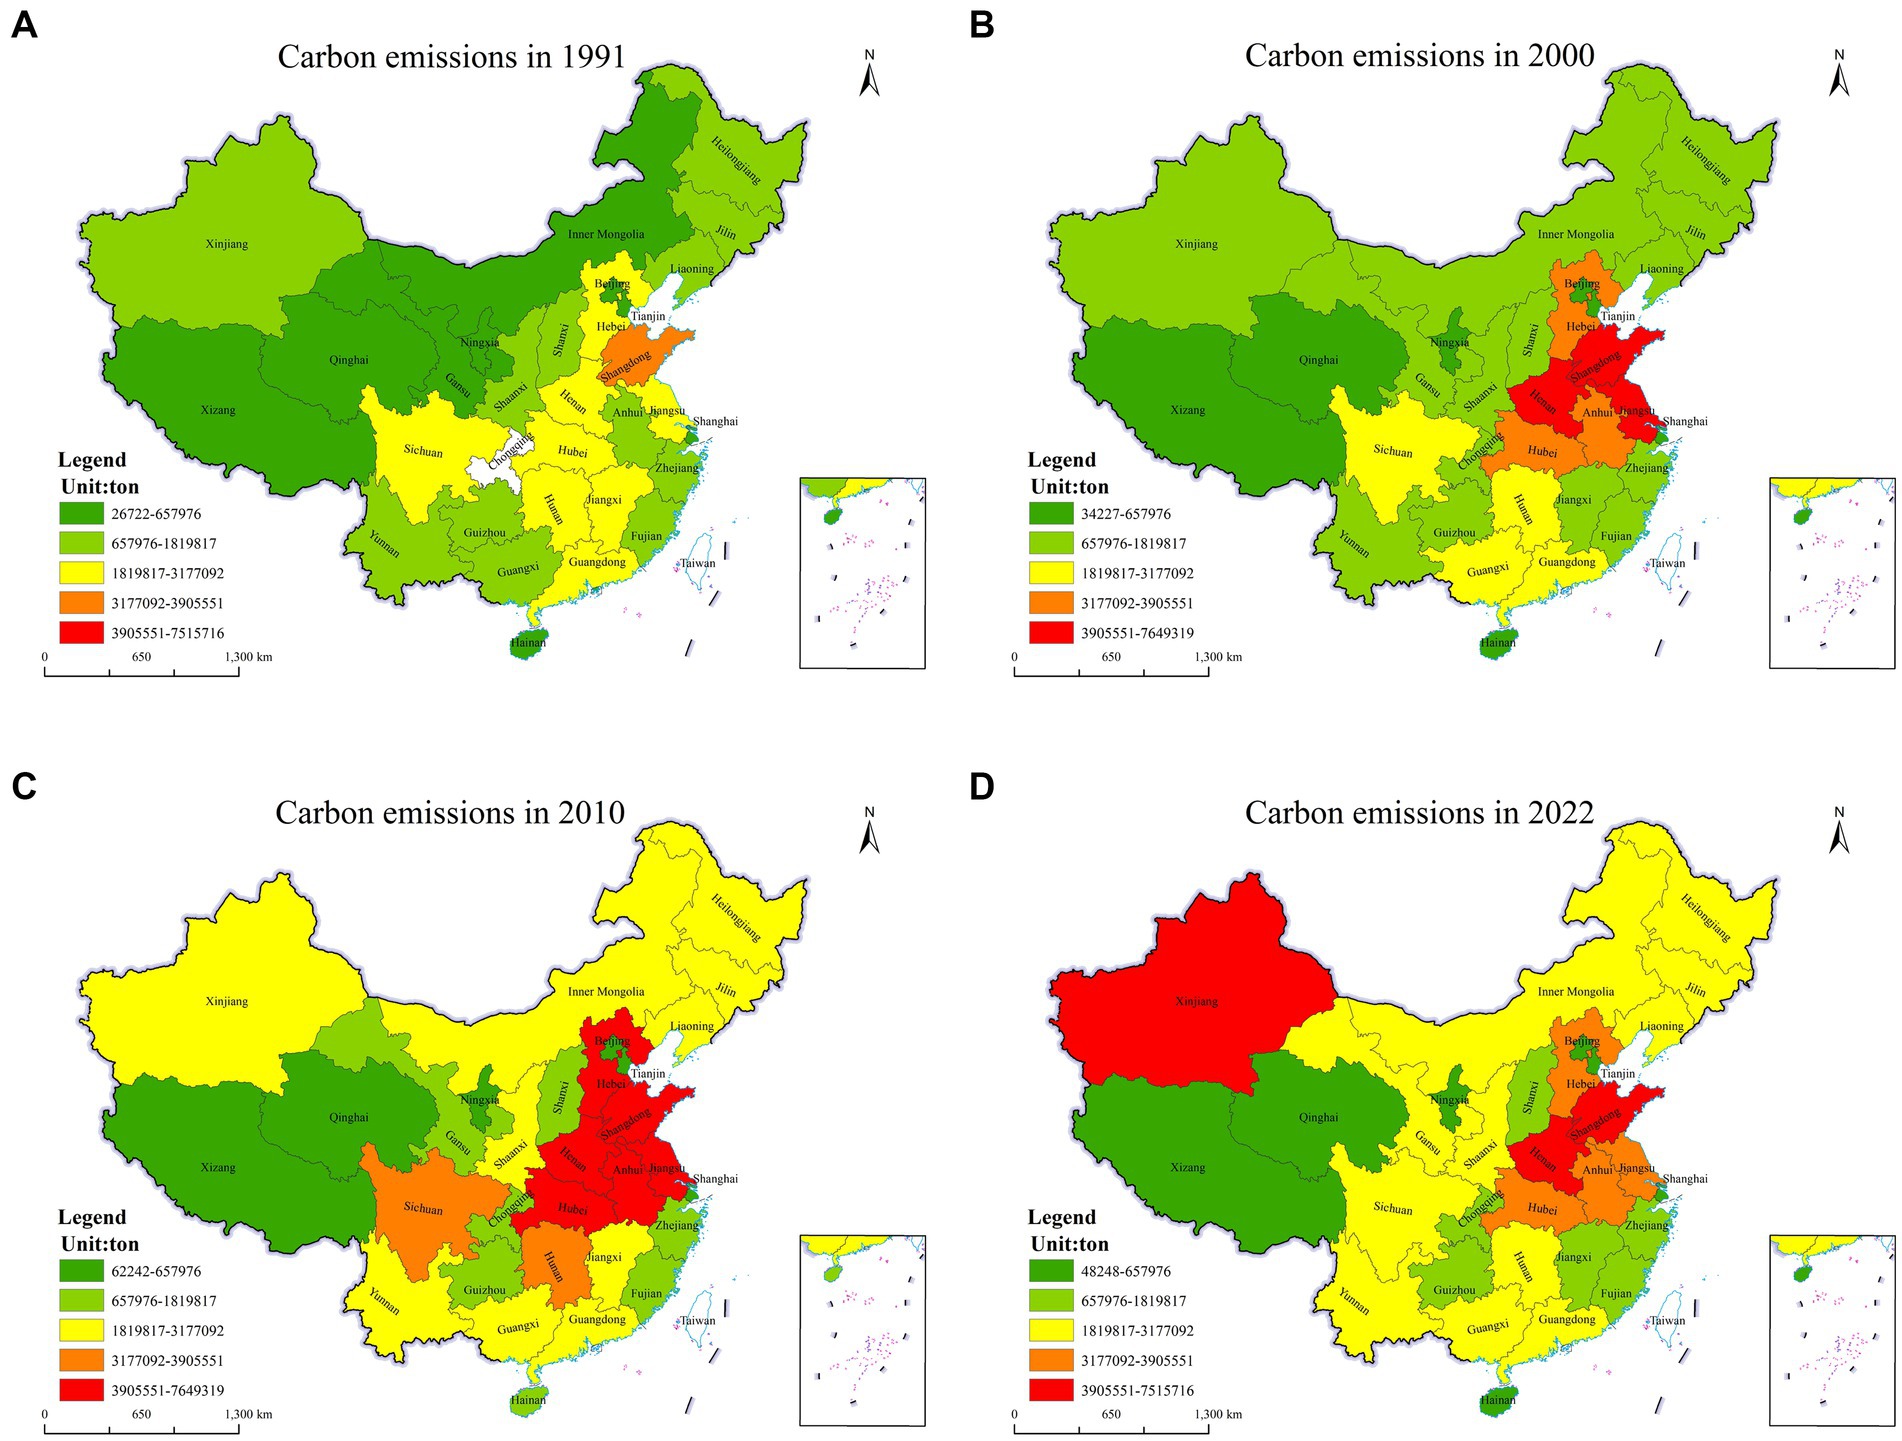
Figure 3. Carbon emissions from arable land use in China, (A) 1991, (B) 2000, (C) 2010, and (D) 2022.
As shown in Figure 3, at the provincial level, Tier 1 and Tier 2 carbon emitting provinces tend to decrease; Tier 1 carbon emitting provinces decrease from 9 provinces in 1991, including Inner Mongolia, Ningxia, and Qinghai, to 7 provinces in 2022; Tier 2 carbon emitting provinces decrease from 12 provinces in 1991, including Heilongjiang, Jilin, and Xinjiang, to 6 provinces in 2022; in 2010, there is a significant increase in the number of provinces that will change from Tier 2 to Tier 3, including seven provinces in Xinjiang, Inner Mongolia, Yunnan, and Guangxi; Gansu Province will also change to a Tier 3 carbon emitting region in 2022. From 1991 to 2022, Tier 5 carbon-emitting provinces add Henan, Shandong, and Xinjiang, and Tier 4 carbon-emitting provinces add Hebei, Hubei, Anhui, and Jiangsu. Compared with 1991, the differences in carbon emissions among provinces were more pronounced in 2022. According to existing literature (Wu et al., 2024; Wang Y. et al., 2024; Wang L. et al., 2024; Wang X. et al., 2024), the core reasons for the widening differences in carbon emissions among provinces are the regional disparities in land management scale, the regional heterogeneity of the types of dominant agricultural activities, the limitations of natural conditions and resource endowments, and the impact of policies and technology levels. At the regional level, in 2022, among the main grain-producing regions2, there are six provinces located in level 3, four in level 4, and two in level 5; among the non-main producing regions, there are five provinces located in level 3, one in level 5, and all the other provinces are located below level 3. Meanwhile, in the main grain-producing regions, the average annual carbon emissions of the provinces are 42,716,980 tonnes, while those of other non-main grain-producing provinces are only 20,641,940 tonnes, which is twice as much as the difference between the two. It should also be noted that, despite the higher carbon emissions of the provinces in the main grain-producing regions, Jiangxi’s carbon emissions in 2022 will only be level 2, which is a strong demonstration in the entire main grain-producing regions and also shows the province’s effectiveness in reducing carbon emissions. In contrast, Xinjiang, Yunnan, Guangxi, and Guangdong, especially Xinjiang, have the highest carbon emission level of Level 5, indicating that the province is still facing the real dilemmas of the slow transformation of production patterns and the lack of popularity of the concept of green agriculture. Therefore, at the current stage, as the provinces in major food-producing regions have the impetus for agricultural technological change and broad market space, they should actively introduce new quality productivity represented by science and technology to promote high efficiency and high-quality agricultural production at the same time, they should also break through the inherent pattern of traditional agricultural development in non-major food-producing regions to weaken the negative impact of these regions on carbon emission reduction.
3.2 Spatial and temporal changes in net carbon sinks from arable land use
3.2.1 Chronological change of the net carbon sink of arable land use
From 1991 to 2022, the total net carbon sink associated with China’s arable land use exhibited a general upward trend. Specifically, it increased from 404.6 million tonnes in 1991 to 67.5 million tonnes in 2022. The total net carbon sink during the 32 years has always been positive, with an average of 512,550,000 tonnes per year, a significant effect of carbon sinks and a sound positive externality.
As shown in Figure 4, the period 1991–2022 can be divided into two phases according to the temporal characteristics: the first phase is 1991–2014, in which the total net carbon sinks show fluctuating growth, of which there is also a significant decline between 1999–2003 and 2008–2010. According to the relevant literature (Li et al., 2022), the first decline was mainly affected by the backward level of agricultural development and low overall efficiency at that time, which made agricultural development fall into a bottleneck, with large inter-annual fluctuations in the scale of crop cultivation, and low incentives for inputs of agricultural materials. In 2004, the Chinese government issued Central Document No. 1 concerning agriculture after 18 years, and in the following 5 years, a series of supporting policies aimed at solving the problems of agriculture, farmers, and rural development were introduced, which brought great opportunities for China’s agricultural development, with a significant increase in mechanized operations and inputs of farm materials, and obvious characteristics of rough development, resulting in the second decline in net carbon sinks, and a slow increase in net carbon sinks after 2010. The second stage is 2015–2022, in which the total net carbon sink shows high growth. Since the 18th Party Congress, a number of comprehensive treatments have been carried out in the agricultural sector, such as the promotion of soil-formula fertilizer application techniques, the strengthening of green pest control, the development of the comprehensive utilization of straw, and the enhancement of agricultural film recycling, which have contributed to a high rate of increase in the net carbon sink. Overall, with the promotion of green production technologies, the function of China’s arable land as a carbon sink continues to grow, making a useful contribution to achieving the “30–60” carbon reduction target.
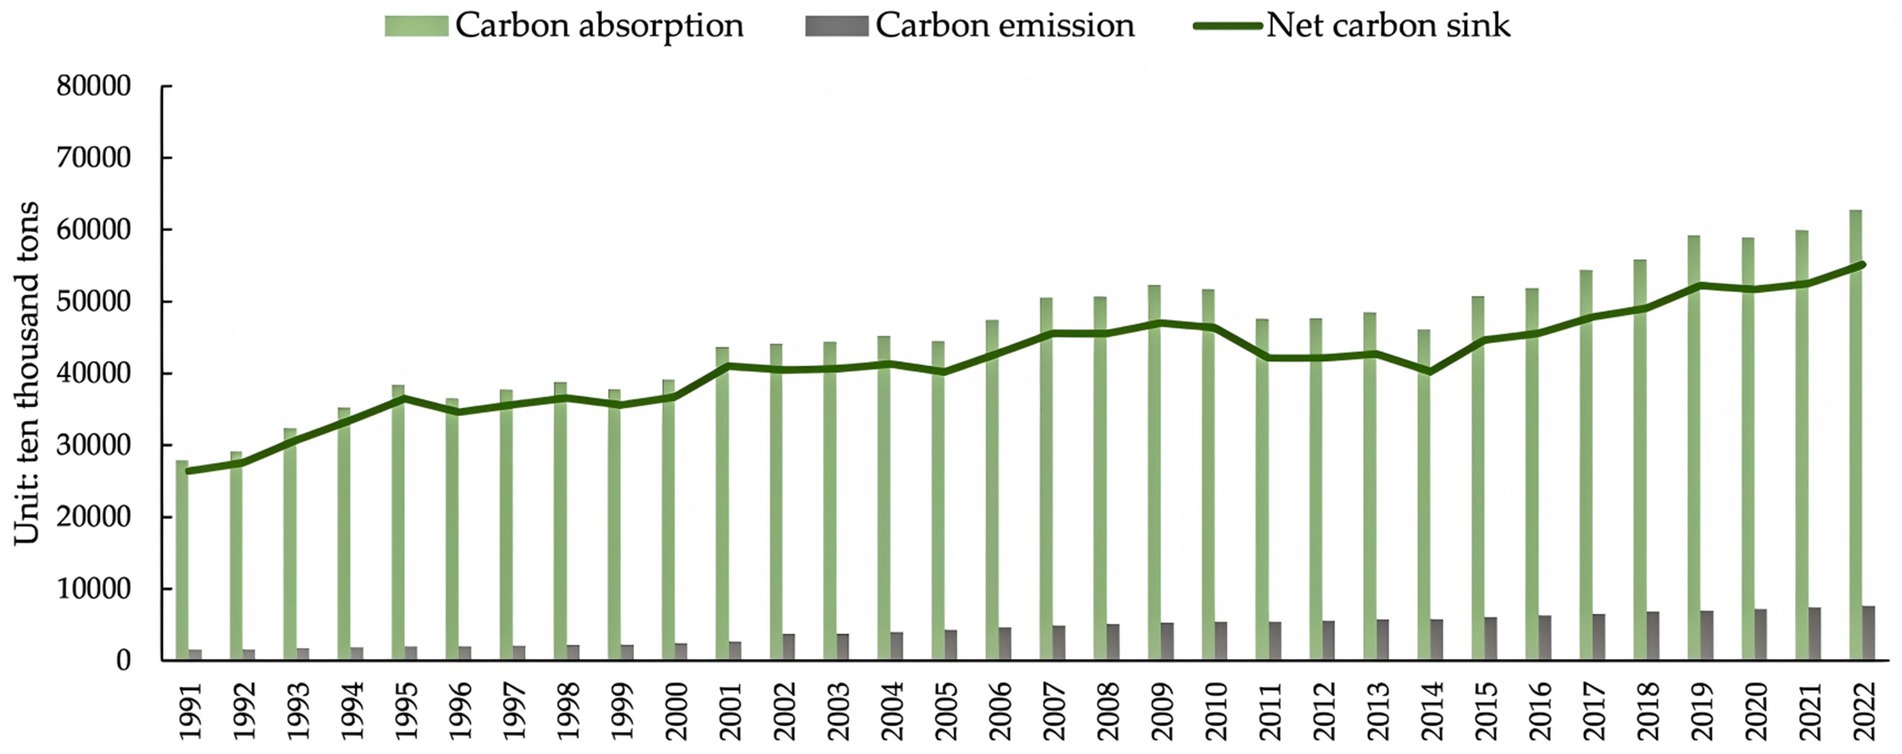
Figure 4. Time-series changes in net carbon sinks from arable land use in China, 1991–2022.
3.2.2 Spatial distribution pattern of net carbon sinks from arable land use
As shown in Figures 5A–D, China’s net carbon sinks are shown in 1991, 2000, 2010, and 2022, respectively. Figure 5E reflects the average annual net carbon sink in each province during the 32-year period. Similarly, in order to compare the changes of net carbon sinks of each province in the above 4 years, the net carbon sinks were classified into 6, 5, 4, 3, 2, and 1 from high to low using the natural discontinuity method.
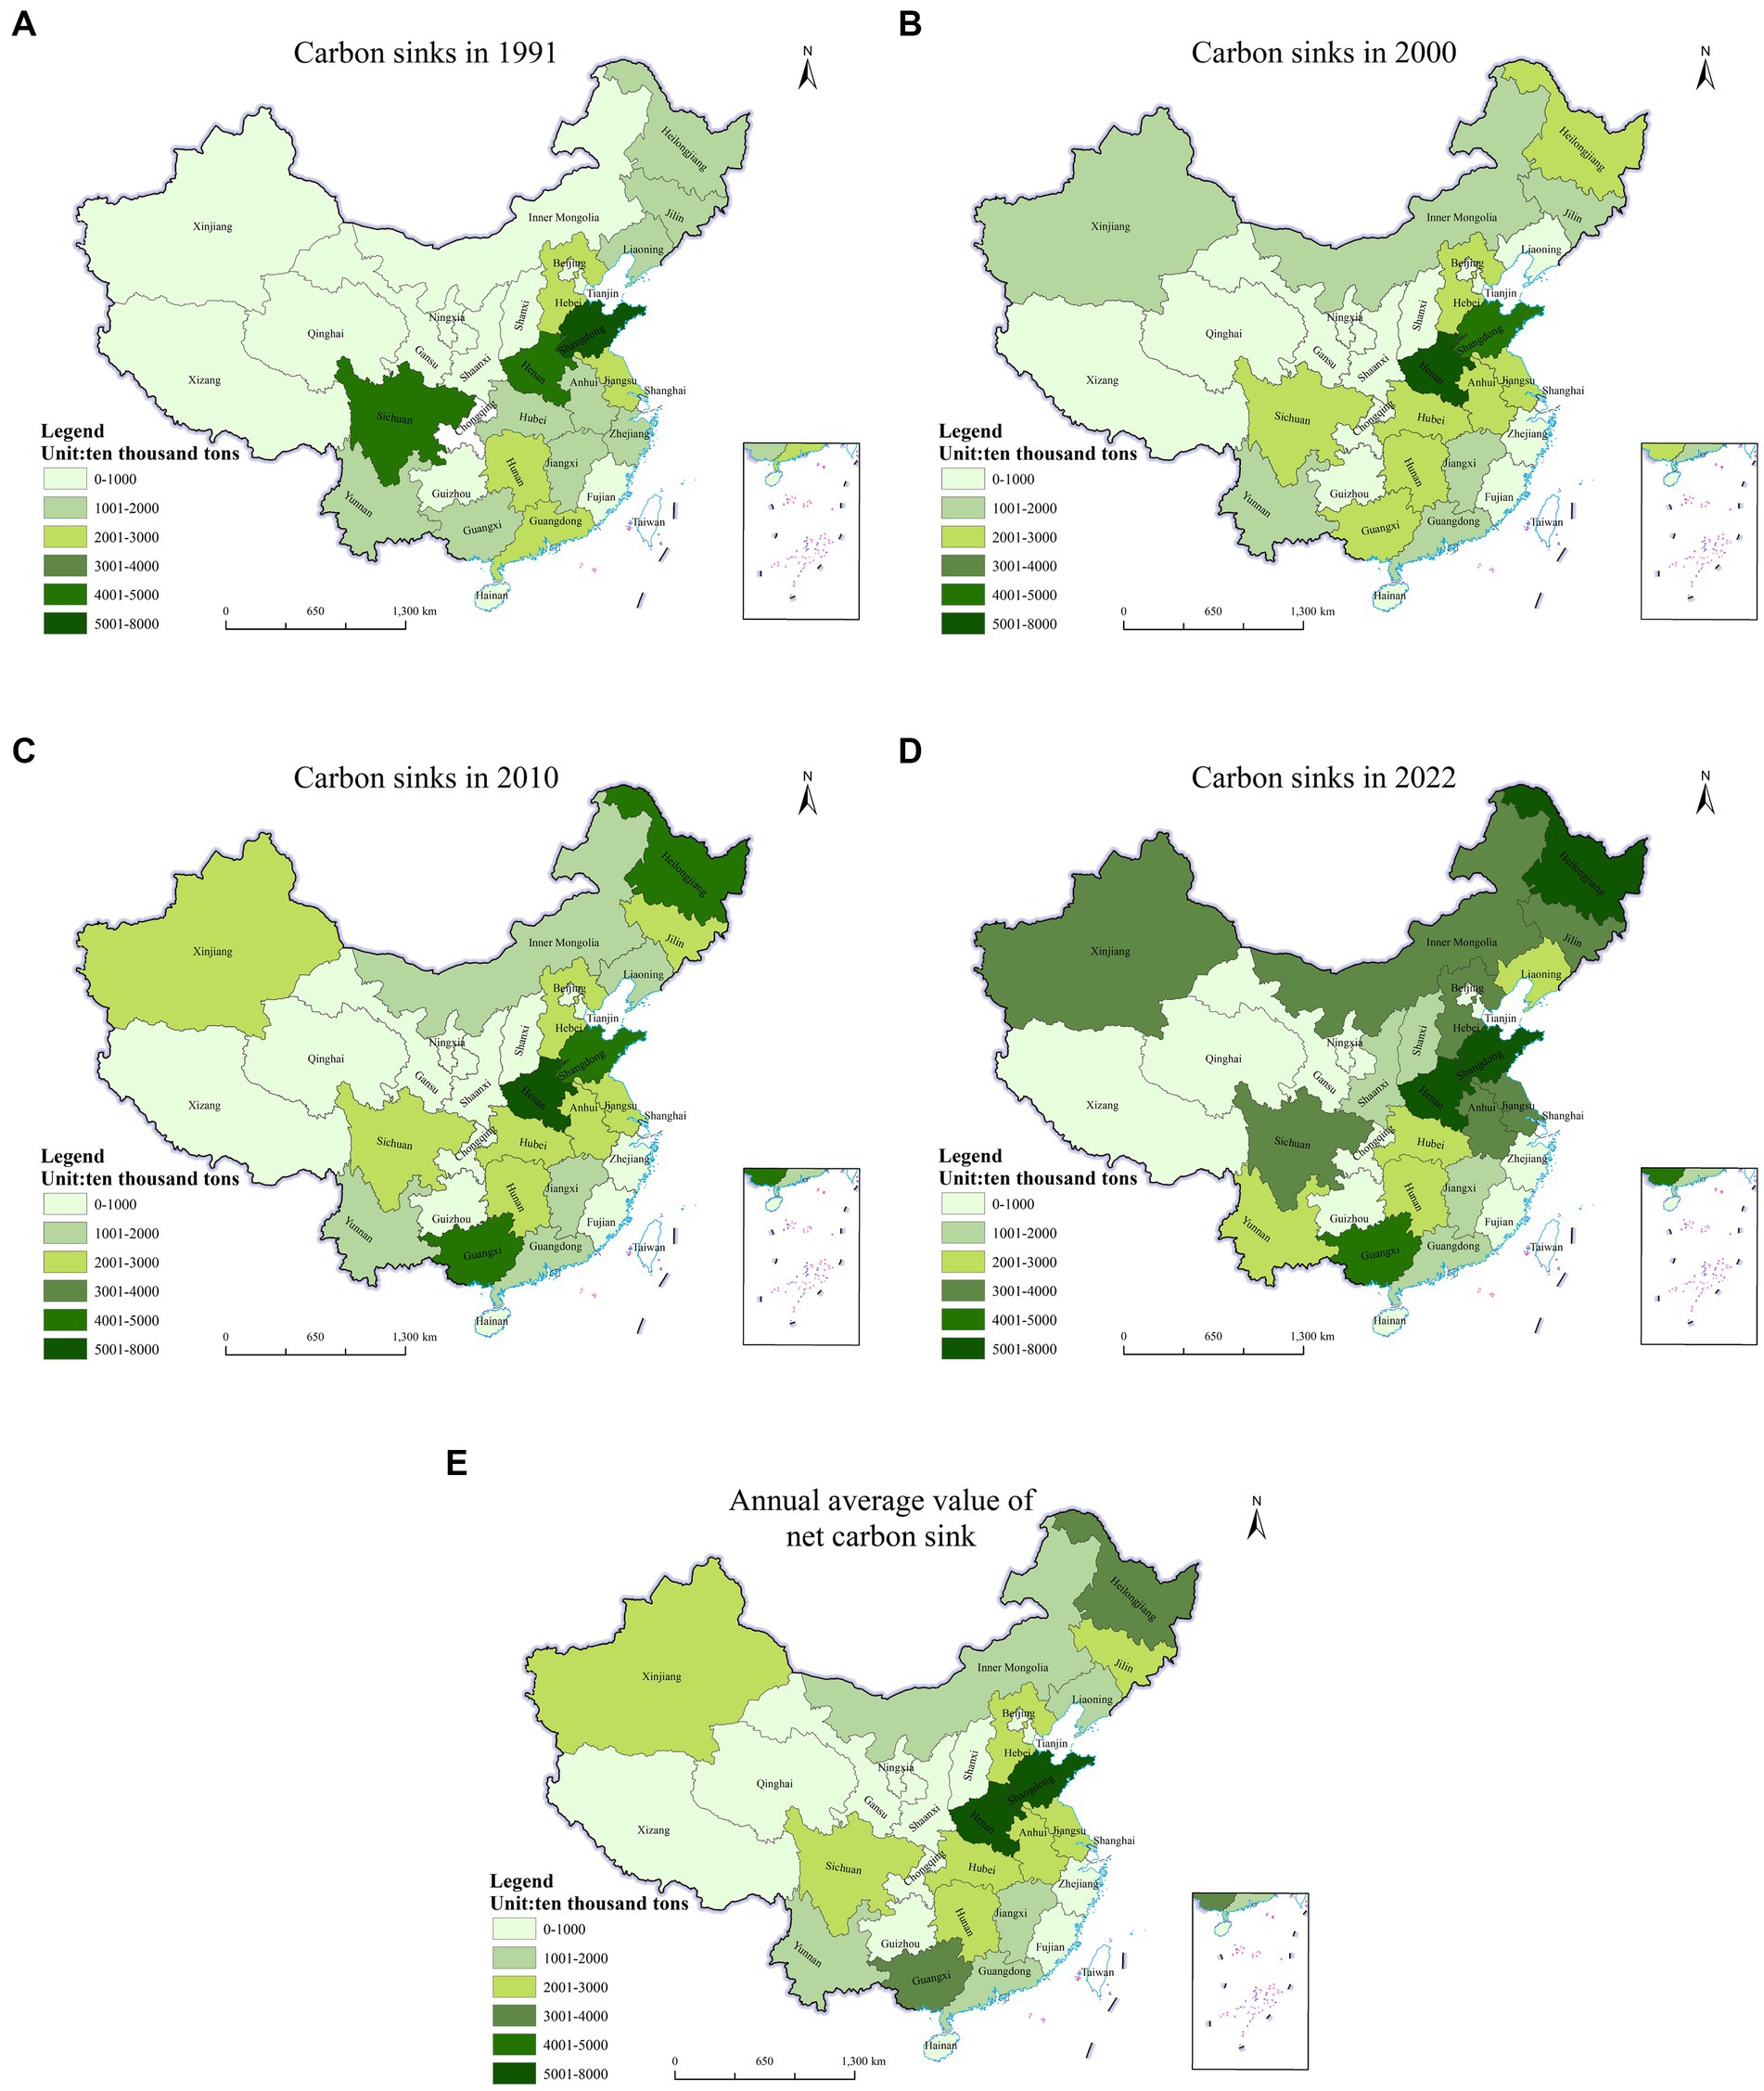
Figure 5. Spatial distribution of arable land utilization net carbon in China in selected years. (A) Carbon sinks in 1991, (B) Carbon sinks in 2000, (C) Carbon sinks in 2010, (D) Carbon sinks in 2022, and (E) Annual average value of carbon sinks.
As shown in Figures 5A–D, at the provincial level, over the past 32 years, the number of provinces in China where the net carbon sinks of arable land are at level 3 and above has been increasing. In 1991, there were seven provinces where the net carbon sinks were at level 3 and above. The net carbon sinks of these seven provinces, in descending order, were in Shandong (level 5), Sichuan and Henan (level 4), and Hebei, Hunan, Jiangsu, and Guangdong (level 3); all other provinces are below level 3. In 2000, the number of provinces with net carbon sinks at level 3 and above increased to 10, with the addition of Guangxi, Hunan, Anhui, and Heilongjiang, and the reduction of Guangdong from level 3 to level 2. In 2010, there were 12 provinces with net carbon sinks at level 3 and above, with Henan rising from level 5 to level 6, Shandong, Heilongjiang, and Guangxi being added to level 5. By 2022, the number of provinces located at level 3 and above has reached 15, while the number of provinces at level 4 and above has increased from 4 in 2010 to 11. The comparison of the 4 years shows that the evolution of net carbon sinks at the provincial level is characterized by the following features: firstly, there is a significant increase in the number of provinces with high values of net carbon sinks as a whole; and secondly, there is a significant increase in the net carbon sinks of individual provinces. At the regional level, in 2022, there are 12 provinces located at level 3 and above in the main food-producing regions and 3 at level 3 and above in the non-main-producing regions, with a large difference between the two. Therefore, the main food-producing regions have significant carbon sink functions, resulting in higher total net carbon sinks and obvious positive externality characteristics.
As illustrated in Figure 5, at the provincial level, the high annual average net carbon sink of arable land use across the 32-year period is characterized by a spatially dispersed distribution. Henan and Shandong, as traditional agricultural provinces with annual average net carbon sinks of more than 40 million tonnes, are at level 5, which is at the forefront of the country. This is followed by two places (Heilongjiang and Guangxi) at level 4, with an average annual net carbon sink of over 30 million tonnes, and eight places (Xinjiang, Jilin, Anhui, Jiangsu, Hebei, Sichuan, Hubei, and Hunan) at level 3, with an average annual net carbon sink of over 20 million tonnes. From the regional level, this indicator is 27,856,700 tonnes, 10,627,300 tonnes, and 4,781,200 tonnes in the main food-producing regions, the balance of production and marketing areas and the main marketing provinces, respectively, i.e., the average annual net carbon sinks of the three regions are decreasing in multiples. Combining regional and provincial carbon emissions, it can be found that the main grain-producing areas basically have the characteristics of high carbon emissions and high carbon sinks. The carbon emission and sink characteristics of non-food producing areas are more diversified, such as Guangxi and Xinjiang, which are more consistent with the characteristics of food-producing provinces, showing the “double high” phenomenon; Yunnan and Guangdong are one high, and one low, i.e., they have the characteristics of high carbon emissions and low carbon sinks; The economically developed areas such as Beijing, Shanghai, Zhejiang, and Fujian where farming is not a center of development, have double-low characteristics, i.e., low carbon emissions and low carbon sinks co-exist. Therefore, based on different resource endowments and agricultural production methods, policies and measures for green agricultural development and low-carbon emission reduction should be differentiated among regions and provinces so as to point out the direction of their respective responsibilities and to avoid waste of resources and environmental damage.
3.3 Coupling effects of net carbon sinks on arable land and grain yield in China
3.3.1 Relationship between net carbon sinks and food production
As shown in Figure 6, the horizontal axis represents grain production (million tonnes). The vertical axis represents net carbon sinks (million tonnes) in each province, with the mean value of the two over 32 years as the origin. The first quadrant is a high-sink high-production area, the second is a high-sink low-production area, the third is a low-sink low-production area, and the fourth is a low-sink high-production area. The figure reflects the characteristics of the relationship between the ecology of arable land systems and food production in each province.
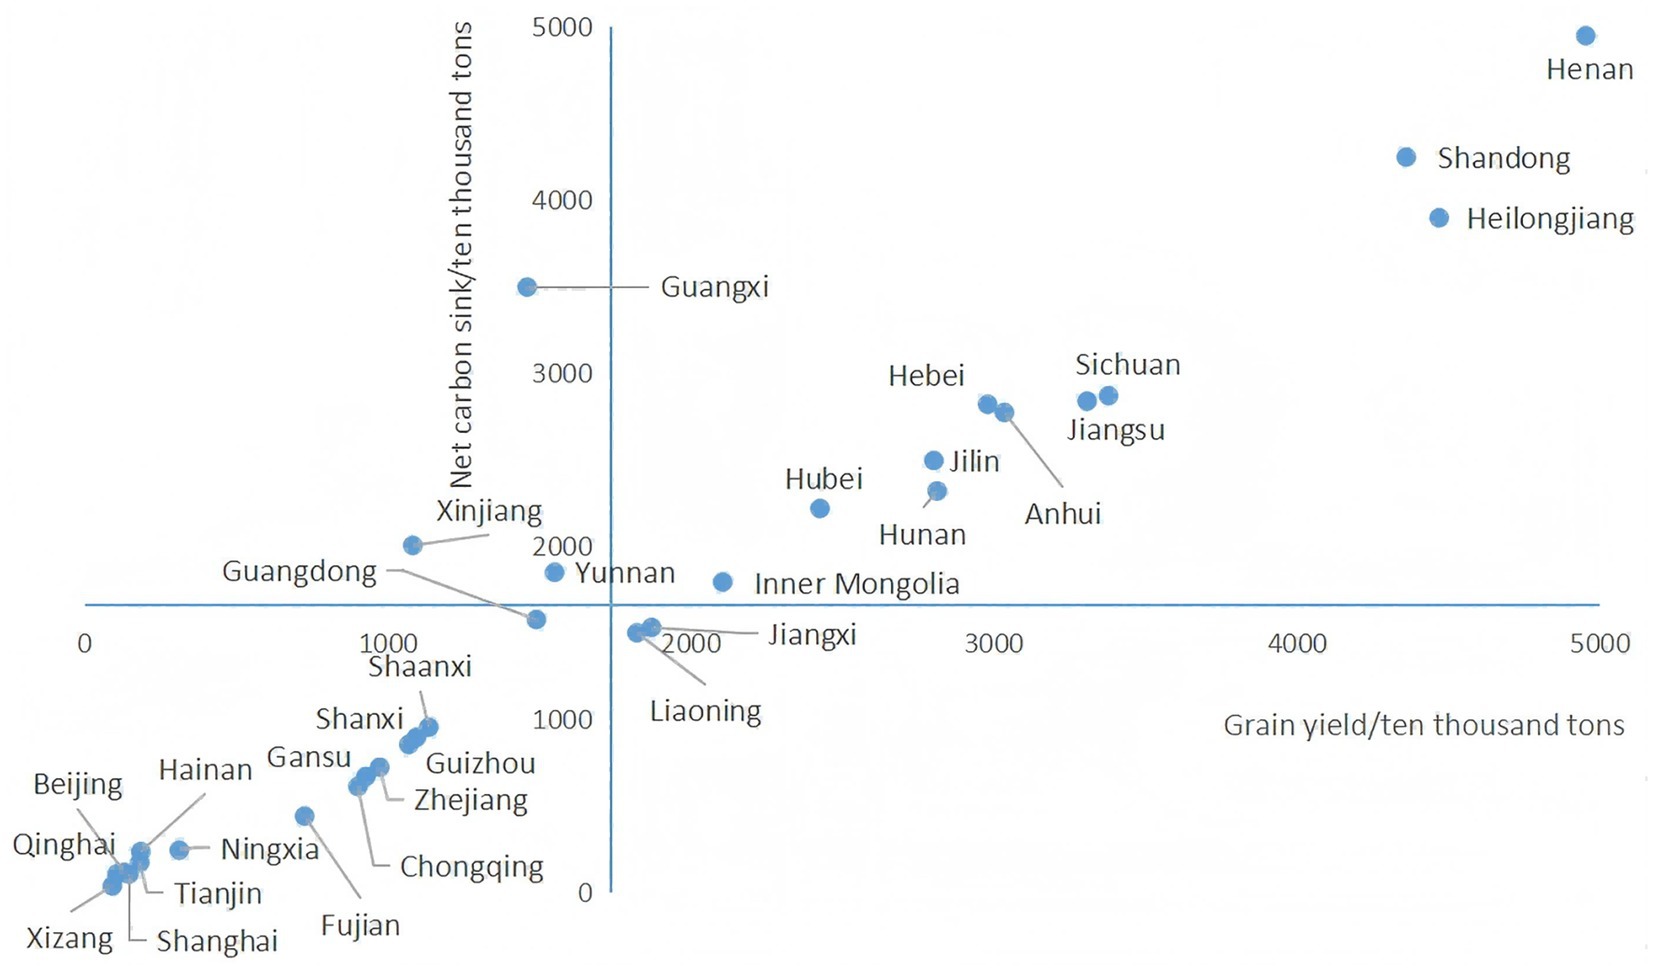
Figure 6. Provincial typology of net carbon sinks and food production.
As shown in Figure 6, the first quadrant belongs to the high-sink-high-yield region, and 11 large agricultural provinces are located in the region, indicating that these provinces have balanced the ecological environment and food security, which is the most favorable relationship between ecological and economic benefits. The two main grain-producing provinces that are not in the first quadrant are Jiangxi and Liaoning, which are located in the fourth quadrant and belong to the low-sink-high-yield region, which means that although the grain production of these two provinces is high, the scale of their carbon emissions has already exceeded the ecological environment’s ability to withstand the appropriate state. Therefore, more efforts should be made to promote the development path of low-carbon green agriculture in the two provinces of Jiangxi and Liaoning. Guangxi, Xinjiang and Yunnan are in the second quadrant, which belongs to the high sink-low production type. These provinces do not have outstanding food production, but they have better carbon sink effects, which ultimately manifests as a more significant ecological advantage. Other provinces belong to the low-sink and low-production area, with net carbon sinks and grain production below average, such as Guangdong, Shaanxi, Shanxi, Guizhou, Gansu, Zhejiang, Chongqing, Fujian, and other 15 regions, which are not the main agricultural production areas and lack sufficient incentives for green and low-carbon agricultural development.
3.3.2 Coupled index analysis of net carbon sinks and food production
From 1991 to 2022, the coupling indices of net carbon sinks from arable land use and grain production in China by year are shown in Figure 7A, and the coupling indices of each province are shown in Figure 7B. From Panel A, it can be seen that most of the years are located in the growth coupling interval in the first quadrant, i.e., the coupling index is located between 0.8 and 1.2, in which the two are growing at a more consistent rate, which is the best condition in the first quadrant. The years 1992–2002 (except 1994), located in the first quadrant, belong to the yield-dominant coupling, which indicates that there is an imbalance in the rate of growth between the two. 1994 and 2003, located in the fourth quadrant, belong to the ecologically weakened decoupling, which implies that the net carbon sink grows negatively while the food production grows positively. From the analysis of the time dimension, it can be seen that the current coupling state between the net carbon sink of arable land use and grain yield in China is relatively ideal. Based on Panel B, it can be found that the coupling state is more diversified across the provincial scale, with provinces existing in the first, second, third and fourth quadrants, but mainly concentrated in the first and fourth quadrants, with only two provinces in the first and third quadrants. Among the provinces located in the first quadrant, 12 provinces (e.g., Gansu, Shanxi, Anhui, Yunnan, etc.) have a coupling index between 0.8 and 1.2, i.e., a growth coupling type. Among them, Inner Mongolia has the most prominent rate of change in net carbon sinks and rate of change in grain production, which is 336.24 and 306.95%, respectively, with a strong demonstration effect. In addition to the growth-coupled type, in the first quadrant, five provinces (Guangxi, Liaoning, Hubei, Hunan, and Xinjiang) belong to the ecology-led type, and five provinces (Xizang, Ningxia, Guizhou, Shaanxi, and Shandong) belong to the yield-led type, which both imply that there is an imbalance in the growth rate of net carbon sinks from arable land utilization and grain production, and further attention and adjustment are needed to bring them into balance. In the third quadrant, Fujian and Hainan provinces have an ecologically dominant negative coupling; Zhejiang, Guangdong, Shanghai, Chongqing, and Beijing are in a recessionary coupling, which means that both the ecology and food production in these provinces have declined, to some extent, due to the continuous downsizing of agricultural production in these provinces.
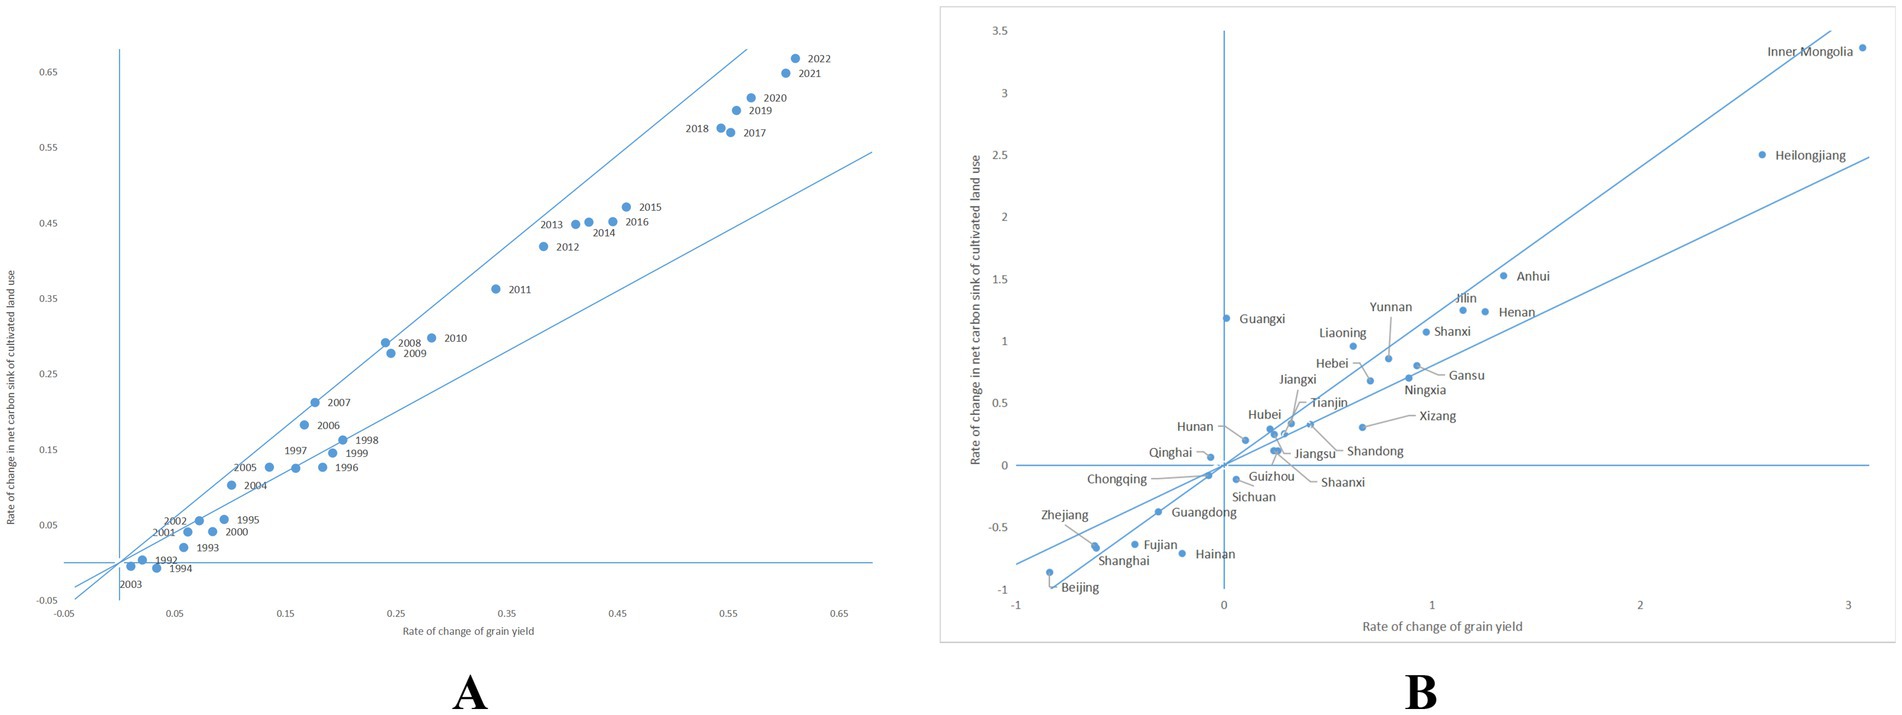
Figure 7. (A) Types of coupling between net carbon sinks from arable land use and grain production by year, China, 1991–2022. (B) Types of coupling between net carbon sinks of arable land use and grain production by provinces in China.
4 Conclusions and policy implication
4.1 Conclusion
Under China’s per capita arable land endowment constraints and the development vision of the commonwealth, ensuring food security is an eternal issue for the Chinese government. The proposal of the dual-carbon targets indicates that the Chinese government is moving forward with a heavy burden while considering national development—achieving carbon neutrality in half the time of the developed countries. Therefore, it is of practical significance to explore the characteristics of carbon emissions from arable land utilization, net carbon sinks, and their relationship with grain yield in China from both temporal and spatial dimensions.
The study found that:
1. In terms of carbon emissions, based on the time dimension, China’s carbon emissions from arable land use showed an upward trend from 1991 to 2015 and then turned negative after 2016, and the total carbon emissions began to decline. Based on the spatial dimension, the number of carbon-emitting provinces in Tier 1 and Tier 2 is gradually decreasing, from 21 in 1991 to 13 in 2022, with a tendency for inter-provincial differences to widen; the total amount of carbon emissions from the main grain-producing areas is generally higher, of which the carbon emissions from Shandong, Henan, Hebei, Hubei, and other places are at a high level in the country. However, the carbon emission rank of non-main grain-producing areas such as Xinjiang, Yunnan, Guangxi, and Guangdong is also higher and deserves attention.
2. In terms of net carbon sinks, based on the time dimension, China’s net carbon sinks from the use of arable land have gone through two phases of fluctuating growth (1991–2014) and high growth (2015–2022) over the past 32 years. Based on the spatial dimension, the number of provinces with net carbon sinks at level 3 and above has been increasing, from 7 in 1991 to 15 in 2022, and the net carbon sinks of each province have increased significantly; the regions with higher total net carbon sinks are concentrated in the main grain producing areas. Provinces with high annual average arable land use net carbon sinks are scattered in a spatially dispersed.
3. In terms of the relationship between net carbon sinks and food production, 11 provinces are located in the high-sink-high-yield region in the first quadrant, and all of them belong to the main food-producing provinces. The remaining two main food-producing provinces, Jiangxi and Liaoning, are located in the low-sink-high-yield region in the fourth quadrant. In terms of the coupling effect between net carbon sinks and grain production, based on the time dimension, most of the years between 1991 and 2022 are located in the growth coupling interval of the first quadrant, and the relationship between net carbon sinks and grain production has been in the growth coupling state since 2004. From a spatial perspective, the coupling status across different provinces reveals a high degree of diversity. Specifically, this diversity is characterized by yield-led coupling in five provinces, growth coupling in 13 provinces and Tianjin Municipality, ecology-led coupling in five provinces, ecology-led negative coupling in two provinces, and recessionary coupling in two provinces and three municipalities, namely Shanghai, Beijing, and Chongqing.
4.2 Discussion
This study takes the dual functions of carbon emissions and carbon sequestration in arable land use as the entry point. Through multi-scale analysis across the national, regional, and provincial levels from a low-carbon perspective, it systematically reveals the spatiotemporal coupling characteristics of net carbon sequestration and grain yield. This aligns with the current policy context of integrating food security and low-carbon development in arable land use. The analytical conclusions provide differentiated evidence for the implementation of the “dual carbon” goals in the agricultural sector. Firstly, for provinces with high carbon sequestration, a coordinated approach of “consolidating strengths + emission reduction” is adopted. The study finds that non-grain-producing regions such as Xinjiang and Guangxi have prominent net carbon sequestration, with a net carbon sequestration level above grade 3 in 2022. However, these provinces also have high carbon emission levels, for example, Xinjiang has a carbon emission level as high as grade 5, presenting a contradiction of high carbon sequestration accompanied by high carbon emissions. The core task for these regions is to maintain their existing carbon sequestration advantages (such as protecting arable land vegetation and optimizing soil carbon sequestration techniques) while developing targeted emission reduction measures for high-emission links (such as excessive use of fertilizers and energy consumption of agricultural machinery). For instance, Xinjiang can promote drip irrigation technology to reduce energy consumption or replace chemical fertilizers with organic ones to lower carbon emissions, ultimately achieving coordinated development of “high carbon sequestration + low emissions.” Secondly, for regions with low carbon sequestration, a development strategy of “increasing sequestration + adaptation” is implemented. Low-carbon sequestration regions can be divided into two categories: one is grain-producing regions with low net carbon sequestration, such as Jiangxi, whose net carbon sequestration level did not reach grade 3 in 2022; the other is non-grain-producing regions with low sequestration, such as Guangdong and Zhejiang. For main grain-producing regions like Jiangxi, it is necessary to enhance carbon sequestration capacity by improving arable land quality through high-standard farmland construction, such as increasing soil organic matter through deep plowing, and promoting deep-rooted carbon-sequestering crops, all while ensuring grain yield. For non-grain-producing low-sequestration provinces like Guangdong, they could leverage their economic advantages to develop modern agriculture, reducing the use of fertilizers and pesticides in traditional agriculture, or explore carbon sequestration potential through ecological agricultural models such as rice-fish co-culture and inter-cropping of forests and crops, avoiding neglect of carbon sequestration functions in the pursuit of economic crop yields.
Achieving carbon neutrality in food production and promoting sustainable agricultural development are current research hotspots. This paper has expanded the boundaries of existing agricultural carbon neutrality research in terms of methodological framework and application of conclusions. First, it is the dual-dimensional assessment. Instead of focusing solely on carbon emissions, this study examines the issue from a low-carbon perspective. For Jiangxi, it is more appropriate to seek low-carbon development from the carbon sink angle; for Xinjiang, it is more suitable to focus on carbon emissions. Therefore, exploring the changes in net carbon sink indicators throughout the entire process from carbon emissions to carbon sinks makes policy recommendations more targeted. Second, it is the multi-scale support. Unlike existing literature (Wu et al., 2021), which analyzed the relationship between carbon emissions and food production in major food-producing areas, this study is based on national, regional, and provincial scales. It compares the endowment of arable land resources in major and non-major food-producing areas and different provinces, as well as their different responsibilities in ensuring food security. Starting from the coupling state of net carbon sinks and food production, it clarifies the development strategies for each province. For example, both Shandong and Hubei are major food-producing areas. Shandong’s coupling state is production-dominant, and it needs to find a balance between emission control and sink enhancement to avoid over-consuming ecological capacity due to increased food production. Hubei’s coupling state is ecology-dominant, and it needs to promote both stable sinks and increased production, transforming its ecological advantages into food security capabilities. Third, it is the methodological improvement. Net carbon sinks and food production are two indicators moving in the same direction. Based on the Tapio decoupling index, this study redefines eight coupling states and identifies “synchronous growth” as the ideal state. This improvement expands the application scenarios of the Tapio model, extending it from the decoupling analysis of reverse indicators (such as carbon emissions and economic growth) to the coupling research of co-directional indicators (such as ecological and economic benefits), providing a reference for subsequent analyses of other ecological and economic synergistic issues.
There are several limitations in this study. First, the scope of the study is confined to China’s regions and provinces, providing a broad reference for the spatial and temporal variations in carbon emissions and net carbon sinks from cropland use. While this offers a macroscopic perspective, future studies could benefit from a more detailed analysis at the city and county levels, leading to more precise conclusions and more targeted recommendations. Second, to ensure the reliability of the accounting results, the carbon emission coefficients and carbon sequestration data are largely based on the findings of scientific research institutes and widely cited literature in the field. However, uncertainties remain. For instance, with the implementation of various environmental protection policies and the promotion of green agricultural technologies in China, the data on carbon emission factors and carbon sequestration may evolve. Due to limited data availability, carbon emissions may be overestimated, and the direction of change in carbon sequestration data remains uncertain. As relevant accounting data are updated and improved in the future, more accurate estimates of carbon emissions, carbon sequestration, and net carbon sinks can be anticipated. Lastly, while the short-term benefits of carbon sinks are notable as crops fix carbon dioxide through photosynthesis during their growth cycle, their long-term impact on the carbon cycle is still minimal. The organic carbon formed by crops will eventually return to the atmosphere, for example, through consumption as food or industrial raw materials. Given the uncertainties in the accounting coefficients, consumption cycles, and consumption ratios, it is currently not feasible to account for this portion of carbon emissions, and thus it is excluded from the carbon emission accounting.
4.3 Policy implication
Although there are some limitations in this study, based on the systematic analysis of the temporal and spatial characteristics of carbon emissions and net carbon sinks in China since 1991, and the exploration of the mechanism of the coupling between net carbon sinks and grain production, this study can still provide the following important insights for research and policy formulation in related fields:
1. China’s carbon emissions from arable land utilization have turned negative since 2016, implying that the green development concept put forward by the CPC in 2015 has begun to bear fruit in the field of agricultural production, and the growth rate of carbon emissions has been effectively controlled. In terms of the provincial situation, there are obvious inter-provincial differences, which means that provincial imbalances are prominent. Therefore, provinces with high emissions, such as Shandong and Henan, are traditional agricultural regions with inherent advantages and strong policy support for carbon emission reduction. For these provinces, we propose the following strategies: (1) Policy Subsidies and Precision Agriculture. Utilize policy subsidies to support precision agriculture, optimizing the structure of agricultural production and land management. (2) Green Product Certification. Encourage farmers to participate in green product certification. This will promote green cultivation techniques and reduction measures while enhancing product competitiveness. (3) Data Monitoring and Technological Support. Strengthen monitoring and technological support through the establishment of a statistical accounting system for carbon emission data. This system will provide essential data support for advancing technological innovation in green agriculture. From a regional perspective, main grain-producing areas generally have higher overall carbon emissions and are key regions for emission reduction. However, non-main grain-producing provinces such as Xinjiang, Yunnan, Guangxi, and Guangdong also exhibit higher carbon emissions. In these areas, the arable land yield is lower due to limitations in topography, soil, and climate. Therefore, promoting the substitution of clean energy and efficient resource utilization is a viable strategy.
2. Currently, China’s net carbon sink from arable land utilization is in a phase of high growth, and technical measures such as crop structure optimization, irrigation upgrading, straw return and no-tillage sowing should be continuously promoted to further expand the positive externality of the net carbon sink for arable GHG emission reduction. In terms of regional distribution, the net carbon sink is highest in major grain-producing areas, which means that the focus of low-carbon transition in agriculture is in major grain-producing areas. Therefore, in promoting the construction of high-standard farmland in various regions, guidance and support for low-carbon technologies at the grass-roots level should be increased, the low-carbon awareness of agricultural managers and generators should be fostered, and carbon-reducing measures, including soil carbon sinks, biochar, and improved planting methods, should be implemented with a view to contributing to the realization of green agricultural development. Non-major food-producing provinces exhibit significant differences in economic development levels and resource endowments. Tailored strategies for these provinces include: (1) Soil Improvement. Provinces like Yunnan and Guangxi can enhance soil organic matter through deep plowing and soil reclamation, thereby improving the carbon sink capacity of arable land. (2) Water-Saving and Resilient Crops. Xinjiang and similar regions can reduce carbon emissions by developing water-saving planting techniques and promoting saline and alkaline-resistant crop varieties. (3) Facility-Based Agriculture. Economically developed areas like Guangdong can develop facility-based agriculture to reduce carbon emissions by minimizing the use of pesticides and chemical fertilizers.
3. In terms of ecological benefits and economic benefits, the 11 major food-producing provinces have achieved high sinks and high yields, which is an ideal state of ecological environment and food security, so Jiangxi and Liaoning, which are in the low-sink-high-yield region, should focus on improving their ecological environment under the prerequisite of guaranteeing food production. In terms of the coupling relationship between net carbon sinks and grain production, the two have been in the growth coupling range since 2004, i.e., the growth rates of the two are more consistent, and the coupling status is ideal. In addition to the 14 provinces with growth coupling, provinces with ecology-led and yield-led characteristics should focus on the coordinated development of food production and the ecological environment: (1) Ecology-Led Provinces. Provinces such as Hunan, which are ecology-led, can integrate regional characteristics to achieve green yield through composite grain-economy systems, intercropping, and set-planting. (2) Yield-Led Provinces. Yield-led provinces like Shaanxi can increase production while avoiding ecological damage through the construction of high-standard farmland and centralized zone management. For ecologically dominant negatively coupled and declining coupled provinces, where both the ecological environment and food production have declined, these provinces should, based on the scale of agricultural production and economic gravity, on the one hand, improve the mechanism of arable land protection to strengthen the foundation of food production; and on the other hand, cultivate and develop the new quality of productivity in the agricultural field to promote the greening of the use of arable land.
Data availability statement
The raw data supporting the conclusions of this article will be made available by the authors without undue reservation.
Author contributions
XW: Writing – review & editing, Investigation, Methodology, Data curation, Writing – original draft, Formal analysis. QW: Data curation, Formal analysis, Methodology, Software, Visualization, Writing – original draft. LY: Resources, Project administration, Writing – review & editing, Formal analysis, Conceptualization, Writing – original draft.
Funding
The author(s) declare that financial support was received for the research and/or publication of this article. Soft Science Project of Henan Province “Research on Hedging Strategies of Grain Futures Market in the Context of Deep Integration of Finance and Science and Technology (242400410127)”.
Conflict of interest
The authors declare that the research was conducted in the absence of any commercial or financial relationships that could be construed as a potential conflict of interest.
Generative AI statement
The authors declare that no Gen AI was used in the creation of this manuscript.
Publisher’s note
All claims expressed in this article are solely those of the authors and do not necessarily represent those of their affiliated organizations, or those of the publisher, the editors and the reviewers. Any product that may be evaluated in this article, or claim that may be made by its manufacturer, is not guaranteed or endorsed by the publisher.
Footnotes
1. ^The “30*60” carbon reduction targets were formally introduced by President Xi Jinping during his address at the 75th session of the United Nations General Assembly in September 2020. He stated, “China will scale up its Intended Nationally Determined Contributions by adopting more vigorous policies and measures. We aim to have CO2 emissions peak before 2030 and achieve carbon neutrality before 2060.”
2. ^The main grain-producing regions in China were first identified in the “Opinions on Reforming and Improving Certain Policies and Measures for Comprehensive Agricultural Development,” a document issued by the Ministry of Finance in 2003. This document designates 13 major grain-producing areas, which include Heilongjiang, Jilin, Liaoning, Hebei, Henan, Shandong, Jiangsu, Anhui, Jiangxi, Hubei, Hunan, Sichuan, and Inner Mongolia.
References
Anthony, T. L., Szutu, D. J., Verfaillie, J. G., Baldocchi, D. D., and Silver, W. L. (2023). Carbonsink potential of continuous alfalfa agriculture lowered by shortterm nitrous oxide emission events. Nat. Commun. 14:1926. doi: 10.1038/s41467-023-37391-2
Begum, K., Kuhnert, M., Yeluripati, J., Ogle, S., Parton, W., Kader, M. A., et al. (2018). Model based regional estimates of soil organic carbon sequestration and greenhouse gas mitigation potentials from rice croplands in Bangladesh. Land 7:e82. doi: 10.3390/land7030082
Benbi, D. K. (2018). Carbon footprint and agricultural sustainability nexus in an intensively cultivated region of Indo-Gangetic Plains. Sci. Total Environ. 644, 611–623. doi: 10.1016/j.scitotenv.2018.07.018
Béziat, P., Ceschia, E., and Dedieu, G. (2009). Carbon balance of a three crop succession over two cropland sites in South West France. Agric. For. Meteorol. 149, 1628–1645. doi: 10.1016/j.agrformet.2009.05.004
Boston Consulting Group (BCG) and XAG (2022). Pathway to agricultural carbon neutrality: how technology can help reduce greenhouse gas emissions and achieve net-zero transition in agriculture [Report]. Boston Consulting Group (BCG) & XAG.
Ciais, P., Gervois, S., Vuichard, N., Piao, S. L., and Viovy, N. (2011). Effects of land use change and management on the European cropland carbon balance. Glob. Chang. Biol. 17, 320–338. doi: 10.1111/j.1365-2486.2010.02341.x
Cui, Y., Khan, S. U., Sauer, J., and Zhao, M. (2022). Exploring the spatiotemporal heterogeneity and influencing factors of agricultural carbon footprint and carbon footprint intensity: embodying carbon sink effect. Sci. Total Environ. doi: 10.1016/j.scitotenv.2022.157507
Ding, B., Yang, S., Zhao, Y., and Yi, S. (2019). Study on spatio-temporal characteristics and decoupling effect of carbon emission from cultivated land resource utilization in China. China Land Sci. 33, 45–54. doi: 10.11994/zgtdkx.20191204.145840
Dubey, A., and Lal, R. (2009). Carbon footprint and sustainability of agricultural production systems in Punjab, India, and Ohio, USA. J. Crop Improv. 23, 332–350. doi: 10.1080/15427520902969906
Fiehn, A., Kostinek, J., Eckl, M., Klausner, T., Gałkowski, M., Chen, J., et al. (2020). Estimating CH4, C02, and CO emissions from coal mining and industrial activities in the upper Sile sian Coal Basin using an aircraft-based mass balance approach. Atmos. Chem. Phys. 20, 12675–12695. doi: 10.5194/acp-20-12675-2020
Guenet, B., Gabrielle, B., Chenu, C., Arrouays, D., Balesdent, J., Bernoux, M., et al. (2021). Can N2O emissions offset the benefits from soil organic carbon storage? Glob. Chang. Biol. 27, 237–256. doi: 10.1111/gcb.15342
Guo, X., Wang, H., Ahmad, N., Wang, R., Wang, X., and Li, J. (2024). Effects of 12-year cropping systems and tillage practices on crop yield and carbon trade-off in dryland loess plateau. Field Crop Res. 318:109598. doi: 10.1016/j.fcr.2024.109598
Hastuti, D. R. D., Darma, R., Salman, D., Santoso, S., and Rahim, A. (2022). Carbon sequestration of city agriculture: between farming and non-farming land. IOP Publishing Ltd. doi: 10.1088/1755-1315/1041/1/012009
Li, Q., Gao, W., Wei, J., Jiang, Z., Zhang, Y., and Lyu, J. (2022). Spatiotemporal evolution and comprehensive zoning of net carbon sink in cultivated land use in China. Trans. Chin. Soc. Agric. Eng. 38, 239–249. doi: 10.11975/j.issn.1002-6819.2022.11.011
Liu, Q., Xu, C., Han, S., Li, X., Kan, Z., Zhao, X., et al. (2021). Conservation agriculture enhances soil carbon sequestration in intensive cropping systems of the North China plain. Sci. Total Environ. 798:149220. doi: 10.1016/j.scitotenv.2021.149220
Ma, L., Zhang, W., Wu, S., and Shi, Z. (2022). Research on the impact of rural population structure changes on the net carbon sink of agricultural production-take Huan county in the loess hily region of China as an example. Front. Environ 10:911403. doi: 10.3389/fenvs.2022.911403
Mathew, I., Shimelisa, H., Mutema, M., and Chaplot, V. (2017). What crop type for atmospheric carbon sequestration: results from a global data analysis. Agric. Ecosyst. Environ. 243, 34–46. doi: 10.1016/j.agee.2017.04.008
Mikayilov, J. I., Hasanov, F. J., and Galeotti, M. (2018). Decoupling of CO2 emissions and GDP: a time - varying cointegration approach. Iefe Work. Pap. 95, 615–628. doi: 10.1016/j.ecolind.2018.07.051
Niu, X., Liu, C., Jia, X., and Zhu, J. (2021). Changing soil organic carbon with land use and management practices in a thousand-year cultivation region. Agric. Ecosyst. Environ. 322:107639. doi: 10.1016/j.agee.2021.107639
OECD (2002). Indicators to measure decoupling of environmental pressure from economic growth. Paris: OECD.
Pilatowska, M., and Wlodarczyk, A. (2018). Decoupling economic growth from carbon dioxide emissions in the EU countries. Montenegrin J. Econ. 14, 7–26. doi: 10.14254/1800-5845/2018.14-1.1
Shi, H., and Umair, M. (2024). Balancing agricultural production and environmental sustainability: based on economic analysis from North China plain. Environ. Res. 252:118784. doi: 10.1016/j.envres.2024.118784
Tapio, P. (2005). Towards a theory of decoupling: degrees of decoupling in the EU and the case of road traffic in Finland between 1970 and 2001. Transp. Policy 12, 137–151. doi: 10.1016/j.tranpol.2005.01.001
Tubiello, F. N., Salvatore, M., Rossi, S., Ferrara, A., Fitton, N., and Smith, P. (2013). The FAOSTAT database of greenhouse gas emissions from agriculture. Environ. Res. Lett. 8:e15009. doi: 10.1088/1748-9326/8/1/015009
Wang, X., Jing, Z., He, C., Liu, Q., Qi, J., Zhao, C, et al. (2021). Soil organic carbon sequestration in double rice cropping systems under long-term fertilization in southern China. Sci. Total Environ. 759:143494. doi: 10.1016/j.scitotenv.2020.143494
Wang, Y., Liang, S., Liang, Y., and Liu, X. (2024). A comprehensive accounting of carbon emissions and carbon sinks of China's agricultural sector. Land 13:1452. doi: 10.3390/land13091452
Wang, L., Shi, P., Luo, J., Yin, J., Cheng, F., Shi, J., et al. (2024). Region-county characteristics of spatiotemporal dynamic evolution and influencing factors on agricultural net carbon sink in Hexi region of Gansu Province. Ecol. Indic. 169:112817. doi: 10.1016/j.ecolind.2024.112817
Wang, Z., Zhang, J., and Zhang, L. (2019). Reducing the carbon footprint per unit of economic benefit is a new method to accomplish low-carbon agriculture. A case study: adjustment of the planting structure in Zhangbei County, China. J. Sci. Food Agric. 99, 4889–4897. doi: 10.1002/jsfa.9714
Wang, X., Zheng, Z., Jia, W., Tai, K., Xu, Y., and He, Y. (2024). Response mechanism and evolution trend of carbon effect in the farmland ecosystem of the middle and lower reaches of the Yangtze River. Agronomy 14:2354. doi: 10.3390/agronomy14102354
Wei, H., Wu, L., Chen, D., Yang, D., Du, J., Xu, Y., et al. (2024). Rapid climate changes responsible for increased net global cropland carbon sink during the last 40 years. Ecol. Indic. 166:112465. doi: 10.1016/j.ecolind.2024.112465
Weizsäcker, E. U., Lovins, A. B., and Lovins, H. L. (1997). Factor four: doubling wealth, halving resource use. Earth.
West, T. O., and Marland, G. (2002). A synthesis of carbon sequestration, carbon emissions, and net carbon flux in agriculture: comparing tillage practices in the United States. Agric. Ecosyst. Environ. 91, 217–232. doi: 10.1016/S0167-8809(01)00233-X
Wu, H., Huang, H., and Chen, W. (2021). Decoupling effects between carbon emissions from cropland use and grain production in the major grain-producing areas in China. Geogr. Deo-Inf. Sci. 37, 85–91. doi: 10.3969/j.issn.1672-0504.2021.06.013
Wu, W., Yu, Q., Chen, Y., Guan, J., Gu, Y., Guo, A., et al. (2024). Land management scale and net carbon effect of farming in China: spatial spillover effects and threshold characteristics. Sustainability 16:6392. doi: 10.3390/su16156392
Xia, L., Ti, C., Li, B., Xia, Y., and Yan, X. (2016). Greenhouse gas emissions and reactive nitrogen releases during the life-cycles of staple food production in China and their mitigation potential. Sci. Total Environ. 556, 116–125. doi: 10.1016/j.scitotenv.2016.02.204
Xu, X., Sharma, P., Shu, S., Lin, T. S., Ciais, P., Tubiello, F. N., et al. (2021). Global greenhouse gas emissions from animal-based foods are twice those of plant-based foods. Nat. Food 2, 724–732. doi: 10.1038/s43016-021-00358-x
Keywords: net carbon sink of arable land utilization, carbon emissions, spatio-temporal characteristics, grain yield, Tapio coupling index
Citation: Wang X, Wang Q and Yao L (2025) Research on the spatial and temporal evolution and coupling effects of carbon emissions and net carbon sinks on arable land in China. Front. Sustain. Food Syst. 9:1642160. doi: 10.3389/fsufs.2025.1642160
Edited by:
Chaozheng Zhang, Hunan Agricultural University, ChinaReviewed by:
Yang Qiu, Chinese Academy of Sciences (CAS), ChinaBin Wen, Huaibei Normal University, China
Copyright © 2025 Wang, Wang and Yao. This is an open-access article distributed under the terms of the Creative Commons Attribution License (CC BY). The use, distribution or reproduction in other forums is permitted, provided the original author(s) and the copyright owner(s) are credited and that the original publication in this journal is cited, in accordance with accepted academic practice. No use, distribution or reproduction is permitted which does not comply with these terms.
*Correspondence: Lili Yao, bGlsaXlhb0Bud2FmdS5lZHUuY24=
†These authors share first authorship