 Yu Zhang1
 Yanping Liu2*
- 1School of Public Management, Jiangsu Open University, Nanjing, China
- 2School of Business, Jiangsu Open University, Nanjing, China
Geographical Indications for Agricultural Products (GIAP), as an intellectual property protection system, hold potential for driving agricultural green transformation. However, their impact mechanisms on agricultural carbon emissions (ACE) remain unclear. This study empirically investigates their impact using provincial panel data from China spanning 2004 to 2022 and employs a difference-in-differences (DID) model. The results indicate that the implementation of GIAP systems has a significant positive effect on reducing agricultural carbon emissions, each additional GIAP certification reduces ACE intensity by 0.3679 units on average. The conclusion that remains robust across a variety of specification tests. Mechanism analysis demonstrates that GIAP effectively lower agricultural carbon emissions primarily by facilitating farmland transfer, strengthening agricultural socialized services, increasing the proportion of grain crops, and improving technical efficiency. Furthermore, the empirical findings reveal significant spatial spillover effects associated with GIAP. Additional heterogeneity analysis shows that the carbon emission reduction effects of GIAP vary substantially across different regions, economic zones, functional areas, and “hot” and “cold” spatial clusters. Based on these findings, it is recommended that greater emphasis be placed on the development and refinement of the GIAP system, and that regionally differentiated strategies be adopted to further integrate GIAP policy with agricultural carbon reduction initiatives, thereby laying a solid institutional foundation for the green and low-carbon transformation of agriculture.
1 Introduction
Global climate change stands among the most pressing challenges faced by contemporary society. Its consequences—rising sea levels, increased frequency of extreme weather events, and declining biodiversity—are profound and far-reaching. The principal driver of climate change is greenhouse gas emissions, with carbon dioxide (CO₂) identified as the most significant greenhouse gas. In response, governments, international organizations, and corporate entities have adopted numerous measures. Efforts have intensified to curtail carbon emissions and to achieve the targets of carbon peaking and carbon neutrality. Carbon reduction is not only a necessity for environmental protection but also a critical pathway toward sustainable development. Agricultural production has been recognized as a major source of greenhouse gas emissions. It is estimated that emissions from the agricultural sector account for approximately 20–30% of global total emissions (Silvia Falasco et al., 2024). Agricultural carbon emissions (ACE) primarily originate from farmland soils, the use of agricultural machinery, and the application of fertilizers and pesticides. The reduction of ACE is therefore of utmost importance for mitigating climate change, safeguarding the environment, and advancing sustainable development.
Geographical Indication of Agricultural Products (GIAP), as a distinctive form of intellectual property protection, has assumed growing importance in shaping the future direction of agricultural development. It is a label used to denote that a product originates from a specific locality, with its quality, reputation, or other characteristics primarily attributable to inherent natural and human factors of that location. GIAP are often endowed with unique attributes and elevated market value. Such products can effectively enhance the added value of agricultural commodities and increase farmers’ incomes (Yan and Zhang, 2025), thereby narrowing the rural–urban income gap (Ai et al., 2025). A significant and continuously strengthening association has been observed between GIAP and regional agricultural economies (Xie et al., 2022). In fact, the environmental benefits of GIAP are also substantial. Due to rigorous requirements placed on both production environment and production processes, agricultural practitioners are usually compelled to adopt more environmentally friendly and sustainable farming practices. For instance, greater emphasis is placed on soil conservation, water management, biodiversity preservation, reducing the use of chemical fertilizers and pesticides, and promoting the efficient use of agricultural machinery. Consequently, agricultural carbon emissions are reduced during the production process.
As one of the largest agricultural countries in the world, China sees carbon emissions from agriculture account for approximately 10% of its national total (Jin et al., 2021). On the other hand, China possesses abundant resources in GIAPs. By 2022, over 3,000 GIAPs had been registered in China,1 encompassing fruits, vegetables, tea, grains, and other categories. These products have played a significant role in promoting local economic development and protecting the ecological environment. Therefore, selecting China as the research context is both representative and valuable. By empirically analyzing the impact of GIAP on ACE in China, the latent role of GI in fostering sustainable agricultural development and reducing carbon emissions can be revealed. Scientific evidence may thus be provided for policy formulation, further advancing green agricultural development and the achievement of carbon reduction objectives.
The innovations of this study are manifested in three key aspects: firstly, the Geographical Indication for Agricultural Products (GIAP)—an intellectual property protection system—is systematically integrated into the agricultural carbon emission research framework, constructing a “institutional norms-market incentives-production optimization” triple-action mechanism. Secondly, a multi-period continuous Difference-in-Differences (DID) model is combined with a Spatial Durbin Model to precisely quantify GIAP’s local emission reduction effect and spatial spillover effects, overcoming limitations of traditional static assessments. Last, four quantifiable emission reduction pathways are empirically verified: scaling farmland transfer; improving socialized services; grain-oriented crop restructuring; enhancing technical efficiency. This reveals the core characteristic of current reliance on management optimization over technological progress.
The remainder of this paper is structured as follows. Section 2 reviews the relevant literature and further discusses the marginal contributions of this study. Section 3 presents the theoretical analysis, focusing on the mechanisms through which facility agriculture influences agricultural carbon emissions. Section 4 describes the research design and data, including variable selection and model specification. Section 5 conducts the empirical analysis, covering mechanism identification and heterogeneity analysis. Finally, Section 6 summarizes the main conclusions, offers policy recommendations, and discusses the limitations of the study as well as directions for future research.
2 Literature review
Existing studies have explored the sources and influencing factors of agricultural carbon emissions (ACE). Zhang et al. (2023, 2024) and Liu and Mu (2024) points out that farmland soil is one of the primary sources of ACE, accounting for more than 50% of total emissions. Livestock farming is another important source, contributing about 35% of total agricultural emissions (Arfini et al., 2019; Hu et al., 2024). In addition, the use of agricultural machinery and pesticides also significantly impacts ACE (Belletti et al., 2017; Tian et al., 2024). De Filippis et al. (2022) proposed that improving tillage methods, increasing the use of organic fertilizers, and implementing farmland conservation measures can significantly reduce carbon emissions from farmland soil. Furthermore, the intensive use of mechanical power and the rational use of pesticides are also important measures for agricultural carbon reduction (Arfini et al., 2019; Li et al., 2024). Cross-sectoral research also indicates that efficiency enhancement strategies such as circular economy models and total factor productivity optimization offer universal insights for achieving low-carbon transitions in multiple sectors, including agriculture (Wang et al., 2024). Waste resource utilization, as a crucial means of enhancing system efficiency and reducing net emissions, has also received significant attention in efficiency assessment research (Wang et al., 2025).
As a form of intellectual property protection, GIAP have received extensive attention in recent years, mainly focusing on their economic, social, and environmental benefits. GIAP protection can significantly enhance the market value of agricultural products and increase farmers’ incomes (Li C. et al., 2023; Li K. et al., 2023; Chen and Zhong, 2024). GIAP certification also contributes to the preservation of traditional cultural heritage, promotes regional economic development, and helps reduce the urban–rural gap, yielding considerable social benefits (Qie et al., 2023; Zhu and Qin, 2023). In addition, GIAP products have certain environmental benefits and help actualize the value of ecological products (Giua et al., 2024; Yi and Gu, 2023).
In summary, GIAP plays a discernible role in improving the quality of agricultural products, increasing farmers’ incomes, and promoting green agricultural development. However, the mechanisms and empirical verification of the impact of GIAP on ACE remain to be explored. This paper makes marginal contributions in the following aspects. First, it incorporates GIAP and ACE into a unified analytical framework, deeply enriching the development of institutional economics in the field of agriculture. Second, GIAP certification is regarded as a quasi-natural experiment. A multi-period continuous difference-in-differences model has been employed to empirically analyze agricultural data from 31 Chinese provinces during 2004–2022. Third, the mechanisms by which GIAP affects ACE are elucidated through four dimensions: scale effect, market effect, structural effect, and technological effect. In this way, theoretical support for the emission-reducing effect of GIAP certification is provided. The findings are expected to furnish policymakers with scientific evidence, support the widespread adoption of geographical indication (GI) certification, and facilitate the achievement of green agricultural development and carbon reduction objectives.
3 Theoretical mechanisms
GIAP plays an important role not only in protecting the reputation and quality of agricultural products from specific regions, but also imposes strict requirements on the production environment and processes. Producers are thus encouraged to adopt more environmentally friendly and sustainable agricultural practices, influencing ACE through several channels. It is shown in Figure 1.
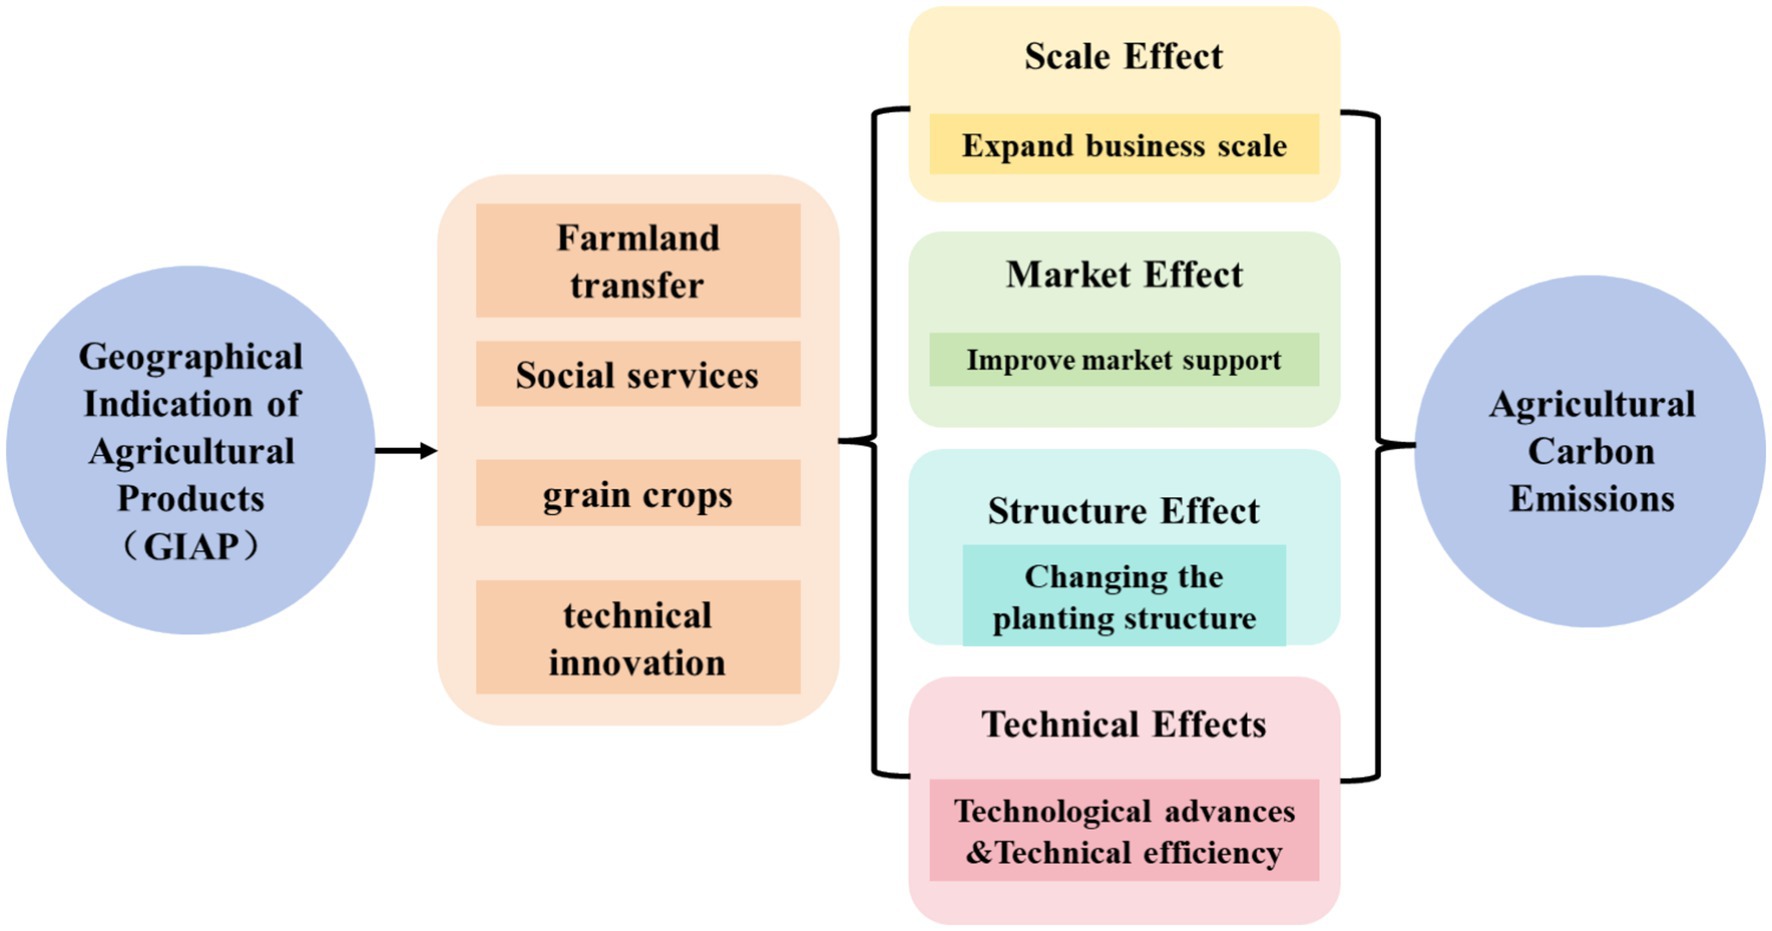
Figure 1. Mechanism analysis of GIAP’s impact on ACE.
3.1 Scale effect: accelerating farmland transfer and expanding operational scale
In China, land policy implements the separation of three rights: ownership, contract right, and management right. Farmland transfer has been recognized as a fundamental institutional cornerstone for modern agricultural development. Through enhancing market value and brand influence, GIAP attracts more investors and agricultural operators to apply for certification. Thus, farmland transfer and agricultural scale operation are promoted. The expansion of operational scale can reduce agricultural carbon emissions through several mechanisms.
First, the deepening of economies of scale can be achieved. Large-scale operations can realize more efficient allocation and utilization of resources. Production costs and resource waste are thereby reduced. Expanded scale allows the adoption of more modernized, intensive, and mechanized production methods. Production efficiency is enhanced, while carbon emissions per unit output are reduced (Li and Shi, 2024). Second, the intensification of management is strengthened. Scale operation brings more professional and intensive agricultural management. Land use efficiency is improved, and excessive reclamation or degradation is curtailed, preserving soil carbon storage capacity. Scientific crop rotation and intercropping systems are more frequently implemented on large farms, maintaining soil fertility and structure, thus reducing carbon emissions from soil. Third, the acceleration of technology adoption is facilitated. Large-scale farms possess greater capability to introduce and apply advanced agricultural technologies, including precision farming, intelligent irrigation systems, and biological control measures (Li et al., 2024). These technologies can not only boost production efficiency but also mitigate carbon emissions from agricultural production.
3.2 Market effect: promoting social services and improving market support
Agricultural social services include technical training, market information, and financial services. They play an important role in enhancing production efficiency and reducing carbon emissions. Through elevating market value and expanding economies of scale, GIAP has propelled the improvement and development of agricultural social services, thereby fostering ACE reduction in several respects.
First, the deepening of technical training and dissemination can be observed. Through systematic technical training, farmers are enabled to master advanced agricultural technologies and management practices. Consequently, the use of fertilizers and pesticides is significantly reduced, production efficiency is increased, and both resource wastage and carbon emissions are curtailed (Tian and He, 2023). Second, the optimization of market information services has been promoted. Enhanced market information services allow farmers to better understand market demand and price dynamics. Rational production planning can thereby be adopted, avoiding blind production and resource waste. By utilizing market information services, farmers can adjust cropping patterns and production schedules in a timely manner, curtailing the production of unsalable products and reducing resource and energy consumption. Unnecessary carbon emissions are thus minimized. Third, the strengthening of financial service support has been facilitated. Improved agricultural financial services have provided more financial resources for farmers. Investment in advanced agricultural technologies and equipment, as well as in greenhouse gas mitigation technologies, is thereby made possible (He and Liao, 2024). With financial support, farmers are enabled to apply additional low-carbon technologies and equipment in production, which actively contributes to carbon emission reduction.
3.3 Structural effect: increasing grain crops and reducing cash crops
Significant differences exist in the environmental impacts of grain crops and cash crops during cultivation. GIAP promotes carbon emission reduction by adjusting cropping structures, increasing the area devoted to grain crops, and decreasing the area under cash crops.
First, an adjustment toward a grain-oriented cropping structure has been facilitated. Traditionally, grain crops possess lower market value than cash crops. However, after obtaining GI certification, additional value is conferred upon these products, thereby bridging the market value gap with cash crops. The cultivation of grain crops is generally less complex relative to cash crops. As a result, the area allocated to grain crops is expanded, while the area under cash crops is reduced, leading to lower carbon emissions. Second, the use of chemical fertilizers and pesticides is diminished. The production of grain crops typically requires fewer fertilizers and pesticides. In contrast, the cultivation of cash crops demands substantial inputs of these chemicals, which markedly increase carbon emissions (Tong et al., 2024). Third, land use efficiency is elevated. Grain crops are often cultivated through large-scale and intensive methods, which improve the efficiency of land utilization. Grain crops also exert less detrimental impact on arable land, reducing soil erosion and nutrient loss. This preserves the soil’s carbon storage capacity and further enhances land use efficiency, which subsequently reduces carbon emissions. Therefore, GIAP can achieve carbon emission reduction by increasing the planting area of grain crops, reducing the cultivation of cash crops, and optimizing cropping structures.
3.4 Technological effect: advancing technological progress and improving technical efficiency
Technological progress is crucial for attaining agricultural sustainability. Technical efficiency refers to the rational allocation and effective utilization of production factors under given technological conditions. GIAP enhances the market value of agricultural products. Through this, investment in capital and technology is attracted. Continuous technological advancement is promoted, technical efficiency is improved, and the allocation and utilization of agricultural production resources are optimized, thereby enabling carbon emission reduction.
First, support for technological innovation can be observed. Due to the brand effect and market influence of GIAP, greater investments in research and development are often attracted from scientific institutions and enterprises. Innovation in low-carbon agricultural technologies and equipment is thereby stimulated, which advances agricultural science and technology (Luo and Wei, 2023). Technological innovation not only increases agricultural production efficiency, but also provides essential technical support for carbon emission reduction in agriculture. Second, optimization in resource allocation is achieved. Producers of GIAP generally adopt more scientific management practices. Production resources are thereby optimized and rational planting schedules are implemented. Repetitive tillage and resource wastage are avoided, while the efficiency of land and water use is improved, thus reducing carbon emissions (Ji et al., 2023).
Based on the above, this paper proposes Hypotheses 1, 2.
Hypothesis 1: GIAP can significantly reduce ACE.
Hypothesis 2: GIAP can significantly reduce ACE by promoting farmland circulation, developing social services, optimizing cropping structure, facilitating technological progress, and improving technical efficiency.
The promotion of GIAP may induce spatial spillover effects. First, the successful certification of GIAP in a particular region indicates the presence of favorable natural and geographical conditions for agricultural development. Adjacent areas are highly likely to possess similar resource endowments. Second, the effective promotion of GIAP may stimulate neighboring regions to prioritize GIAP certification and development, thereby expanding its sphere of influence. Economic issues are predominantly characterized by strong regional particularities. The impact of GIAP on ACE may therefore vary across different geographical regions, economic zones, functional zones, and in “hot” and “cold” spatial contexts (Zhou and Ying, 2012). The eastern region possesses richer market and demographic resources. Comparatively, the effects of GIAP may be especially pronounced in the eastern area. The Yangtze River Economic Belt, being one of the most dynamic regions, may also experience strong internal effects from the promotion of GIs. From an agricultural perspective, Chinese provinces are classified into major producing areas, major marketing areas, and balanced areas. Heterogeneity in the effects of GIs may thereby arise across distinct functional zones (Zhou et al., 2022). Moreover, the ACE and GI certifications of a region can potentially influence its surrounding areas. Consequently, spatial econometric methods are incorporated. Regions are categorized into different “hot” and “cold” spatial clusters to further analyze whether the impacts of GIAP on ACE differ under varied spatial constraints and resource endowments.
Accordingly, Hypotheses 3, 4 are thus proposed in this paper.
Hypothesis 3: The impact of GIAP on ACE exhibits significant spatial spillover effects.
Hypothesis 4: The impact of GIAP on ACE varies significantly across different regions, economic zones, functional zones, and “hot” and “cold” spatial clusters.
4 Model specification and variable measurement
4.1 Model specification
China officially implemented the registration and certification of GIAP in 2008. Therefore, the starting point of the GIAP policy is set as 2008. Since GIAP certification occurred in different regions at different times, the overall process can be viewed as a staggered policy intervention across regions. Thus, a multi-period difference-in-differences (DID) model is adopted to identify the policy effect. Additionally, the treatment group in this study cannot be simply represented by a 0–1 dummy variable; instead, the number of GIAPs registered and certified in each region at a given time better captures the policy intensity. Therefore, this study utilizes a multi-period continuous DID model. The following econometric model is established:
Where subscript i denotes province and t denotes year, Cgdpit represents the intensity of agricultural carbon emissions (ACE) in province i in year t, with higher values indicating greater ACE intensity. The specific measurement of ACE intensity will be detailed in the following section. α denotes the constant term. GIAPit is the policy variable for Geographical Indications for Agricultural Products, which accumulates the actual number of certified GIAPs in province i in year t. If a province had no GIAP certification before 2008 or never certified, the value is set to 0. β is the coefficient of interest, capturing the effect of GIAP on ACE. Xit is a vector of control variables. denotes region-time interaction fixed effects, which are used to absorb the influence of varying regional characteristics and temporal fluctuations on the econometric results. εit denotes the stochastic error term.
4.2 Major variable measurement
4.2.1 Agricultural carbon emissions
The level of agricultural carbon emissions is measured using agricultural carbon intensity (Cgdp). First, the total agricultural carbon emissions are calculated. According to the method proposed by Li et al. (2011), the total agricultural carbon emissions are estimated based on six input factors: chemical fertilizers, pesticides, agricultural plastic film, agricultural diesel, total sown area of crops, and effectively irrigated area. The emission coefficients for each carbon source are shown in Table 1. The total agricultural carbon emissions are calculated using Equation 2, and carbon emission intensity is subsequently calculated using Equation 3.
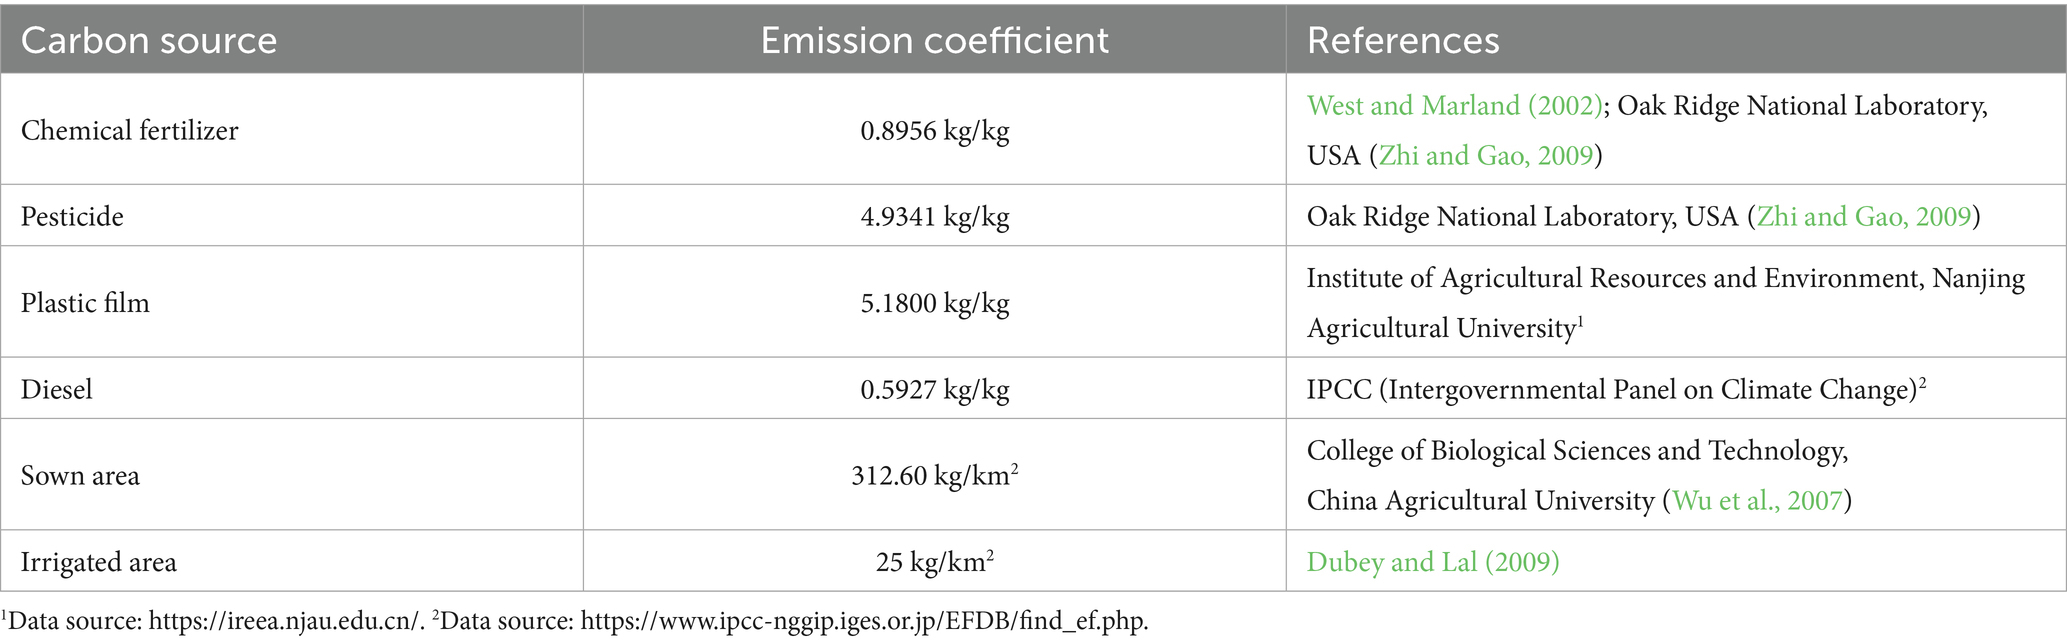
Table 1. Agricultural carbon sources and emission coefficients.
In Equation 2, AECit denotes the agricultural carbon emissions of province i in year t. k represents the type of carbon source. eitk indicates the carbon emissions from different sources. wit and δk denotes the input quantity and emission coefficient of carbon source j, respectively. In Equation 3, Cgdpit represents the agricultural carbon emission intensity. And AGDPit indicates the agricultural added value.
4.2.2 Geographical indications of agricultural products
At the early stage of the development of GIs in China, their management was divided among three authorities: the Ministry of Agriculture, the State Administration for Industry and Commerce, and the General Administration of Quality Supervision, Inspection and Quarantine. After 2018, the responsibility was transferred to the China National Intellectual Property Administration (CNIPA), but all three certification systems are still in use today. In this study, GI data were collected separately from the GI Network, the China Trademark Network, and the China Green Food Development Center. Sample data from 1,598 counties across the country with agricultural product GIs were obtained and aggregated at the provincial level. For duplicated registrations of GIs, only the earliest record was retained, and non-agricultural GIs were excluded.
4.2.3 Control variables
The first indicator is Per capita disposable income in rural areas (dpi). Industrial structure (indus) is measured by the ratio of value added of the tertiary industry to that of the secondary industry (Liu and Mu, 2024). Marketization level (market) is represented by Fan Gang’s marketization index (Hu et al., 2024). Agricultural financial support (fiscal) is measured by the ratio of agricultural financial expenditure to general budgetary expenditure (Tian et al., 2024). Rural human capital (edurural) is calculated following the method of Zhang and Zhang (2021). Agricultural mechanization level (power) is measured by the ratio of total agricultural machinery power to arable land area (Li et al., 2024). Disaster status (damage) is measured by the ratio of affected area to arable land area (Chen and Zhong, 2024).
4.2.4 Mechanism variables
In addition, the subsequent mechanism analysis involves five variables. The first indicator is farmland transfer scale (transfer). It is measured by the ratio of transferred farmland area to contracted farmland area. Agricultural social services (service) is measured by the difference between the added value of agriculture, forestry, animal husbandry, and fishery and the added value of the primary industry. Cropping structure (structure) is measured by the ratio of grain crop sown area to arable land area. Technological progress (gtp) and technological efficiency (gte) are both measured using the Super Efficiency Slack-Based Measure Global Malmquist–Luenberger (SBM-GML) index based on Data Envelopment Analysis (DEA). Specifically, the input variables include crop sown area, the number of agricultural employees, total power of agricultural machinery, effective usage of chemical fertilizers (converted to pure amount), and agricultural water consumption. The desirable output variable is the actual total agricultural output. The undesirable output variable is ACE. Descriptive statistics for these variables are presented in Table 2.
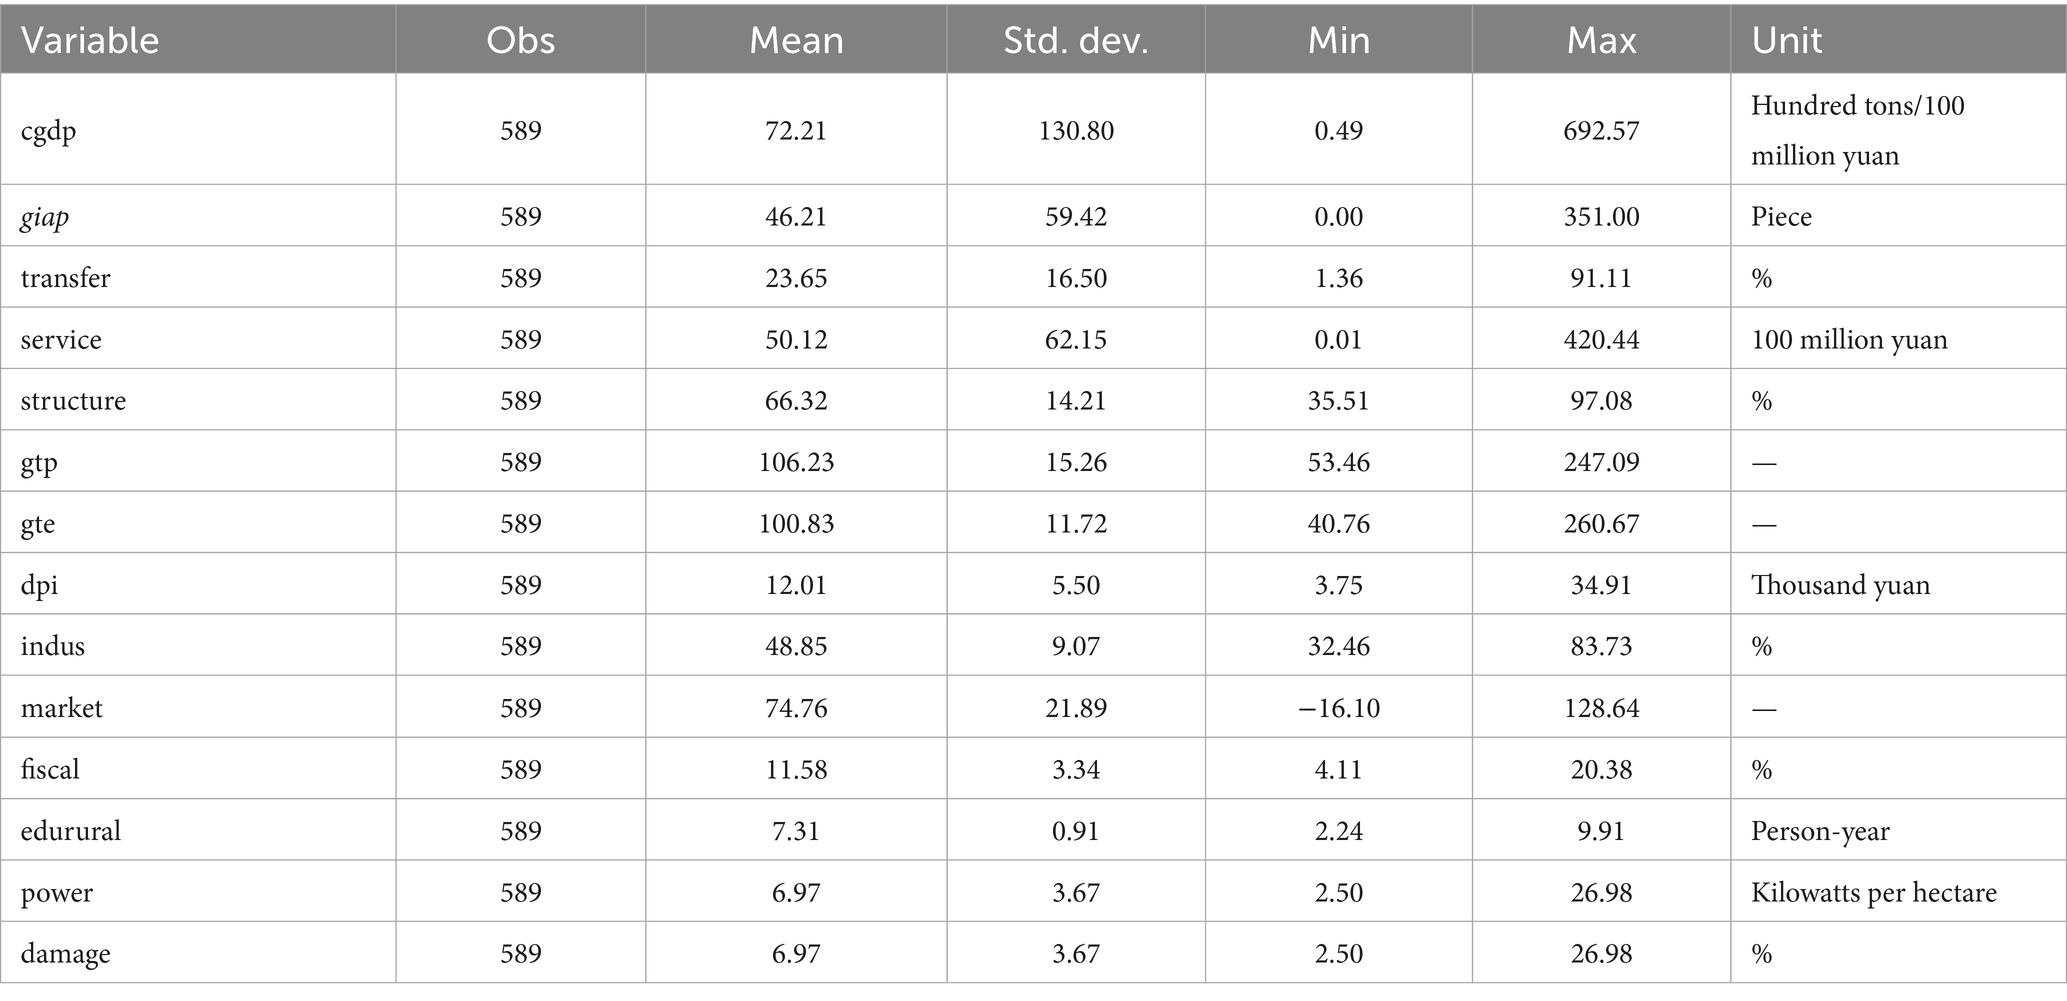
Table 2. Descriptive statistics of variables.
To ensure data availability and completeness, this study selects a sample of 31 provinces (municipalities/autonomous regions, excluding Hong Kong, Macau, and Taiwan) in China covering the period 2004–2022. The data are derived from the China Statistical Yearbook, China Rural Statistical Yearbook, China Environmental Statistical Yearbook, China Social Statistical Yearbook, China Urban and Rural Statistical Yearbook, China Rural Business Administration Statistical Yearbook, and relevant provincial statistical yearbooks. For individual cases of missing data, linear interpolation is employed for completion.
5 Empirical results analysis
5.1 Analysis of baseline regression results
Firstly, regressions are conducted with GIAP as the core explanatory variable. Meanwhile, bidirectional fixed effects and interactive fixed effects are set separately to examine the robustness of the estimation results. Columns (1) and (3) of Table 3 present the estimation results of GIAP under different fixed effects, with the estimated coefficients being significantly negative at the 1% level. Columns (2) to (4) show that after adding control variables, the estimated coefficients for GIAP remain significantly negative at the 1% level, indicating that GIAP can significantly reduce agricultural carbon emissions, thus providing empirical support for Hypothesis 1. The results demonstrate that each additional GIAP certification reduces ACE intensity by 0.3695 units. Then, additional control variables are included. And the regression coefficient is −0.3679. The results for other control variables are generally consistent with existing studies. The increase in rural residents’ disposable income, the optimization of industrial structure, fiscal support, and the enhancement of rural human capital can elevate the willingness of agricultural producers to pursue green transformation. These factors also provide an economic environment conducive to green agricultural development, thereby reducing agricultural carbon emissions. However, a higher level of marketization may compel agricultural producers to intensify the use of chemical inputs in order to expand production and maximize profits, which in turn exacerbates carbon emissions. Under the “large country, smallholder” conditions in China, the enhancement of agricultural mechanization power has not yet generated economies of scale or intensive effects, thereby aggravating agricultural carbon emissions. The coefficient of disaster incidence is negative but not statistically significant.
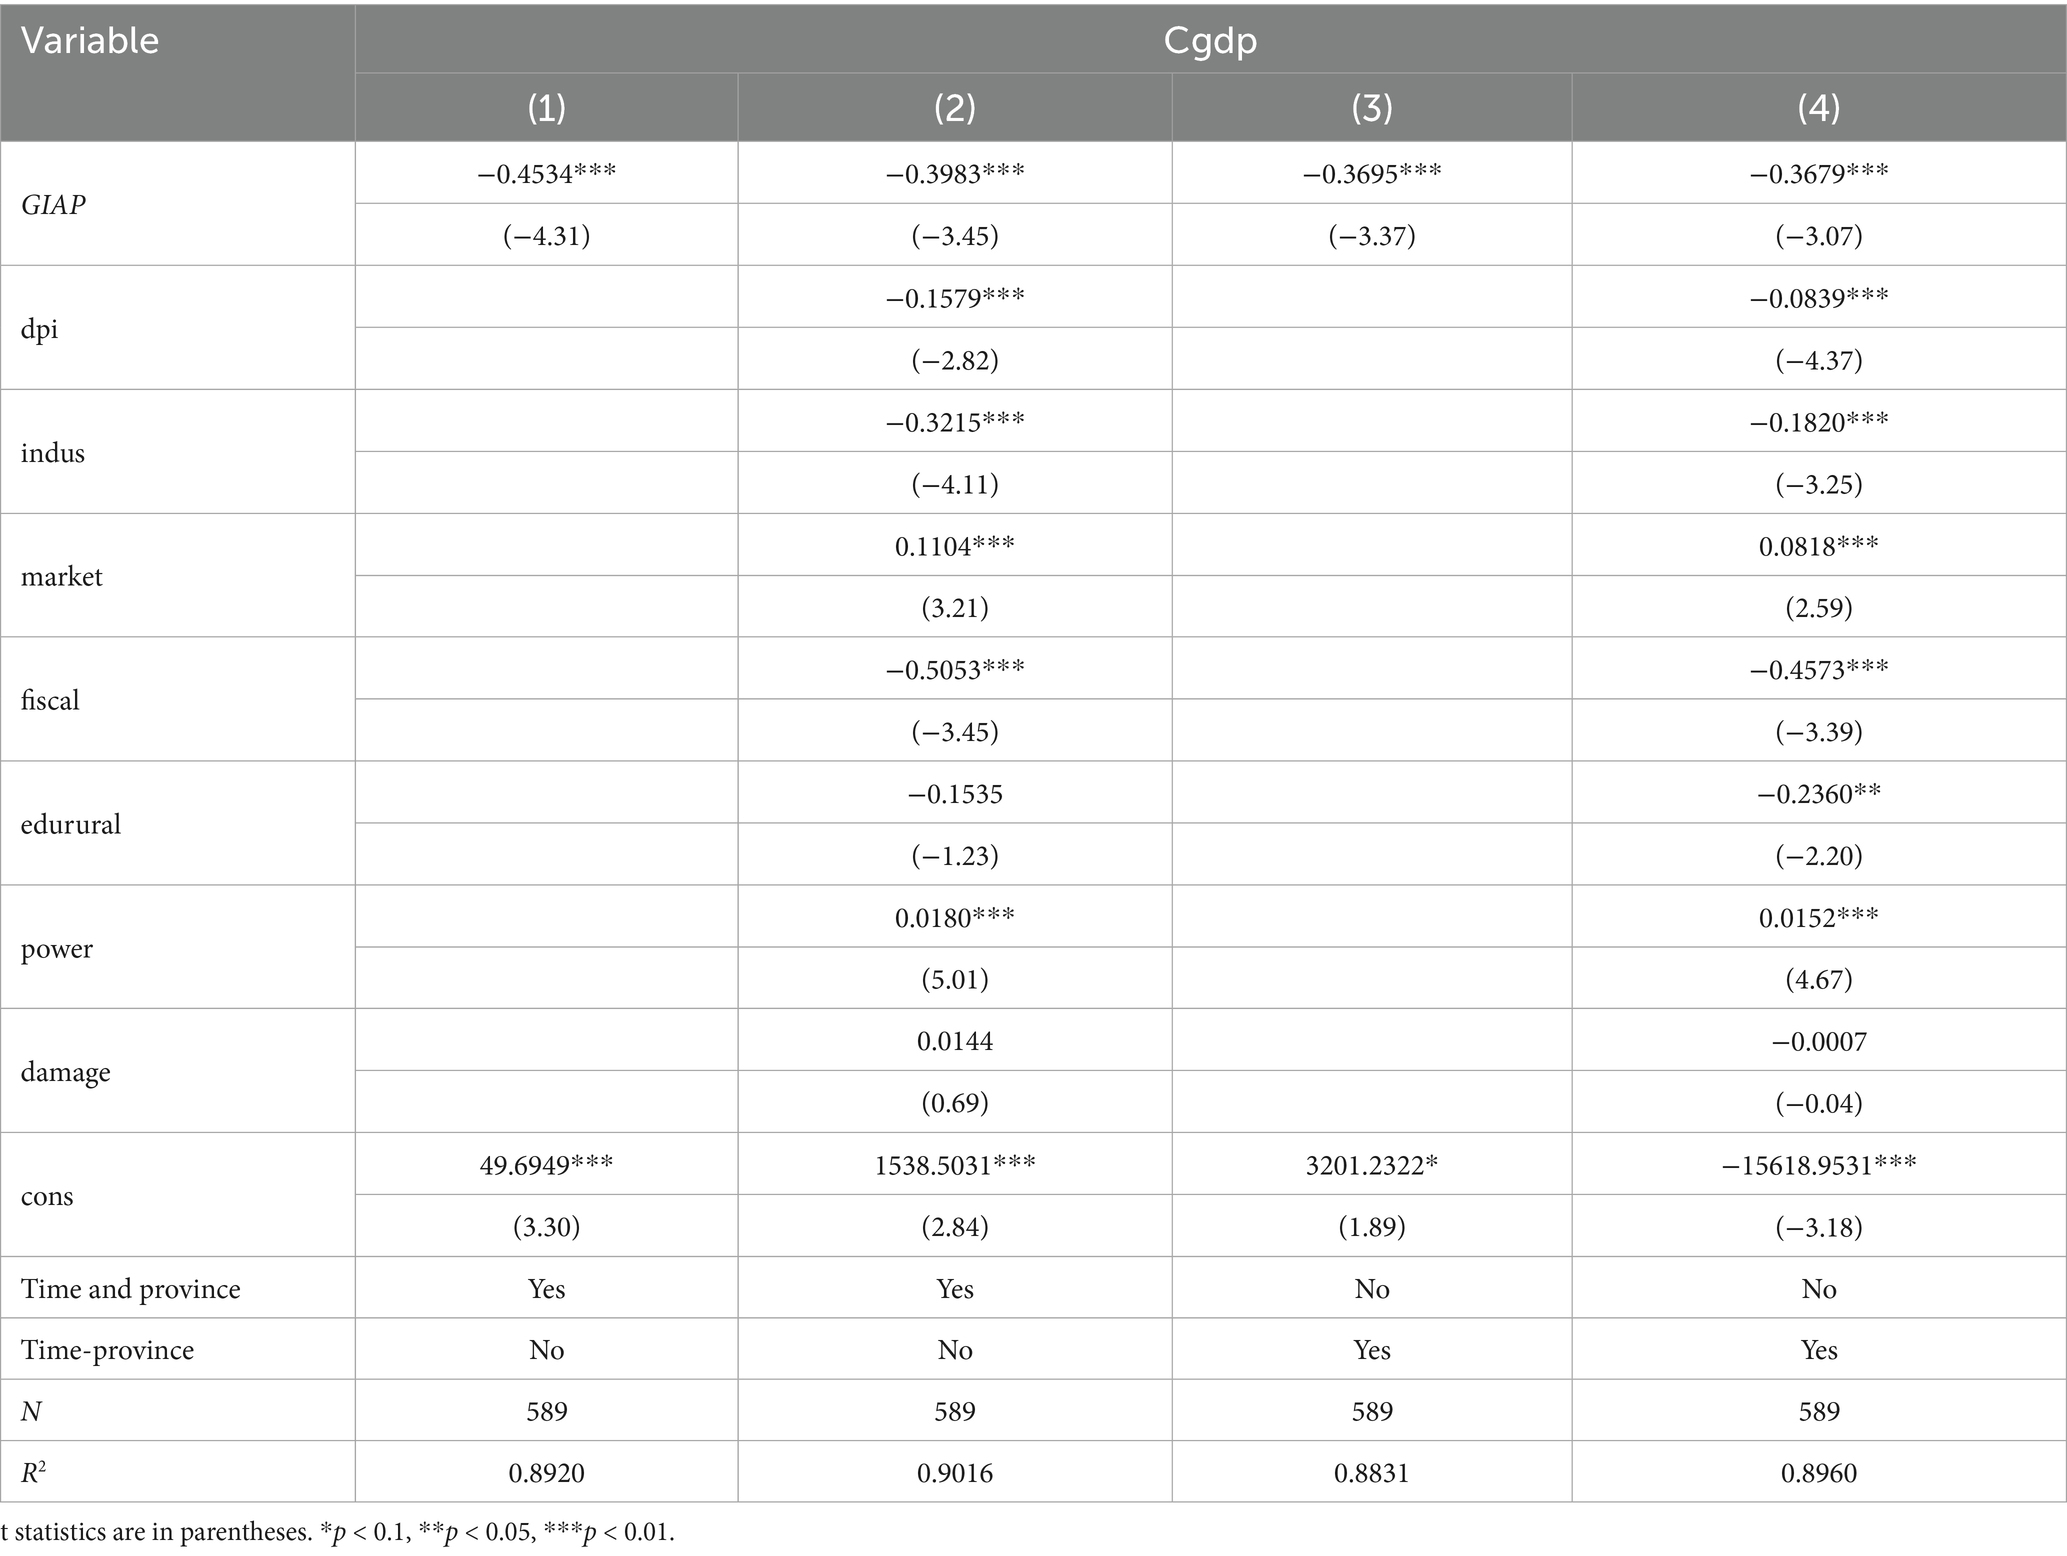
Table 3. Baseline regression results.
The GI system encourages the adoption of organic, ecological, or low-input agricultural practices, reducing the use of fertilizers and pesticides and thus lowering carbon emissions from agricultural activities. In addition, the GI system can enhance the market value and competitiveness of products (He et al., 2023), enabling producers to obtain higher returns. Market preference for GI products provides motivation for producers to maintain environmentally friendly production methods (Jiang et al., 2023), in order to retain GI certification status, thereby further reducing the carbon footprint in the production process. Finally, GIAP strengthens consumer awareness regarding sustainable and low-carbon products. Consumers’ green consumption preferences, in turn, incentivize producers to adopt greener production practices. This creates a two-way positive feedback mechanism, driving the green transformation of both market supply and demand, and thus promoting the achievement of carbon reduction objectives at the macro level.
5.2 Parallel trend test and dynamic effect analysis
Since this study treats the certification of GIAP as a policy shock and uses a multi-period, continuous difference-in-differences (DID) model to identify policy effects. So it is necessary to test the fundamental assumption of parallel trends prior to policy implementation. Following the approach of Kudamatsu (2012) and Huang et al. (2022), an event-study method is employed to examine parallel trends and to analyze dynamic effects. The model is as follows:
In Equation 4, =1 denotes the treatment group, while =0 indicates the control group. represents the indicator function. indicates the exact period of geographical indication (GI) certification for agricultural products, based on the relative time to the GI certification announcement (). In this study, the year 2007 (i.e., s = −1) is taken as the baseline period and excluded from the model. All other variables are consistent with those in Equation 1. If the regression coefficient is not significantly different from zero, it indicates that the parallel trends assumption holds for the model constructed in this study. Meanwhile, if the regression coefficients and are significantly different from zero, it suggests that the implementation of GI certification has a significant dynamic effect on agricultural carbon emissions.
The parallel trend and dynamic effects are plotted in Figure 2. As shown, during the 3 years before policy implementation, the estimated coefficients of GIAP are not significantly different from zero, confirming the parallel trend assumption. In the implementation year (2008), the coefficient becomes negative but is not significant, indicating that the policy had an initial effect, though with a lag in policy effectiveness. Over time, the reduction effect of GIAP certifications on agricultural carbon emissions becomes increasingly significant.
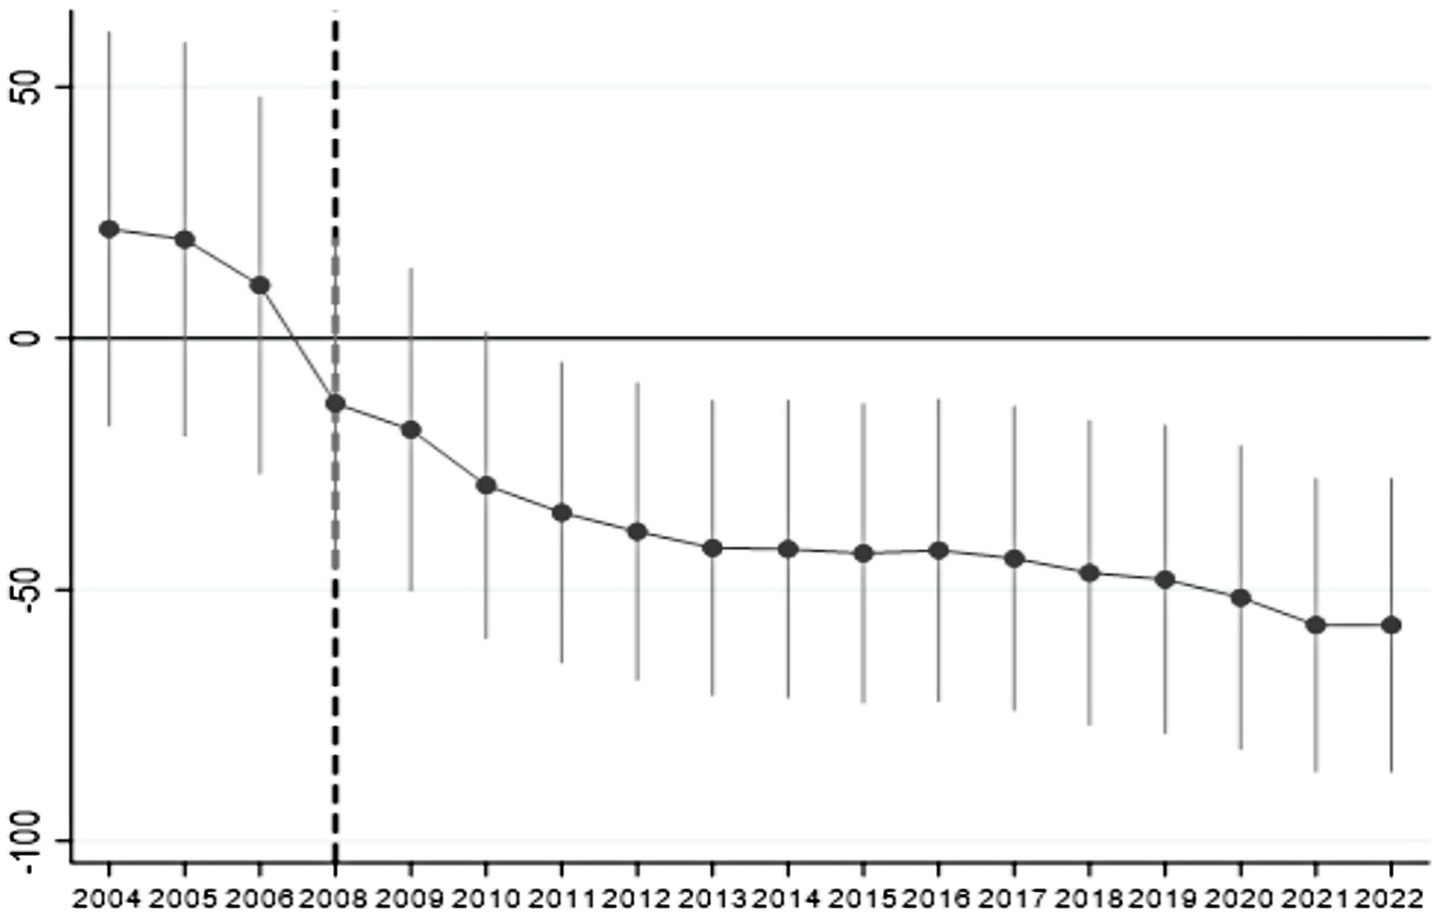
Figure 2. Parallel trends and dynamic effects.
5.3 Robustness checks
The analysis above has confirmed that GIAP can significantly promote the reduction of agricultural carbon emissions. To test the robustness of this conclusion, three robustness checks are conducted.
5.3.1 Re-measurement of the core variable
To avoid potential bias caused by indicator construction methods, the degree of agricultural carbon emissions is re-measured. Agricultural carbon emission intensity (Cgdp) is replaced with agricultural carbon emission density (Carea) and the agricultural carbon emission decoupling coefficient (Cdecoupling). Here, agricultural carbon emission density is represented by the ratio of total agricultural carbon emissions to arable land area. The decoupling coefficient is measured by the elasticity of agricultural carbon emissions relative to agricultural GDP. Columns (1) and (2) in Table 4 present the estimation results for Carea as the dependent variable under different fixed effects. The estimated coefficients of GIAP are found to be significantly negative at the 1% level. Columns (3) and (4) show the results for Cdecoupling as the dependent variable under different fixed effects. The coefficients for GIAP remain significant at the 5 and 1% levels, respectively. These findings further support Hypothesis 1.
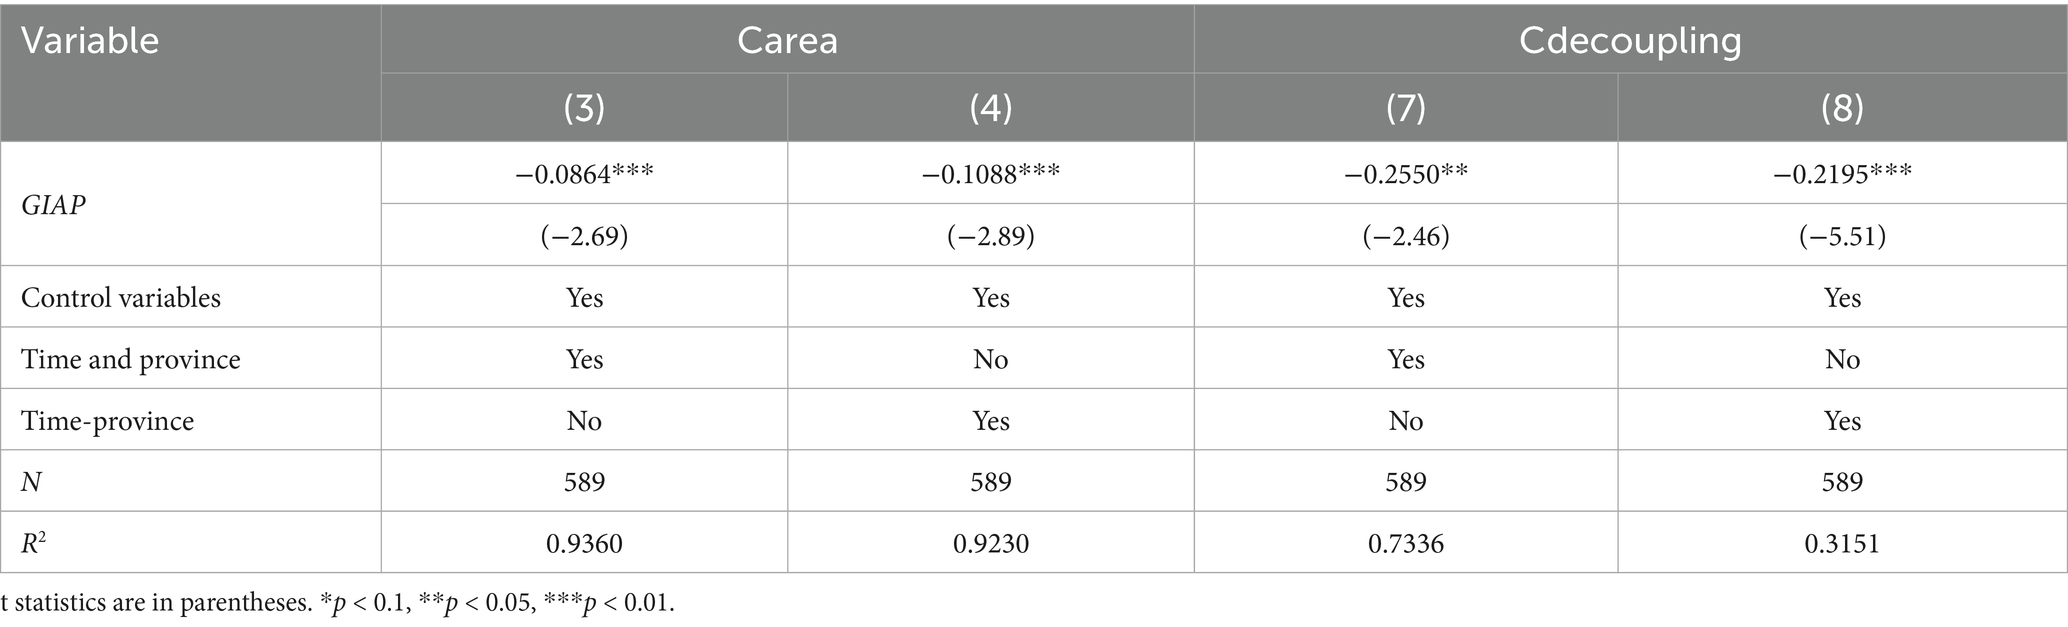
Table 4. Robustness check I: re-measurement of core variables.
5.3.2 Mitigation of endogeneity
To address potential endogeneity arising from reverse causality and omitted variable bias, all explanatory variables are included in the model with a one-period lag. In addition, the instrumental variable (IV) approach is employed to further alleviate endogeneity concerns. As instrumental variables, firstly, the lagged value of the most common core explanatory variable is used. Secondly, the interaction terms between the average slope and average elevation of each province and the time variable are selected. The rationale for the latter is that geographical slope and elevation represent regional geographic characteristics. It may affect the natural resource endowments of a region and thus influence the development of GIAP. However, slope and elevation theoretically have no direct effect on agricultural carbon emissions, making them reasonable choices for instrumental variables. Column (1) of Table 5 presents the regression results with all explanatory variables lagged by one period, which shows that the negative effect of GIAP on ACE remains robust. Columns (2), (3), and (4) report the IV regression results. The Anderson canonical correlation LM test and the Cragg-Donald Wald F test indicate that there are no issues of under-identification or weak instruments in the models. The estimated coefficients for GIAP are significantly negative at the 1% level, further confirming the robustness of the conclusions.
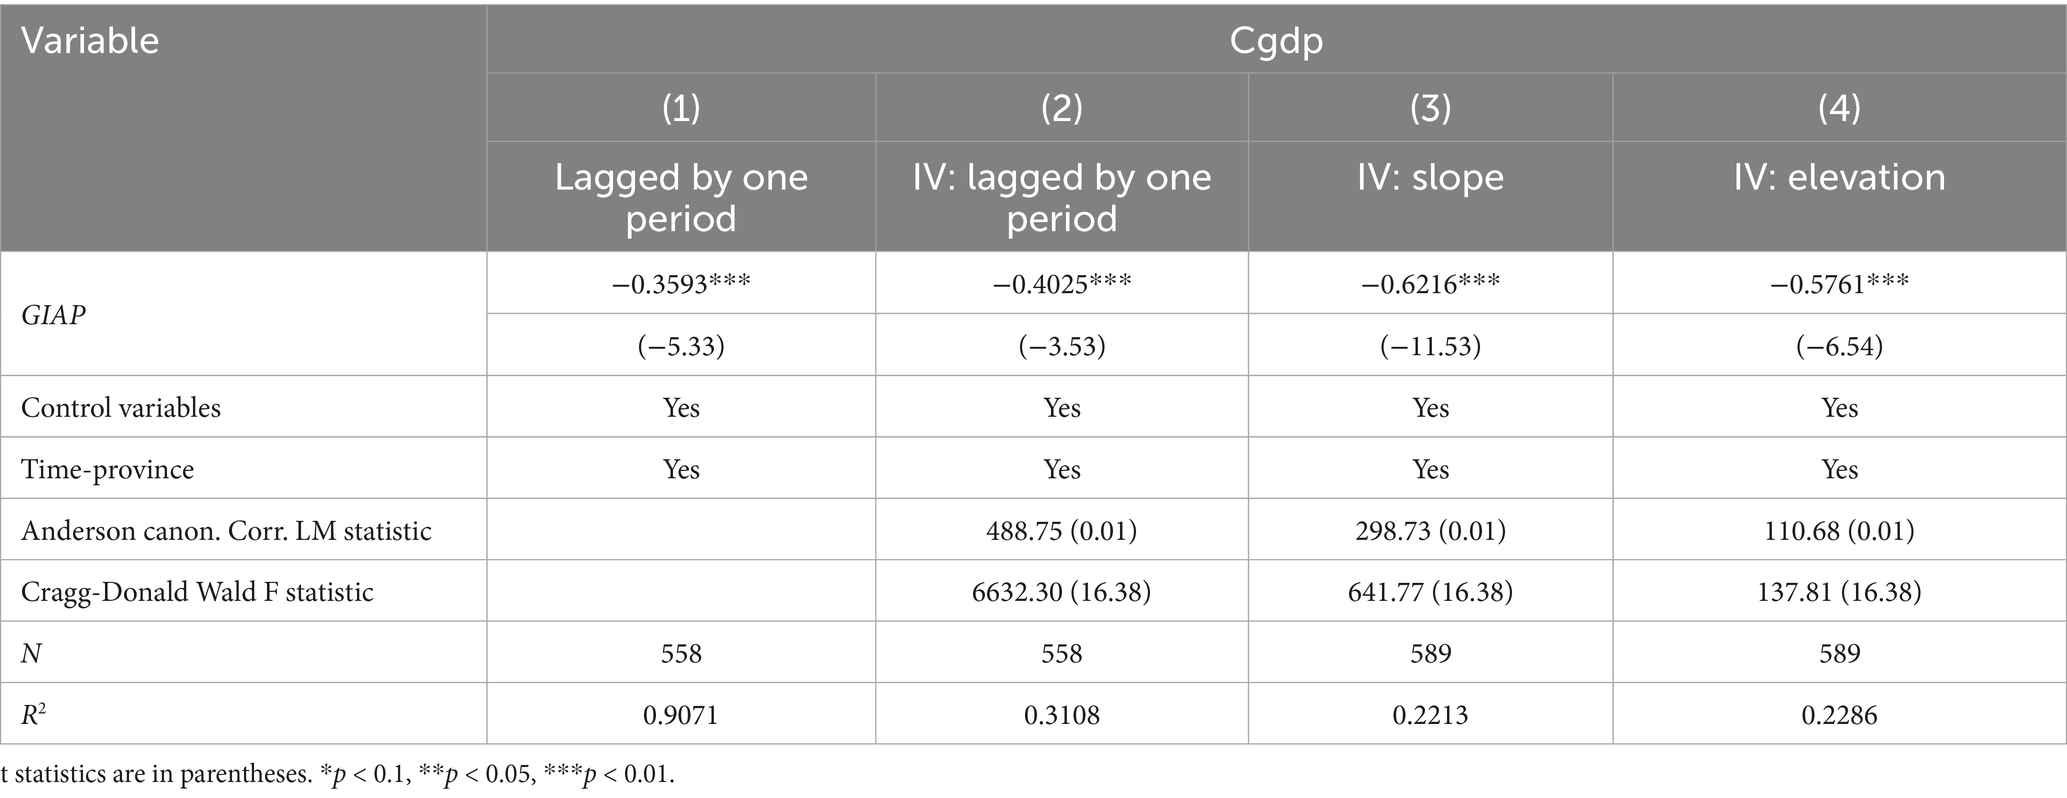
Table 5. Robustness check II: addressing endogeneity.
5.3.3 Placebo test with pseudo-treatment groups
To rule out the interference of other random factors, a common placebo test in difference-in-differences models is conducted using pseudo-treatment groups. Figures 3a–c present the distributions of estimated coefficients, t-values, and p-values, respectively, after randomly reassigning the treatment group 500 times. As shown, the mean estimated coefficient and the mean t-value of the GIAP are both close to zero, while the mean p-value ranges between 0.4 and 0.5, which is not statistically significant. This indicates that the observed effect of GIAP on agricultural carbon emissions is not driven by other random factors, thereby confirming the robustness of the main findings.
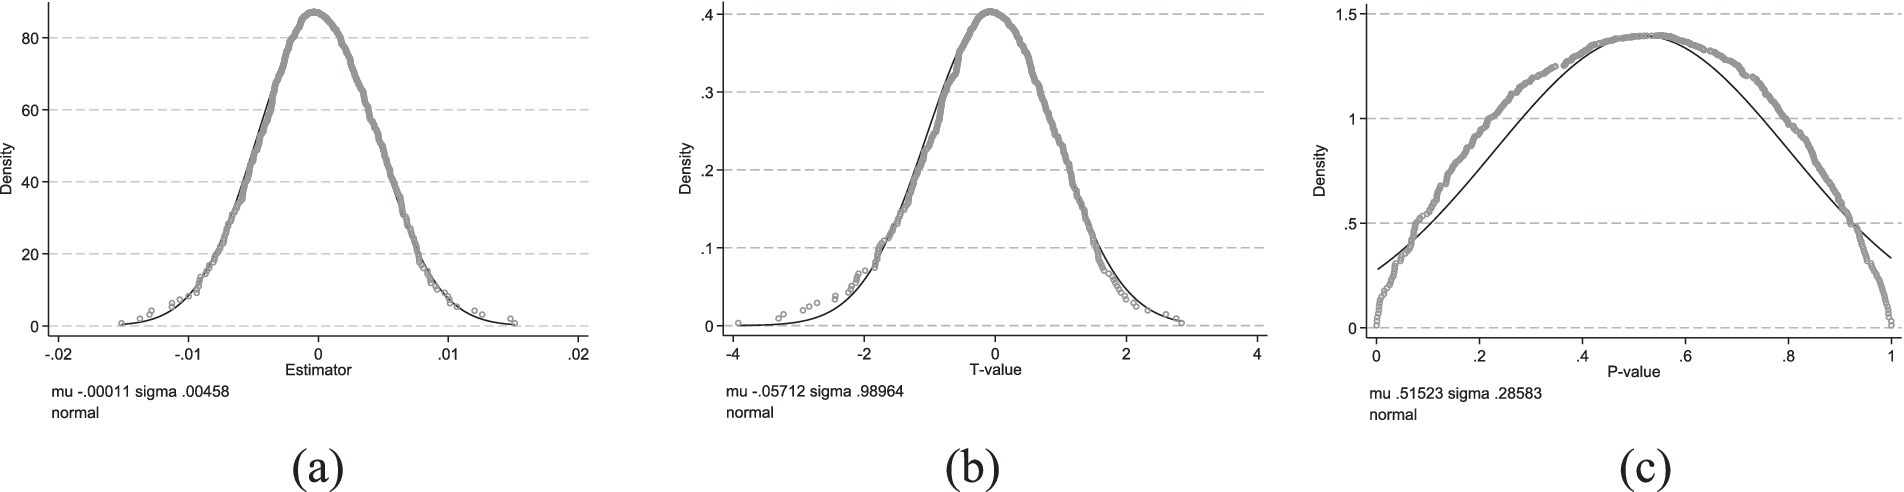
Figure 3. Robustness check III: placebo test.
5.4 Mechanism analysis
The preceding mechanism analysis revealed that GI can significantly promote carbon emission reduction in agriculture through multiple channels. These include facilitating farmland transfer, enhancing social services, optimizing cropping structures, and advancing technological progress and efficiency. Empirical tests are presented in Table 6. Except for technological progress, the coefficients of GIAP on farmland transfer, social services, grain crops, and technical efficiency are all significant at the 1% level.
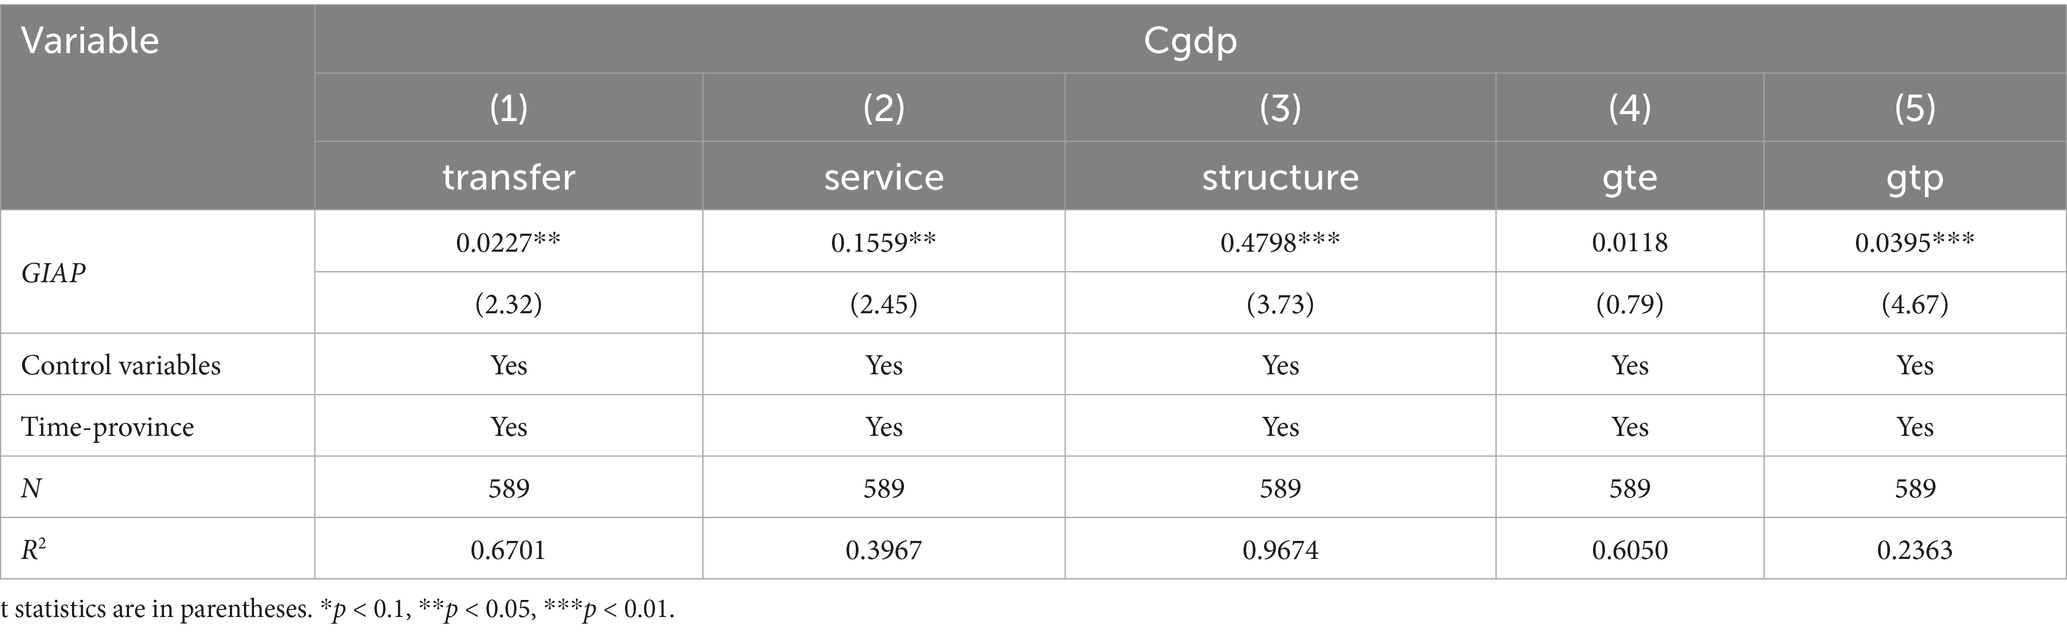
Table 6. Mechanism analysis.
GIAP promotes farmland transfer primarily because of the high added value of GI products, which attracts more capital and technology into the agricultural sector. Through land leasing and transfer, smallholder farmers can transfer land to more capable and skilled operators. These entities typically possess advanced technology and greater management expertise, thereby improving land use efficiency and reducing carbon emissions. Furthermore, GIAP promotes carbon emission reduction by strengthening social services. The certification of GIs is usually accompanied by investments in and improvements to agricultural infrastructure, resulting in increased efficiency in product circulation. In addition, a robust social service system enhances the dissemination of agricultural knowledge and technical training. Farmers’ acceptance and application of environmentally friendly agricultural techniques are thereby improved, making it easier to implement large-scale, mechanized, and intensive production. Moreover, carbon emissions are further reduced through the optimization of cropping structures enabled by GIAP. The market value and brand effect of GI products encourage farmers to prioritize grain crops in their production decisions. These crops generally exhibit higher per-unit-area carbon sequestration capacity and lower per-unit-yield emissions. The orientation toward grain cultivation enhances the land’s carbon sink function and reduces greenhouse gas emissions from agricultural activities. Finally, GIAP elevates technical efficiency. Through the introduction of standardized production and management protocols, overall technical levels and resource use efficiency are improved. GI certification requires producers to adhere to specific production standards and quality controls, which typically include environmental and sustainability requirements. By complying with these measures, producers are able to reduce resource wastage and improve input–output efficiency, ultimately leading to lower carbon emissions.
However, the carbon reduction effect of the technological progress mechanism has not yet become significant, which may be due to the fact that the cumulative effects of technological advances require a longer time horizon to fully materialize. In the early stages of the implementation of the GI system, producers tend to rely mainly on existing traditional technologies and experience, while the research, development, and diffusion of innovative technologies still require continuous time and financial investment (Dang et al., 2024). Although the promotion of the GI system helps enhance producers’ awareness and willingness to adopt new technologies, the actual implementation and widespread application of such innovations still necessitate a substantial period of accumulation. Overall, the GI system has significantly promoted agricultural carbon emission reduction through multiple mechanisms at various levels. Although the effect of the technological progress pathway has not yet been fully realized, other mechanisms have already demonstrated positive carbon reduction effects. This provides a solid theoretical foundation and practical guidance for further improving GI-related policy systems, promoting technological innovation, and advancing the green and low-carbon transformation of agriculture.
5.5 Analysis of spatial spillover effects
To examine whether the promotion of GIAP certification and agricultural carbon emissions in a specific region would influence the decisions and development of neighboring regions, this section employs a spatial econometric model to identify the spatial spillover effects of GIAP. Specifically, we construct the spatial weight matrix based on a nested matrix of per capita GDP and geographic distance. The economic distance nested matrix is chosen because it not only accounts for geographical proximity, but also reflects the similarity in economic development levels between regions, thereby better capturing real-world economic connections. The economic variable of per capita GDP is selected as it provides a more equitable and accurate measure of regional economic development, effectively eliminating the interference arising from differences in region size. After a series of tests, the spatial Durbin (SDM) difference-in-differences model is ultimately adopted. The model is specified as follows:
In Equation 5, w denotes the nested economic distance matrix, while all other variables remain consistent with Equation 1. The empirical results are presented in Table 7. Column (1) shows the baseline regression results. Column (2) reports the estimation of spatial effects, indicating that GIAP significantly promotes the reduction of agricultural carbon emissions both locally and in surrounding areas. Column (3) reports the direct spatial effect, indicating that a one-unit increase in local GIAP reduces local agricultural carbon emission intensity by 0.4294 units. This incorporates both the local impact and the feedback effect—where GIAP’s spatial spillover to neighboring regions subsequently enhances local emission reduction. Column (4) presents the indirect spatial effect, revealing that GIAP exerts a significant negative spatial spillover on surrounding regions’ agricultural carbon emissions, with an estimated coefficient of −0.1329. The direct spatial effect is stronger than the indirect spatial effect. Column (5) presents the total spatial effect. These results provide empirical support for Hypothesis 3.
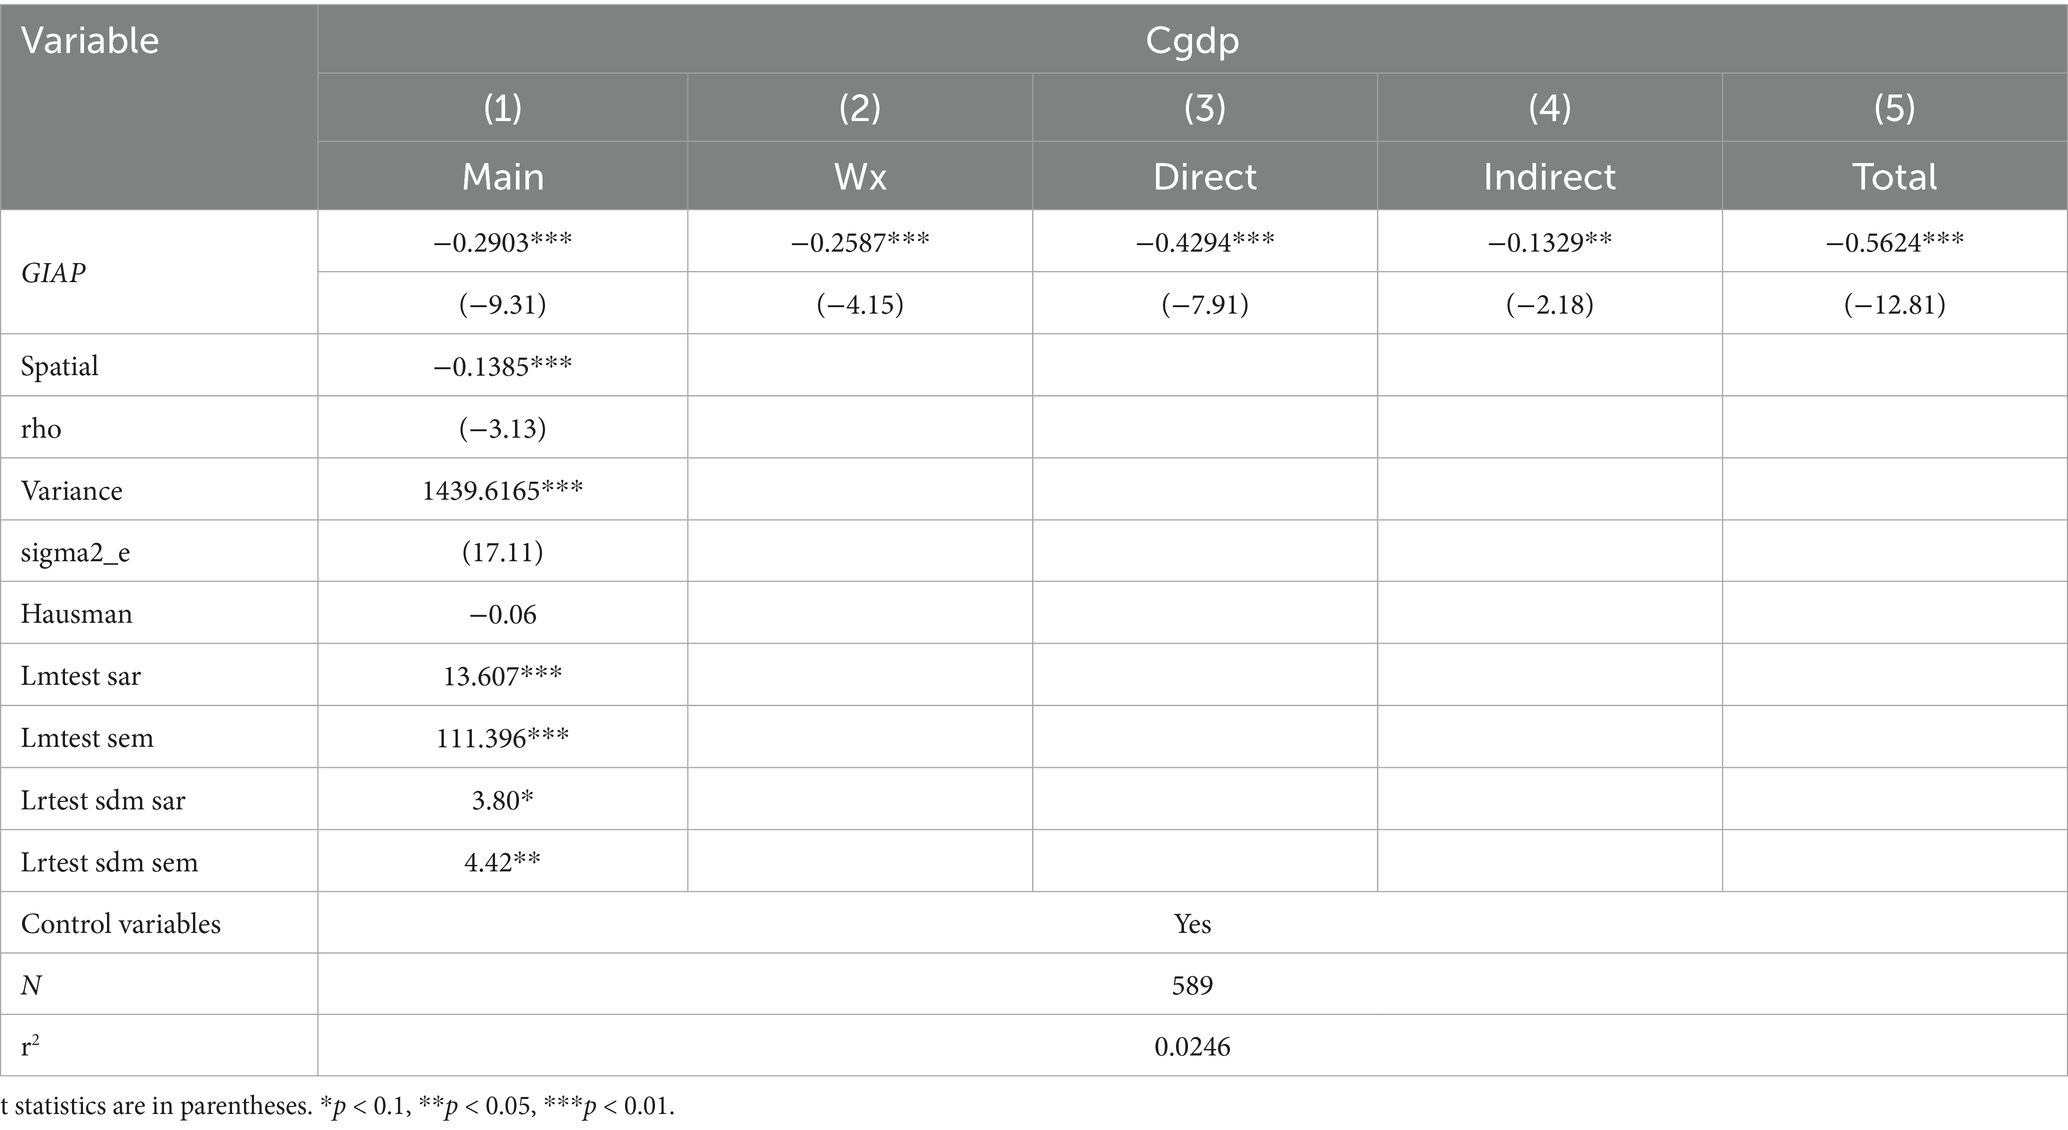
Table 7. Spatial Durbin model regression results.
5.6 Heterogeneity analysis
China is a vast country with significant regional and economic disparities, and clear spatial patterns of “hot” and “cold” zones. The impact of GIAP on agricultural carbon emissions may therefore vary across different regions. In this section, we conduct heterogeneity analysis from several perspectives and employ varying coefficient models for empirical testing.
5.6.1 Heterogeneity by geographic region
The sample is divided into three subgroups according to geographic regions: central, eastern, and western. Columns (2–4) of Table 8 report the results. In the eastern region, GIAP significantly reduces agricultural carbon emissions, while in the central region, GIAP significantly increases agricultural carbon emissions. In the western region, the effect of GIAP on agricultural carbon emissions is negative but not statistically significant.
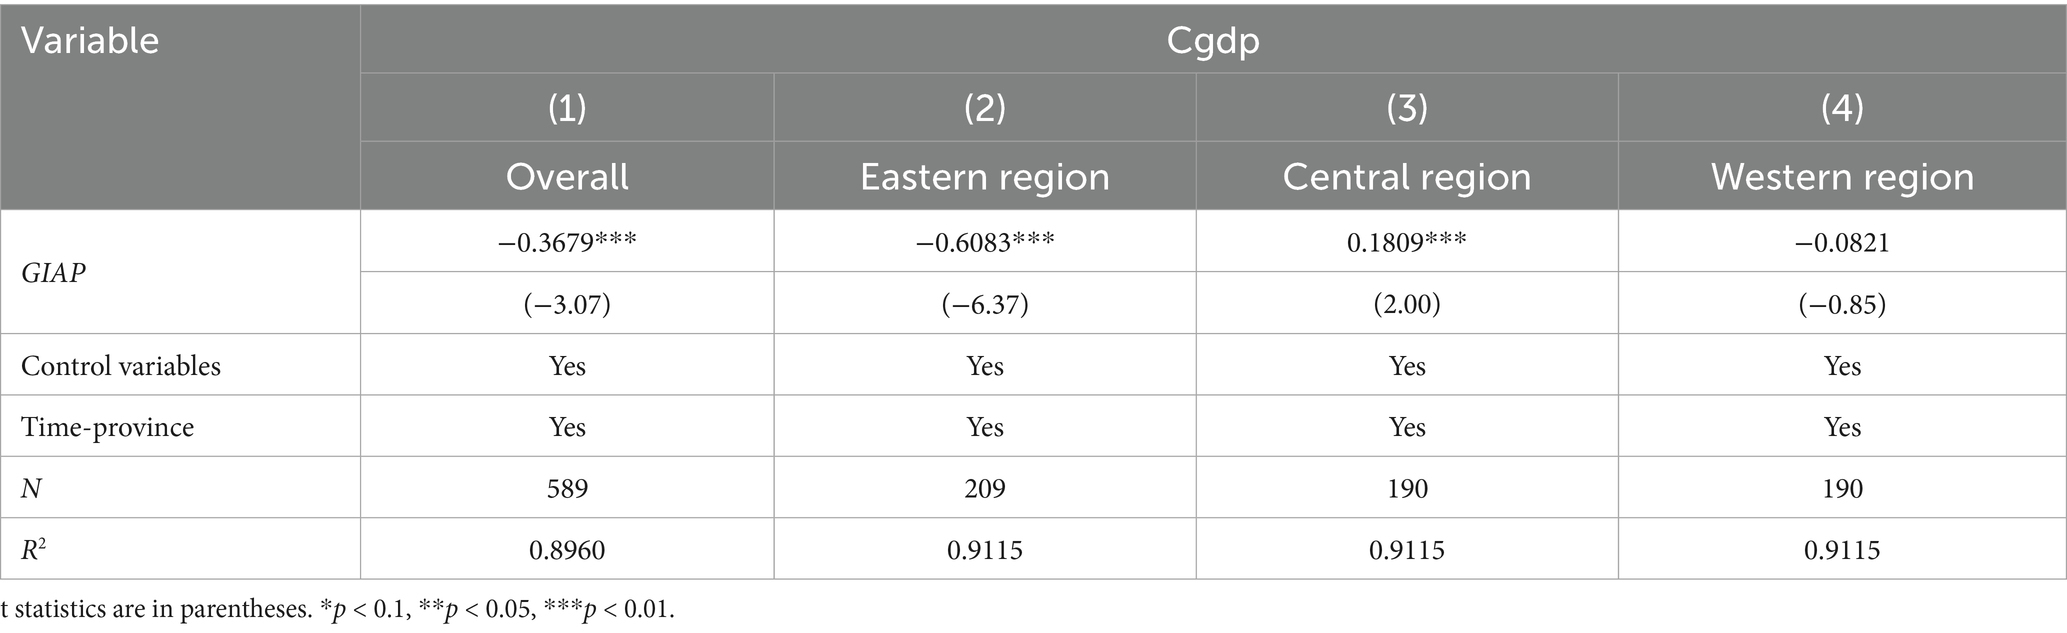
Table 8. Regression results of geographic heterogeneity.
The heterogeneous effects of GIAP across regions highlight differences in economic development levels, technological conditions, market demand, and policy implementation capacity. In the eastern region, technological innovation and market mechanisms have effectively achieved carbon reduction goals. In the central region, the implementation of the GI system may have led to unfavorable adjustments in industrial structure and changes in production methods, thus increasing the risk of higher carbon emissions. Although GIAP potentially has environmentally friendly effects in the western region, the absence of necessary technological support and market demand may have prevented such emission reduction effects from being realized.
5.6.2 Heterogeneity analysis by economic region
The sample is first divided into two subsamples according to whether the region is coastal or inland. It is then further classified based on whether the region belongs to the Yangtze River Economic Belt. Columns (2–5) of Table 9 report the results. In the inland areas, the effect of GIAP on agricultural carbon emissions is positive but not significant. By contrast, in the coastal regions, the Yangtze River Economic Belt, and the non-Yangtze River Economic Belt, GIAP significantly reduces agricultural carbon emissions. The significant reduction of agricultural carbon emissions by GIAP in the coastal and Yangtze River Economic Belt regions can be primarily attributed to higher levels of economic development and technological advancement, more mature market mechanisms, and stronger policy support for environmental protection in these areas. The non-Yangtze River Economic Belt also shows a significant reduction effect, possibly because it includes some coastal areas, which, in turn, helps promote agricultural carbon reduction in the entire region. In contrast, the effect of GIAP on agricultural carbon emissions in inland areas is positive but not significant, reflecting the challenges and limitations faced by these regions in implementing the GI system. The implementation of GIAP in inland areas may focus primarily on enhancing the market value of products, while lacking sufficient promotion and adoption of low-carbon production practices. In some cases, the pursuit of higher yield and quality may even lead to increases in chemical input and mechanization, thereby increasing carbon emissions.
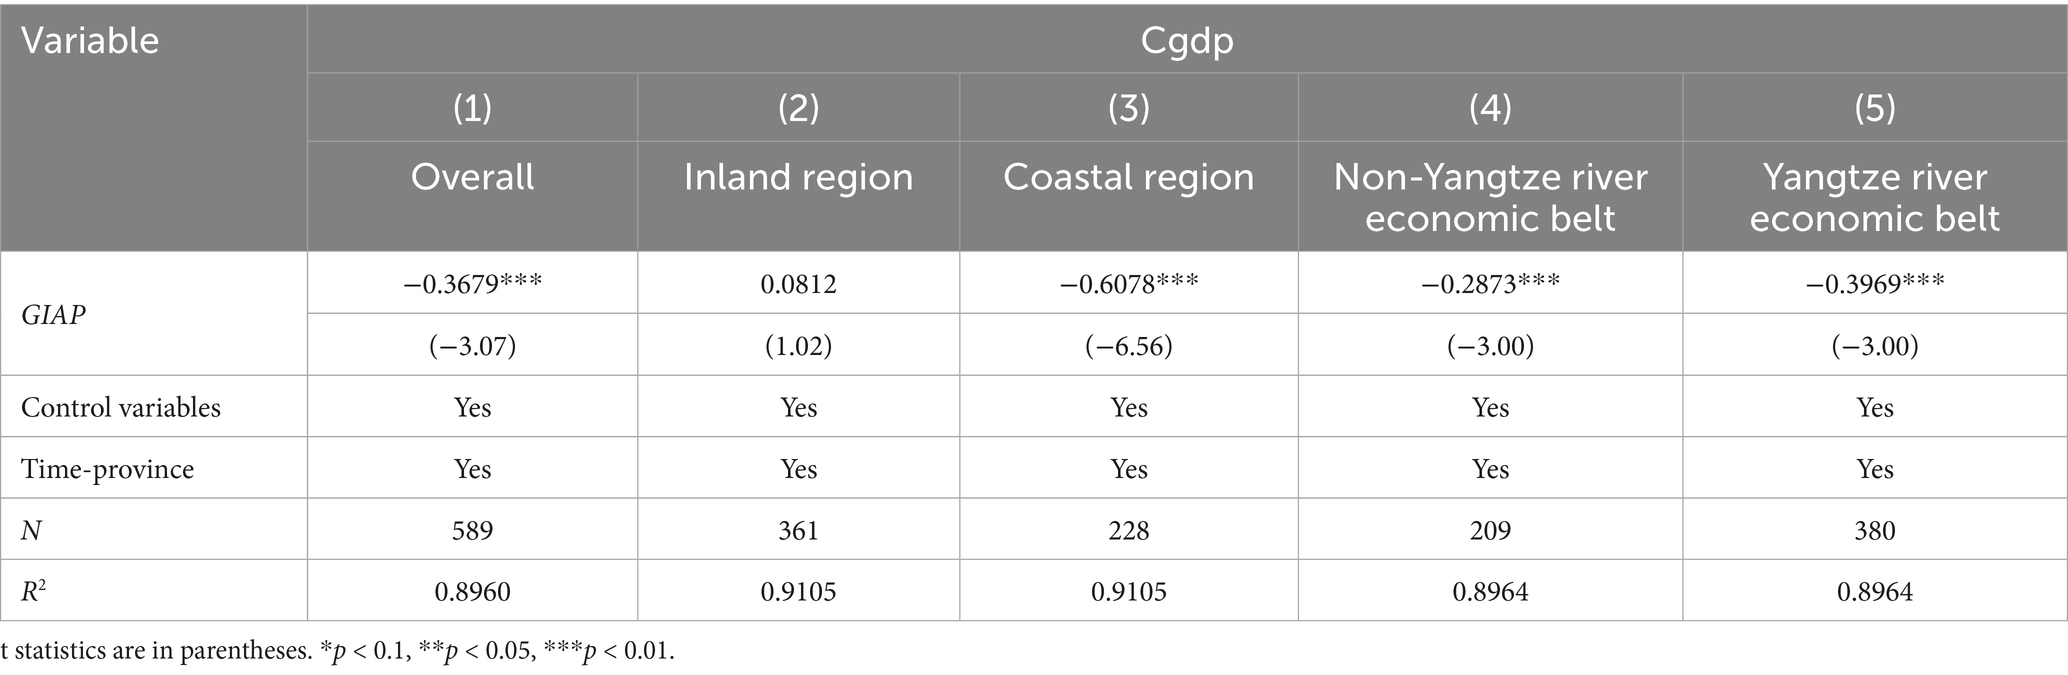
Table 9. Regression results of economic region heterogeneity.
5.6.3 Heterogeneity analysis by agricultural functional zone
As shown in columns (2–4) of Table 10, the impact of GIAP on agricultural carbon emissions varies significantly across different types of agricultural functional zones. In major grain-producing areas, major grain-selling areas, and production-marketing balance areas, GIAP significantly reduces agricultural carbon emissions. Among these, the emission reduction effect is greatest in major grain-selling areas, followed by major grain-producing areas, and is smallest in production-marketing balance areas. The significant differences in the impact of GIAP on agricultural carbon emissions across various agricultural functional zones reflect disparities in market demand, production capacity, technological level, and policy support. In major grain-selling areas, the strongest emission reduction effect can be attributed to high market demand and well-developed market mechanisms. In major grain-producing areas, significant emission reductions are achieved through economies of scale and technological advantages. Although the effect in production-marketing balance areas is relatively smaller, carbon reduction can still be realized through standardized production and market regulation.
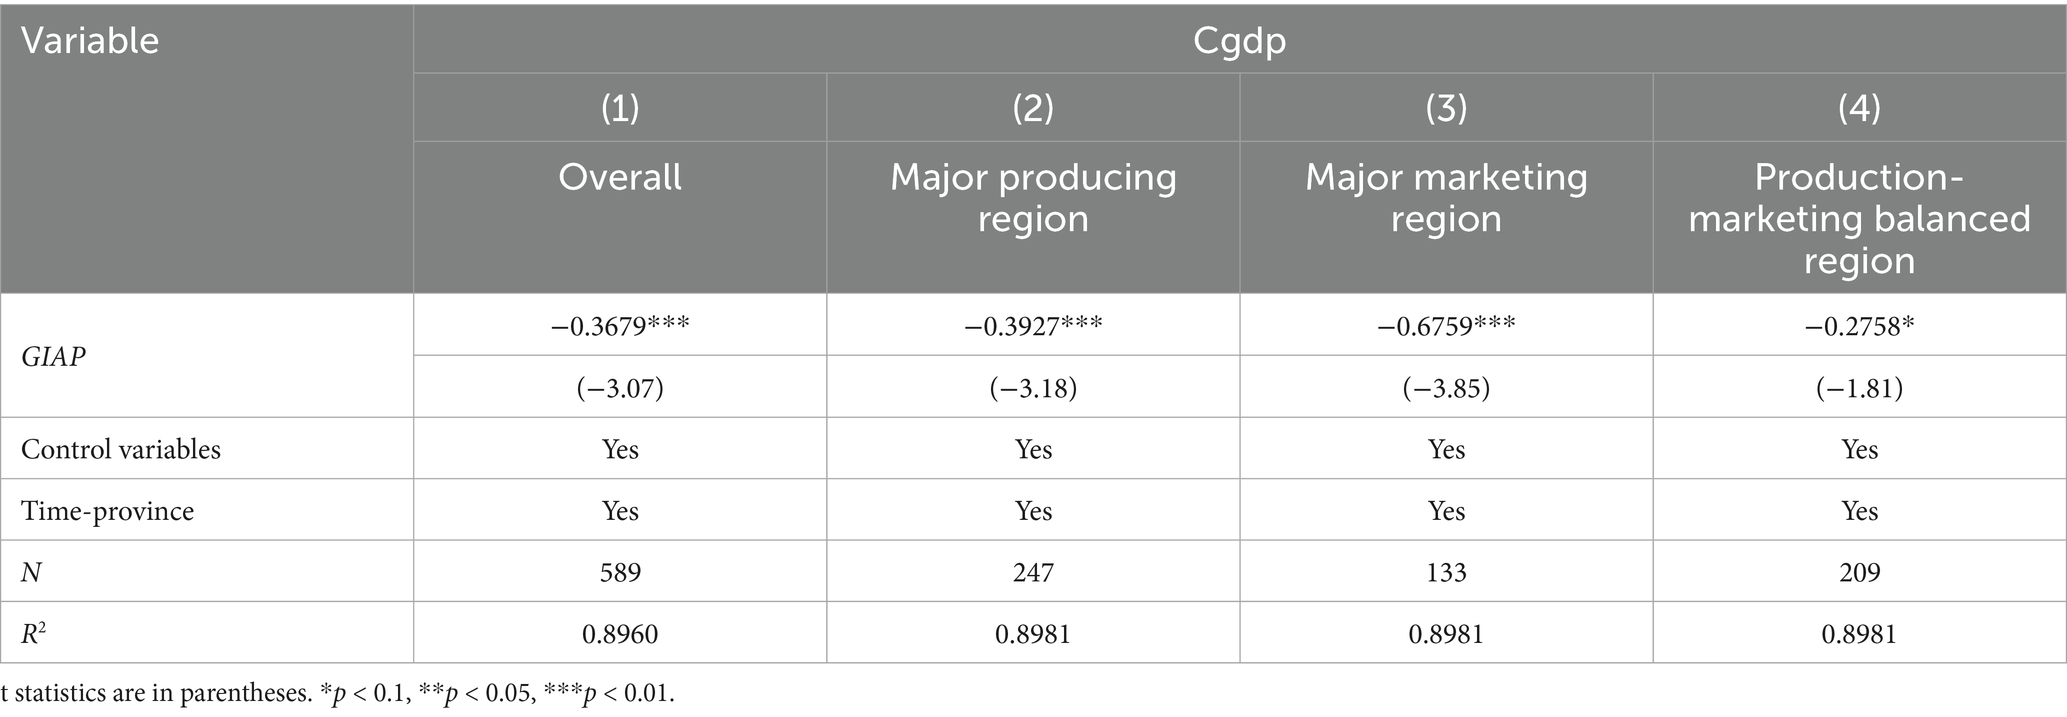
Table 10. Regression results of agricultural functional zone heterogeneity.
5.6.4 “Hot-cold” spatial heterogeneity analysis
Based on the level of carbon emission and the status of GI certification across different regions, this study classifies regions into four types according to the quadrants: hot-hot regions (Quadrant I), cold-hot regions (Quadrant II), cold-cold regions (Quadrant III), and hot-cold regions (Quadrant IV), to analyze their spatial heterogeneity. Specifically, cold-cold regions refer to areas where both local and neighboring values of the variables are relatively low, while hot-hot regions indicate areas where both local and neighboring values are high. Cold-hot regions are characterized by low local values but relatively high values in the surrounding regions, and hot-cold regions represent the opposite situation. Table 11 reports the estimation results for the spatial heterogeneity of “hot-cold” patterns in carbon emission intensity. The GIAP coefficients for both cold-hot and cold-cold regions are significantly positive at the 1% level, with the effect being larger in cold-cold regions. Cold-cold regions, characterized by both low local and surrounding carbon emission intensities and a solid foundation for green development, benefit from GIAP through further standardization and enhancement of green agricultural production and agricultural carbon reduction, resulting in more pronounced effects. In cold-hot regions, although the carbon emission intensity of neighboring areas is relatively high, the local low-carbon environment provides a valuable demonstration effect and technological support. Guided by the GI system, agricultural producers are encouraged to engage in green agricultural production activities.
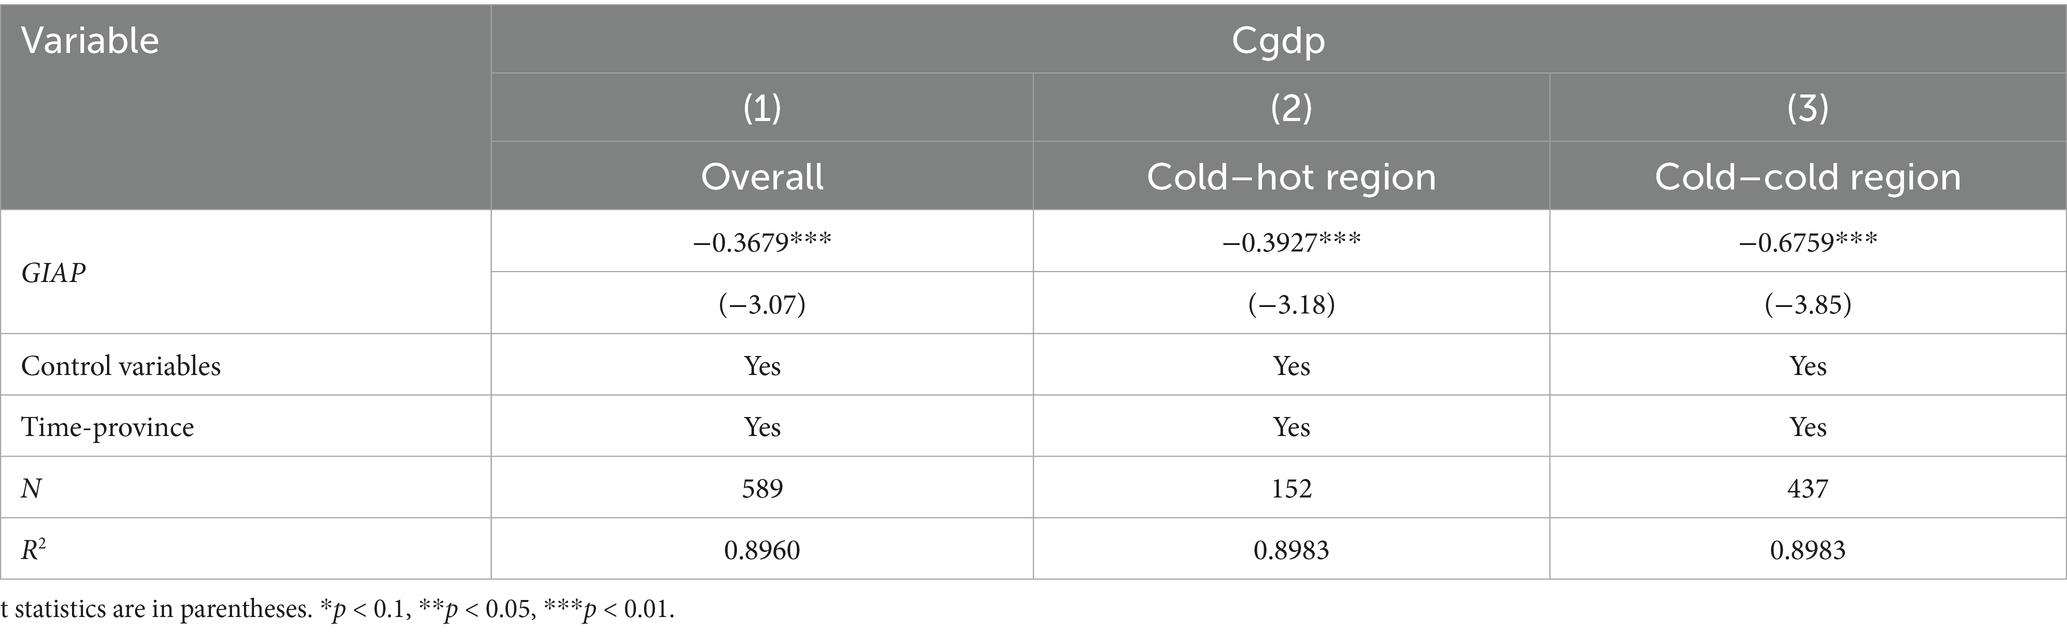
Table 11. Regression results of spatial heterogeneity of “hot-cold” patterns in carbon emission intensity.
Table 12 presents the estimation results of the spatial heterogeneity of “hot-cold” distribution in GIAP. In hot-hot and cold-cold regions, GIs significantly reduce agricultural carbon emissions, with the emission reduction effect being greater in cold-cold regions. In cold-hot regions, the effect of geographical indications on carbon emissions is negative but not significant, while in hot-cold regions, the effect is positive but also not significant. The significant emission reduction in hot-hot and cold-cold regions can be attributed to the base effects and environmental foundations unique to these regions, where GIAP can effectively reduce carbon emissions—especially the high marginal effect observed in cold-cold regions. Cold-hot regions have emission reduction potential. However, the effect is not significant due to the offsetting effect from the more developed GIs in surrounding areas. In hot-cold regions, the emission reduction effect is severely limited by the marginal diminishing effect of GIAP and insufficient support from neighboring regions.
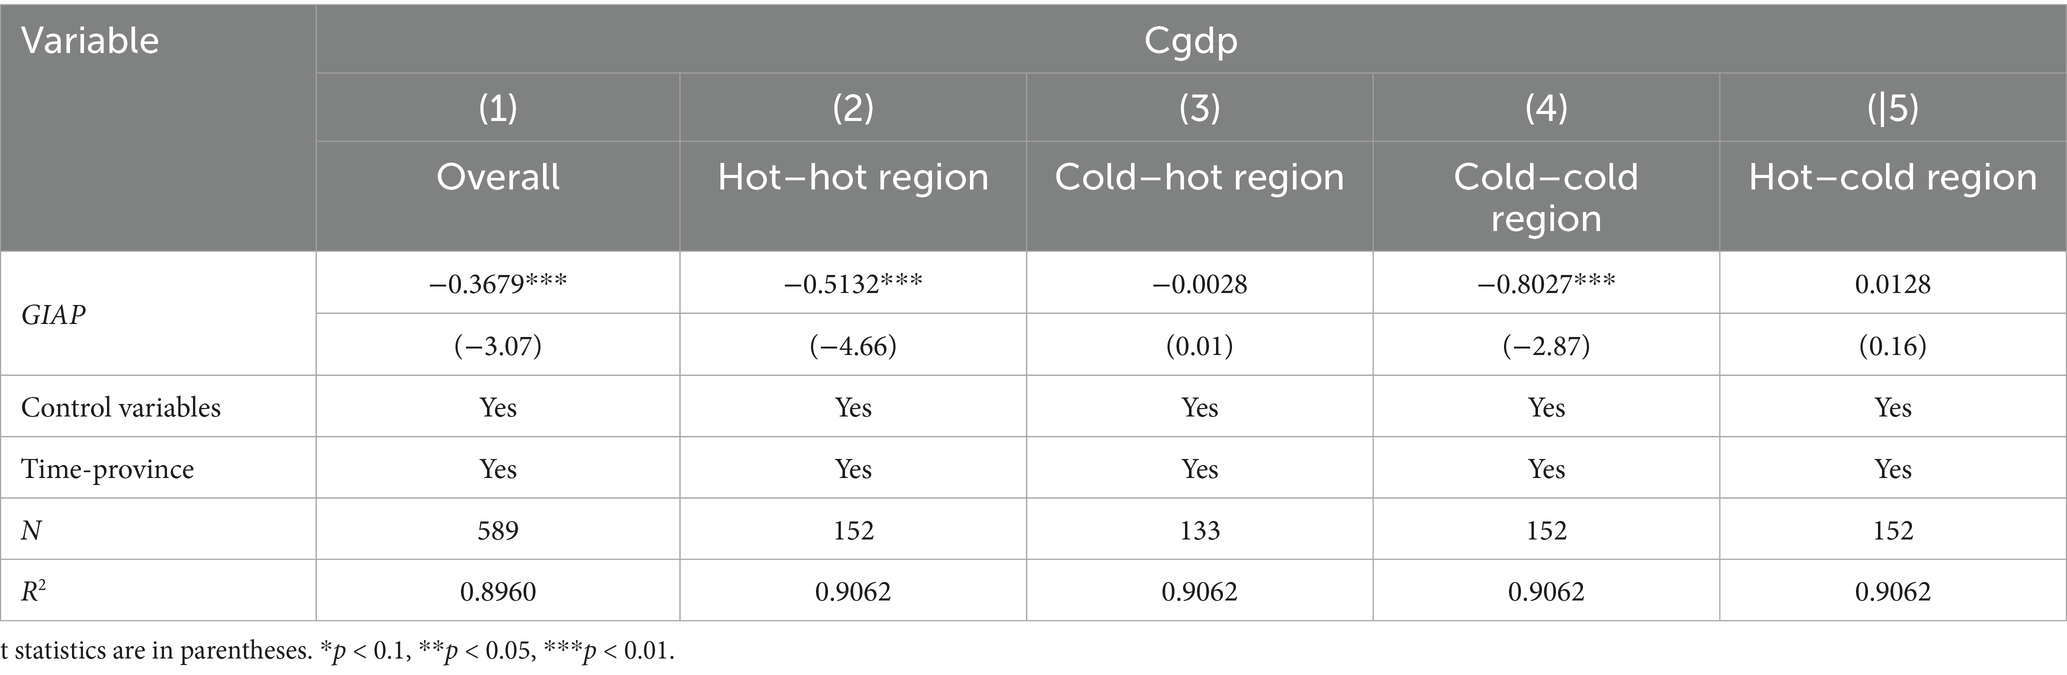
Table 12. Regression results of hot–cold spatial heterogeneity of geographical indications.
6 Conclusion
This paper incorporates the GIAP system into the analytical framework of agricultural carbon emissions. The impact effects, underlying mechanisms, heterogeneity, and spatial spillover effects of GIAP on agricultural carbon emissions are examined in depth. The study shows that GIAP can significantly reduce agricultural carbon emissions. Each additional GIAP certification reduces ACE intensity by 0.3679 units on average. This reduction is achieved through several mechanisms, including promoting farmland transfer, advancing agricultural social services, adjusting cropping structures, and improving technical efficiency. However, the mechanism of technological progress remains insufficiently developed. Spatial spillover effects are statistically confirmed. A one-unit increase in local GIAP reduces local emission intensity by 0.4294 units. GIAP exerts significant negative spillovers on neighboring regions. The coefficient is −0.1329. Critically, the direct effect is more pronounced than the indirect effect, indicating stronger local impacts. Further analysis indicates that the emission reduction effect of GIAP performs better in eastern regions, coastal areas, and the Yangtze River Economic Belt of China. Heterogeneity is observed across different agricultural functional zones and in varying spatial contexts. This study provides valuable support for sustainable agricultural development and ecological environment protection. Based on the findings, the following policy recommendations are proposed:
First, strengthen the certification and regulatory system for GIs. The government should increase its support for GIAP certification by optimizing certification standards, streamlining procedures, and improving service efficiency, thereby ensuring the quality and credibility of GI products. At the same time, a comprehensive regulatory mechanism for the entire process of GIAP should be established, with stricter enforcement to combat counterfeit and substandard products and effectively safeguard the brand value and market reputation of GIAP. Second, promote farmland transfer and large-scale farming. It is recommended to introduce more targeted policies to support farmland transfer, such as providing subsidies for farmland transactions and tax incentives. The improvement of farmland transfer service platforms should be pursued to reduce transaction costs. By encouraging appropriately scaled operations, land use efficiency can be enhanced, thereby unleashing the carbon reduction and economic benefits of large-scale agricultural production. Third, improve the agricultural socialized service system. The government should increase financial investment in basic services such as agricultural technical support, market information, and financial assistance, while encouraging diverse social entities to participate in the provision of agricultural socialized services. This may include establishing agricultural technology extension centers to provide farmers with practical technical training and advisory services free of charge or at low cost; improving the agricultural market information disclosure platforms to ensure timely and transparent release of key indicators such as supply, demand, and price; and expanding agricultural credit coverage by offering low-interest loans and risk protection, thereby helping farmers pursue green development and adopt advanced technologies. Fourth, promote the optimization of cropping structure and the adoption of green production practices. The government should guide farmers in rationally adjusting their cropping structure and expanding the cultivation area of GI products through subsidies and technical support. Farmers should be encouraged to adopt eco-friendly cultivation methods, reduce the use of chemical fertilizers and pesticides, and promote organic fertilizers and new green agricultural inputs. This joint approach will enhance both the quality of agricultural products and the effectiveness of agricultural carbon emission reduction.
Although this paper has thoroughly explored the role of GIAP in promoting agricultural carbon emission reduction, several limitations remain and require further research and refinement. First, data limitations exist. The analysis relies mainly on existing literature and Chinese statistical data, which may result in insufficient regional coverage. In future studies, data collection should be strengthened, particularly through field surveys and the accumulation of long-term dynamic data. A robust agricultural carbon emission database should be established. Second, there is a lack of multidimensional analysis of environmental impacts. This study focuses primarily on the impact of GIAP on agricultural carbon emissions, while other environmental factors—such as water resource utilization, soil health, and biodiversity—have not been comprehensively considered. Future research should take them into account. Through systematic environmental benefit assessments, a more comprehensive understanding of the overall ecological impact of GIAP can be achieved. This will provide stronger support for broader green development policies.
Data availability statement
The original contributions presented in the study are included in the article/Supplementary material, further inquiries can be directed to the corresponding author.
Author contributions
YZ: Conceptualization, Data curation, Formal analysis, Funding acquisition, Methodology, Writing – original draft, Writing – review & editing, Validation. YL: Conceptualization, Data curation, Formal analysis, Funding acquisition, Methodology, Writing – original draft, Writing – review & editing.
Funding
The author(s) declare that financial support was received for the research and/or publication of this article. This study was supported by the 2023 Annual Research Planning Discipline Research Youth Special Project of the “14th Five-Year Plan” of Jiangsu Open University (Jiangsu City Vocational College) (2023XK024); 2023 Annual Research Planning Discipline Research Youth Special Project of the “14th Five-Year Plan” of Jiangsu Open University (Jiangsu City Vocational College) (2023XK013); 2024 Jiangsu Province University Philosophy and Social Science Research Project by Jiangsu Provincial Department of Education(2024SJYB0572).
Conflict of interest
The authors declare that the research was conducted in the absence of any commercial or financial relationships that could be construed as a potential conflict of interest.
Generative AI statement
The authors declare that no Gen AI was used in the creation of this manuscript.
Publisher’s note
All claims expressed in this article are solely those of the authors and do not necessarily represent those of their affiliated organizations, or those of the publisher, the editors and the reviewers. Any product that may be evaluated in this article, or claim that may be made by its manufacturer, is not guaranteed or endorsed by the publisher.
Supplementary material
The Supplementary material for this article can be found online at: https://www.frontiersin.org/articles/10.3389/fsufs.2025.1644196/full#supplementary-material
Footnotes
1. ^Data collected and compiled by the author; see core variable measurement for details.
References
Ai, W. W., Zhang, Y., and Yang, J. J. (2025). Can geographical indications for agricultural products narrow the urban-rural income gap at the county level? J. Guizhou Univ. Financ. Econ. 2, 32–42.
Arfini, F., Cozzi, E., Mancini, M. C., Ferrer-Perez, H., and Gil, J. M. (2019). Are geographical indication products fostering public goods? Some evidence from Europe. Sustainability 11:272. doi: 10.3390/su11010272
Belletti, G., Marescotti, A., and Touzard, J. M. (2017). Geographical indications, public goods, and sustainable development: the roles of actors’ strategies and public policies. World Dev. 98, 45–57. doi: 10.1016/j.worlddev.2015.05.004
Chen, J., and Zhong, F. (2024). Synergistic path of dietary structure optimization and agricultural carbon emission reduction: an analysis based on food price. J. Hunan Agric. Univ. 25, 16–24. doi: 10.13331/j.cnki.jhau(ss).2024.01.003
Dang, G. Y., Guo, Y. X., and Zhang, L. G. (2024). Mechanisms and paths of geographical indications leading the construction of Ethnic Mountain areas and beautiful countryside: an analysis based on the perspective of new endogenous development. China Rural Economy 7, 96–118. doi: 10.20077/j.cnki.11-1262/f.2024.07.005
De Filippis, F., Giua, M., Salvatici, L., and Vaquero-Piñeiro, C. (2022). The international trade impacts of geographical indications: hype or hope? Food Policy 112:102371. doi: 10.1016/j.foodpol.2022.102371
Dubey, A., and Lal, R. (2009). Carbon footprint and sustainability of agricultural production systems in Punjab, India, and Ohio, USA[J]. J. Crop Improv. 23, 332–350. doi: 10.1080/15427520902969906
Falasco, S., Caputo, P., and Garrone, P. (2024). Can geographical indications promote environmental sustainability in food supply chains? Insights from a systematic literature review. J. Clean. Prod. 444:141100. doi: 10.1016/j.jclepro.2024.141100
Giua, M., Salvatici, L., Vaquero-Piñeiro, C., and Solazzo, R. (2024). Do territories with geographical indications trade better? Italian. Econ. J. 11, 31–64. doi: 10.1007/s40797-024-00269-3
He, Q., Deng, X., Li, C., Yan, Z. C., and Qi, Y. B. (2023). The mechanism and empirical analysis of agricultural product Brands in Enhancing Agricultural Competitiveness: evidence from 91 counties with geographical indications in Sichuan Province. Chin. J. Agric. Res. Reg. Plann. 44, 241–252.
He, Y., and Liao, P. (2024). Carbon insurance, low-carbon fiscal and tax policies, and agricultural carbon emission reduction: an evolutionary game analysis based on carbon emission trading. Soft Sci. 38, 107–117. doi: 10.13956/j.ss.1001-8409.2024.05.15
Hu, L., Sun, X., and Liu, F. (2024). Research on the relationship among agricultural production energy use, agricultural economic growth and agricultural energy carbon emissions based on green total factor productivity perspective in China. J. Nanjing Agric. Univ. Soc. Sci. 24, 174–186. doi: 10.19714/j.cnki.1671-7465.2024.0037
Huang, W., Zhang, Z., and Liu, A. (2022). From difference-in-differences to event study. Industrial Econ. Rev. 2, 17–36. doi: 10.19313/j.cnki.cn10-1223/f.20211227.002
Ji, X., Liu, H., and Zhang, Y. (2023). The impact of farmland transfer on the intensity of agricultural carbon emissions in China and its mechanism. China Land Sci. 37, 51–61. doi: 10.19674/j.cnki.issn1000-6923.20230906.003
Jiang, Y., Pu, Y. P., Ding, Y. L., Jin, S. S., and Yu, H. L. (2023). Premium effects and synergistic effects of geographical indication agricultural products and corporate brands: a case study of green tea products. Econ. Geogr. 43, 179–186. doi: 10.15957/j.cnki.jjdl.2023.09.019
Jin, S., Lin, Y., and Niu, K. (2021). Promoting agricultural green transformation through low-carbon development: characteristics and emission reduction paths of agricultural carbon emissions in China. Reform 5, 29–37.
Kudamatsu, M. M. (2012). Has democratization reduced infant mortality in sub-Saharan Africa? Evidence from Micro data. J. Eur. Econ. Assoc. 10, 1294–1317. doi: 10.1111/j.1542-4774.2012.01092.x
Li, C., Gao, J., Ge, L., Hu, W., and Ban, Q. (2023). Do geographical indication products promote the growth of the agricultural economy? An empirical study based on Meta-analysis. Sustainability 15:14428. doi: 10.3390/su151914428
Li, K., and Shi, L. (2024). The impact of rural industry integration on agricultural carbon emissions: mechanism path and spatial spillover effect analysis. China Agric. Res. Reg. Planning 45, 1–14.
Li, B., Tian, Y., and Wang, Q. (2024). Regional differences and equity of rural carbon emissions in China. J. Huazhong Agric. Univ. Soc. Sci. 2024, 25–37. doi: 10.13546/j.cnki.tjyjc.2023.21.009
Li, B., Zhang, J., and Li, H. (2011). Temporal and spatial characteristics and influencing factors of agricultural carbon emissions in China. China Popul. Resour. Environ. 21, 80–86.
Li, K., Zhang, H., and Shi, L. (2023). Empirical test of spatial spillover effect of agricultural science and technology progress on agricultural carbon emissions. Statistics Decision 39, 52–57.
Liu, J., and Mu, Y. (2024). Carbon emission reduction effect of agricultural insurance development: theoretical mechanism and empirical test. China Agric. Res. Reg. Plann. 46, 50–61.
Luo, M., and Wei, B. (2023). The emission reduction effect of agricultural productive services: effect and mechanism. Econ. Geogr. 40, 58–68. doi: 10.15931/j.cnki.1006-1096.2023.04.001
Qie, H. K., Chao, Y. D., Chen, H., and Zhang, F. (2023). Do geographical indications of agricultural products promote county-level economic growth? China Agric. Econ. Rev. 15, 666–681. doi: 10.1108/CAER-08-2022-0187
Tian, Y., Cai, Y., and Zhang, H. (2024). The impact of digital economy on agricultural carbon emission efficiency: based on threshold effect and spatial spillover effect. Agric. Technol. Econ. 22, 1–19.
Tian, Y., and He, Y. (2023). Has rural labor transfer promoted agricultural carbon emission reduction? A panel data test based on 30 provinces. J. China Univ. Geosci. Soc. Sci. 23, 61–73. doi: 10.16493/j.cnki.42-1627/c.20230821.002
Tong, W., Li, Y., and Zhang, D. (2024). Can agricultural service reduce the carbon emission intensity of Chinese agriculture? China Agric. Res. Reg. Plann. 12, 1–13.
Wang, Z., Qin, F., Liu, J., and Jin, X. (2025). Evolution trajectory and driving mechanism of the synergistic effect on construction waste and carbon reduction: evidence from China. Waste Manag. 203:114891. doi: 10.1016/j.wasman.2025.114891
Wang, Z., Zhou, Y., Wang, T., and Zhao, N. (2024). Efficiency of construction waste and carbon reduction in the construction industry: Based on improved three stage SBM-DEA model in China. Eng. Constr. Architectur. Manage 9, 369–469. doi: 10.1108/ECAM-10-2023-1088
West, T. O., and Marland, G. (2002). A synthesis of carbon sequestration, carbon emissions, and net carbon flux in agriculture: comparing tillage practices in the United States. Agric. Ecosyst. Environ. 91, 217–232. doi: 10.1016/S0167-8809(01)00233-X
Wu, F. L., Li, L., Zhang, H. L., and Chen, H. (2007). Net carbon emissions of farmland ecosystem influenced by conservation tillage. J. Ecol. 26, 2035–2039.
Xie, Y. S., Wang, C. J., and Wu, A. L. (2022). Spatiotemporal evolution and interactive response of geographical indication agricultural products and agricultural economy. Sci. Geogr. Sin. 42, 1577–1587. doi: 10.13249/j.cnki.sgs.2022.09.007
Yan, Y. R., and Zhang, J. T. (2025). The effect of geographical indication agricultural product certification on increasing farmers’ income: evidence from poverty alleviation counties. China Rural Survey 2025, 23–45. doi: 10.20074/j.cnki.11-3586/f.2025.03.001
Yi, Y., and Gu, C. (2023). The impact of smallholder structure on agricultural carbon emissions under urbanization background. Rural Econ. 11, 116–124.
Zhang, S., Sun, Y., Wang, Y., and Lin, X. (2024). Geographical indication, agricultural development and the alleviation of rural relative poverty. Sustain. Dev. 32, 5764–5780. doi: 10.1002/sd.2997
Zhang, S., Sun, Y., Yu, X., and Zhang, Y. (2023). Geographical indication, agricultural products export and urban–rural income gap. Agriculture 13:378. doi: 10.3390/agriculture13020378
Zhang, Q., and Zhang, Z. (2021). Changes in human capital in China over 70 years: dual perspectives of demographic transition and education improvement. Stat. Res. 38, 47–59.
Zhi, J., and Gao, J. X. (2009). Comparative analysis on carbon emissions of food consumption of urban and rural residents in China. Prog. Geogr. 28, 429–434.
Zhou, G., Lu, C., Hu, T., and Zhou, Y. B. (2022). Spatial differentiation of agricultural product geographical indications and its relationship with agricultural economy: a case study of Henan Province. Henan Sci. 40, 533–539.
Zhou, A., and Ying, R. (2012). Study on consumers’ willingness to pay for geographical indication agricultural products and its influencing factors: an analysis framework and empirical test based on psychological factors of consumer behavior. Acad. Explor. 5, 110–113.
Keywords: agricultural carbon emissions, geographical indications, difference-in-differences, green agriculture, spatial spillover
Citation: Zhang Y and Liu YP (2025) Geographical indication certification of agricultural products and agricultural carbon emissions—empirical evidence from China. Front. Sustain. Food Syst. 9:1644196. doi: 10.3389/fsufs.2025.1644196
Edited by:
Zhenshuang Wang, Dongbei University of Finance and Economics, ChinaReviewed by:
Shuitai Xu, Jiangxi University of Science and Technology, ChinaYanxin Zhou, Chongqing University, China
Copyright © 2025 Zhang and Liu. This is an open-access article distributed under the terms of the Creative Commons Attribution License (CC BY). The use, distribution or reproduction in other forums is permitted, provided the original author(s) and the copyright owner(s) are credited and that the original publication in this journal is cited, in accordance with accepted academic practice. No use, distribution or reproduction is permitted which does not comply with these terms.
*Correspondence: Yanping Liu, MTM3NzY1NzkzMzlAMTYzLmNvbQ==