 José Mauricio Galeana-Pizaña
 Robert H. Manson
- 1Centro de Investigación en Ciencias de Información Geoespacial (CentroGeo), Mexico City, Mexico
- 2Red de Ecología Funcional, Instituto de Ecología, A.C. (INECOL), Xalapa, Mexico
Agroforestry systems, particularly shade coffee farms, offer key ecosystem services such as wildlife habitat, water regulation, and carbon storage. While remote sensing has advanced in detecting land use change from shade coffee to other covers, monitoring subtle shifts from traditional to intensified management remains limited. This study presents a spatial, empirically validated, typology of coffee intensification in eleven coffee-growing regions of southern Mexico. Using k-medians clustering on data from over 178,000 parcels, we classified coffee farms into three levels of intensification—low, medium, and high—based on biophysical, socioeconomic, and livelihood strategy indicators. Field validation with 127 farms showed 76.98% agreement between the Index of Coffee Intensification (ICI) and expert assessments. Significant statistical differences in intensification levels between coffee-growing regions were found using chi-square tests. Overall, 43.1% of farms were low-intensification, 35.2% medium, and 21.7% high. Regions like Costa de Oaxaca and Mixteca had mostly low-intensity systems, while Xicotepec and Cuetzalan showed higher levels of intensification. Highly intensified parcels tended to be larger, used more agrochemicals, and were closer to processing infrastructure, while low-input farms were concentrated in marginalized areas with higher ecological integrity. The ICI showed a moderate but significant correlation with municipal coffee yields (R2 = 0.46), suggesting that intensification affects productivity, but other factors also play a role. Differences in chemical use, commercialization strategies, and infrastructure access highlight the influence of territorial context. These findings reveal a dual structure in Mexico’s coffee landscape and highlight the need for region-specific policy strategies. Unlike deforestation-based monitoring, the ICI offers a new lens to assess ecological change within agroforestry systems, especially in tropical mountain regions, and can help guide the development of more sustainable coffee management policies.
1 Introduction
Coffee production globally is undergoing a rapid transformation driven by environmental, economic, and social factors (Pascucci, 2024). A growing body of research has documented the intensification of coffee systems—defined here as the transition from traditional, shade-grown and diversified agroforestry systems to simplified production models with higher planting densities, increased agrochemical use, and reduced canopy cover (Harvey et al., 2021). However, while these intensified systems aim to maximize short-term yields, they are often associated with trade-offs, including increased exposure to market volatility, climate risk, environmental degradation, and loss of ecological integrity, understood as the capacity of ecosystems to maintain structure, function, and resilience (Lin et al., 2008; Hunt et al., 2020; Jiménez-Ortega et al., 2022).
In contrast, diversified agroforestry systems, characterized by multilayered shade and crop diversity, offer critical ecosystem services, including biodiversity conservation, carbon sequestration, and hydrological regulation (Jha et al., 2011; Cerda et al., 2017; Mokondoko et al., 2022), as well as promoting economic resilience through income diversification and climate buffering (Koutouleas et al., 2022). Recent meta-analyses (Koutouleas et al., 2022; Mokondoko et al., 2022) support previous work (Soto-Pinto et al., 2000) suggesting that moderate-shade coffee systems (35–50% canopy cover) can achieve yields competitive with full-sun monocultures controlling for agrochemical inputs, while simultaneously providing important ecosystem services such as biodiversity conservation, carbon sequestration, and hydrologic ecosystem services. These findings highlight the need for policies that promote diversified coffee systems, recognizing both their environmental and socio-economic benefits. However, ensuring the long-term viability of these systems requires overcoming economic barriers and providing targeted support to smallholder farmers, including access to credit, extension services, and specialized markets for certified coffee (Haggar et al., 2021). Given that coffee is a strategic crop for many rural economies in Latin America—serving as a primary source of income and employment for millions of smallholder farmers (Harvey et al., 2021)—the sustainability of its production systems is crucial. Moreover, many coffee-growing regions overlap with key biodiversity hotspots, making conservation-oriented approaches particularly relevant (Koutouleas et al., 2022).
Global strategies for coffee intensification vary widely. Brazil and Vietnam have consolidated large-scale, full-sun coffee production, while Colombia and Costa Rica have shifted to simplified shaded systems with few tree species (Rice, 1999; Vaast et al., 2015; De Leijster et al., 2021). In contrast, Mexico maintains a long-standing tradition of complex shade-grown systems, influenced by factors such as topography, historical transformations, market access, infrastructure, and the cultural and environmental contexts of each region (Moguel and Toledo, 1999; Toledo and Moguel, 2012). A case study in Oaxaca illustrates how adaptive cycles influence the long-term trajectory of coffee systems, where economic, social, and climatic stressors interact to drive change (Ramírez-León et al., 2024). However, limited access to financing and increasing climate change stressors such as pressure from pests and disease, greater price volatility, and declining yields have led to national programs such as PROCAFE that encourage coffee plant renewals using high-yield disease tolerant varieties that may unintentionally foster the more intensified management practices in key coffee-growing regions (Chort and Öktem, 2024; Jiménez-Ortega et al., 2022; Harvey et al., 2021). Documenting the factors associated with the intensification of coffee production may help predict future trends and develop public policy and market-based strategies that maximize sustainability in the sector.
Large-scale studies of changes in coffee-growing regions have been hampered by difficulties in distinguishing between shade coffee and forest ecosystems (Martínez-Verduzco et al., 2012; Hunt et al., 2020; Escobar-López et al., 2024). Advances in remote sensing, including high-resolution satellite imagery from Sentinel-1, Sentinel-2, Landsat, and LiDAR and other radar sensors, have enhanced the detection of heterogeneous landscapes, overcoming challenges posed by persistent cloud cover and complex topographies, and improved the capacity to distinguish agroforestry coffee systems from forest or other land uses (Hunt et al., 2020; Escobar-López et al., 2024). However, few studies have explicitly focused on distinguishing different levels of coffee intensification (Hwang et al., 2020). This gap highlights the need to incorporate ancillary socioeconomic, environmental, and territorial factors to approximate these levels of intensification. For example, coffee production depends on variables such as altitude, temperature, and geographical conditions, as well as agronomic, genetic, and socioeconomic factors (Aragón-Guzmán et al., 2024). Although numerous studies have integrated multiple factors to identify potential coffee-growing areas (Salas López et al., 2020; Zhang et al., 2021; Nugraha et al., 2021), few have explored methods to differentiate levels of intensification in its production.
Multivariate spatial clustering has emerged as a promising approach for classifying rural systems by integrating biophysical and socioeconomic attributes (Pacini et al., 2014; Beckmann et al., 2022). In agroforestry systems, these methods have been used to develop typologies of coffee agro-ecosystems (Rahn et al., 2018; Volsi et al., 2019). In the context of coffee production in Mexico, applying cluster analysis techniques to differentiate intensification levels could provide insights into the intensification processes in the Mexican coffee sector, including the spatial variability of factors associated with such changes within specific coffee-growing regions. Specifically, the extent to which socioeconomic, environmental, and agricultural programs interact to shape distinct intensification patterns remains unclear. Addressing this knowledge gap is crucial for designing tailored policy interventions that balance productivity with sustainability in the Mexican coffee sector (Escobar-López et al., 2024). This study aims to address this gap by applying spatial clustering techniques to identify coffee intensification gradients across eleven coffee-producing regions in Mexico. We combine remote sensing indicators with socioeconomic and environmental data to explore how intensification varies geographically and what factors drive these differences. We hypothesize that coffee intensification in Mexico is not uniform across regions but follows spatially differentiated patterns shaped by the interaction between biophysical conditions, socioeconomic marginalization, infrastructure access, and commercialization pathways. Specifically, we expect that regions with greater market integration, flatter terrain, and easier access to processing infrastructure will exhibit higher levels of intensification, while remote, marginalized areas with steeper slopes and higher ecological integrity will maintain low-input, traditional agroforestry systems.
2 Review of variables from coffee typologies
Potential variables for modeling coffee intensification (Table 1) were obtained from a review of factors considered in previous typologies describing Mexican coffee production systems. Various studies (Nolasco, 1985; Escamilla Prado et al., 1994; Moguel and Toledo, 1999; Hernández-Martínez et al., 2009; Toledo and Moguel, 2012), emphasize the structural complexity of farm vegetation, considering factors such as species diversity and their interactions within the agroecosystem, tree canopy characteristics (canopy cover and tree height), the degree of agroecosystem intervention (e.g., use of agrochemicals), and market-oriented practices. These structural and management factors are essential in defining the intensification gradient within coffee parcels. In contrast, Escamilla Prado et al. (1994) focus on the socio-economic dimensions of coffee production, highlighting aspects such as crop diversity (species promoted or tolerated within the plot, e.g., fruit trees), production techniques and management practices, the spatial arrangement of plants, and the destination of production. These perspectives have also been corroborated in a recent meta-analysis on coffee management typologies in Latin America (Mokondoko et al., 2022), highlighting the multifaceted nature of coffee agroecosystems. Recent contributions by Herrera Hernández and Zamora Lomelí (2025) further advance this perspective by proposing a complex socio-environmental framework that conceptualizes coffee intensification as an emergent outcome of the interaction between social, natural, and financial capital subsystems. Their study posits that variables such as cooperative organization, forest canopy cover, and market access are not isolated determinants, but rather interdependent dimensions shaping the trajectory of coffee production systems. Likewise, Keys and McConnell (2005) distinguish between innovative intensification—where technical and managerial innovations lead to higher outputs per unit of input—and non-innovative intensification, characterized by increased labor or input use without substantial productivity gains. Together, these frameworks stress that modeling intensification requires attention not only to biophysical and agronomic variables, but also to socio-institutional, technological, and economic processes operating at multiple scales.
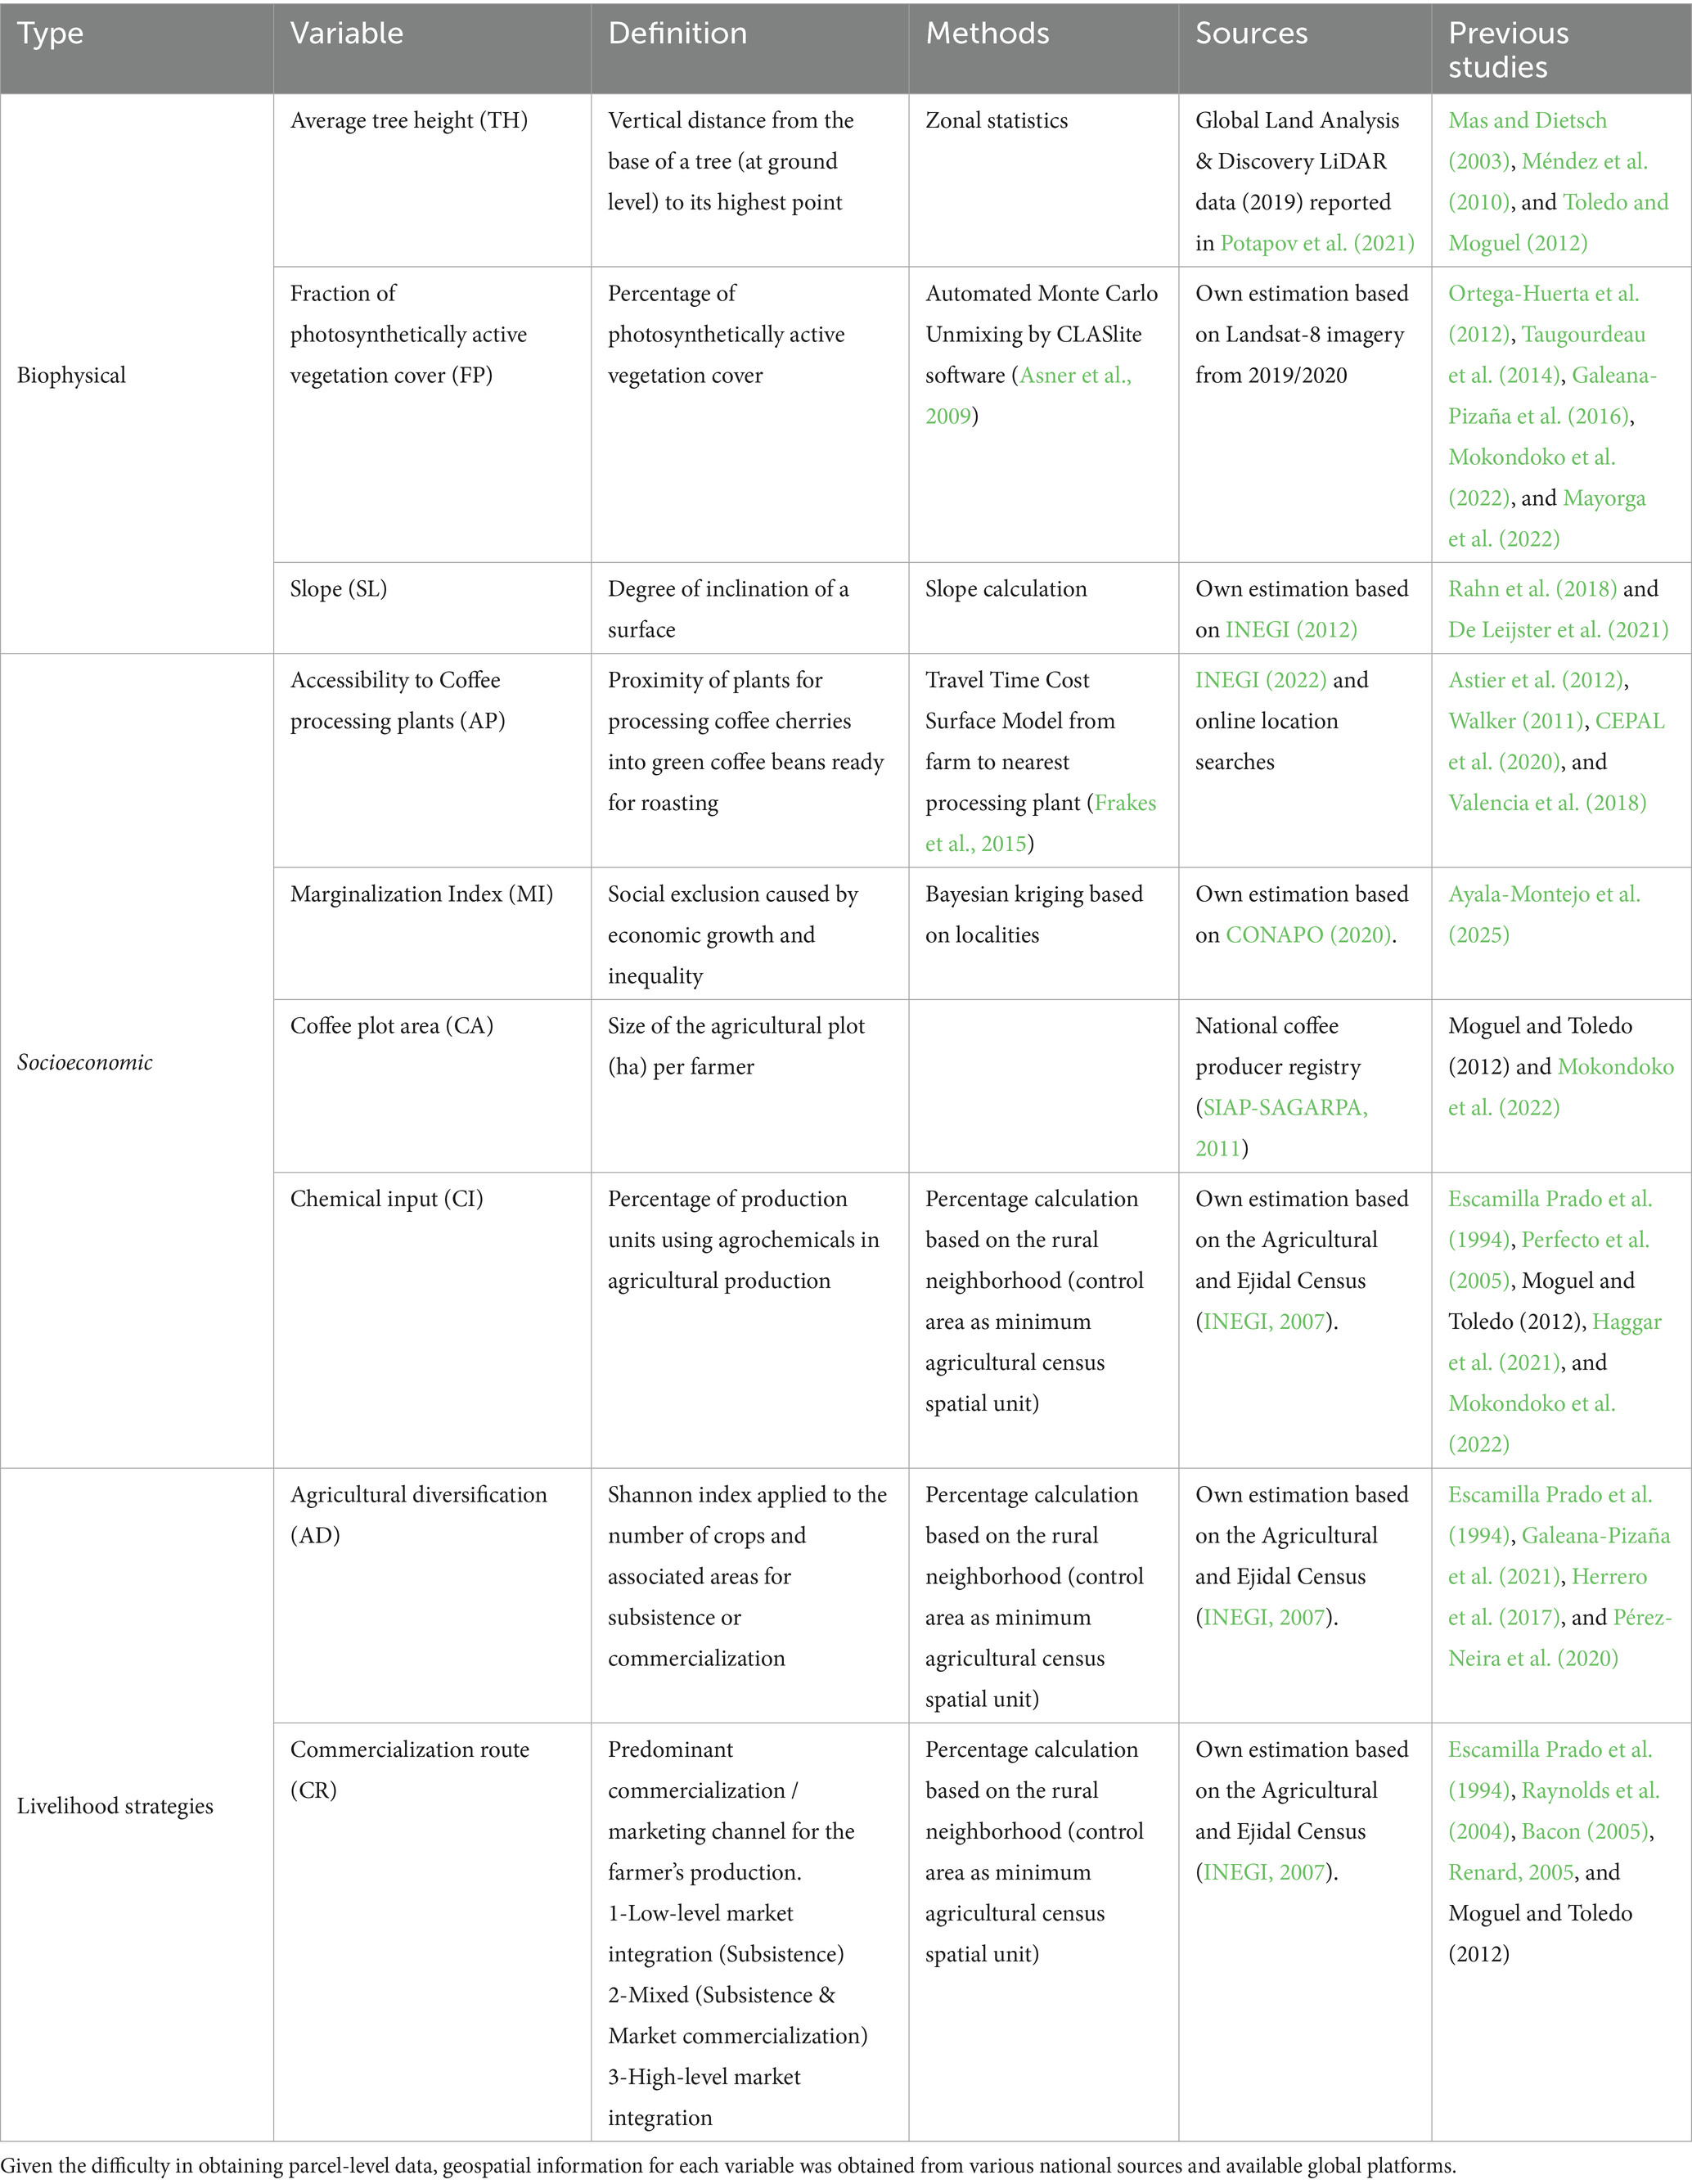
Table 1. Intensification level predictor variables used in this study.
We considered various contextual variables that can play a crucial role in shaping coffee production systems. Slope is a key determinant of both agricultural suitability and ecosystem-based adaptation to climate change, influencing soil retention, water infiltration, and erosion control (Rahn et al., 2018). Research suggests that steeper terrain is often associated with higher levels of ecosystem services, as these areas are less likely to undergo intensive agricultural conversion (De Leijster et al., 2021). The National Population Board’s (CONAPO) Marginalization Index in Mexico describes socio-economic conditions such as poverty and access to services, can also influence the viability of coffee farming and levels of farm intensification. Marginalized areas are often associated with lower intensification and yields and can experience higher rates of coffee abandonment or transformation, leading to shifts in productive diversity and land-use change (Ayala-Montejo et al., 2025). Infrastructure is another determinant of coffee production dynamics, with accessibility to coffee processing plants playing a pivotal role in reducing labor demands and maintaining product quality through streamlined post-harvest processes (Walker, 2011). Evidence from smallholder coffee systems in Latin America suggests that distance to processing facilities significantly shapes producers’ post-harvest decisions. In regions with limited infrastructure and poor accessibility, coffee growers often process their own beans to retain value and adapt to logistical constraints (CEPAL et al., 2020). Conversely, producers located near centralized processing plants tend to sell their coffee in cherry form, leveraging proximity to reduce labor and processing costs (Valencia et al., 2018). These plants are often associated with large coffee trading companies—such as Nestlé or AMSA (Agroindustrias Unidas de México, part of the ECOM group)—that strategically establish themselves in regions with high productive potential, where they actively promote intensification practices to ensure a stable supply, reduce logistical costs, and exert greater control over the value chain. In Chiapas, for instance, Nestlé has deployed its Nescafé Plan strategy through subsidized nurseries, technical assistance, and contractual arrangements with local farmers, promoting high-yield robusta varieties that are more resistant but of lower quality (Renard, 2022; Oviedo-Rodríguez et al., 2024). Henderson (2017) also documents how these corporations have restructured production conditions in southeastern Mexico by forming contractual relations with producers in strategically selected areas. This trend is also documented in studies of organic coffee producers, who, when facing commercialization weaknesses and insufficient support infrastructure, are often compelled to sell unprocessed coffee despite the potential economic benefits of processing it themselves (Astier et al., 2012). Such lost revenue can be compensated by increased yield from higher coffee plant density and lower shade cover associated with more intensified management (Harvey et al., 2021). These findings underline how infrastructural conditions not only influence productivity but also determine the degree and form of intensification in coffee production systems.
Structural characteristics of coffee parcels are also associated with production sustainability and management intensification. Average tree height is a proxy for canopy complexity, affecting microclimatic conditions and biodiversity conservation, and can regulate coffee yield and quality with reduced canopies normally associated with more intensified management (Méndez et al., 2010; Mas and Dietsch, 2003). Similarly, the fraction of photosynthetically active vegetation cover is a critical biophysical variable for evaluating the ecological functionality of coffee agroforestry systems, as it reflects the capacity of canopies to intercept light and support primary production. Taugourdeau et al. (2014) demonstrated a strong relationship between NDVI and fAPAR-derived leaf area index (LAI), showing how changes in canopy structure—driven by management practices such as pruning and shade tree density—directly influence productivity and hydrological services. Likewise, Mayorga et al. (2022) found that increased canopy height and shade cover improve ecosystem resilience and carbon storage, further supporting the value of vegetative cover metrics. Ortega-Huerta et al. (2012) confirmed that spectral differences between open- and closed-canopy coffee systems can be captured remotely, underscoring the utility of vegetation indices like NDVI to detect intensification gradients. Together, these studies validate the use of NDVI and fraction of photosynthetically active vegetation cover as integrated indicators of agroforestry system health, with lower values generally reflecting reduced shade density, increased coffee plant density, and more intensified management.
Use of agrochemicals is another aspect of coffee production positively associated with management intensity. Increased chemical inputs, such as fertilizers and pesticides, often characterize intensified systems and influence not only productivity but also long-term soil health and resilience to climate variability (Perfecto et al., 2005). In coffee agroforestry systems, nitrogen fertilization has been shown to increase yields across different shade levels, though its effectiveness diminishes under high-shade conditions, suggesting a context-dependent impact of chemical intensification (Haggar et al., 2021). Additionally, agricultural diversification tends to decline with intensification, due to simplification of production aimed at maximizing short-term yields. Yet, diversification plays a crucial role in climate change adaptation by enhancing food security, generating alternative income sources, and fostering ecological interactions that support resilient multifunctional landscapes (Galeana-Pizaña et al., 2021; Herrero et al., 2017). Evidence from cacao agroecosystems further supports this view, showing that diversified, organically managed plantations—where agrochemical inputs are reduced—achieve greater energy efficiency and sustainability compared to conventional monocultures (Pérez-Neira et al., 2020).
Lastly, the type of commercialization often reflects the degree of market integration and economic stability within coffee-producing communities, determining whether coffee is sold through conventional supply chains, specialty markets, or local trade networks, each of which has implications for economic sustainability and production strategies (Escamilla Prado et al., 1994). Access to specialty or certified markets—such as Fair Trade—has been shown to provide higher prices to growers, promote more sustainable management strategies not relying on yield maximization, and improve economic resilience and strengthen producer organizations by facilitating capacity-building and collective bargaining (Raynolds et al., 2004). Bacon (2005) found that participation in Fair Trade and organic networks helped reduce the vulnerability of small-scale farmers in Nicaragua during global coffee price crises, although benefits were not uniformly distributed and were contingent on variables such as yield and organizational strength. Meanwhile, Renard (2005) highlights that although quality certifications can empower farmers, they also introduce new forms of regulation and power asymmetries that influence how benefits are distributed along the value chain. These studies suggest that commercialization pathways are closely tied to production strategies, with conventional markets often favoring high-volume, intensive systems and certified markets aligning more with diversified or socially organized farms that can meet quality and traceability standards. Together, these variables provide a comprehensive framework for understanding and describing the socio-ecological drivers of coffee intensification, integrating factors related to biophysical and socioeconomic contexts, and livelihood strategies, to assess their role in shaping coffee production systems.
3 Materials and methods
3.1 Selection of coffee-growing regions
According to data from the Agroalimentary and Fisheries Information Service (SIAP in Spanish) Mexico produced 1,058,862 tons of coffee (SIAP, 2024) in the 2023–2024 harvest cycle within an estimated cultivated area of nearly 564,445 hectares (INEGI, 2023) making Mexico the 13th largest producer worldwide. The states of Chiapas, Veracruz, Puebla, and Oaxaca account for 92% of the coffee produced nationally and include 85% of coffee area and 83% of coffee growers. These states are also among the most significant in Mexico for biodiversity, harboring a wide variety of arthropods, plants, and vertebrates (Llorente and Ocegueda, 2008). Additionally, these states have some of the highest percentages of indigenous language speakers and ethnic diversity in the country (INEGI, 2020), communities that play a crucial role in conserving both biodiversity and agrodiversity in Mexico (Boege, 2021).
Within these states, 11 coffee-growing regions were selected in Chiapas (Altos, Sierra, and Soconusco), Oaxaca (Costa, Mixteca, and Sierra Norte), Puebla (Cuetzalán and Xicotepec), and Veracruz (Coatepec, Huatusco, and Zongolica; Figure 1). These regions include 178,798 coffee parcels occupying 332,139.3 hectares (ha), with an average plot size of 1.85 ha (SIAP, 2024). Since they largely reflect the socioeconomic and biophysical heterogeneity found across the 47 coffee-growing regions of Mexico, these regions are a useful subset for analyzing broader national patterns of coffee cultivation.
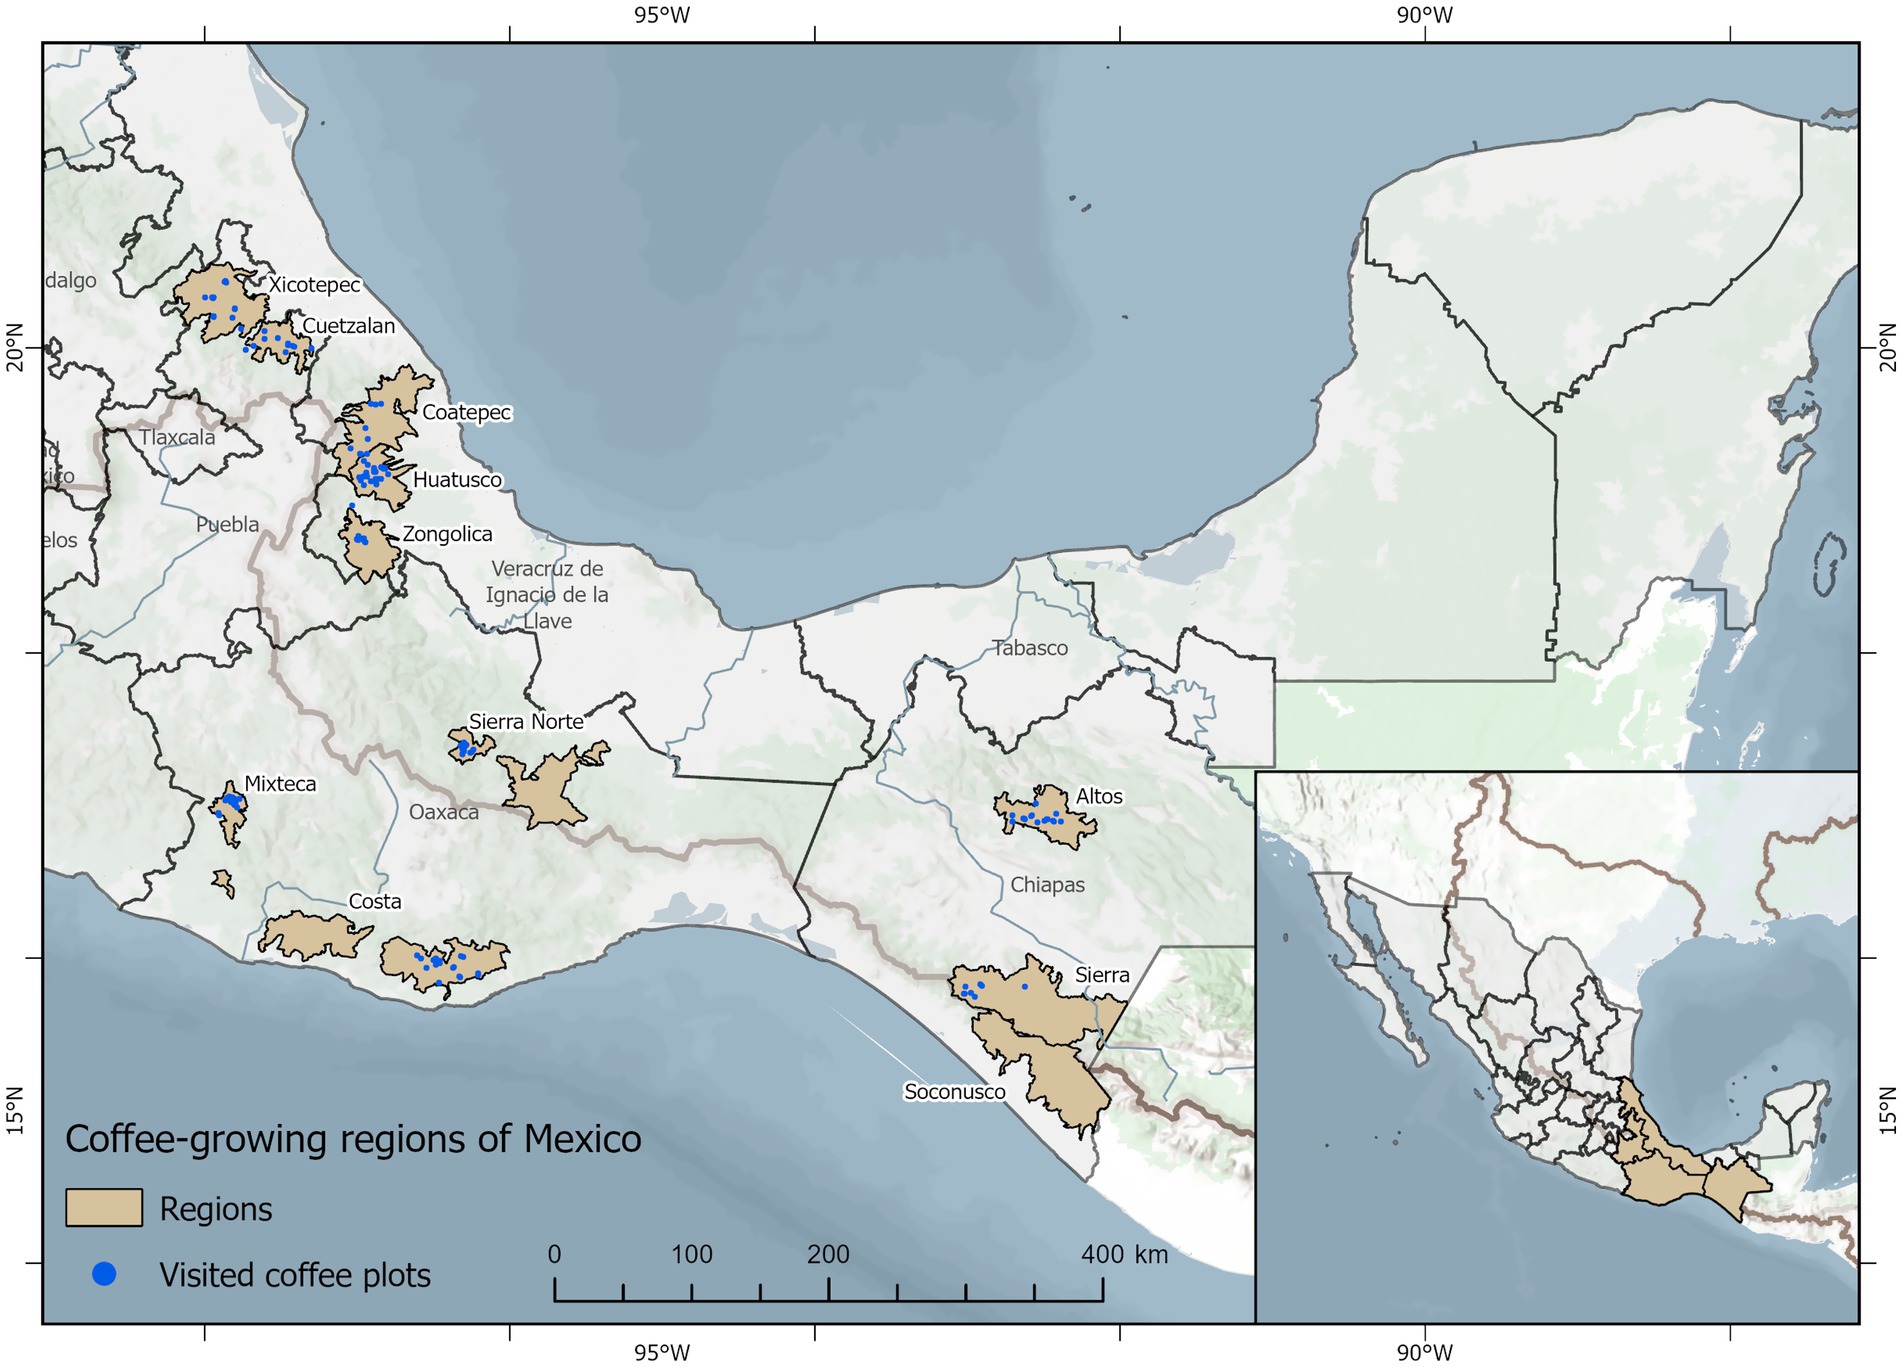
Figure 1. The location of 11 coffee-growing regions in four states (brown) comprising the study area in southern Mexico. Also shown are the coffee farms (blue dots) used to validate models predicting coffee intensification levels in these same regions.
3.2 Analysis
To model spatial patterns of agricultural intensification in the selected coffee-growing regions we first gathered geospatial data on coffee farm locations from the National coffee producer registry (SIAP-SAGARPA, 2011). Next, we conducted a review of existing coffee typologies to identify key biophysical, socioeconomic, and livelihood strategy-related variables for inclusion in the multivariate spatial clustering model. Finally, after running the model using three unsupervised machine learning algorithms, we validated the results using data from a field survey conducted among producers across the 11 coffee-growing regions (Figure 2) as well as federal data on municipal-level coffee yields (in tons per hectare; SIAP, 2020) under the assumption that higher predicted intensification should be reflected in higher actual yields.
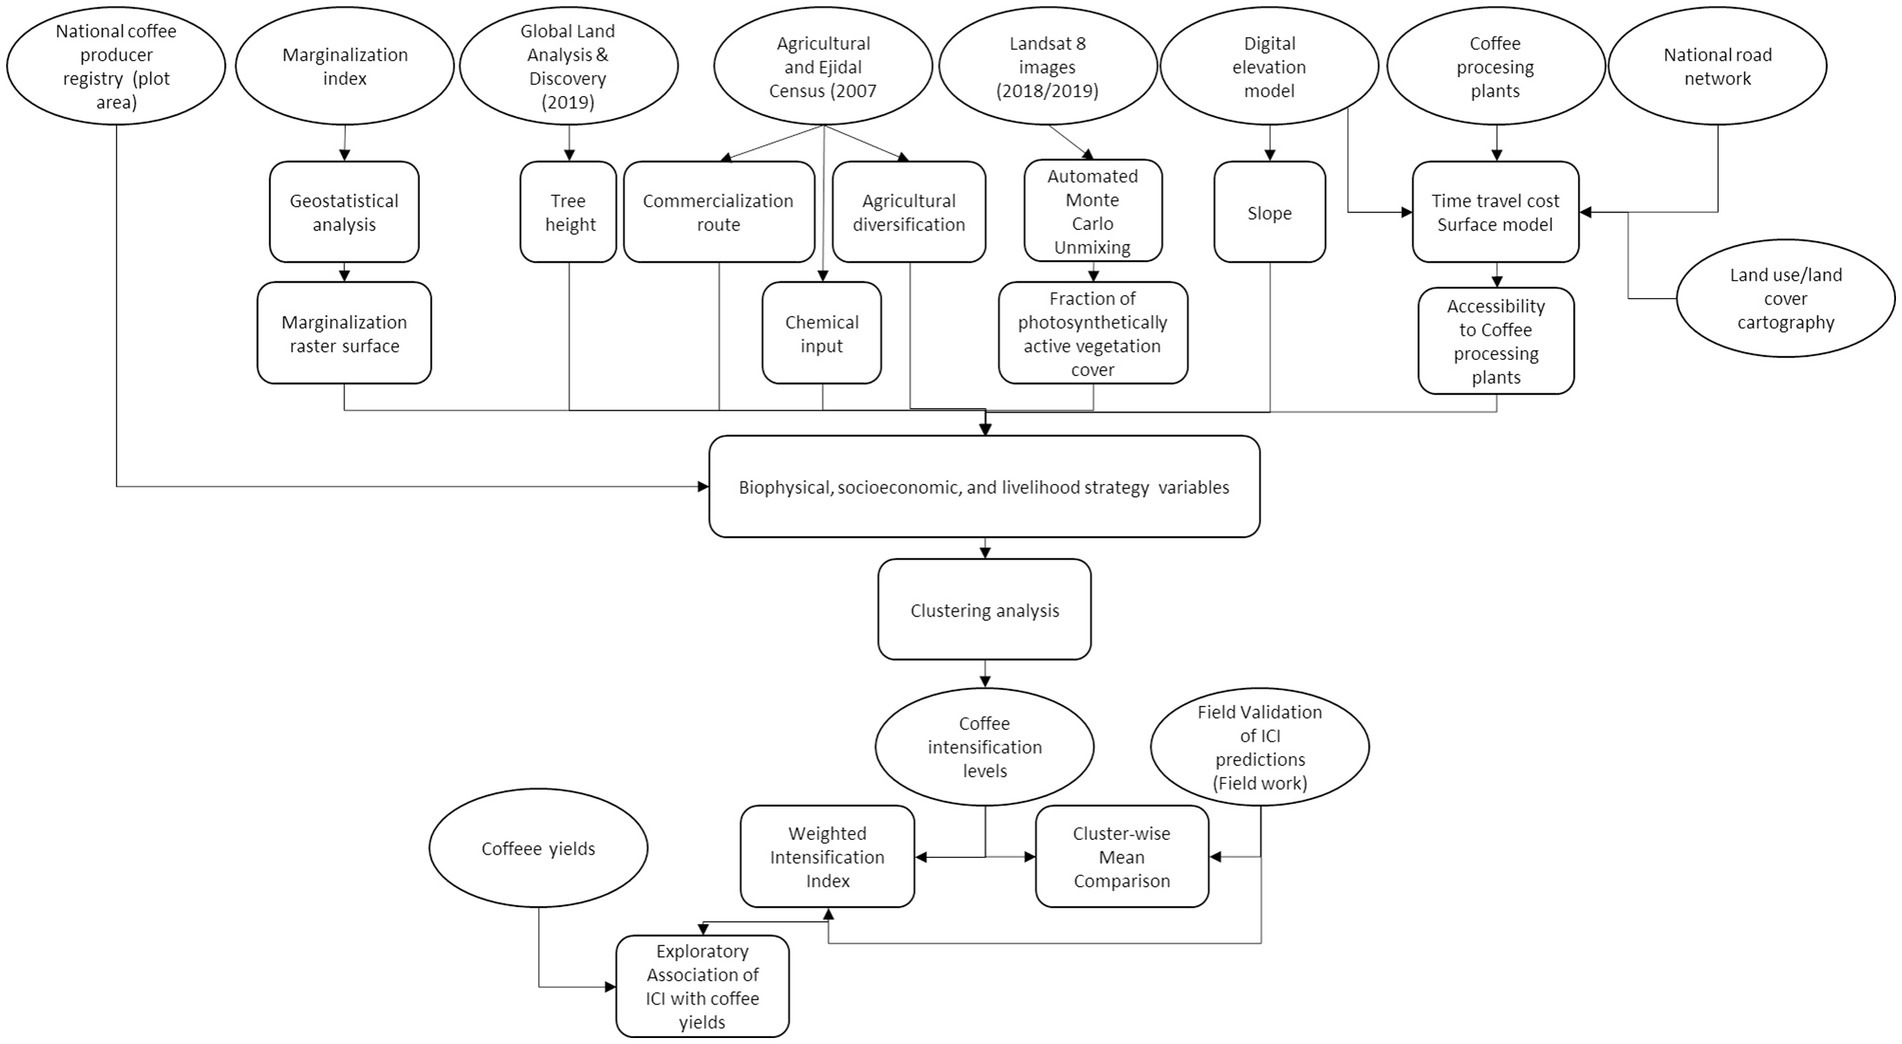
Figure 2. Flow chart illustrating the analysis conducted to document coffee intensification trends.
3.2.1 Clusters analysis
A clustering analysis was applied to identify patterns in the distribution and intensification levels of coffee parcels in Mexico. Three unsupervised machine learning algorithms were utilized and compared across each coffee-growing region: k-means, k-medians, and k-medoids. These algorithms grouped parcels based on spatial and non-spatial attributes, aiming to maximize similarity within clusters and minimize it between them (Yan et al., 2019). Among the three algorithms, k-medians consistently produced the highest proportion of explained variance, and was therefore selected for reporting final clustering outcomes. The k-medians algorithm was also selected for its robustness against outliers and skewed distributions, which are common in spatial agroecological data. The analysis was conducted independently for each region, testing clustering solutions with 2–4 groups. The three-cluster solution was consistently selected as optimal, as it provided a substantial gain in explained variance compared to two clusters, while adding a fourth cluster yielded only marginal improvements. This choice was supported by the elbow method (Ketchen and Shook, 1996), and allowed for a meaningful classification of parcels into low, medium, and high levels of coffee intensification, consistent with existing agroecological typologies (Tittonell, 2014a). We refer to resulting predicted levels of intensification as the Index of Coffee Intensification (ICI). To assess clustering performance, the ratio of the between-cluster sum of squares to the total sum of squares was used—an indicator ranging from 0 to 1 that quantifies the proportion of variance explained by the clustering solution (Everitt et al., 2011). The relative importance of each variable in the clustering outcome was derived from standardized contribution share for each input variable, indicating its contribution to the overall model structure and allowing us to interpret which spatial and non-spatial characteristics most strongly differentiated intensification levels in each coffee region. All variables were standardized using z-score transformation prior to clustering. This ensured comparability across variables with different scales and units, and prevented those with larger numerical ranges from dominating the analysis. The relative contribution of each variable to the clustering solution was computed by analyzing the standardized reduction in within-cluster variance attributable to each variable, averaged across all clusters. This approach allowed us to quantify and compare the influence of each factor describing the biophysical, socioeconomic, and livelihood strategy dimensions on the model outcomes for each region.
3.2.2 Field validation of ICI predictions
To validate predictions of the cluster analysis and the resulting ICI, we used a database from field visits coffee parcels in our study regions between 2022 and 2023 (Figure 1). The original sampling strategy sought to visit 20 farms per region (n = 220), including ten smallholder farms selling conventional coffee, one large-scale farm with intensified management, and eight farms producing differentiated coffee (certified or specialty). However, due to logistical and security issues in Chiapas and Oaxaca, and additional georeferencing problems in some farms, the final number of farms used for validation was reduced to 127 farms. During each visit, technicians collected biophysical measurements of farm structure and management practices, conducted socioeconomic surveys, and recorded information on coffee processing and commercialization. Based on this information and their professional judgment, technicians classified each farm into one of five coffee production types proposed by Hernández-Martínez et al. (2009), which refines previous typologies (Moguel and Toledo, 1999; Toledo and Moguel, 2012) by placing greater emphasis on structural features observable via remote sensing. Each of the five production types was used as a proxy for the level of management intensity across all sampled farms. To assess the correspondence between predicted ICI levels (low, medium, and high) and field-based classifications, we constructed a confusion matrix summarizing matched classifications across regions. To statistically evaluate whether the observed agreement was greater than expected by chance, we applied a chi-square test of independence.
To further test the relationship between predicted ICI values and municipal-level coffee yields (in tons per hectare; SIAP, 2020), we constructed a regional weighted average intensification index. This index assigns weights to the proportion of parcels in each intensification category, with values of 0 for low, 1 for medium, and 2 for high intensification levels, as follows:
The use of ordinal weights reflects the assumption of a progressive increase in management intensity—from traditional low-input agroforestry systems to simplified, input-intensive models. Although this approach implies a linear relationship among categories, it offers a parsimonious and interpretable measure of average regional intensification. These composite scores were then compared to regional coffee yield data for 2020, obtained from the Statistical Yearbook of Agricultural Production at the municipal level, published by SIAP (Ministry of Agriculture). Regional averages were calculated by aggregating yield data from the municipalities comprising each region. A regression analysis was subsequently performed to evaluate the extent to which the ICI can predict actual production levels.
3.2.3 Cluster-wise mean comparison
To statistically evaluate the differences between clusters obtained from the ICI, a Kolmogorov–Smirnov test was applied to check for normality. If the data did not follow a normal distribution, a non-parametric Kruskal-Wallis test was used to detect significant differences between clusters. Post-hoc analysis was conducted using Dunn’s test with Bonferroni correction to identify pairwise differences. This procedure enabled us to assess the internal consistency of the clustering model and its ability to differentiate between levels of coffee intensification.
To assess whether the distribution of coffee intensification levels (low, medium, and high) varied significantly across the eleven study regions, we constructed a contingency table of parcel counts by intensification category and region. We then applied a chi-square test of independence to evaluate whether the observed distributions differed from what would be expected under the assumption of independence. When the overall test indicated significant variation, post-hoc analyses of standardized residuals were used to identify combinations of region-specific variables that contributed most to the association. This approach enabled us to evaluate the role of territorial context in shaping the relative prevalence of intensification levels, thus linking typological outcomes to spatial patterns of management practices.
4 Results
4.1 Model validation
The 127 coffee parcels used to validate the ICI were distributed across ten coffee regions (Table 2). Only Soconusco did not contribute field data due to previously mentioned logistical constraints. Concordance analysis between clustering model and ICI shows an overall agreement of 76.98% (X2 = 71.25, p-value <0.001). The highest levels of concordance were found in Huatusco with 90.48%, followed by Altos, Mixteca, and Sierra, each with 83.33%, and Cuetzalan with 80.00%. Other notable regions include Costa and Sierra Norte, with 76.47 and 75.00%, respectively. In contrast, Xicotepec and Coatepec showed moderate agreement levels, at 70.59 and 66.67%, respectively. The lowest concordance was observed in Zongolica, at only 53.85%, suggesting more frequent discrepancies between the declared and estimated intensity levels in this coffee region.
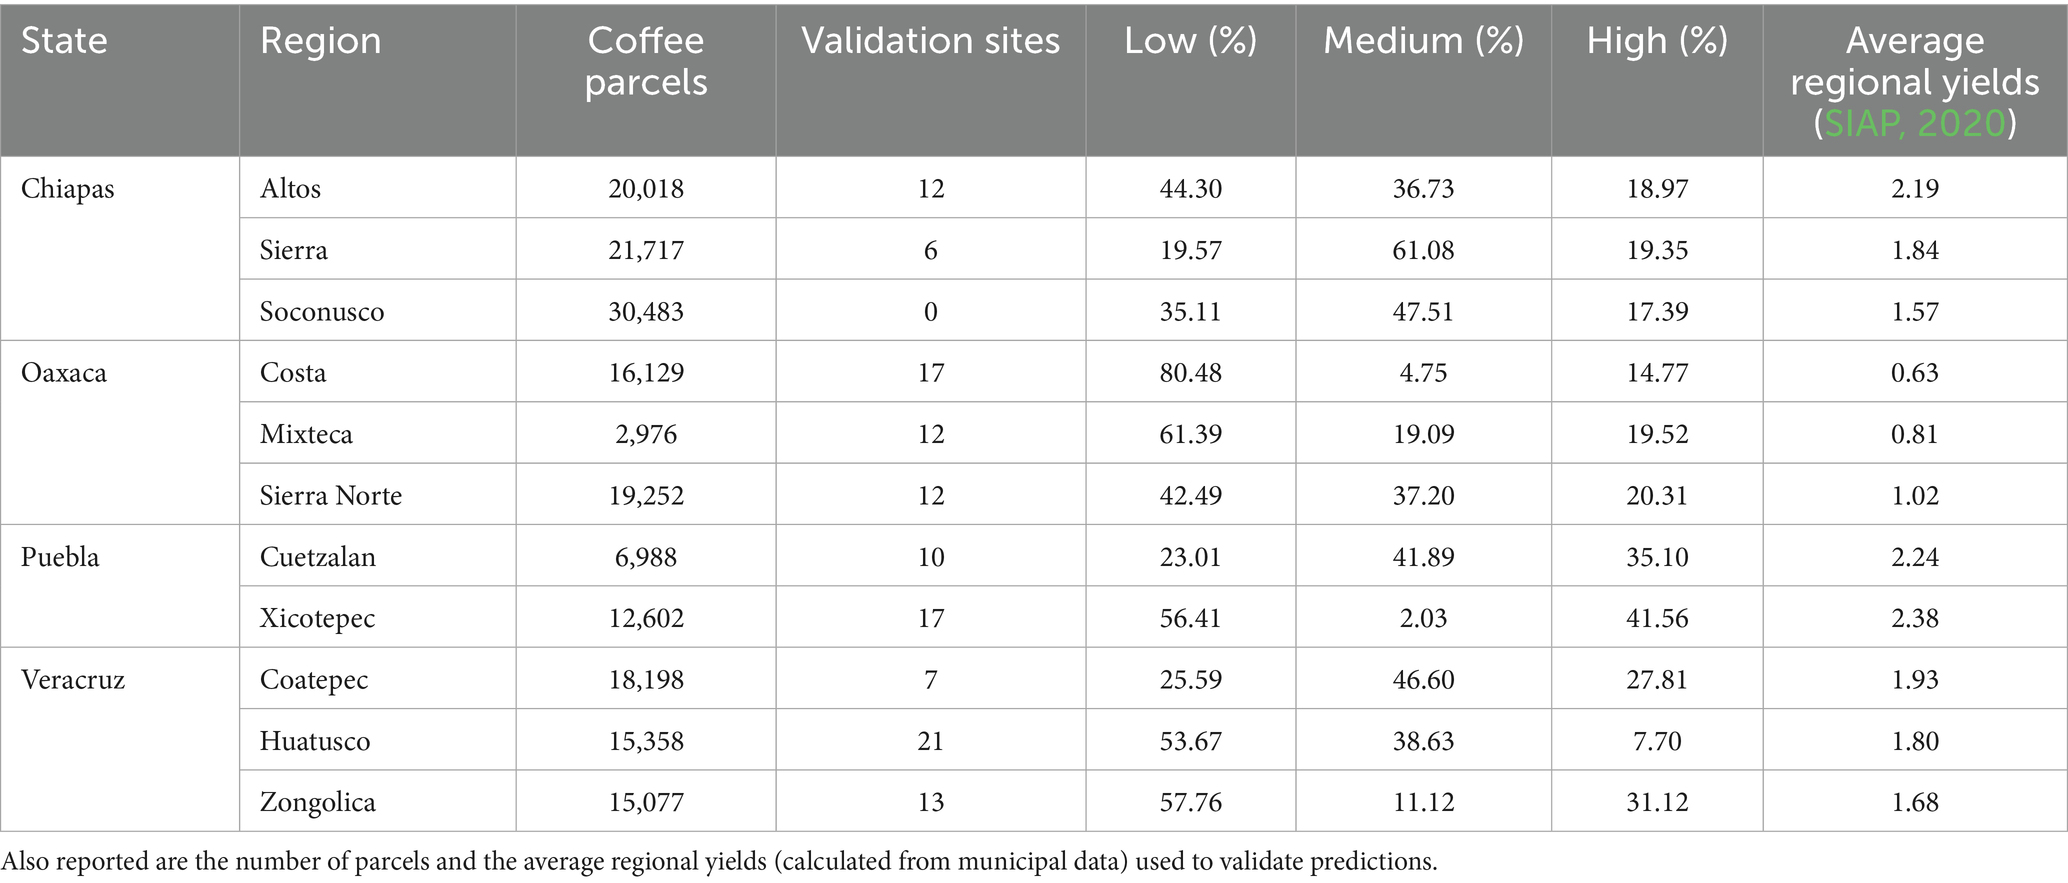
Table 2. Predicted intensification levels reported as the proportion (%) of the total number of coffee parcels in 11 coffee-growing regions in four states in Mexico.
4.2 Relationship between ICI and coffee yields
This spatial heterogeneity in the distribution of predicted intensification levels, obtained from the cluster analysis and contrasted with municipal-scale coffee yields (Figure 3), revealed a positive association with average coffee yields (R2 = 0.46, p-value = 0.02).
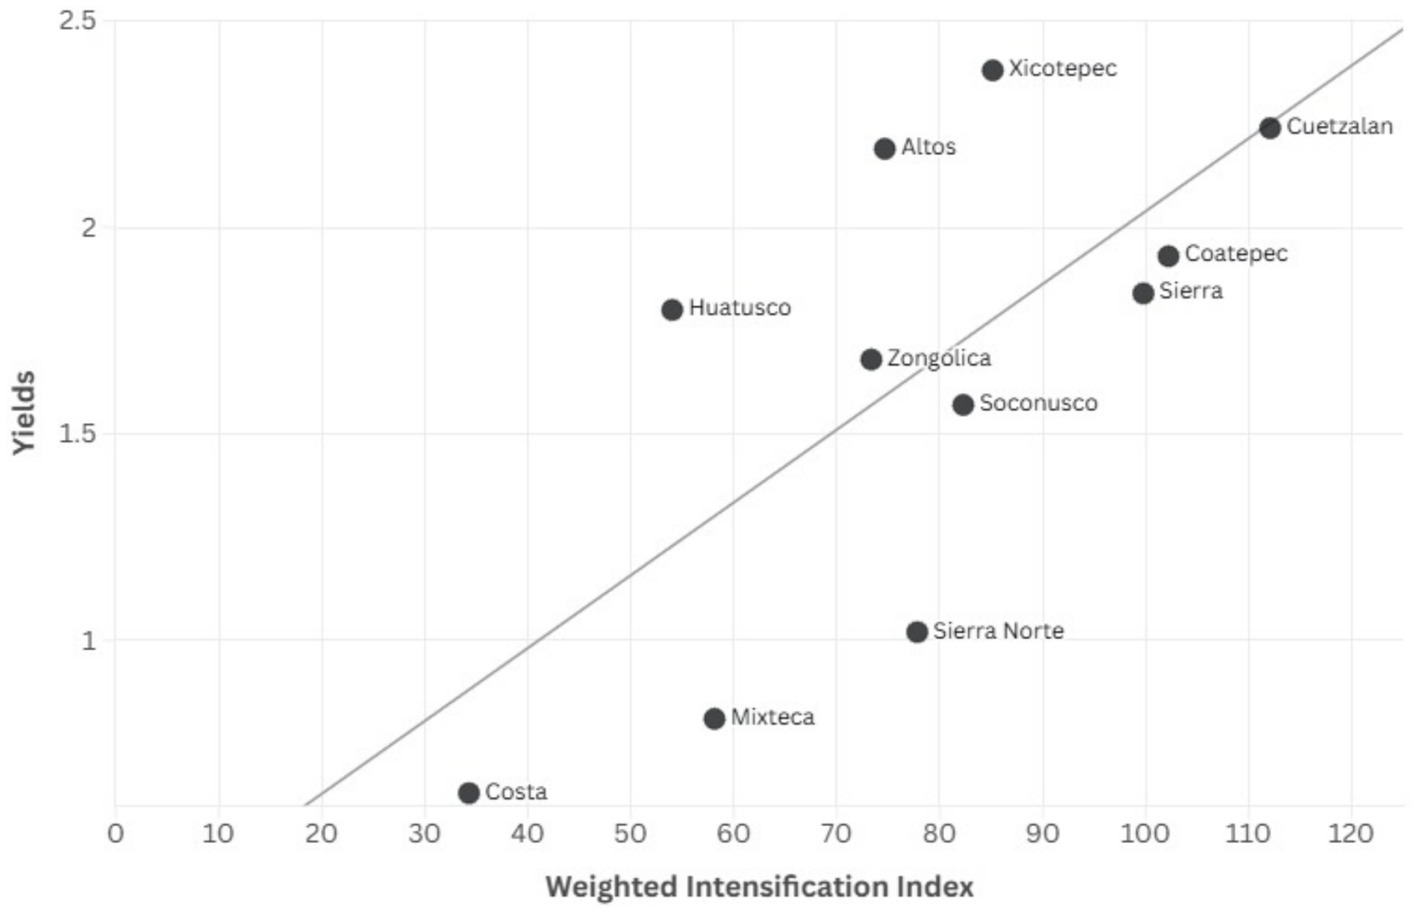
Figure 3. Scatter plot of average yields (tons/hectare) and the weighted intensification index in each coffee region studied. Yields were calculated based on the average of municipalities comprising each coffee region.
4.3 National and regional ICI variation
Out of the 178,798 coffee parcels analyzed in the cluster analysis, 43.1% were classified as having a low level of intensification, while 35.2% were medium, and only 21.7% were categorized as high intensification (Figure 4). By assigning numeric scores to each intensification level (0.33 for low, 0.66 for medium, and 0.99 for high), we calculated a mean intensification index of 0.58 with a standard deviation of 0.25, indicating a moderate overall intensification level across the national coffee landscape with substantial variability among individual parcels. The pattern changed when considering total area, while parcels with low intensification still dominated accounting for 138,412 hectares (41.7%), high intensification parcels covered the next most area with 105,383 (31.7%) hectares followed by 88,343 (26.6%) hectares under intermediate intensification. The contrast between the plot number and total area of coffee parcels suggests that high-intensification systems are generally associated with larger parcel sizes, while low-intensification systems are more numerous but on smaller parcels. These proportions underscore the overall predominance of less intensive management practices in the sector, while also revealing the considerable spatial footprint of highly intensified systems. Together, these findings point to a dual structure in the coffee landscape—one in which extensive, low-input systems coexist with more spatially concentrated, high-intensity production zones.
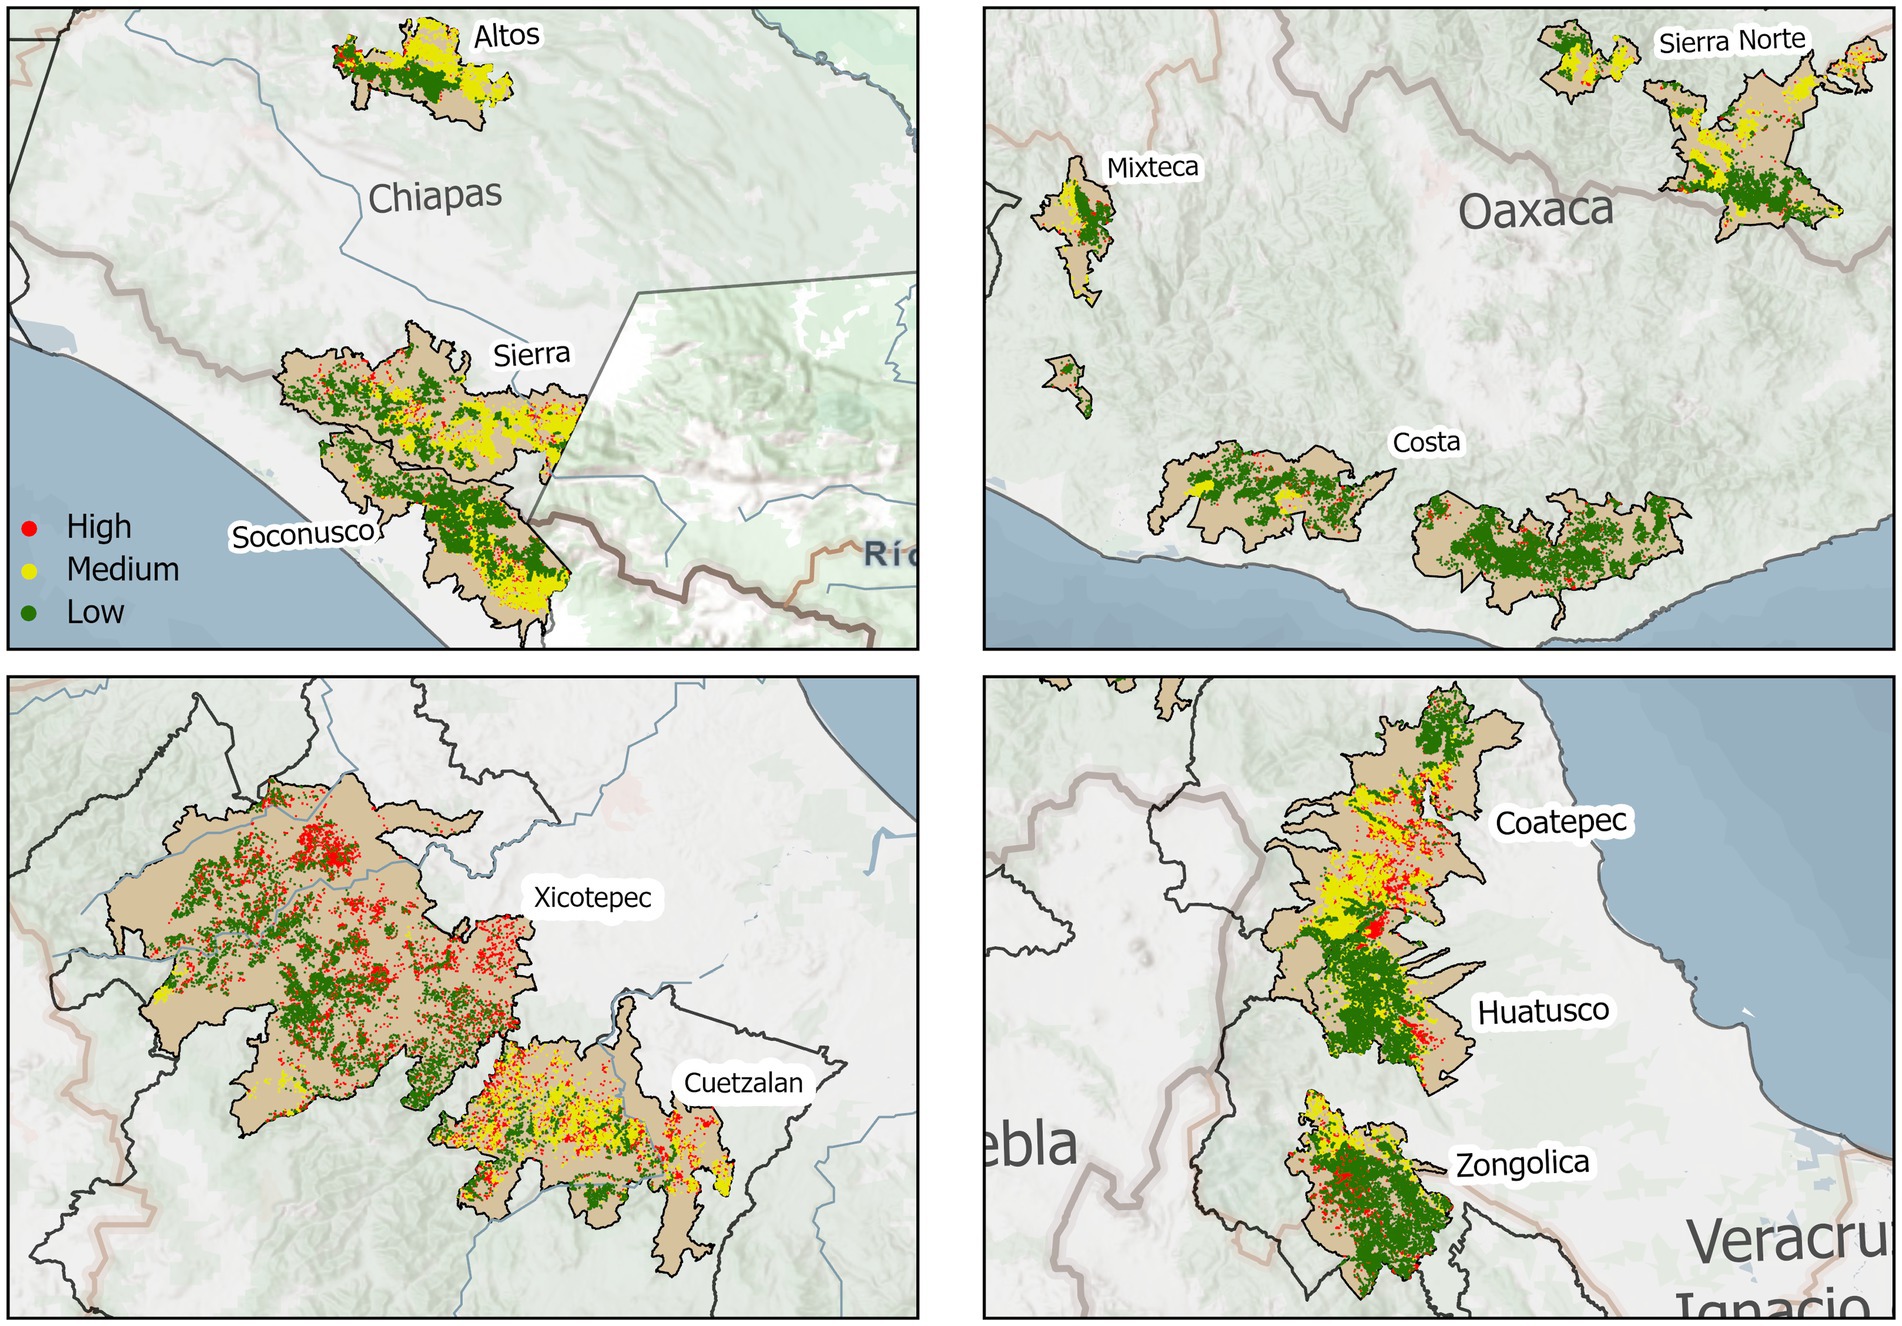
Figure 4. Predicted intensification level of coffee farms in 11 coffee-growing regions in the states of Chiapas, Oaxaca, Puebla, and Veracruz in Mexico.
The distribution of coffee intensification levels varied substantially across the eleven coffee-growing regions analyzed (Table 2). Regions such as Costa and Mixteca exhibited the highest proportions of parcels with low intensification levels, with 80.48 and 61.39%, respectively. In contrast, regions like Xicotepec and Cuetzalan (Puebla), displayed the highest shares of highly intensified parcels, reaching 41.56 and 35.10%, respectively. Notably, Zongolica (Veracruz) exhibited a dual pattern, ranking among the top regions for both low (57.76%) and high (31.12%) intensification levels, suggesting a more heterogeneous distribution of management practices within its coffee landscape. Some regions, including Sierra, Coatepec, and Soconusco, presented a more balanced distribution across the three intensification levels. This variability is closely linked to differences in biophysical, socio-economic, and livelihood strategy-related factors, as summarized in Table 3.
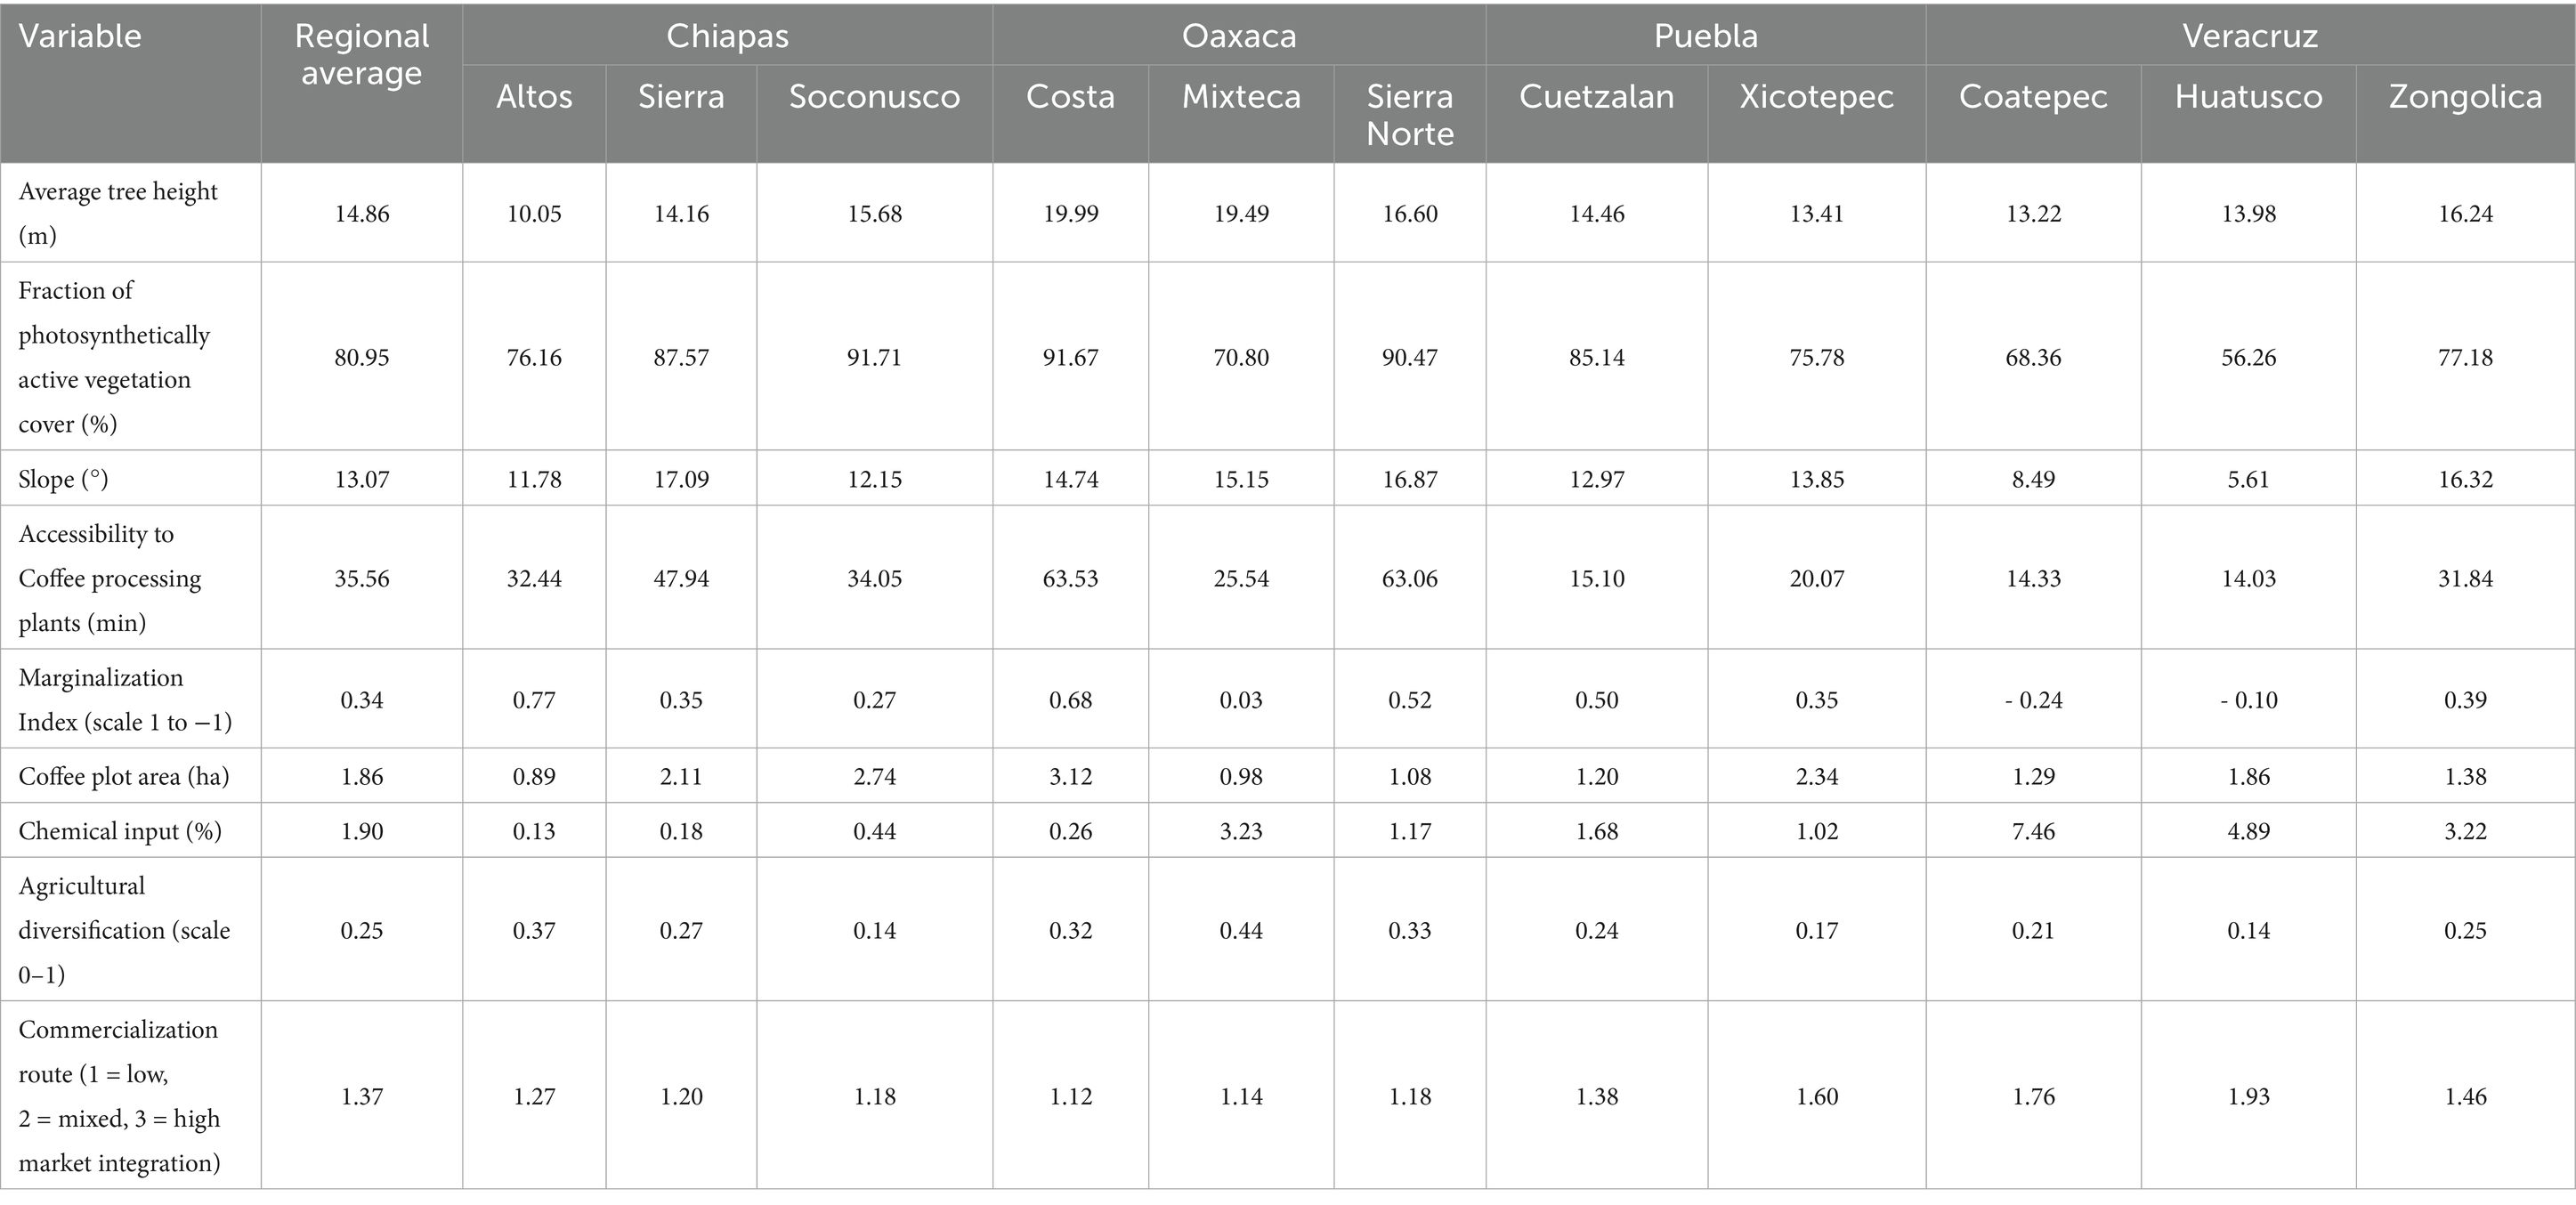
Table 3. Comparative summary of average values of biophysical, socio-economic, and livelihood strategy-related variables in 11 coffee-producing regions in the four states of Mexico included in the study.
4.4 Cluster differentiation and variable contributions
4.4.1 Statistical differences between clusters
A significant deviation from normality (KS = 0.2524, p < 0.001) in the data was detected, justifying the use of non-parametric methods to assess whether the ICI values differed significantly among the three identified intensification clusters (low, medium, and high). A Kruskal-Wallis test revealed statistically significant differences in ICI scores across the clusters (H = 15.0784, p < 0.001). Post-hoc comparisons using Dunn’s test with Bonferroni correction confirmed that the high-intensification group differed significantly from both the low- (mean difference = 0.2436, p < 0.001) and the medium-intensification group (mean difference = 0.1297, p = 0.010). The difference between the low and medium groups was marginally non-significant (mean difference = −0.0897, p = 0.056). The distribution of ICI values across the three clusters is visually represented in Figure 5, which shows distinct median and interquartile ranges for each intensification level.
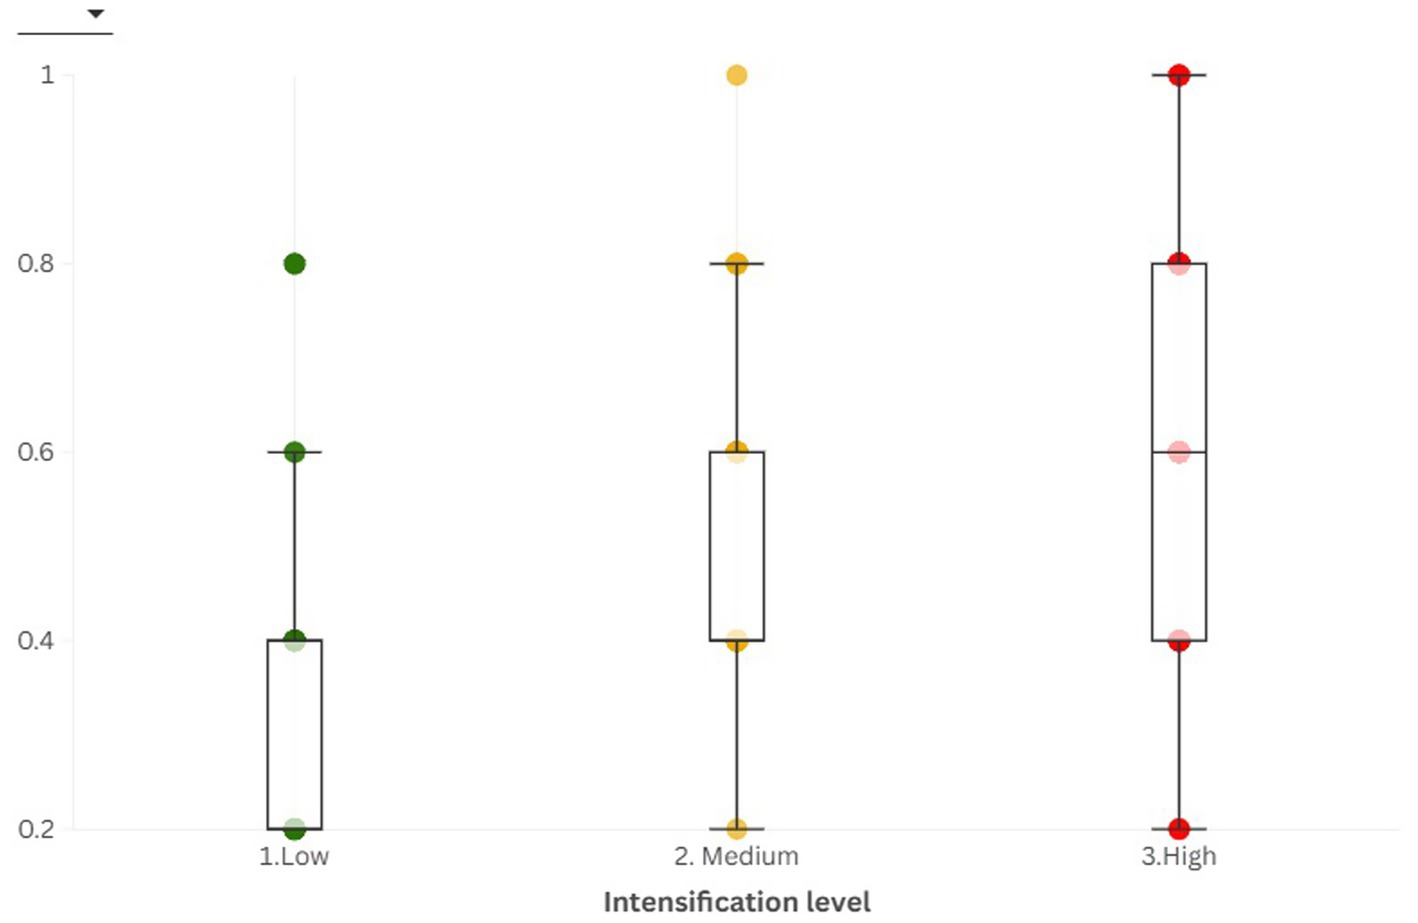
Figure 5. Boxplots of predicted ICI values calculated by field-based typological classification across low, medium, and high intensification clusters.
Chi-square tests of independence based on the number of parcels per intensification level (low, medium, high) in each region revealed a highly significant association (χ2 = 35,466.30, p < 0.001), confirming that the distribution of intensification levels is not homogeneous across the coffee-growing landscape. Standardized residuals from the test provided additional insight into the nature of this association (Table 4). Regions such as Costa, Zongolica, Huatusco, and Mixteca exhibited large positive residuals in the low-intensification category, reflecting a higher-than-expected number of parcels under extensive, traditional management. In contrast, Xicotepec and Cuetzalan showed strong positive residuals in the high-intensification category, suggesting an overrepresentation of intensified systems relative to the national pattern. Most other regions had elevated positive residuals in the medium-intensification category, indicating a prevalence of intermediate management strategies.
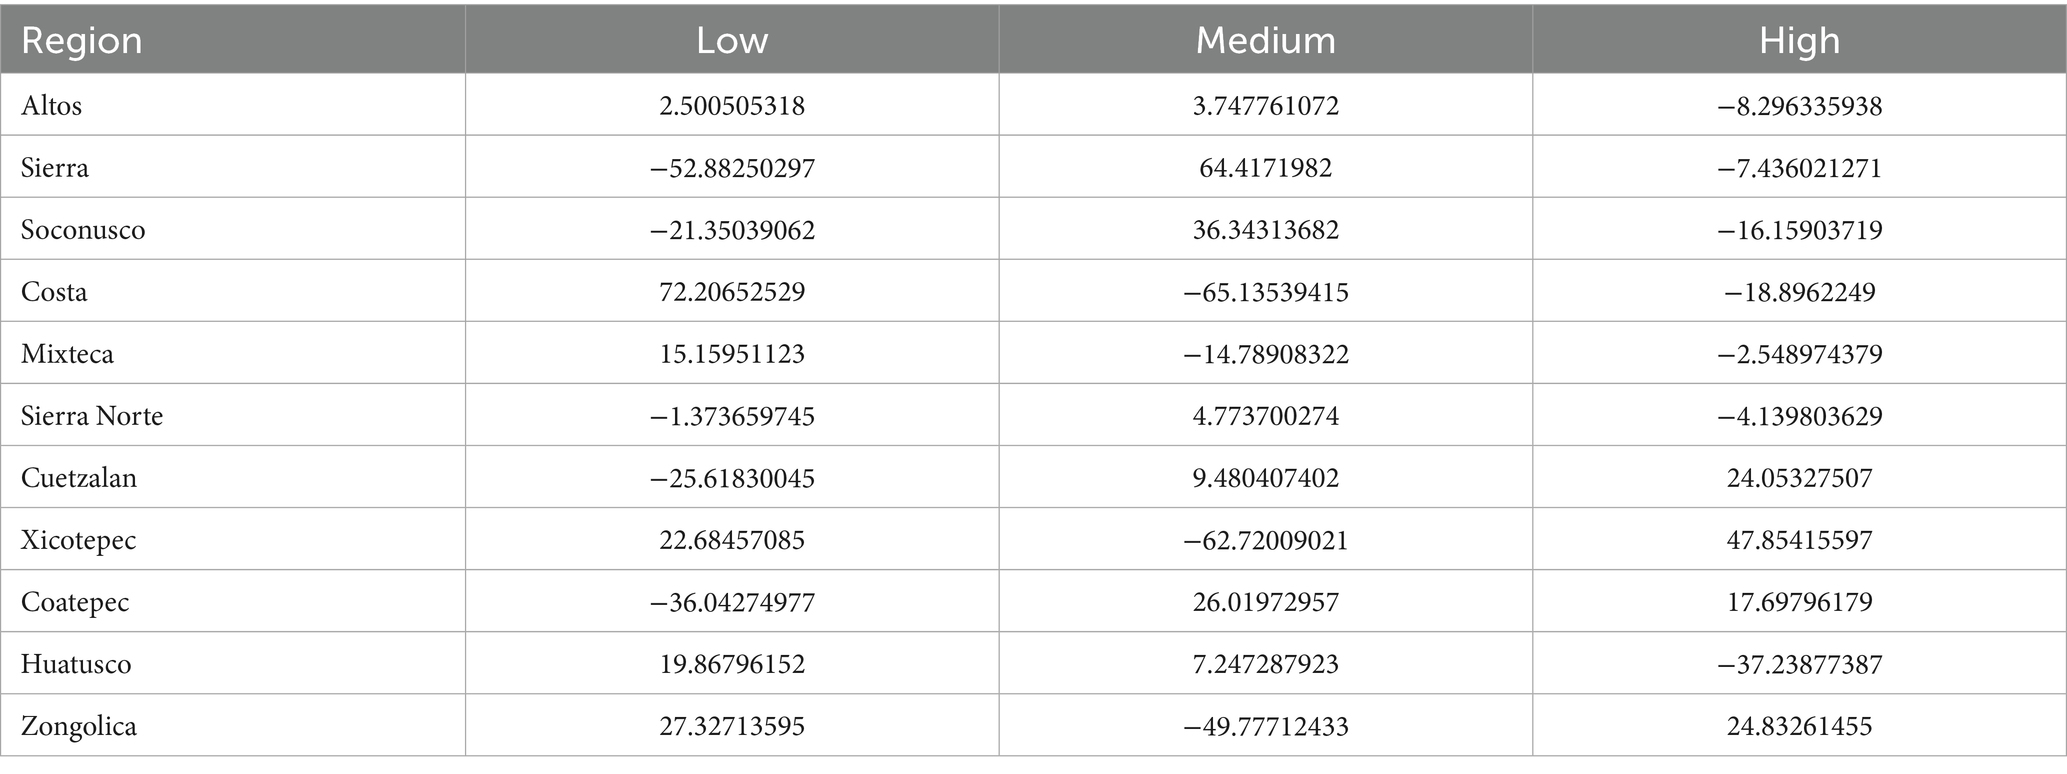
Table 4. Standardized residuals of intensification levels in 11 coffee-growing regions in Mexico.
4.4.2 Contribution of explanatory variables to clustering
Table 5 presents the relative contribution of each explanatory variable to coffee intensification patterns across regions, based on standardized contribution shares derived from the multivariate clustering model. To identify the most influential variables, we ranked them based on two metrics: their average contribution across all regions and the number of regions in which they exceeded a threshold of 0.10. Commercialization Route (CR) emerged as the strongest correlate of intensification, with the highest average contribution (0.26) and significant influence in all 11 regions analyzed. This pattern reinforces the positive association between market orientation and higher intensification levels, particularly notable in Sierra Norte (0.37), Altos and Cuetzalan (0.32), and Soconusco (0.30). The Fraction of Photosynthetically Active Vegetation Cover (FP) followed, with an average contribution of 0.14 and relevance in 10 regions, displaying a consistent negative association with intensification as vegetation cover tends to diminish with more intensive practices. Average Tree Height (TH) and Accessibility to Processing Centers (AP) also showed meaningful contributions, each exceeding the 0.10 threshold in six regions. TH with an average contribution of −0.11 exhibited higher values in Coatepec (−0.17), Xicotepec, Zongolica, and Huatusco (all around −0.15), indicating that reductions in canopy height are associated with more intensified coffee systems. AP, with an average of −0.12, contributed substantially in Altos (−0.28), Sierra (−0.19), and Coatepec (−0.15), suggesting that more accessible areas (shorter travel times) are associated with more intensified systems. Chemical Inputs (CI), in contrast, showed a strong positive average contribution (0.14), particularly in Costa (0.39), Xicotepec (0.36), and Huatusco and Mixteca (0.26), supporting the link between agrochemical use and intensified coffee systems. Slope (SL), with an average negative value of −0.07, was especially relevant in Cuetzalan (−0.19), Soconusco (−0.18), and Coatepec (−0.17), reflecting the limitations of steep terrain for mechanized or intensified production. Less influential were Marginalization Index (MI), Agricultural Diversification (AD), and Coffee Plot Area (CA). MI had a moderate average contribution (−0.08), passing the 0.10 threshold in just three regions. AD was significant in only two regions, with a modest average contribution (−0.05), but consistently showed a negative relationship with intensification. CA exhibited the lowest average (0.02) and exceeded the 0.10 threshold only in Altos (0.13), indicating a limited but directionally stable association.
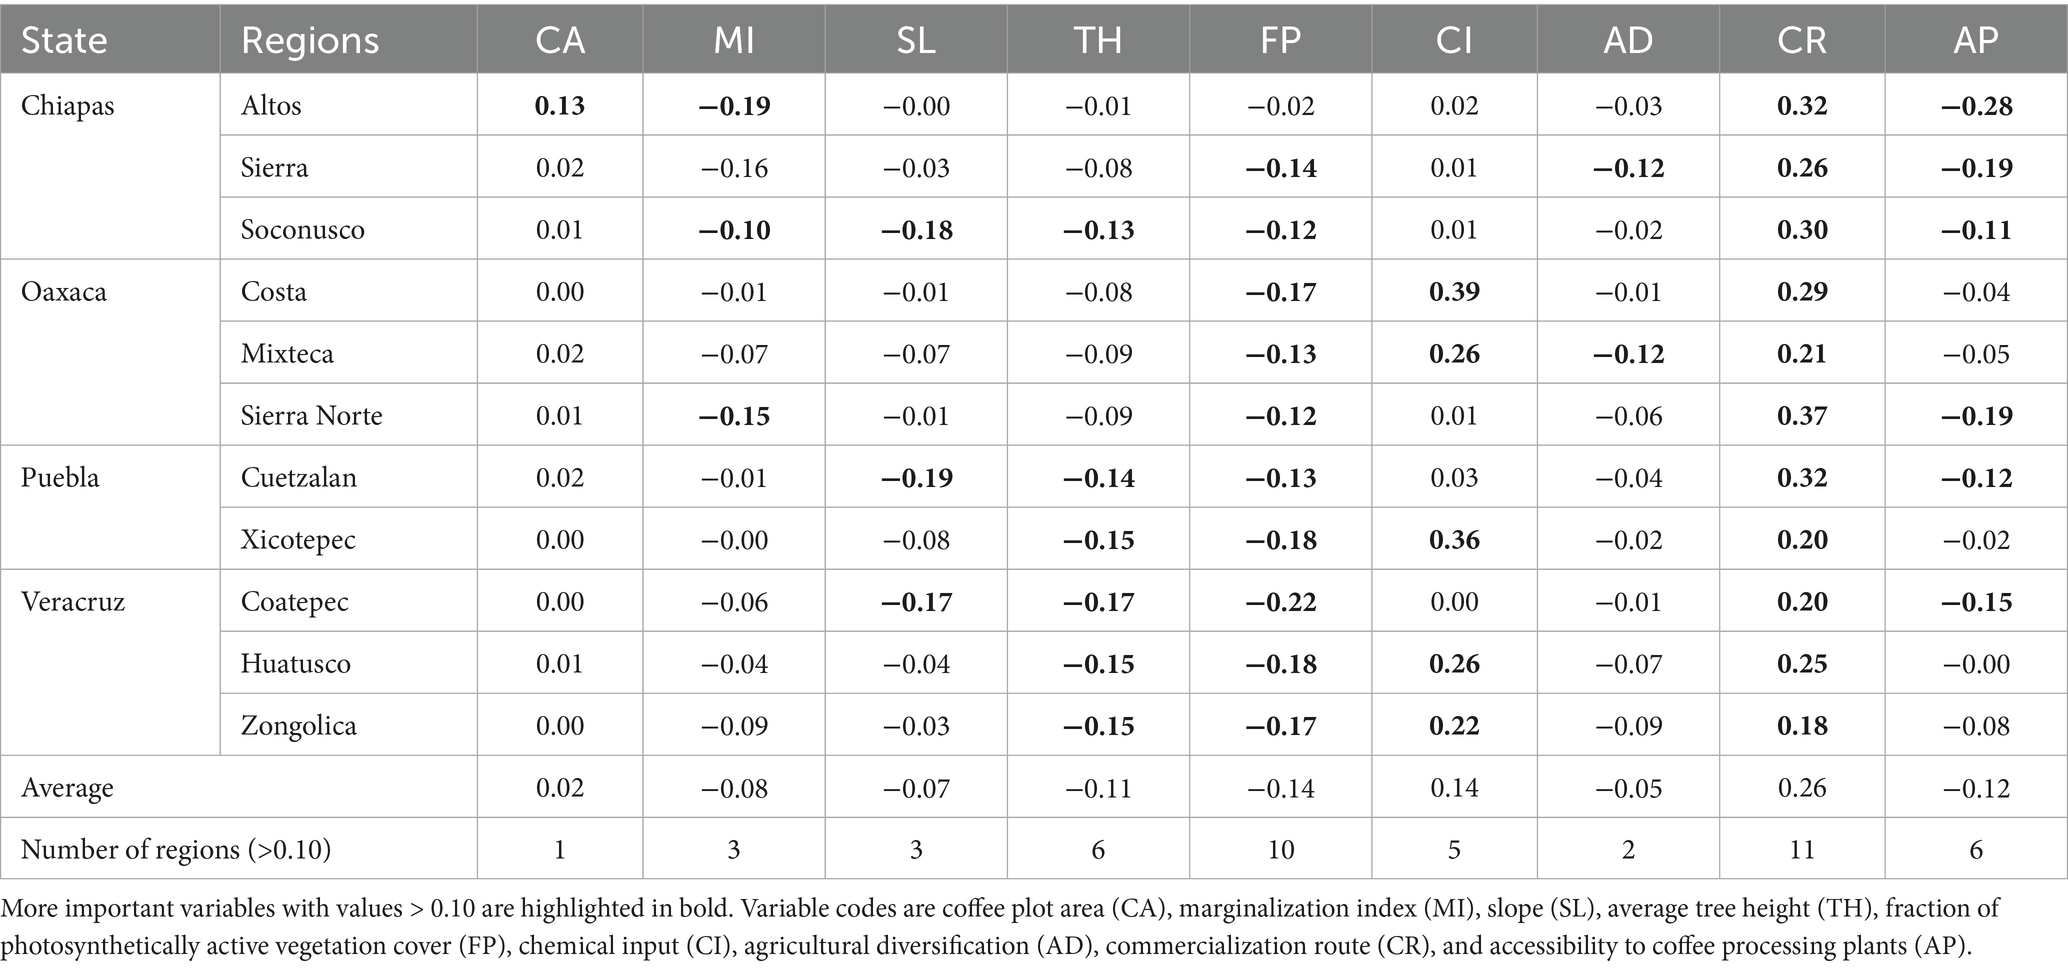
Table 5. Explanatory variable contributions to clustering outcomes in each region as measured by standardized contribution share.
5 Discussion
The significant differences across clusters underscore the ability of the ICI to meaningfully differentiate between different levels of management intensity across Mexico’s coffee-growing landscapes. Additionally, the significant statistical concordance between predicted ICI levels and field-based classifications (overall agreement: 76.98%) and between regional ICI scores and municipal coffee yields (R2 = 0.46) provides empirical support from different data sets of the index’s validity and utility in studying intensification patterns in the coffee sector of Mexico. The ICI aligns with recent efforts in agri-environmental typology construction that aim to generate spatial and scalable tools for territorial stratification and policy targeting (Beckmann et al., 2022; Pacini et al., 2014).
Although nearly 43% of coffee parcels nationwide are classified as low-intensification, the distribution of intensification levels varies markedly across coffee-growing regions, reflecting underlying structural and historical differences. In the Costa region of Oaxaca, low-intensification systems dominate (80.48%), a pattern shaped by dry agroclimatic conditions, steep terrain, and limited infrastructure (Aragón-Guzmán et al., 2024). The prevalence of smallholder producers operating under traditional agroforestry models—often oriented toward differentiated markets such as organic coffee—further reinforces the extensive, low-input nature of production systems in these regions (Ramírez-León et al., 2024). This production profile is not only shaped by agronomic choices but also by broader structural conditions: high levels of marginalization and geographic isolation exacerbate these constraints by limiting producers’ access to technology, credit, and integration into mainstream value chains (Aragón-Guzmán et al., 2024). By contrast, the Xicotepec and Cuetzalan regions (Puebla) exhibit the highest shares of highly intensified parcels (41.56 and 35.10%, respectively). These regions benefit from better market access, improved infrastructure, and distinctive organizational trajectories. In Cuetzalan, indigenous cooperatives like Tosepan have fostered sustainable intensification through agroecological diversification and certification-based value chains (Benítez-García et al., 2015). Meanwhile, Xicotepec’s integration into conventional markets has been shaped by the presence of private firms and external traders promoting input-intensive practices, reduced canopy complexity, and lower shade cover (Tolentino and Vera, 2017).
In Veracruz, institutional legacies have played a central role in shaping production systems. The region of Coatepec, historically the seat of the Mexican Coffee Institute (INMECAFÉ), reflects the lasting influence of mid-20th century state-led modernization programs that promoted shade monocultures and the adoption of technology (Moguel and Toledo, 1999). Today, Coatepec shows a relatively high proportion of intensified parcels (27.81%) and yields above the national average (1.93 t/ha). In contrast, Zongolica displays a dual structure, where both low (57.76%) and high (31.12%) intensification levels coexist—underscoring internal heterogeneity linked to land fragmentation, limited technical assistance, and unequal market access (Briones-Ruíz et al., 2021). Chiapas, Mexico’s leading coffee-producing state, also reveals internal contrasts. In Altos, a predominantly indigenous and marginalized region, low (44.30%) and medium (36.73%) intensification systems prevail. Despite socioeconomic constraints, yields remain relatively high (2.19 t/ha), likely due to favorable ecological conditions (Jarquín Gálvez, 2003). In the Sierra region, large-scale technified states coexist with ejidos managed by smallholder mestizo producers (Martínez-Torres, 2008), resulting in a more balanced distribution across intensification levels.
Across all regions, areas with higher intensification—such as Xicotepec, Cuetzalan, and Coatepec—are consistently associated with greater use of agrochemicals, simplified vegetation structure, and proximity to processing facilities. These patterns align with prior studies (e.g., Haggar et al., 2021; Perfecto et al., 2005) highlighting the ecological trade-offs of input-driven intensification. Conversely, low-intensification regions like Costa and Sierra Norte tend to maintain more complex canopy structures and rely less on chemical inputs—characteristics associated with traditional agroforestry systems. However, these systems are often found in marginalized, hard-to-reach areas where limited institutional support constrains both productivity and adaptation capacity (Astier et al., 2012; CEPAL et al., 2020). These findings resonate with broader historical analyses of agri-food systems, such as Ramírez-León et al. (2024), which show how regions like Oaxaca have followed divergent transformation paths in response to economic, climatic, and institutional shocks—often at the cost of agroecological resilience. The coexistence of intensified and conservative systems thus reflects not only biophysical variation but also deeply rooted political-institutional trajectories (Moguel and Toledo, 1999; Toledo and Moguel, 2012; Harvey et al., 2021).
Regarding explanatory variables, livelihood strategy-related factors emerged as key determinants of intensification. Commercialization route (CR) was among the most influential variables in multiple regions, underscoring the role of market integration in shaping farm-level management (Renard, 2005; Bacon, 2005). Meanwhile, variables such as agricultural diversification showed a negative association with intensification, highlighting trade-offs between productivity and agroecological resilience (Herrero et al., 2017; Pérez-Neira et al., 2020).
Similarly, socioeconomic-related factors such as accessibility to coffee processing plants (shorter travel times) were consistently negatively associated with higher intensification levels, which may reflect the perverse dynamics often driven by large coffee trading companies (Renard, 2022; Oviedo-Rodríguez et al., 2024; Henderson, 2017). A particularly notable finding is the consistent positive relationship between chemical input and intensification across nearly all regions. This reinforces the characterization of intensification as an input-based strategy, raising concerns about long-term environmental sustainability. Recent empirical work also confirms that medium-shade systems under moderate input investment can sustain yields comparable to high-input low-shade systems, suggesting the potential for synergies between intensification and ecosystem service conservation (Haggar et al., 2021). Additionally, Lalani et al. (2024) emphasize that the viability of agroforestry systems is closely linked to long-term profitability. Under certain market and climate scenarios, diversified shaded systems not only provide greater ecological benefits but can also achieve higher net present value (NPV) compared to fully intensified models, particularly when policy and institutional support are aligned with sustainability goals.
Biophysical variables—such as slope, tree height, and fraction of photosynthetically active vegetation cover (FP) —showed a consistent negative association with intensification, confirming that intensified parcels tend to occupy flatter areas with lower canopy density. These patterns mirror previous studies that link reduced shade and structural simplification with intensified coffee management (Mas and Dietsch, 2003; Mokondoko et al., 2022). The FP, derived from remote sensing data, provides a particularly valuable proxy for canopy complexity at scale. However, it is important to acknowledge that such satellite-derived indicators carry inherent uncertainties stemming from sensor resolution, atmospheric conditions, and classification thresholds that may influence their accuracy and contribution to the ICI. Evidence from other tropical settings reinforces the relevance of landscape-scale socioeconomic factors—such as distance to market, household typologies, and land tenure security—in shaping intensification strategies (Mukai, 2024). These considerations highlight that local strategies are embedded in broader territorial and institutional configurations. For instance, Rahn et al. (2018) and Dorsey (2008) show how access to shade, agroclimatic gradients, and commercialization options co-determine sustainable intensification trajectories in East African and Kenyan highlands.
Taken together, these regional differences reinforce the need for territorially differentiated policy approaches. Recognizing and leveraging regional heterogeneity in coffee production systems is essential for designing sustainable programs that can avoid unintended consequences and effectively balance productivity, resilience, and equity in Mexico’s culturally and biologically diverse coffee landscapes. The findings of a recent TEEB AgriFood study of the coffee support sector this argument by documenting how the impacts of different policy scenarios—such as the promotion of high-yield varieties, certification schemes, and agricultural diversification—vary considerably across regions in terms of their effects on natural, social, human, and produced capital (Manson, 2023). Among its findings, the study notes that productivity-oriented programs such as Procafé have led to unintended consequences, including a reduction in shade cover in approximately 10% of coffee parcels. This loss of canopy, while potentially associated with short-term yield gains, could increase the long-term vulnerability of these systems to climate change (Manson, 2023). These findings make it clear that one-size-fits-all policies are unlikely to achieve sustainable outcomes. Instead, public programs must be flexible, multi-dimensional, and co-designed with local actors to align with the unique opportunities and constraints of each coffee-growing territory.
Despite the robust performance of the ICI and its significant associations with yield data, some limitations must be acknowledged. First, the study’s reliance on the somewhat outdated 2007 Agricultural Census stems from delays in the availability of detailed crop-level data from the 2022 edition at the spatial resolution required for this analysis. While this limitation may affect the relevance of some variables, the inclusion of more recent satellite-based indicators and field surveys helps mitigate the risk of data obsolescence. Second, the reduced number of validated parcels (n = 127), below the initial sampling target of 220, reflects financial constraints and logistical difficulties—especially in conflict-prone or inaccessible regions such as Soconusco. Although the overall concordance between predicted ICI values and field classifications remained high (76.98%), the lack of validation data in this region may limit the generalizability of findings. Future research should prioritize expanded field sampling and leverage new rounds of agricultural census data to strengthen model calibration and enhance the representativeness of the typology across Mexico’s diverse coffee landscapes. Third, the moderate correlation between regional ICI scores and average municipal yields (R2 = 0.46) warrants further reflection. While a stronger relationship might be expected under a strictly input–output production logic, we believe this result highlights the multifactorial nature of coffee productivity, which is also shaped by variables not explicitly captured in the ICI—such as microclimatic conditions, pest and disease pressure, the type of coffee (arabica versus robusta), soil fertility, and labor dynamics. Additionally, temporal inconsistencies among data sources may have attenuated the observed relationships. For instance, some structural covariates (e.g., parcel size, accessibility, diversification) derive from the 2007 Agricultural Census, while satellite-based indicators and yield data correspond to 2020, potentially introducing lags in system dynamics that affect the strength of correlations. The fact that our correlation was statistically significant (p = 0.02) despite the statistical noise generated by these issues highlights the potential utility of the ICI to help explain patterns of municipal-level coffee intensification in México, but also the need that such information be explicitly included in future versions of this index.
While significant, the ICI was not capable of explaining all the variation in regional intensification or yields, thus reinforcing the notion that broader institutional and infrastructural contexts mediate outcomes. This aligns with findings from Brazil, where transformations in the spatial distribution of coffee systems have been shaped not only by climatic suitability but also by the erosion or emergence of supportive policy environments and market structures (Volsi et al., 2019). Moreover, the regional specificity of variable contributions echoes similar typology work in Africa and Latin America, which emphasizes that cluster-based classifications gain explanatory power when anchored in localized knowledge and territorial dynamics (Rahn et al., 2018; Pacini et al., 2014).
The relative weights of explanatory variables, suggest that commercialization route (CR) exerts a disproportionate influence in the clustering model. While this may be a problem of overfitting, we believe this pattern could also reflect structural asymmetries in value chain integration across coffee regions, where market access functions as a key enabler—or barrier—to intensified practices. Nonetheless, this variables prominence could bias the typology toward market-driven intensification models. Future refinements should explore adjusted weighting schemes or dimensional balancing techniques to better integrate ecological, structural, and economic factors in a more harmonized manner. Complementary qualitative approaches may also help contextualize outliers and illuminate the social and institutional drivers underlying intensification trajectories.
While the k-medians clustering approach performed robustly, it offers only a static representation of current intensification patterns. This limitation underscores the need to incorporate a temporal dimension in future analyses, as coffee intensification is a dynamic process shaped by shifting socio-economic, political, and ecological conditions (Tittonell, 2014b). Longitudinal assessments would not only allow for the identification of transitions across intensification trajectories, but also help detect critical inflection points and underlying drivers of change in production systems (Kassie et al., 2015). Moreover, integrating alternative unsupervised learning methods—such as hierarchical clustering or latent profile analysis—could enhance both the explanatory power and internal consistency of the typology (Rahn et al., 2018), particularly if applied to time-series data that capture the evolving nature of coffee production landscapes.
Beyond methodological refinements, there is a critical need to integrate producer perspectives and decision-making rationales through mixed-methods approaches, including qualitative interviews or agent-based modeling, to better capture the social dynamics that shape intensification strategies. In line with Mokondoko et al. (2022), emerging evidence indicates that the relationships among shade cover, fertilization, and yield vary substantially across regions, reinforcing the need for localized agroecological measurements that reflect diverse biophysical and management conditions. The use of quantitative intensity indices—such as those proposed by Mas and Dietsch (2003) and Hernández-Martínez et al. (2009)—provides a complementary and scalable framework to typological classifications, improving cross-regional comparisons. Furthermore, as shown by Meneses-R and Armbrecht (2018), these indices offer a valuable tool to evaluate structural vegetation changes and conservation potential in fragmented coffee landscapes. Incorporating bioeconomic feedbacks is also essential, as demonstrated by Ayala-Montejo et al. (2025), who found that socioeconomic capacity—including investment, education, and market diversity—is critical to maintaining carbon and nitrogen stocks in diversified agroforestry systems such as coffee–avocado. Together, these insights underscore the importance of developing multidimensional and locally grounded typologies that integrate biophysical, socioeconomic, and livelihood strategy dimensions to better inform sustainable intensification pathways. They also highlight the urgent need for more governmental support in long-term monitoring of the coffee sector through constant updates of the National Registry of Coffee Growers and greater frequency and consistency of survey questions in the National Agriculture Census.
In summary, this study provides an empirically validated spatial typology of coffee intensification in Mexico, capable of capturing regional heterogeneity and informing targeted policy design. Despite some limitations—including the absence of a formal uncertainty analysis for remote sensing-derived variables—the Index of Coffee Intensification (ICI) demonstrates strong internal consistency and external validity. Future adaptations of the ICI could benefit from integrating probabilistic modeling or bootstrapped clustering approaches to better quantify classification uncertainty. Moreover, the methodological framework developed here is potentially transferable to other contexts, particularly in regions where perennial agroecosystems intersect with diverse biophysical, socioeconomic, and livelihood strategy landscapes. As such, this typology contributes not only to a better understanding of intensification dynamics in Mexico but also offers a scalable tool for sustainable land management planning in the broader Latin American coffee belt and beyond.
6 Conclusion
This study presents a spatial and empirically validated typology of coffee intensification across eleven key producing regions in Mexico. By integrating biophysical, socioeconomic, and livelihood strategy-related variables through a multivariate clustering approach, we developed and validated an index of coffee intensification capable of identifying three distinct intensification levels—low, medium, and high—that revealed a dual structure in the Mexican coffee landscape. While low-intensification systems remain predominant in number, high-intensification parcels occupy a substantial share of the total area and are often associated with larger parcel sizes and higher municipal yields. Regional variation was pronounced, reflecting the influence of agroecological conditions, infrastructure, market access, and institutional histories. Notably, highly intensified regions consistently showed increased chemical input use and simplified vegetation structure, whereas traditional agroforestry systems—though less productive—maintained greater ecological functionality and prevailed in marginalized areas with limited infrastructure.
These findings underscore the need for territorially differentiated policy strategies that recognize and leverage regional heterogeneity in coffee production systems, avoiding one-size-fits-all approaches that are unlikely to succeed in balancing productivity, environmental resilience, and equity in different territorial contexts. Instead, sustainable intensification will require flexible, multi-dimensional, and co-designed public programs aligned with local capacities, constraints, and market conditions. Moreover, the strong association between commercialization routes, accessibility to infrastructure, and intensification pathways reveals the need to critically evaluate the role of value chain governance and corporate-led interventions in shaping production dynamics.
Complementary frameworks such as quantitative management intensity indices (Mas and Dietsch, 2003; Hernández-Martínez et al., 2009) and biodiversity-based tools (Meneses-R and Armbrecht, 2018) can improve cross-regional comparability. Recent work by Ayala-Montejo et al. (2025) also emphasizes the role of socioeconomic capacity—investment, education, and market diversity—in sustaining biogeochemical cycles in diversified systems. Remote sensing approaches using NDVI, NBR, or LAI (Ortega-Huerta et al., 2012; Taugourdeau et al., 2014; Hwang et al., 2020) offer scalable, cost-effective monitoring of intensification dynamics. The combination of optical and radar data from Sentinel-1 and 2 and object-based image analysis has also proven promising for distinguishing intensification levels (Hunt et al., 2020). Lastly, considering the critical role of commercialization routes and infrastructure revealed in this study, future research should explore how value chain governance and national programs like Producción para el Bienestar or Sembrando Vida interact with regional intensification trajectories to inform sustainable and equitable policies.
Data availability statement
The raw data supporting the conclusions of this article will be made available by the authors, without undue reservation.
Author contributions
JG-P: Writing – original draft, Visualization, Formal analysis, Conceptualization, Validation, Methodology, Investigation. RM: Project administration, Funding acquisition, Visualization, Resources, Supervision, Conceptualization, Writing – review & editing, Investigation.
Funding
The author(s) declare that financial support was received for the research and/or publication of this article. Funding for this research was provided by the European Union through UNEP’s TEEB AgrifFood initiative.
Acknowledgments
This research was conducted as part of the project “Integrated evaluation of the expected changes in ecosystem services, biodiversity and livelihoods under different land use change scenarios in the main coffee-growing territories of Mexico” using the Economics of Ecosystems and Biodiversity in Agriculture (TEEB AgriFood) methodology of the UN with the support of the European Union.
Conflict of interest
The authors declare that the research was conducted in the absence of any commercial or financial relationships that could be construed as a potential conflict of interest.
The author(s) declared that they were an editorial board member of Frontiers, at the time of submission. This had no impact on the peer review process and the final decision.
Generative AI statement
The author(s) declare that no Gen AI was used in the creation of this manuscript.
Publisher’s note
All claims expressed in this article are solely those of the authors and do not necessarily represent those of their affiliated organizations, or those of the publisher, the editors and the reviewers. Any product that may be evaluated in this article, or claim that may be made by its manufacturer, is not guaranteed or endorsed by the publisher.
References
Aragón-Guzmán, S. E., Regino-Maldonado, J., Vásquez-López, A., Toledo-López, A., Jurado-Celis, S. N., Granados-Echegoyen, C. A., et al. (2024). A systematic literature review on environmental, agronomic, and socioeconomic factors for the integration of small-scale coffee producers into specialized markets in Oaxaca, Mexico. Front. Sustain. Food Syst. 8:1386956. doi: 10.3389/fsufs.2024.1386956
Asner, G. P., Knapp, D. E., Balaji, A., and Paez-Acosta, G. (2009). Automated mapping of tropical deforestation and forest degradation: CLASlite. J. Appl. Remote. Sens. 3:033543. doi: 10.1117/1.3223675
Astier, M., García-Barrios, L., Galván-Miyoshi, Y., González-Esquivel, C. E., and Masera, O. R. (2012) Assessing the sustainability of small farmer natural resource management systems: a critical analysis of the MESMIS program (1995–2010). Ecol. Soc., 17. Available online at: https://www.jstor.org/stable/26269075
Ayala-Montejo, D., Martínez-Zurimendi, P., Gallardo-Lancho, J. F., Sánchez-Hernández, R., Valdés-Velarde, E., Santiago-Vera, T. D. J., et al. (2025). Agronomic management, socioeconomic factors, and carbon and nitrogen pools in avocado–coffee Systems in Huatusco, Veracruz, México. Resources 14:35. doi: 10.3390/resources14030035
Bacon, C. (2005). Confronting the coffee crisis: can fair trade, organic, and specialty coffees reduce small-scale farmer vulnerability in northern Nicaragua? World Dev. 33, 497–511. doi: 10.1016/j.worlddev.2004.10.002
Beckmann, M., Didenko, G., Bullock, J. M., Cord, A. F., Paulus, A., Ziv, G., et al. (2022). Archetypes of Agri-environmental potential: a multi-scale typology for spatial stratification and upscaling in Europe. Environ. Res. Lett. 17:115008. doi: 10.1088/1748-9326/ac9cf5
Benítez-García, E., Jaramillo-Villanueva, J. L., Escobedo-Garrido, S., and Mora-Flores, S. (2015). Characterization of coffee production and trade in the municipality of Cuetzalan, Puebla. Agricultura, Sociedad y Desarrollo 12, 181–198. doi: 10.22231/asyd.v12i2.147
Boege, E. (2021). “Acerca del concepto de diversidad y patrimonio biocultural de los pueblos originarios y comunidad equiparable” in Construyendo territorios de vida con autonomía y libre determinación (Puebla: BUAP, INAH).
Briones-Ruíz, G., Díaz-José, J., Flores-Verduzco, J. J., Farrera-Vázquez, I. C., and Martínez-González, E. G. (2021). Los vínculos sociales y la adopción de buenas prácticas de producción entre productores de café en Zongolica, Veracruz, México. CIENCIA ergo-sum, Revista Científica Multidisciplinaria de Prospectiva 28:1. doi: 10.30878/ces.v28n2a3
CEPAL, Instituto Dominicano del Café (INDOCAFE), and Consejo Nacional para el Cambio Climático y Mecanismo de Desarrollo Limpio (CNCCMDL) (2020). Fortalecimiento de la cadena de valor de café en la República Dominicana: En respuesta al cambio climático (LC/MEX/TS.2020/39) : Mexico City.
Cerda, R., Allinne, C., Gary, C., Tixier, P., Harvey, C. A., Krolczyk, L., et al. (2017). Effects of shade, altitude and management on multiple ecosystem services in coffee agroecosystems. Eur. J. Agron. 82, 308–319. doi: 10.1016/j.eja.2016.09.019
Chort, I., and Öktem, B. (2024). Agricultural shocks, coping policies and deforestation: evidence from the coffee leaf rust epidemic in Mexico. Am. J. Agric. Econ. 106, 1020–1057. doi: 10.1111/ajae.12441
CONAPO. (2020). Índice de marginación por localidad 2020, Colección: Índices Sociodemográficos. Consejo Nacional de Población, México D.F. Available online at: https://www.gob.mx/conapo/documentos/indices-de-marginacion-2020-284372
De Leijster, V., Santos, M. J., Wassen, M. W., Camargo García, J. C., Llorca Fernandez, I., Verkuil, L., et al. (2021). Ecosystem services trajectories in coffee agroforestry in Colombia over 40 years. Ecosyst. Serv. 48, 1–13. doi: 10.1016/j.ecoser.2021.101246
Dorsey, B. (2008). Agricultural intensification, diversification, and commercial production among smallholder coffee growers in Central Kenya. Econ. Geogr. 75, 178–195. doi: 10.1111/j.1944-8287.1999.tb00122.x
Escamilla Prado, E., Vargas, A. L. L., Cárdenas, S. D., Cortés, H. V. S., Sosa, R., and Ramírez, L. R. (1994). Los sistemas de producción de café en el centro de Veracruz, México: Un análisis tecnológico. Revista de Historia 30, 41–67.
Escobar-López, A., Castillo-Santiago, M. Á., Mas, J. F., Hernández-Stefanoni, J. L., and López-Martínez, J. O. (2024). Identification of coffee agroforestry systems using remote sensing data: a review of methods and sensor data. Geocarto Int. 39:2297555. doi: 10.1080/10106049.2023.2297555
Everitt, B., Landau, S., Leese, M., and Stahl, D. (2011). Cluster analysis. 5th Edn. New York: John Wiley.
Frakes, B., Flowe, T., and Sherrill, K. R. (2015). National Park Service travel time cost surface model (TTCSM): March 2015. Natural resource report NPS/NRSS/NRR–2015/933. Fort Collins, Colorado: National Park Service.
Galeana-Pizaña, J. M., Couturier, S., Figueroa, D., and Jimenez, A. D. (2021). Is rural food security primarily associated with smallholder agriculture or with commercial agriculture? An approach to the case of Mexico using structural equation modeling. Agric. Syst. 190:103091. doi: 10.1016/j.agsy.2021.103091
Galeana-Pizaña, J. M., Nuñez-Hernández, J. M., and Corona-Romero, N. (2016). “Remote sensing-based biomass estimation” in Environmental applications of remote sensing. ed. M. Marghany (London: INTECH).
Haggar, J., Casanoves, F., Cerda, R., Cerretelli, S., Gonzalez-Mollinedo, S., Lanza, G., et al. (2021). Shade and agronomic intensification in coffee agroforestry systems: trade-off or synergy? Front. Sustain. Food Syst. 5:645958. doi: 10.3389/fsufs.2021.645958
Harvey, C. A., Pritts, A. A., Zwetsloot, M. J., Jansen, K., Pulleman, M. M., Armbrecht, I., et al. (2021). Transformation of coffee-growing landscapes across Latin America: a review. Agron. Sustain. Dev. 41:62. doi: 10.1007/s13593-021-00712-0
Henderson, T. P. (2017). Struggles for autonomy from and within the market of Southeast Mexico’s small coffee producers. J. Peasant Stud. 46, 400–423. doi: 10.1080/03066150.2017.1382478
Hernández-Martínez, G., Manson, R. H., and Hernández, A. C. (2009). Quantitative classification of coffee agroecosystems spanning a range of production intensities in Central Veracruz, Mexico. Agric. Ecosyst. Environ. 134, 89–98. doi: 10.1016/j.agee.2009.05.020
Herrera Hernández, O. B., and Zamora Lomelí, C. B. (2025). Territorios cafetaleros en México: Claves para una tipología de productores. Revista de El Colegio de San Luis 15, 1–27. doi: 10.21696/rcsl152620251628
Herrero, M., Thornton, P. K., Power, B., Bogard, J. R., Remans, R., Fritz, S., et al. (2017). Farming and the geography of nutrient production for human use: a transdisciplinary analysis. Lancet Planet. Health. 1, e33–e42. doi: 10.1016/S2542-5196(17)30007-4
Hunt, D., Tabor, K., Hewson, J., Wood, M., Reymondin, L., Koenig, K., et al. (2020). Review of remote sensing methods to map coffee production systems. Remote Sens 12:2041. doi: 10.3390/rs12122041
Hwang, B., Hundera, K., Mekuria, B., Wood, A., and Asfaw, A. (2020). Intensified management of coffee forest in Southwest Ethiopia detected by Landsat imagery. Forests 11:422. doi: 10.3390/f11040422
INEGI (2007). Censo agropecuario 2007. Ciudad de México: Instituto Nacional de Estadística y Geografía (INEGI). Available online at: https://www.inegi.org.mx/programas/cagf/2007/
INEGI (2012). Conjunto de datos vectoriales de información topográfica digital. Escala 1:250,000. Serie IV. México: Instituto Nacional de Estadística y Geografía.
INEGI (2020). Censo de población y vivienda 2020. Ciudad de México: Instituto Nacional de Estadística y Geografía (INEGI). Available online at: https://www.inegi.org.mx/programas/ccpv/2020/.
INEGI (2022). Directorio Estadístico Nacional de Unidades Económicas 2022. Ciudad de México: Instituto Nacional de Estadística y Geografía (INEGI). Available online at: https://www.inegi.org.mx/app/mapa/denue/default.aspx
INEGI (2023). Censo agropecuario 2022. Ciudad de México: Instituto Nacional de Estadística y Geografía (INEGI). Available online at: https://www.inegi.org.mx/programas/ca/2022/
Jarquín Gálvez, R. (2003). Agroecosistemas cafetaleros en Los Altos de Chiapas: Una revisión. Sociedades Rurales, Producción y Medio Ambiente 4, 83–92.
Jha, S., Bacon, C. M., Philpott, S. M., Rice, R. A., Méndez, V. E., and Läderach, P. (2011). “A review of ecosystem services, farmer livelihoods, and value chains in shade coffee agroecosystems” in Integrating agriculture, conservation and ecotourism: examples from the field. eds. B. Campbell and S. Lopez. Issues in Agroecology - Present Status and Future Prospectus, Vol 1. Springer, Dordrecht, 141–208.
Jiménez-Ortega, A. D., Aguilar Ibarra, A., Galeana-Pizaña, J. M., and Núñez, J. M. (2022). Changes over time matter: a cycle of participatory sustainability assessment of organic coffee in Chiapas, Mexico. Sustainability 14:2012. doi: 10.3390/su14042012
Kassie, M., Jaleta, M., Teklewold, H., and Erenstein, O. (2015). Understanding the adoption of a portfolio of sustainable intensification practices in eastern and southern Africa. Land Use Policy 42, 400–411. doi: 10.1016/j.landusepol.2014.08.016
Ketchen, D. J., and Shook, C. L. (1996) The application of cluster analysis in strategic management research: an analysis and critique. Strateg. Manag. J., 17, pp.441–458. Available online at: https://www.jstor.org/stable/2486927
Keys, E., and McConnell, W. J. (2005). Global change and the intensification of agriculture in the tropics. Glob. Environ. Chang. 15, 320–337. doi: 10.1016/j.gloenvcha.2005.04.004
Koutouleas, A., Sarzynski, T., Bordeaux, M., Bosselmann, A. S., Campa, C., Etienne, H., et al. (2022). Shaded-coffee: a nature-based strategy for coffee production under climate change? A review. Front. Sustain. Food Syst. 6:877476. doi: 10.3389/fsufs.2022.877476
Lalani, B., Lanza, G., Leiva, B., Mercado, L., and Haggar, J. (2024). Shade versus intensification: trade-off or synergy for profitability in coffee agroforestry systems? Agric. Syst. 214:103814. doi: 10.1016/j.agsy.2023.103814
Lin, B. B., Perfecto, I., and Vandermeer, J. (2008). Synergies between agricultural intensification and climate change could create surprising vulnerabilities for crops. Bioscience 58, 847–854. doi: 10.1641/B580911
Llorente, J., and Ocegueda, S. (2008). Estado del conocimiento de la biota. (pp. 283–322). En: J. Soberón, G. Halfftery, and J. Llorente. Conocimiento actual de la Biodiversidad. Capital Natural de México. (J. Sa-rukhán, Compilador Principal de la Obra). CONABIO. México.
Manson, R. (2023). Informe Final del estudio TEEB AgriFood de café en México. Xalapa, Veracruz, Mexico: INECOL.
Martínez-Torres, M. E. (2008). “The benefits and sustainability of organic farming by peasant coffee farmers in Chiapas, Mexico” in Confronting the coffee crisis: Fair trade, sustainable livelihoods, and ecosystems in Mexico and Central America (Cambridge, MA: MIT Press), 99–126.
Martínez-Verduzco, G. C., Galeana-Pizaña, J. M., and Cruz-Bello, G. M. (2012). Coupling community mapping and supervised classification to discriminate shade coffee from natural vegetation. Appl. Geogr. 34, 1–9. doi: 10.1016/j.apgeog.2011.10.001
Mas, A. H., and Dietsch, T. V. (2003) An index of management intensity for coffee agroecosystems to evaluate butterfly species richness. Ecol. Appl., 13, pp.1491–1501. Available online at: https://www.jstor.org/stable/4134727
Mayorga, I., Vargas de Mendonça, J. L., Hajian-Forooshani, Z., Lugo-Perez, J., and Perfecto, I. (2022). Tradeoffs and synergies among ecosystem services, biodiversity conservation, and food production in coffee agroforestry. Front. Forests Glob. Change 5:690164. doi: 10.3389/ffgc.2022.690164
Méndez, V. E., Bacon, C. M., Olson, M., Morris, K. S., and Shattuck, A. (2010). Agrobiodiversity and shade coffee smallholder livelihoods: a review and synthesis of ten years of research in Central America. Prof. Geogr. 62, 357–376. doi: 10.1080/00330124.2010.483638
Meneses-R, O. E., and Armbrecht, I. (2018). Índice de intensificación agrícola y conservación vegetal en bosques y cafetales colombianos con diferentes estrategias de manejo. Caldasia 40, 161–176. doi: 10.15446/caldasia.v40n1.61284
Moguel, P., and Toledo, V. M. (1999). Biodiversity conservation in traditional coffee systems of Mexico. Conserv. Biol. 13, 11–21. doi: 10.1046/j.1523-1739.1999.97153.x
Mokondoko, P., Avila-Foucat, V. S., and Galeana-Pizaña, J. M. (2022). Biophysical drivers of yield gaps and ecosystem services across different coffee-based agroforestry management types: a global meta-analysis. Agric. Ecosyst. Environ. 337:108024. doi: 10.1016/j.agee.2022.108024
Mukai, S. (2024). “Semi-arid Ethiopian Rift Valley: a case study of agricultural intensification in sub-Saharan Africa” in Sacred landscapes, indigenous knowledge, and ethno-culture in natural resource management. Advances in geographical and environmental sciences. eds. S. C. Rai and P. K. Mishra (Singapore: Springer).
Nugraha, A. T., Prayitno, G., and Khoiriyah, L. A. (2021). Land suitability and economic performance in the Pasuruan region for coffee development. Int. J. Sustain. Dev. Plan. 16, 229–236. doi: 10.18280/ijsdp.160203
Ortega-Huerta, M. A., Komar, O., Price, K. P., and Ventura, H. J. (2012). Mapping coffee plantations with Landsat imagery: an example from El Salvador. Int. J. Remote Sens. 33, 220–242. doi: 10.1080/01431161.2011.591442
Oviedo-Rodríguez, C., Jansen, K., and Vellema, S. (2024). Incorporation of different types of farmers into different coffee markets. Canad. J. Dev. Stud. 45, 161–180. doi: 10.1080/02255189.2023.2245531
Pacini, G. C., Colucci, D., Baudron, F., Righi, E., Corbeels, M., Tittonell, P., et al. (2014). Combining multi-dimensional scaling and cluster analysis to describe the diversity of rural households. Exp. Agric. 50, 376–397. doi: 10.1017/S0014479713000495
Pascucci, F. (2024). “The state of the global coffee sector” in Sustainability in the coffee supply chain: Tensions and paradoxes (Palgrave, Macmillan, Cham: Springer Nature Switzerland), 57–75.
Pérez-Neira, D., Schneider, M., and Armengot, L. (2020). Crop-diversification and organic management increase the energy efficiency of cacao plantations. Agric. Syst. 177:102711. doi: 10.1016/j.agsy.2019.102711
Perfecto, I., Vandermeer, J., Mas, A., and Pinto, L. S. (2005). Biodiversity, yield, and shade coffee certification. Ecol. Econ. 54, 435–446. doi: 10.1016/j.ecolecon.2004.10.009
Potapov, P., Li, X., Hernandez-Serna, A., Tyukavina, A., Hansen, M. C., Kommareddy, A., et al. (2021). Mapping global forest canopy height through integration of GEDI and Landsat data. Remote Sensing of Environment, 253:112165. doi: 10.1016/j.rse.2020.112165
Rahn, E., Liebig, T., Ghazoul, J., van Asten, P., Läderach, P., Vaast, P., et al. (2018). Opportunities for sustainable intensification of coffee agro-ecosystems along an altitudinal gradient on Mt. Elgon, Uganda. Agric. Ecosyst. Environ. 263, 31–40. doi: 10.1016/j.agee.2018.04.019
Ramírez-León, A., Avila-Foucat, V. S., and Ezzine-de-Blas, D. (2024). The historical trajectory of a coffee Agri-food system: a case study in Oaxaca, Mexico. Ambio 53, 1847–1863. doi: 10.1007/s13280-023-01893-6
Raynolds, L. T., Murray, D., and Leigh Taylor, P. (2004). Fair trade coffee: building producer capacity via global networks. J. Int. Dev. 16, 1109–1121. doi: 10.1002/jid.1136
Renard, M. C. (2005). Quality certification, regulation and power in fair trade. J. Rural. Stud. 21, 419–431. doi: 10.1016/j.jrurstud.2005.09.002
Renard, M.-C. (2022). Values and the making of standards in ‘sustainable’ coffee networks: the case of 4C and Nestlé in Mexico. Int. Sociol. 37, 758–776. doi: 10.1177/02685809221119289
Rice, R. A. (1999). A place unbecoming: the coffee farm of northern Latin America. Geogr. Rev. 89, 554–579. doi: 10.1111/j.1931-0846.1999.tb00234.x
Salas López, R., Gómez Fernández, D., Silva López, J. O., Rojas Briceño, N. B., Oliva, M., Terrones Murga, R. E., et al. (2020). Land suitability for coffee (Coffea arabica) growing in Amazonas, Peru: integrated use of AHP, GIS and RS. ISPRS Int. J. Geo Inf. 9:673. doi: 10.3390/ijgi9110673
SIAP (2020). Anuario Estadístico de la Producción Agrícola Ciudad de México: SIAP/AGRICULTURA. Available online at: https://nube.agricultura.gob.mx/cierre_agricola/
SIAP. (2024). Panorama agroalimentario 2018–2024. Ciudad de México: SIAP/AGRICULTURA. Available online at: https://panorama.agricultura.gob.mx/vista/panorama-agroalimentario.php
SIAP-SAGARPA (2011). Padrón Nacional Cafetalero. Servicio de Información. Mexico City: Agroalimentaria y Pesquera SIAP-SAGARPA-AMECAFE.
Soto-Pinto, L., Perfecto, I., Castillo-Hernandez, J., and Caballero-Nieto, J. (2000). Shade effect on coffee production at the northern Tzeltal zone of the state of Chiapas, Mexico. Agric. Ecosyst. Environ. 80, 61–69. doi: 10.1016/S0167-8809(00)00134-1
Taugourdeau, S., Le Maire, G., Avelino, J., Jones, J. R., Ramirez, L. G., Quesada, M. J., et al. (2014). Leaf area index as an indicator of ecosystem services and management practices: an application for coffee agroforestry. Agric. Ecosyst. Environ. 192, 19–37. doi: 10.1016/j.agee.2014.03.042
Tittonell, P. (2014a). Livelihood strategies, resilience and transformability in African agroecosystems. Agric. Syst. 126, 3–14. doi: 10.1016/j.agsy.2013.10.010
Tittonell, P. (2014b). Ecological intensification of agriculture—sustainable by nature. Curr. Opin. Environ. Sustain. 8, 53–61. doi: 10.1016/j.cosust.2014.08.006
Toledo, V. M., and Moguel, P. (2012). Coffee and sustainability: the multiple values of traditional shaded coffee. J. Sustain. Agric. 36, 353–377. doi: 10.1080/10440046.2011.583719
Tolentino, A. H., and Vera, J. V. A. (2017). Factores competitivos para la exportación de café a Estados Unidos: Caso Xicotepec, Puebla, México, vol. 11. Portoviejo Manabi, Ecuador: Repositorio de la Red Internacional de Investigadores en Competitividad, 662–681.
Vaast, P., Martínez, M., Boulay, A., Castillo, B. D., and Harmand, J. M. (2015). “Diversifying central American coffee agroforestry systems via revenue of shade trees” in Ruf, F., Schroth, G. (eds). Economics and Ecology of Diversification. Springer, Dordrecht: The Case of Tropical Tree Crops, 271–281.
Valencia, V., García-Barrios, L., Sterling, E. J., West, P., Meza-Jiménez, A., and Naeem, S. (2018). Smallholder response to environmental change: impacts of coffee leaf rust in a forest frontier in Mexico. Land Use Policy 79, 463–474. doi: 10.1016/j.landusepol.2018.08.020
Volsi, B., Telles, T. S., Caldarelli, C. E., and Camara, M. R. G. D. (2019). The dynamics of coffee production in Brazil. PLoS One 14:e0219742. doi: 10.1371/journal.pone.0219742
Walker, D. (2011) Report on coffee marketing business plan development for UPROCA cooperative, Gisenyi-Rwanda. ACDI/VOCA farm-to-market partnerships enhancing program (revised).
Yan, Y., Wang, D., Yue, S., and Qu, J. (2019). Trends in summer air temperature and vapor pressure and their impacts on thermal comfort in China. Theor. Appl. Climatol. 138, 1445–1456. doi: 10.1007/s00704-019-02909-6
Keywords: shade coffee, intensification drivers, spatial clustering, regional variation, agroforestry
Citation: Galeana-Pizaña JM and Manson RH (2025) Mapping coffee intensification in Mexico: a multivariate spatial analysis approach. Front. Sustain. Food Syst. 9:1649756. doi: 10.3389/fsufs.2025.1649756
Edited by:
Liye Wang, Shandong University of Finance and Economics, ChinaReviewed by:
Quetzalcóatl Orozco Ramirez, National Autonomous University of Mexico, MexicoArthur Santos, Universidade Estadual Paulista Julio de Mesquita Filho Agencia Unesp de Inovacao, State of São Paulo, Brazil
Copyright © 2025 Galeana-Pizaña and Manson. This is an open-access article distributed under the terms of the Creative Commons Attribution License (CC BY). The use, distribution or reproduction in other forums is permitted, provided the original author(s) and the copyright owner(s) are credited and that the original publication in this journal is cited, in accordance with accepted academic practice. No use, distribution or reproduction is permitted which does not comply with these terms.
*Correspondence: Robert H. Manson, cm9iZXJ0Lm1hbnNvbkBpbmVjb2wubXg=