 Jean Baptiste Bernard Pea-Assounga
 Prince Dorian Rivel Bambi
 Dalia Ayme Opoko Apendi
- 1School of Finance and Economics, Jiangsu University, Zhenjiang, China
- 2Faculty of Economics, Marien Ngouabi University, Brazzaville, Republic of Congo
This study investigates how industry, agriculture, food production, renewable energy consumption, consumer price index, and urbanization influence the ecological footprint across nine Asian countries from 1995 to 2020. Utilizing panel quantile regression and the system GMM as robustness checks, the analysis draws on data sourced from the world development indicators and the global footprint network. The findings from the panel quantile regression reveal that industry has a significant positive association with the ecological footprint across all quantile levels, with the effect becoming particularly stronger beyond the 20th and 30th quantiles. Food production shows a heterogeneous impact; it contributes to reducing ecological footprint at the lower quantiles (10th, 20th, and 30th). However, from the 40th to 90th quantiles, food production significantly increases ecological footprint, indicating that in high-impact scenarios, agricultural intensification and resource demand worsen environmental pressure. In contrast, renewable energy consumption demonstrates a statistically significant negative effect on ecological footprint, particularly evident at the 40th quantile and even more substantial at the 90th quantile. The effect of the consumer price index varies across quantiles, with positive impacts in lower quantiles and its negative effect at higher quantiles. Moreover, agriculture consistently emerges as a significant contributor to ecological footprint across all quantile levels. Finally, urbanization exhibits a dual and quantile-dependent effect, notably significant in the 20th and 30th quantiles. Moreover, the study incorporates the system GMM as a robustness check, which accounts for potential endogeneity, unobserved heterogeneity, and dynamic relationships among the variables, thereby ensuring more reliable and consistent estimates. Based on these findings, practical policy implications have been proposed along with the study’s limitations and directions for future research.
1 Introduction
Sustainable development has become a pivotal theme in global environmental discourse, with the ecological footprint (EF) emerging as a comprehensive metric to evaluate the pressure exerted by human activity on natural ecosystems (Wackernagel et al., 2002). In recent decades, rapid economic expansion and escalating population growth across Asia have significantly intensified environmental stress, thereby raising critical concerns about ecological sustainability. In light of this, the present study examines the influence of industry, agricultural practices, food production, renewable energy consumption, consumer price index, and urbanization on ecological footprint sustainability across nine Asian nations from 1995 to 2020. While numerous empirical studies have explored these variables, the findings remain mixed. On the one hand, industry is often seen as an engine of economic modernization, yet it contributes heavily to environmental degradation through resource depletion and increased carbon emissions (Carolan, 2004; Mol, 2000). Similarly, agricultural and food production are essential to meet the demands of growing populations but are linked to soil erosion, water scarcity, and heightened nitrous oxide emissions (Hossain et al., 2020; Wallace, 2000). Urbanization, though associated with infrastructural progress, also exacerbates environmental pressures by increasing land-use changes and energy demand (Huang et al., 2010; Patra et al., 2018). Conversely, renewable energy consumption is widely acknowledged for its environmentally beneficial effects, notably in reducing reliance on fossil fuels and shrinking the ecological footprint (Mohamed et al., 2024; Wang et al., 2025). A stable CPI, as an indicator of macroeconomic stability, may indirectly support ecological sustainability by influencing consumption patterns and efficient resource use (Hussain et al., 2022; Pan et al., 2022).
Despite these insights, the literature remains fragmented and predominantly based on average effect models, which fail to capture the heterogeneity and non-linearity of these relationships across varying degrees of ecological stress. Therefore, this study addresses a key research gap by investigating how the environmental effects of industry, agriculture, energy use, and urbanization differ across countries experiencing varying levels of ecological pressure, an area that has been underexplored in the existing body of work.
The core objective of the study is to evaluate the differential impact of these factors on ecological footprint sustainability using a novel methodological framework. The application of quantile regression offers a distinct advantage by revealing how each determinant behaves across the distribution of EF, particularly between low and high quantiles, thus addressing heterogeneity and uncovering hidden patterns that traditional mean-based methods like OLS, or ARDL might overlook (Koenker and Bassett, 1978; Machado and Santos Silva, 2019). Complementarily, the study incorporates the system GMM as a robustness check, which accounts for potential endogeneity, unobserved heterogeneity, and dynamic relationships among the variables, thereby ensuring more reliable and consistent estimates. The selection of the nine Asian countries, China, Singapore, Japan, South Korea, Vietnam, Malaysia, the Philippines, Thailand, and Indonesia, is both strategically justified and methodologically rigorous. These nations represent the economic nucleus of East and Southeast Asia, bound by strong trade interdependencies, deeply integrated production systems, and regional cooperative frameworks such as the Association of Southeast Asian Nations (ASEAN) and the Regional Comprehensive Economic Partnership (RCEP). Their mutual economic ties are underscored by robust intra-industry trade, cross-border capital flows, and cohesive value chains across critical sectors like manufacturing, agriculture, and electronics. Beyond economic integration, these countries share fundamental structural characteristics, including swift industrialization, rapid urban growth, and a continued reliance on agriculture for employment and food security. Together, they have experienced transformative development trajectories that position them as key stakeholders in the global sustainability discourse. Their distinct yet interconnected economic paths make them particularly suitable for comparative analysis of environmental, economic, and policy-oriented dimensions. The chosen period of 1995 to 2020 further reinforces the relevance of this selection. It captures critical junctures in international environmental policymaking, most notably the Kyoto Protocol (1997) and the Paris Agreement (2015), enabling a comprehensive evaluation of how these countries have aligned their domestic strategies with evolving global climate objectives. Additionally, this timeframe encompasses several economic cycles, including periods of crisis and recovery, thus providing a rich temporal landscape for assessing long-term sustainability transitions within the region.
Based on the literature and theoretical underpinnings, this study proposes a set of hypotheses to capture the diverse impacts of various factors on ecological footprint across different levels of ecological intensity. Firstly, H1 posits that industrial development (IND) has a consistently positive impact on the ecological footprint. The quantile regression results show positive and statistically significant effects at the 10th, 20th, and 30th quantiles, while coefficients at higher quantiles (50th–90th) remain positive but statistically insignificant. The System GMM estimates reinforce this conclusion, with IND displaying a consistently positive and highly significant effect at the 1% level. These results confirm that industrial development is a key driver of ecological footprint, particularly at lower to mid-level quantiles. Secondly, H2 suggests that food production (FP) exerts heterogeneous effects. According to the quantile regression, FP shows negative but insignificant effects at lower quantiles (10th–30th), followed by positive and statistically significant impacts at the 40th and 50th quantiles. At higher quantiles (60th–90th), the coefficients remain positive but insignificant. In the System GMM results, FP is positive and significant at the 5% level in model 2, indicating that its influence varies depending on a country’s level of ecological activity. Thirdly, H3 proposes that renewable energy consumption (REC) reduces ecological footprint. The quantile results provide strong support, with negative and statistically significant coefficients across all quantiles, ranging from 10th to 90th. The System GMM estimates confirm this robust relationship, as REC shows a negative and highly significant effect at the 1% level. Together, these results demonstrate the consistent mitigating role of renewable energy in reducing ecological footprint. Furthermore, H4 asserts that the consumer price index (CPI) has mixed effects., The quantile regression indicates sign changes, with positive coefficients at lower quantiles and negative ones at higher quantiles, but all are statistically insignificant. The GMM results similarly reveal that CPI is insignificant across all models. Thus, while CPI may play a dual role in theory, empirical evidence suggests its influence is not statistically meaningful. In addition, H5 maintains that agricultural activities (AGR) are positively associated with ecological footprint. The quantile regression shows strong evidence, with positive and significant coefficients across all quantiles. The GMM results reinforce this conclusion, as AGR is consistently positive and significant at the 5% level across models, suggesting that agriculture continuously contributes to environmental pressure regardless of footprint level. Lastly, H6 contends that urbanization displays a non-linear relationship. The quantile regression highlights this complexity, showing negative and statistically significant coefficients at the lower quantiles, but positive and significant coefficients at the higher quantiles. The GMM results indicate a positive and highly significant effect across all models, thereby emphasizing the complexity of urban growth’s environmental consequences. Collectively, these hypotheses aim to guide a more nuanced understanding of the factors influencing ecological footprint and to inform policy interventions tailored to specific national contexts and ecological conditions.
The structure of this manuscript is as follows: the second section reviews the theoretical framework and existing literature; the third section outlines the methodology; the fourth section presents the findings and discussion; and the fifth section concludes with policy implications and study limitations.
2 Literature review
2.1 Hypothesis development
2.1.1 Industry and ecological footprint
This relation is inherently complex, reports a strong positive link between industry and increased resource consumption, thereby intensifying the ecological footprint (Li and Wang, 2023). Elevated industrial activity typically drives higher demand for energy, raw materials, and water, placing significant pressure on environmental systems. Moreover, industrialization is frequently associated with increased pollution levels and widespread environmental degradation (Bambi et al., 2024; Bambi and Pea-Assounga, 2024). Evidence points to industrial processes as major contributors to declining air and water quality, soil depletion, and the destruction of natural habitats (Musa et al., 2023). These activities also lead to elevated carbon emissions, largely due to the reliance on fossil fuels, which further accelerates climate change and expands the ecological footprint (Raihan et al., 2022). Additionally, industrial expansion often necessitates extensive land use changes, including deforestation and habitat loss (Lin et al., 2015) which in turn threaten biodiversity and disrupt ecological balance (Opoku and Aluko, 2021; Liao et al., 2023). On the other hand, a growing number of studies suggest that industrialization, when coupled with technological advancement and resource-efficient practices, can reduce environmental impact. The integration of cleaner technologies and sustainable production systems has been shown to mitigate the adverse effects of industrial growth (Ahmad et al., 2020; Destek and Manga, 2021). Moreover, empirical evidence from certain regions suggests a partial decoupling between economic growth and environmental degradation, indicating that economic expansion does not necessarily entail greater ecological harm if managed sustainably (Yang and Usman, 2021). In contrast, findings by Saqib et al. (2024) challenge the conventional notion of industry as inherently detrimental to the environment. Their study reveals that in certain emerging economies, moderate industrial growth guided by robust environmental regulations and the adoption of green technologies has contributed to a net reduction in ecological footprint. This illustrates that, under the right institutional and technological conditions, industrialization can be reconciled with environmental sustainability. Overall, the impact of industry on the ecological footprint is context-dependent and influenced by factors such as environmental governance, technological innovation, and the degree to which sustainable practices are embedded within industrial policies.
2.1.2 Food production and ecological footprint
The connection between these factors encompasses diverse elements such as agricultural techniques, land management, water usage, and the environmental repercussions throughout the entire food supply chain. A study by Liao and Brown (2018) highlights that agricultural expansion, especially for livestock and large-scale monoculture, is a significant contributor to deforestation and habitat loss, resulting in an expansion of the ecological footprint. In the same vein, agriculture is a major consumer of freshwater resources. Irrigation practices, particularly in arid regions, contribute to high water consumption and can exacerbate water scarcity (Bambi and Pea-Assounga, 2025; Chai et al., 2023). Furthermore, agricultural activities, including enteric fermentation from livestock, rice cultivation, and the use of synthetic fertilizers, contribute to greenhouse gas emissions, impacting the overall ecological footprint (Setsoafia et al., 2022). On the other hand, the inefficiencies in the food supply chain, including post-harvest losses and consumer food waste, contribute to a larger ecological footprint by wasting resources used in production (Ali et al., 2021). Other empirical evidence suggests that the adoption of sustainable agricultural practices, such as organic farming and agroecology, can reduce the ecological footprint by minimizing the use of synthetic inputs and promoting biodiversity. In addition, research by Saqib et al. (2024) suggests that the adoption of sustainable agricultural practices, such as organic farming and agroecology, can reduce the ecological footprint by minimizing the use of synthetic inputs and promoting biodiversity. However, some studies show that dietary choices, particularly the consumption of meat and animal products, significantly influence the ecological footprint (Ali et al., 2021; Aschemann-Witzel et al., 2023; Bambi and Pea-Assounga, 2025). Plant-based diets generally have a lower environmental impact. It is vital to recognize that various factors influence the “ecological footprint” of food production, and strategies to reduce it often involve a combination of sustainable agricultural practices, improved supply chain efficiency, and changes in consumer behavior.
2.1.3 Renewable energy consumption and ecological footprint
This relationship involves evaluating the environmental implications of shifting from conventional non-renewable sources to cleaner, renewable alternatives. According to Aschemann-Witzel et al. (2023) unveils that embracing “renewable energy sources” has led to a decrease in greenhouse gas emissions, thus driving down the ecological footprint. Adopting renewable energy technologies has significantly contributed to the reduction of greenhouse gas emissions, thereby helping to lower the ecological footprint. However, some studies present contrasting findings. For example, Li and Wang (2023) as well as (Nathaniel et al., 2020) emphasize that certain forms of renewable energy, particularly large-scale hydropower and bioenergy, may cause negative environmental effects such as habitat degradation and changes in land use. Similarly, Peiró et al. (2022) and Bambi and Pea-Assounga (2025) point out that the production and installation of renewable technologies often involve resource extraction and energy-intensive procedures. A study by Ansari et al. (2021) found that in the long run, there is a positive link between economic growth and the use of non-renewable energy with ecological footprint, while revealing a negative association between renewable energy consumption, globalization, and urbanization. Likewise, Sharif et al. (2020) using a QARDL approach, demonstrated that the error correction term is significant at all quantiles, confirming a strong tendency toward re-establishing long-term equilibrium in the relationship between the selected variables and ecological footprint. Their findings underscore that renewable energy consistently reduces ecological footprint across all quantiles over time, while economic growth and non-renewable energy exert a positive influence on ecological footprint in both short and long terms. Furthermore, to comprehensively understand these dynamics, evaluating the full life cycle environmental impacts of renewable technologies is essential. Studies such as Liu et al. (2021) and Salehi et al. (2020) have emphasized assessing the energy return on investment to measure the efficiency and environmental performance of these technologies. Contrary to the notion that renewable energy uniformly mitigates ecological degradation. Another study by Raghutla et al. (2022) reports through quantile regression and long-run elasticities that both per capita income and renewable energy usage significantly increase ecological footprint in the N-11 economies. Additionally, their panel causality results reveal a bidirectional causality between renewable energy use and ecological footprint. It is also critical to recognize that specific renewable sources, such as hydropower and bioenergy, may exert pressure on water systems, as noted by Bambi and Pea-Assounga (2024) and Rahman et al. (2022). In this regard, understanding the concept of the water footprint becomes fundamental for an exhaustive ecological assessment. Furthermore, continuous innovations and improvements in the environmental performance of renewable technologies are indispensable in reducing their ecological burden (Appiah et al., 2023; Pea-Assounga et al., 2025). While renewable energy generally poses less harm to the environment compared to fossil fuels, its actual ecological footprint can vary based on factors such as the technology employed, location, and scale of application. Therefore, life cycle assessments and a broader environmental context are critical in developing a nuanced understanding of the interaction between renewable energy consumption and ecological footprint.
2.1.4 Agriculture, consumer price index, and urbanization on ecological footprint
Agriculture, inherently resource-intensive, plays a significant role in elevating the ecological footprint through land conversion, overextraction of water resources, and greenhouse gas emissions. Moreover, practices such as monoculture cultivation and large-scale livestock farming are closely associated with soil degradation and biodiversity loss, which collectively heighten environmental vulnerability (Johns et al., 2013; Kremen et al., 2012). However, contrasting findings by Kronberg and Ryschawy (2019) highlight that the adoption of sustainable agricultural systems such as agroecology and organic farming can mitigate environmental damage and, in certain contexts, even reduce the ecological footprint by enhancing biodiversity and strengthening ecosystem functions.
Simultaneously, the consumer price index indirectly yet significantly influences the ecological footprint by affecting consumption and production patterns. Changes in the CPI can alter demand for goods and services, thereby shaping the use of energy and natural resources (Beyer et al., 2024). For instance, rising prices may suppress consumption, alleviating environmental pressures, while falling prices could encourage overconsumption and exacerbate ecological impacts (Limnios et al., 2009; Semenova, 2024). Conversely, some research suggests that in certain cases, increases in consumer prices do not substantially curb consumption due to the inelastic nature of demand for essential products, which can diminish the expected effect of CPI variations on the ecological footprint (Bocken and Allwood, 2012; Rondoni and Grasso, 2021).
Urbanization, likewise, is a prominent driver of ecological footprint expansion due to its association with rising demand for infrastructure, energy, and waste management. The sprawl of urban settlements often leads to deforestation, increased emissions from transportation, and intensified extraction of natural resources, all contributing to substantial ecological costs (Sahoo and Sethi, 2022; Ulucak and Khan, 2020). Nevertheless, contrasting perspectives, such as those of Luo et al. (2018) and Ullah et al. (2023), argue that well-designed, compact urban environments can actually contribute to reducing per capita ecological footprints by enhancing energy efficiency, expanding public transit systems, and limiting land use. Collectively, these three factors, agriculture, CPI fluctuations, and urban expansion, exert a profound influence on ecological sustainability, though their effects can vary significantly depending on the context and policy interventions.
2.2 Conceptual framework
Figure 1 presents a refined conceptual framework that visually integrates the core factors discussed in the hypotheses, where the effects of each variable have been systematically analyzed. This framework offers a comprehensive understanding of how industry, agriculture, food production, renewable energy consumption, consumer price index, and urbanization interact to influence the ecological footprint.
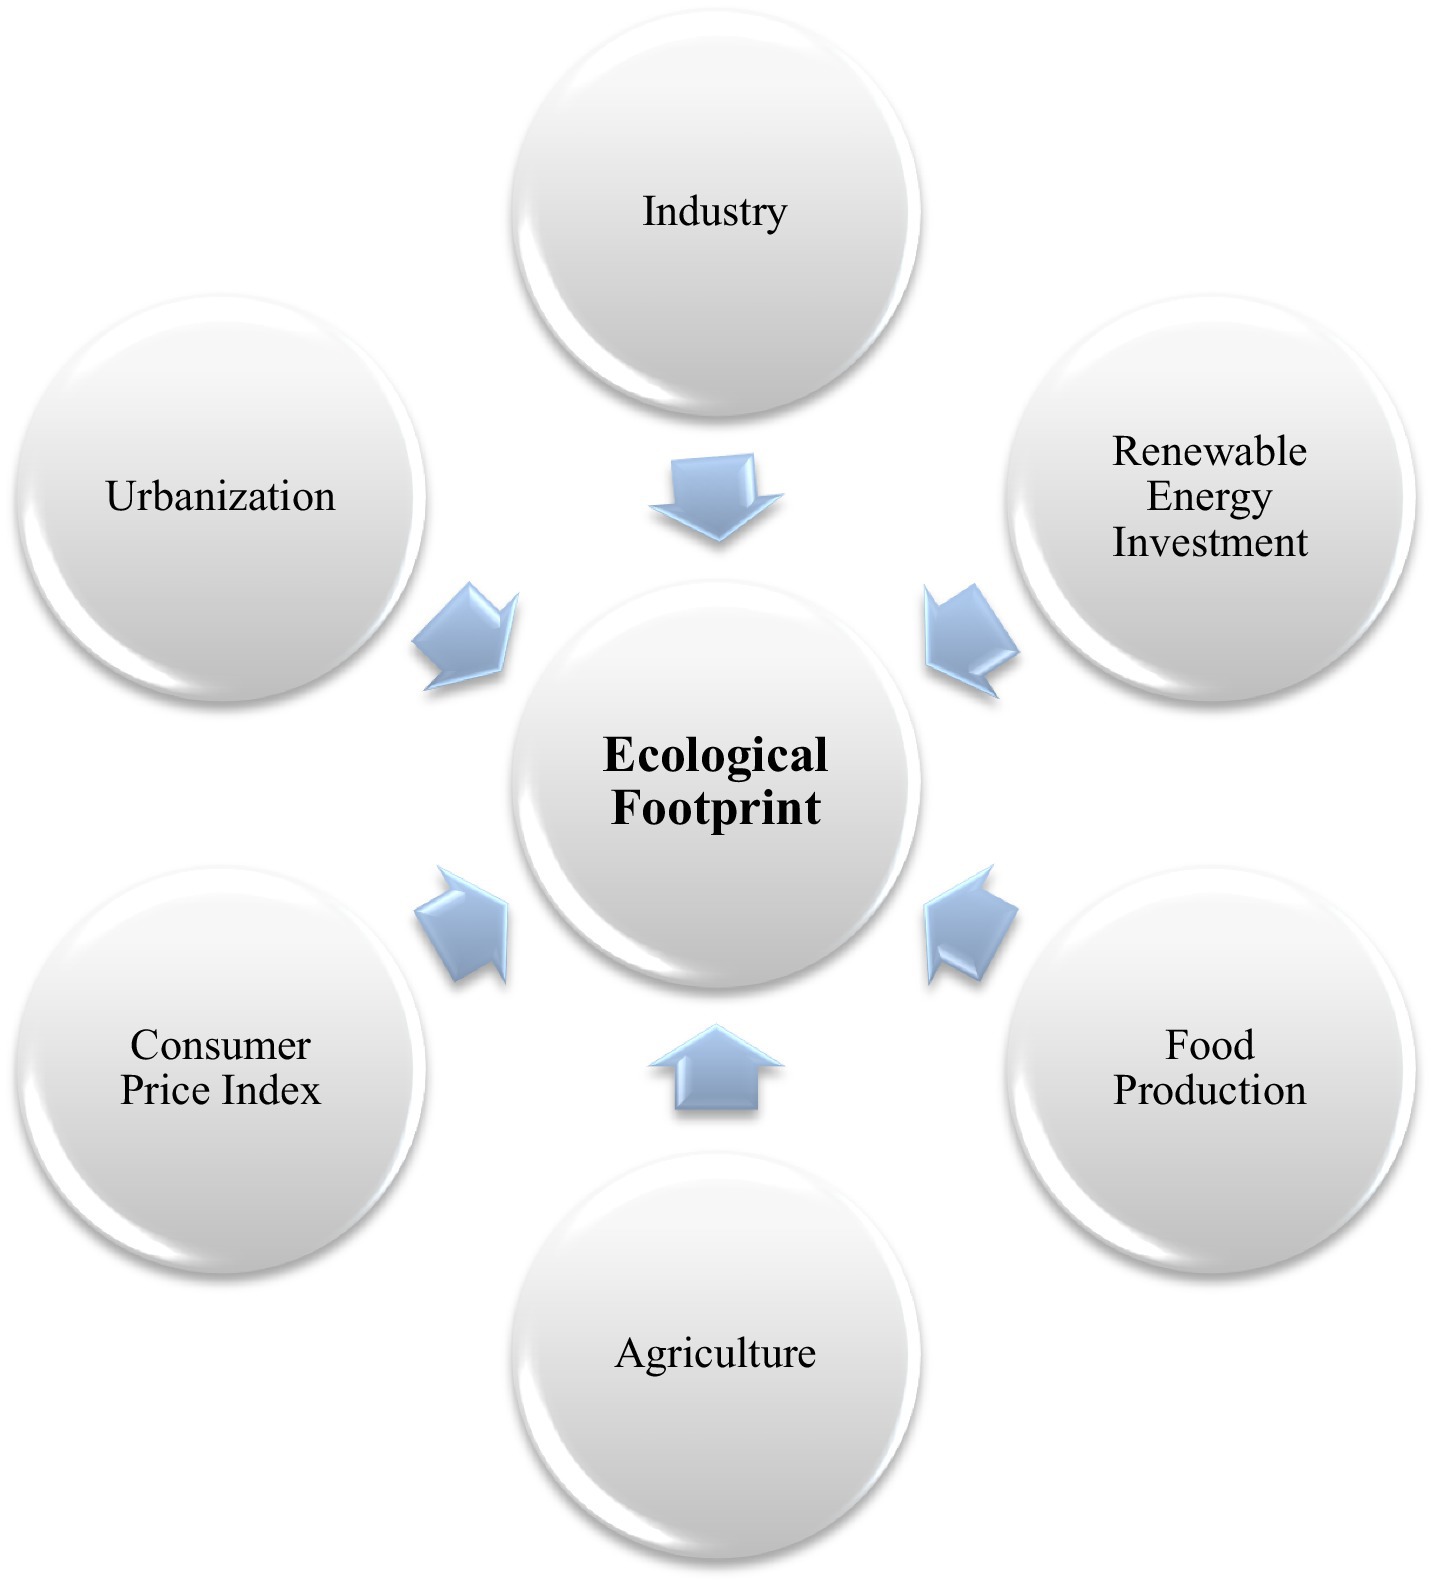
Figure 1. Conceptual framework.
2.3 Research gap
Although a substantial body of literature has explored these themes, important gaps persist. Notably, many prior studies have neglected to account for heterogeneous effects across different quantiles, which are essential for a more nuanced and robust analysis. In contrast to earlier research often conducted at the global level or within disparate national contexts this study offers a more focused investigation by examining a carefully selected group of nine Asian countries: China, Singapore, Japan, South Korea, Vietnam, Malaysia, the Philippines, Thailand, and Indonesia, over the period 1995–2020, a timeframe and regional grouping that have not been extensively studied. This geographical and temporal scope enables a deeper exploration of how these nations interact in addressing sustainable ecological footprints, thereby filling a critical void in the existing literature. Moreover, this research adopts a panel quantile regression approach to capture how the relationships between ecological footprint and key drivers, industry, agriculture, food production, renewable energy consumption, consumer price index, and urbanization vary across different levels of ecological intensity within countries. This allows for the identification of differential impacts that are often obscured in traditional mean-based models. In addition, the study incorporates the system GMM as a robustness check, which accounts for potential endogeneity, unobserved heterogeneity, and dynamic relationships among the variables, thereby ensuring more reliable and consistent estimates.
3 Methodology
3.1 Model specification
The implementation of the “panel quantile regression model” has been carried out by Koenker and Bassett (1978). “This approach has since gained worldwide recognition for its applicability as a method of statistical analysis of both linear and non-linear models across diverse fields, including environmental, social, and economic disciplines.” Panel quantile regression offers more efficient and robust estimates than other approaches such as Ordinary Least Squares (OLS) (Marasinghe et al., 2014; Salari et al., 2021). The “quantile regression” approach is widely employed by scholars in various fields such as climate change, agriculture, economy, environment, etc. (Khan I. et al., 2024; Kazemzadeh et al., 2023; Khan Q. R. et al., 2024). Therefore, this study will utilize the quantile regression approach to evaluate the influence of industrial development, food production, and renewable energy consumption on the “ecological footprint.” The mathematical expression for Equation 1 of the quantile regression approach is outlined below:
“The quantile distribution equals zero.” Quantiθ(yi/xi) represents the quantile value of the specified variable as shown in Equation 2. The regression through the use of panel quantile analysis indicates how the quantile of any endogenous variable is influenced by the quantile of explanatory variables. “In essence, it serves to scrutinize or explore the effects of a regressor on multiple quantiles of the endogenous variable.” Some researchers, like (Chowdhury et al., 2021; Salari et al., 2021), and (Quito et al., 2023) applied quantile regression in analysis following econometric theory. The model of panel quantile can be demonstrated in Equation 3 as follows:
In Equation 4 the parameter estimate can be computed as follows:
Where i represent the country, “N denotes the total number of countries included in the panel dataset (i.e., the cross-sectional dimension),” “T depicts the number of observations for the countries,” “K is the quantile index,” “X denotes the matrix of exogenous variables,” “ is the quantile loss function” and “ the relative weight for quantile.” Moreover, there is “γ that represents the tuning parameter utilized to reduce the individual effect to zero and increase the estimation of the coefficient β. In accordance with econometric theory, it is necessary for the variables in the model to be logarithmic to mitigate potential heterogeneity effects. Thus, Equation 5 is expressed as follows:
In this expression, stands for the natural logarithm of the ecological footprint for country i at time t. The explanatory variables include: stands for log of industry, stands for log of food production, stands for log of renewable energy consumption, stands for log of the consumer price index, stands for log of agriculture, and stands for log of urbanization level. Recognizing that this study employs a “quantile regression approach to evaluate the influence of diverse factors on the ecological footprint.” The model outlined in Equation 6 will aid in estimating both the coefficients of the explanatory variables and their consequent influence on the dependent variable. With this information, we can know more about the connections between “industry, food production, renewable energy consumption, agriculture, consumer price index, urbanization, and ecological footprint”.
Here, represents the estimation of “quantile regression in relation to the ecological footprint,” with a denoting a constant component. The estimates represent the parameters of quantile regression, indicating the factors that exert influence. stands for the natural logarithm of the ecological footprint for country i at time t. The explanatory variables include: stands for log of industry, stands for log of food production, stands for log of renewable energy consumption, stands for log of the consumer price index, stands for log of agriculture, and stands for log of urbanization level. Moreover, the estimated “coefficients for the quantile in the conditional distribution” can be obtained as outlined in Equation 7:
From Equation 7, it becomes evident that “panel quantile regression” is a form of weighted regression. Therefore, “this study employs the quantile regression with panel data technique pioneered by Powell (2016),” this innovative approach introduces the notion of “quantile panel data with non-additive fixed effects.” By integrating this estimator, the model preserves linearity in parameters while concurrently tackling “the non-separable disturbance term inherent in panel data during quantile estimation.” The fundamental model is articulated as follows in Equation 8:
Where denotes the endogenous variable, namely ecological footprint. “ is the vector of the exogenous variables at time t” and the individual “I.” The “β represents the vector of coefficients,” while the “U denotes the disturbance term.” Thereafter, the study employs a two-step System GMM estimator as a robustness check to empirically investigate the dynamic relationships among the selected variables. Under this approach, the analytical representation of the model is formulated as follows in Equation 9:
In this specification, α, β, and θ denote the model coefficients, while λ captures country-specific time-invariant effects, η reflects unobserved period effects, ε represents the stochastic error term, and t indicates the time dimension. After estimation, the reliability of the findings and the appropriateness of the instruments were assessed using the Hansen J-test and the Difference-in-Hansen test (Hansen, 1982). In addition, the Arellano-Bond test for serial correlation was employed to confirm the absence of second-order autocorrelation in the disturbance term, thereby strengthening the robustness of the empirical results (Arellano and Bond, 1991).
3.2 Data and source
This research employed panel data and selected nine (9) Asian countries, such as China, Singapore, Japan, South Korea, Vietnam, Malaysia, Philippines, Thailand, and Indonesia, from 1995 to 2020. The study examined various factors, including “ecological footprint, Industrialization, Agriculture, food production, renewable energy consumption, consumer price index, and urbanization,” enabling an exploration of the complex relationships between the dependent variable and the independent variables. Table 1 provides all the variables used in this study, their abbreviations, and their measures.
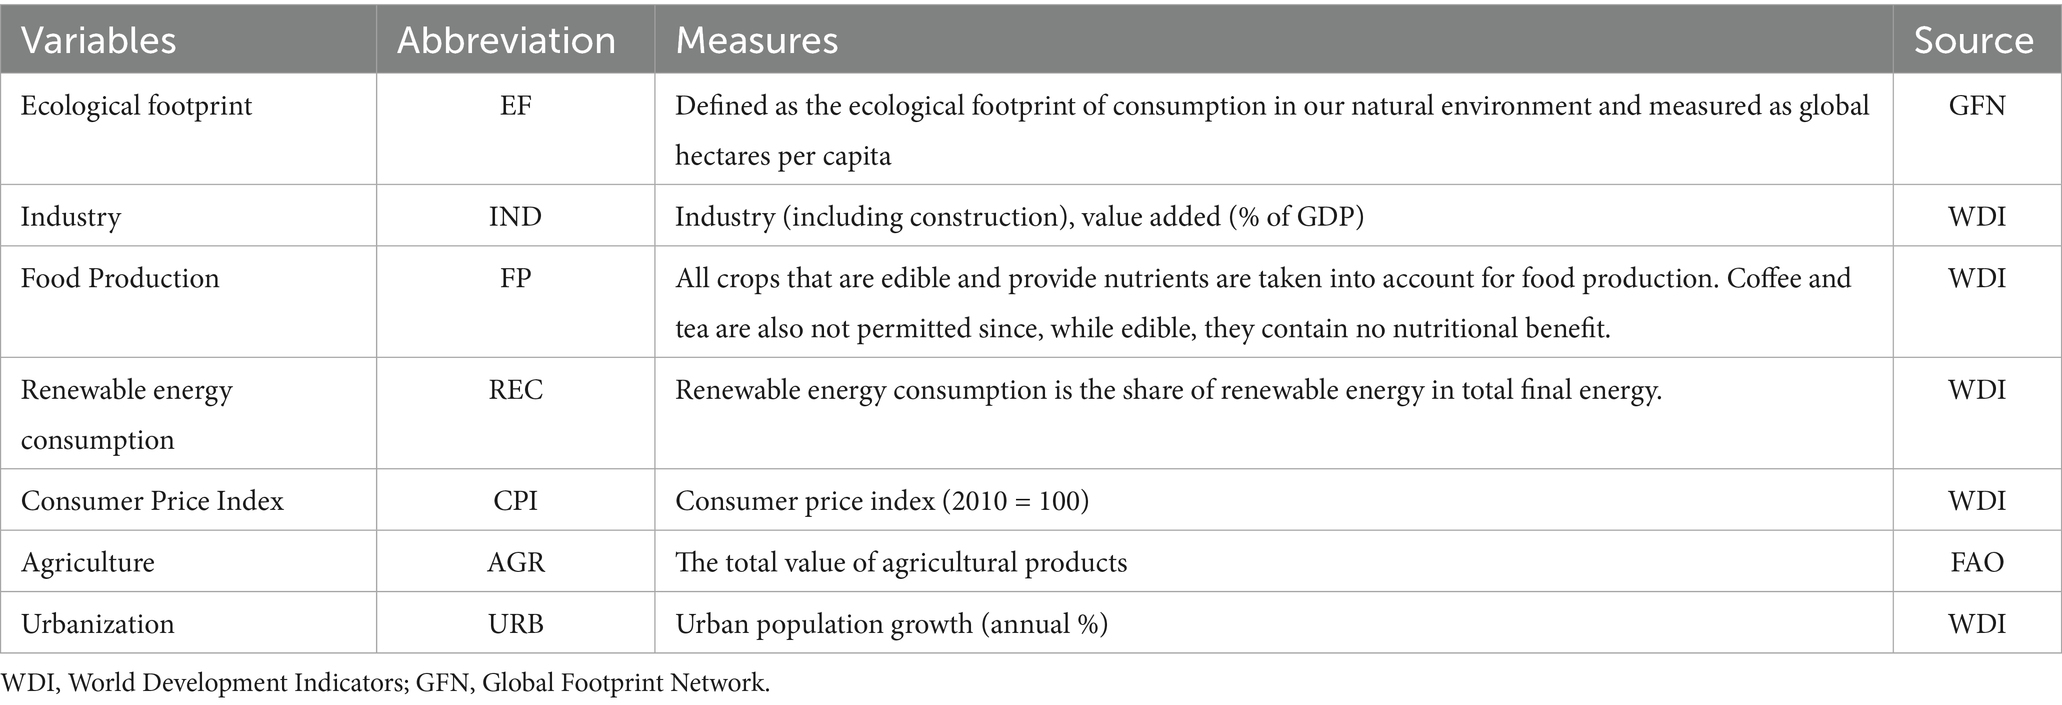
Table 1. Variables, measurement and source.
3.2.1 Variables measurement
3.2.1.1 Dependent variable
The dependent variable in this study is the ecological footprint (EF). It measures human reliance on natural resources and indicates the amount of environmental resources needed to sustain a particular lifestyle or business. This research examines a panel of nine Asian countries, data on their ecological footprints are sourced from the Global Footprint Network (GFN). Figure 2 illustrates the evolutionary trend of the ecological footprint in each country using a boxplot.
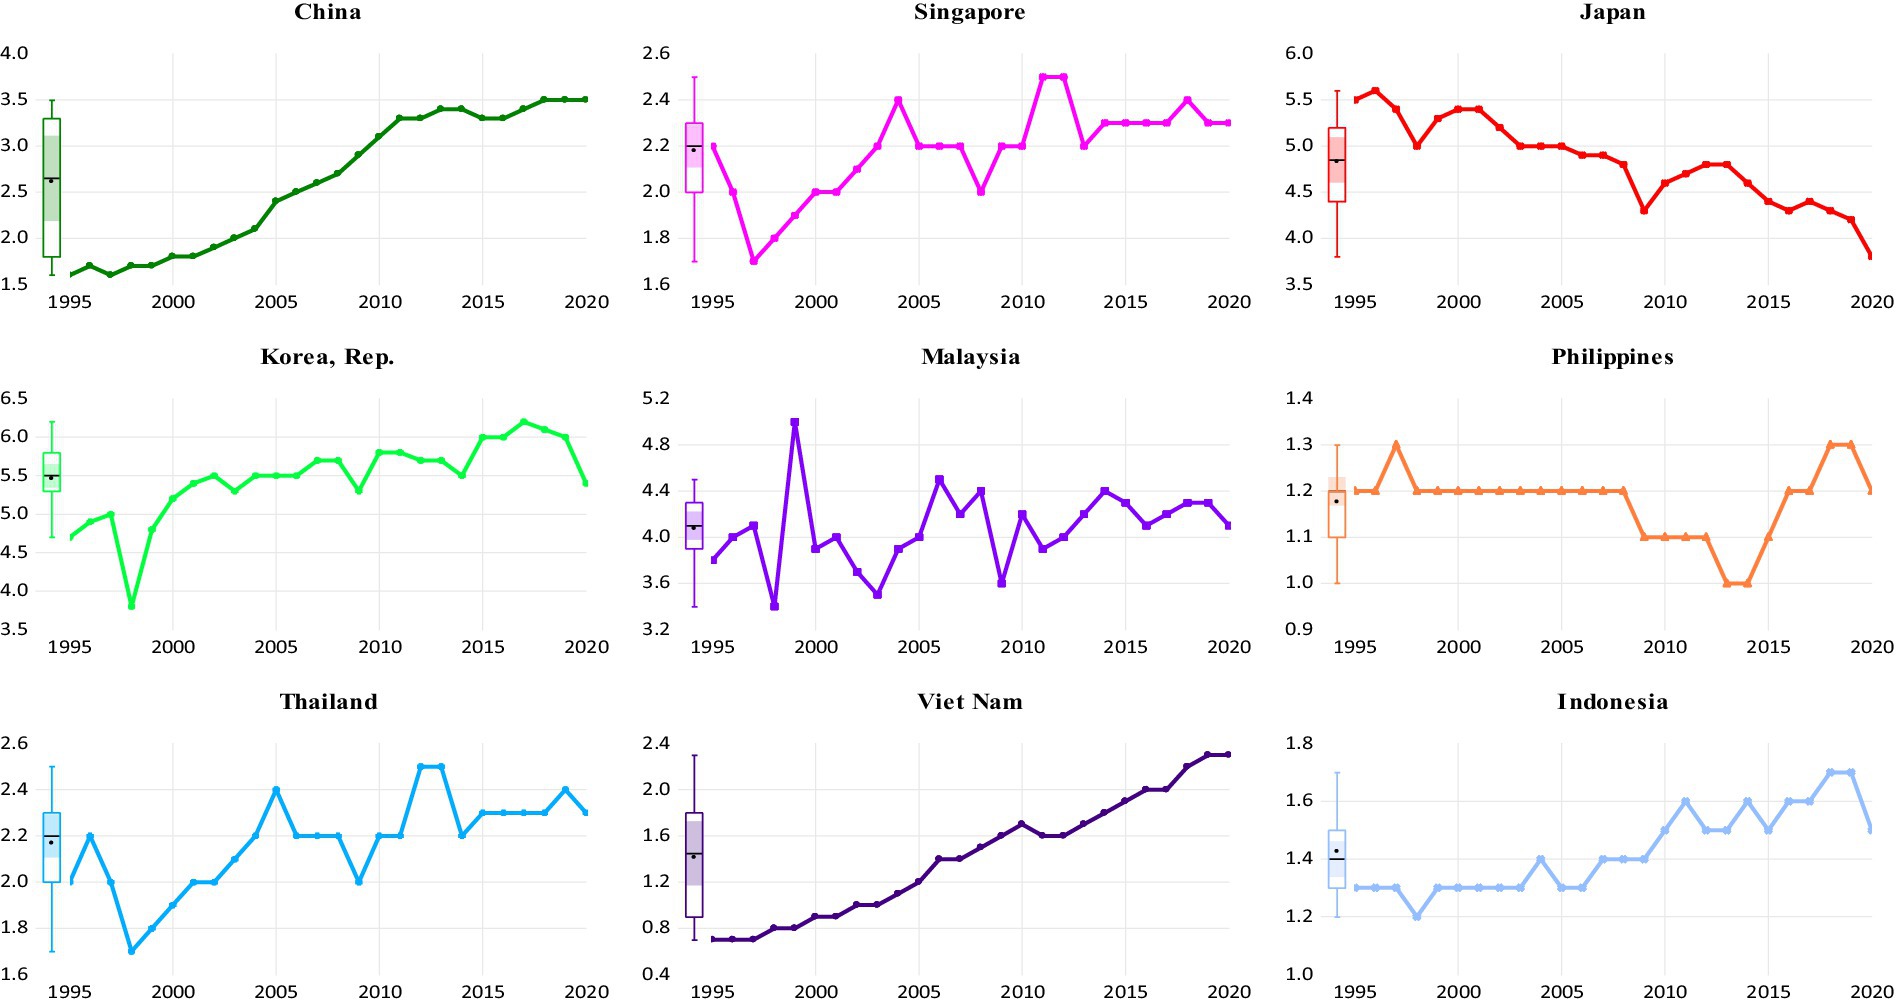
Figure 2. The trend of ecological footprint with a boxplot.
3.2.2 Independent variables
The total of agricultural (AGR) is extracted from the “Food and Agriculture Organization (FAO)” and is considered as the independent variable. “Industry (IND) is taken in terms of industry value added (% of GDP),” and “food production (FP)” in terms of crops that are edible and provide nutrients are taken into account for food production coffee and tea are also not permitted since, while edible, they contain no nutritional benefit, “renewable energy consumption (REC) in term of share of renewable energy in total final energy,” “consumer price index (CPI)” represents the consumer price index (2010 = 100), “urbanization (URB)” represent the urban population growth (annual %). These variables are considered as independent variables and sourced from the “World Development Indicators (WDI).”
4 Empirical results
4.1 Summary of descriptive statistics
Table 2 of this study presents a detailed summary of the descriptive statistics for all the variables, effectively highlighting their key characteristics. In conjunction with this, Figure 3 illustrates individual line and symbol trends, as well as box plots, for each variable across selected Asian countries, namely China, Singapore, Japan, South Korea, Vietnam, Malaysia, the Philippines, Thailand, and Indonesia.
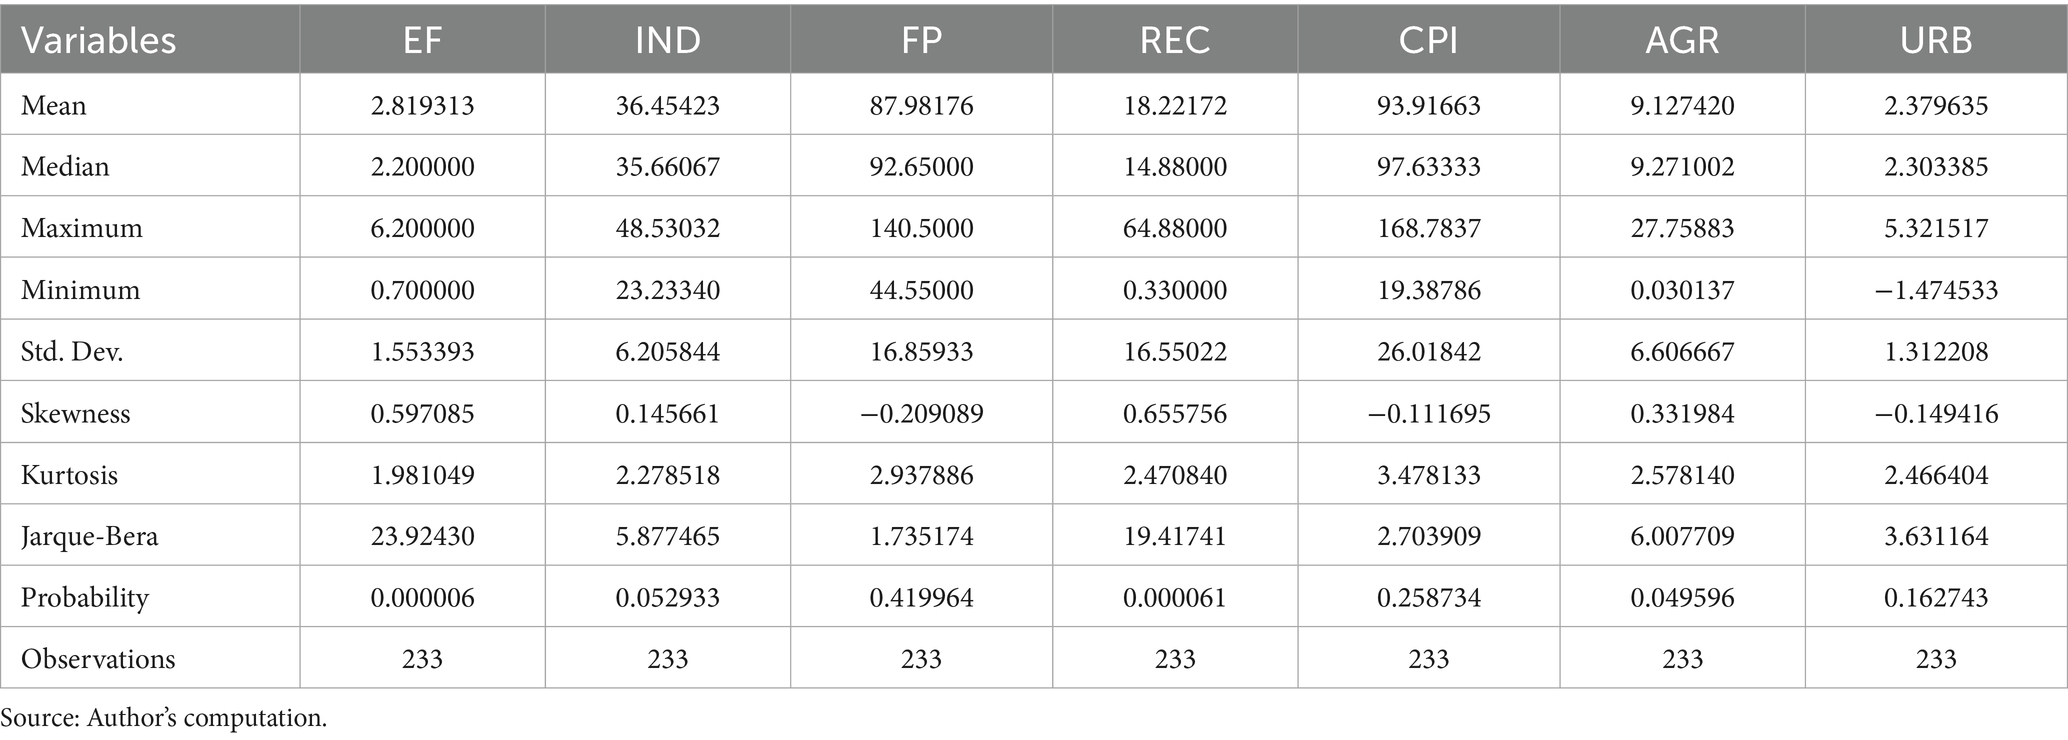
Table 2. Summary of descriptive statistics.
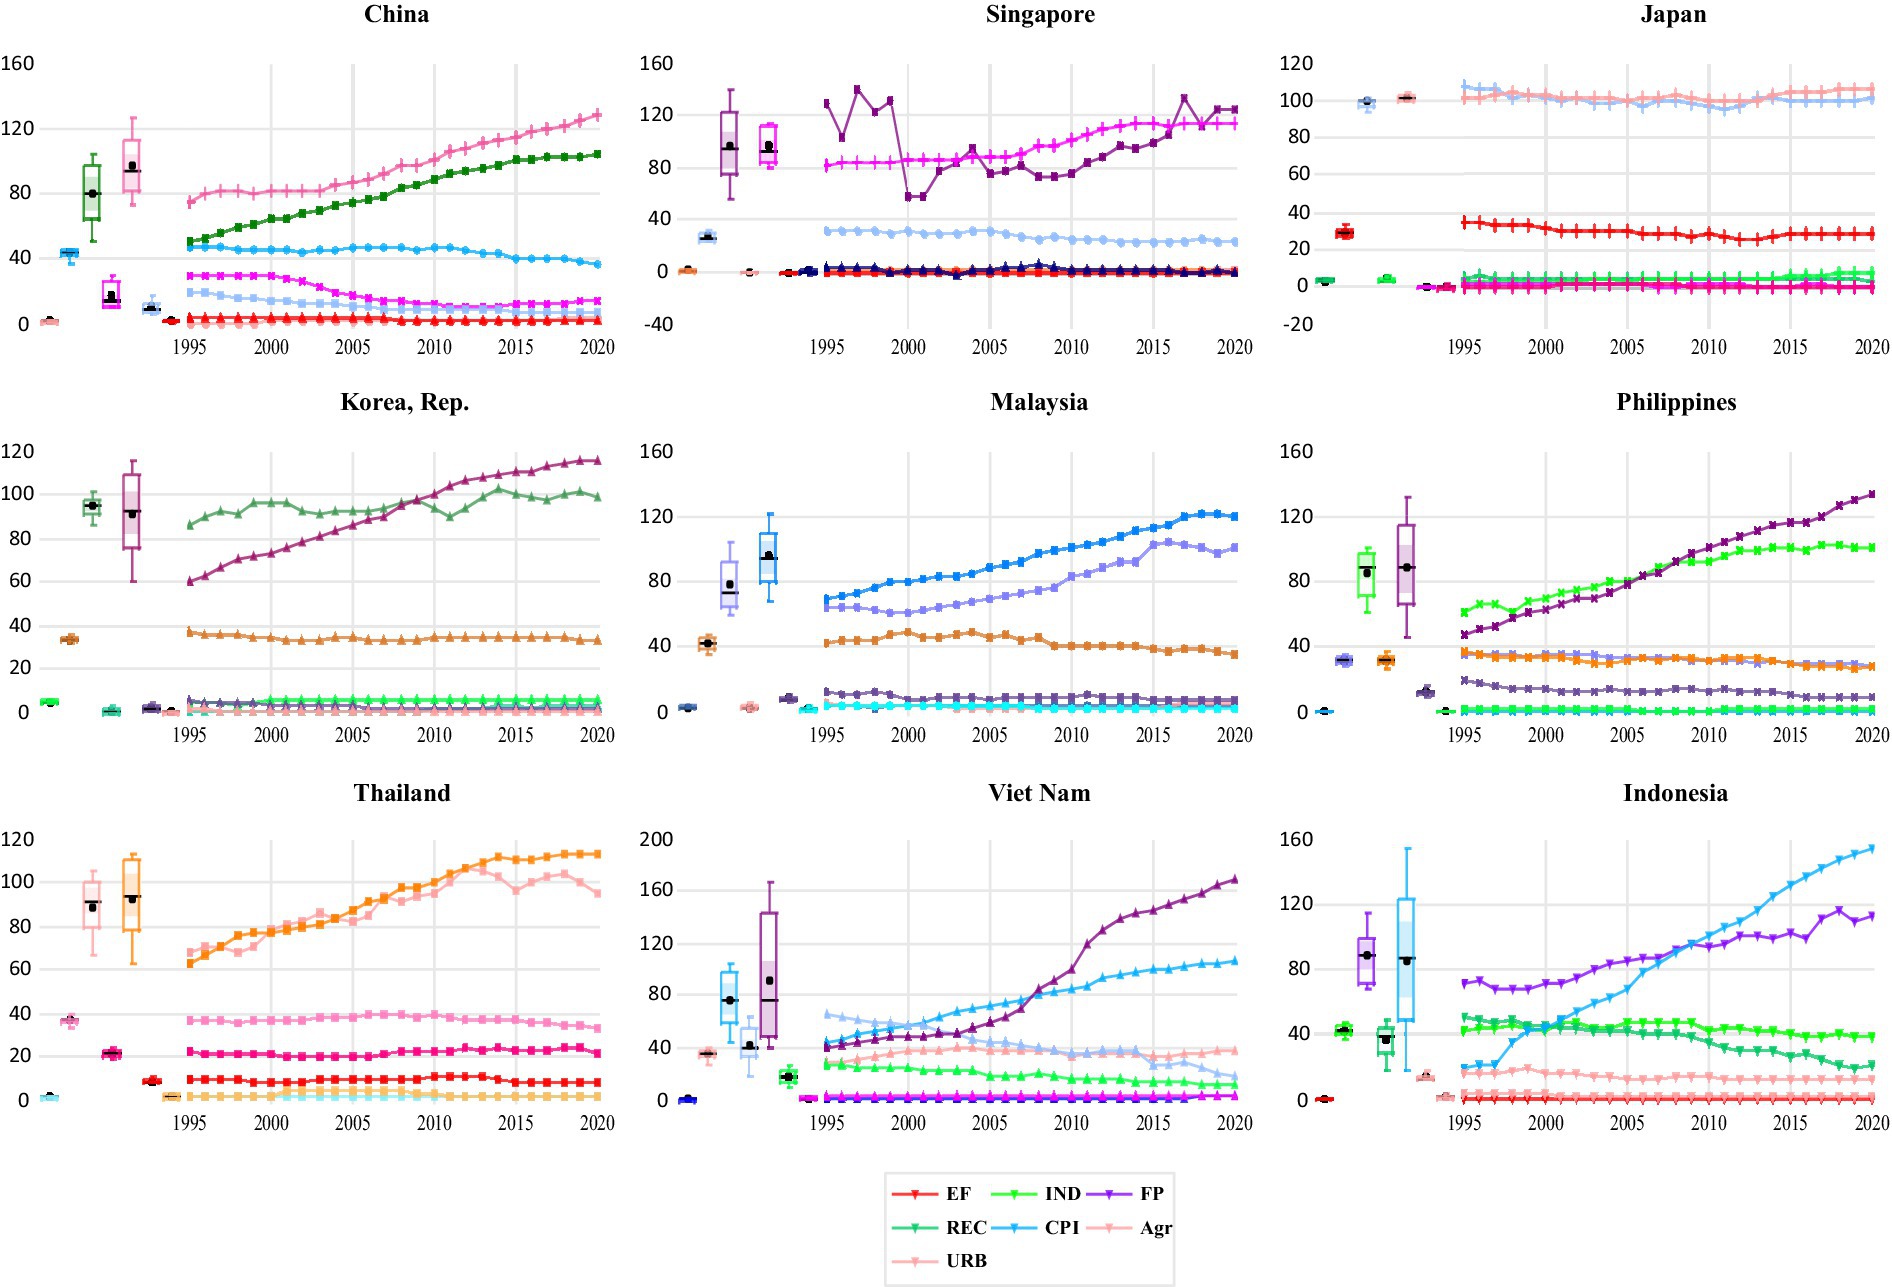
Figure 3. Individual line and symbol trends, along with box plots, for each variable.
Specifically, the ecological footprint (EF) displays a gradual upward trajectory, which indicates mounting environmental pressure over time. Correspondingly, the box plot for EF shows a relatively high median and moderate variability, suggesting a consistent increase across observations. Similarly, the industry variable reveals a strong positive trend with a steadily rising line, reflecting persistent industrial expansion. This is further corroborated by the box plot, which exhibits greater dispersion, indicating variation in industrial development among countries or over time. Moreover, food production follows a rising trend as well, although at a slower pace compared to industry. This suggests continued, albeit steady, progress in agricultural output. The box plot associated with this variable displays a narrower interquartile range, implying stability in production levels. In contrast, renewable energy consumption (REC) shows a modest upward trend accompanied by noticeable fluctuations. This pattern likely reflects inconsistencies in energy policy implementation and investment strategies. Its box plot, characterized by a low median and the presence of outliers, highlights disparities in renewable energy adoption.
Additionally, the consumer price index (CPI) exhibits a highly volatile trend, capturing inflationary shocks and short-term price dynamics. The corresponding box plot reveals significant variability, which underscores macroeconomic instability in certain regions. Likewise, agriculture demonstrates a moderate upward trajectory, emphasizing its ongoing relevance in national economies. Its box plot indicates moderate dispersion, which could be attributed to differences in land use efficiency or technological adoption. Furthermore, urbanization consistently trends upward, illustrating the widespread demographic shift toward urban living. The associated box plot reveals a high median and closely clustered data points, signifying relatively uniform urban growth among the countries studied.
Complementing these visual trends, Table 2 also provides valuable insights into the statistical distribution of the variables, including measures of central tendency, dispersion, skewness, kurtosis, and results from normality tests. For instance, EF has a mean of 2.819313 and a median of 2.200000, reflecting a slight right skew and moderate kurtosis. Industry (IND), with a mean of 36.45423, appears approximately normally distributed. In contrast, food production (FP) shows an average of 87.98176, a slightly negative skew, and elevated kurtosis. Renewable energy consumption (REC) records a mean of 18.22172, marked by positive skewness and notable kurtosis, whereas CPI, with a mean of 93.91663, shows minimal skewness and somewhat elevated kurtosis. Agriculture (AGR) and urbanization (URB) display means of 9.127420 and 2.379635, respectively, both demonstrating relatively low levels of skewness and kurtosis. Notably, the Jarque-Bera test indicates significant departures from normality for EF (23.92430) and REC (19.41741), as evidenced by p-values below the 0.05 threshold. These findings confirm non-normal distributions for these variables. Lastly, each variable is based on 233 observations, ensuring the robustness and reliability of the dataset used in this analysis.
4.2 Correlation matrix
Table 3 displays a correlation matrix that shows how the variables analyzed in the study are related to each other. The ecological footprint (EF) exhibits a weak negative correlation with industry (−0.1465), indicating a slight inverse relationship between these factors. Additionally, food production shows a moderate positive correlation with EF (0.3092), suggesting that higher levels of food production are associated with a larger ecological footprint. Moreover, renewable energy consumption demonstrates a strong negative correlation with EF (−0.7706), indicating that greater use of renewable energy is linked to a smaller ecological footprint. The consumer price index correlates positively with FP (0.6944) and moderately with EF (0.2254), suggesting that higher consumer prices are associated with increased food production and a larger ecological footprint. Furthermore, agriculture shows a strong negative correlation with EF (−0.6725), suggesting that agricultural activity is inversely related to the ecological footprint. Urbanization correlates moderately negatively with EF (−0.4997), indicating that higher levels of urbanization are associated with a smaller ecological footprint. Regarding multicollinearity issues among the variables, it has been noted that the coefficients between the variables all fall below 0.8. This indicates the absence of multicollinearity problems among the variables.
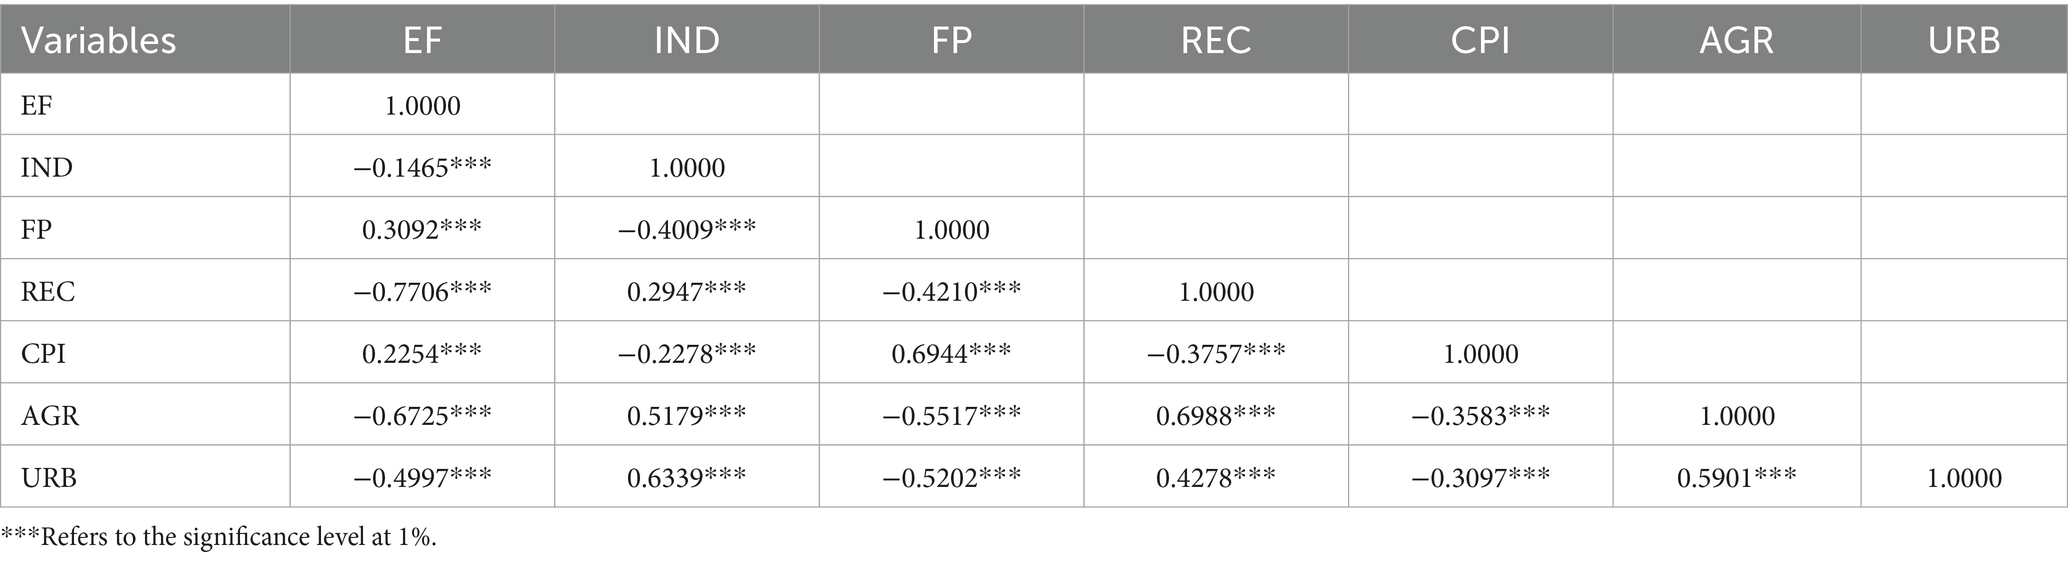
Table 3. Correlation matrix.
4.3 Cross-sectional dependence test
Table 4 offers findings from tests assessing “cross-sectional dependence.” All variables tested indicate highly significant results with p-values of 0.0000, indicating strong evidence of interdependence among these variables across different observations. This suggests they are not independent within the dataset. For instance, renewable energy consumption shows significant results in Breusch-Pagan LM, Pesaran scaled LM, and BCSLM tests (p-values = 0.0000), but a non-significant result in the Pesaran CD test (p-value = 0.2151). This discrepancy suggests REC may exhibit distinct patterns of cross-sectional dependence compared to the other variables. These findings emphasize the need to consider and account for cross-sectional dependence when analyzing the relationships among variables in the study.
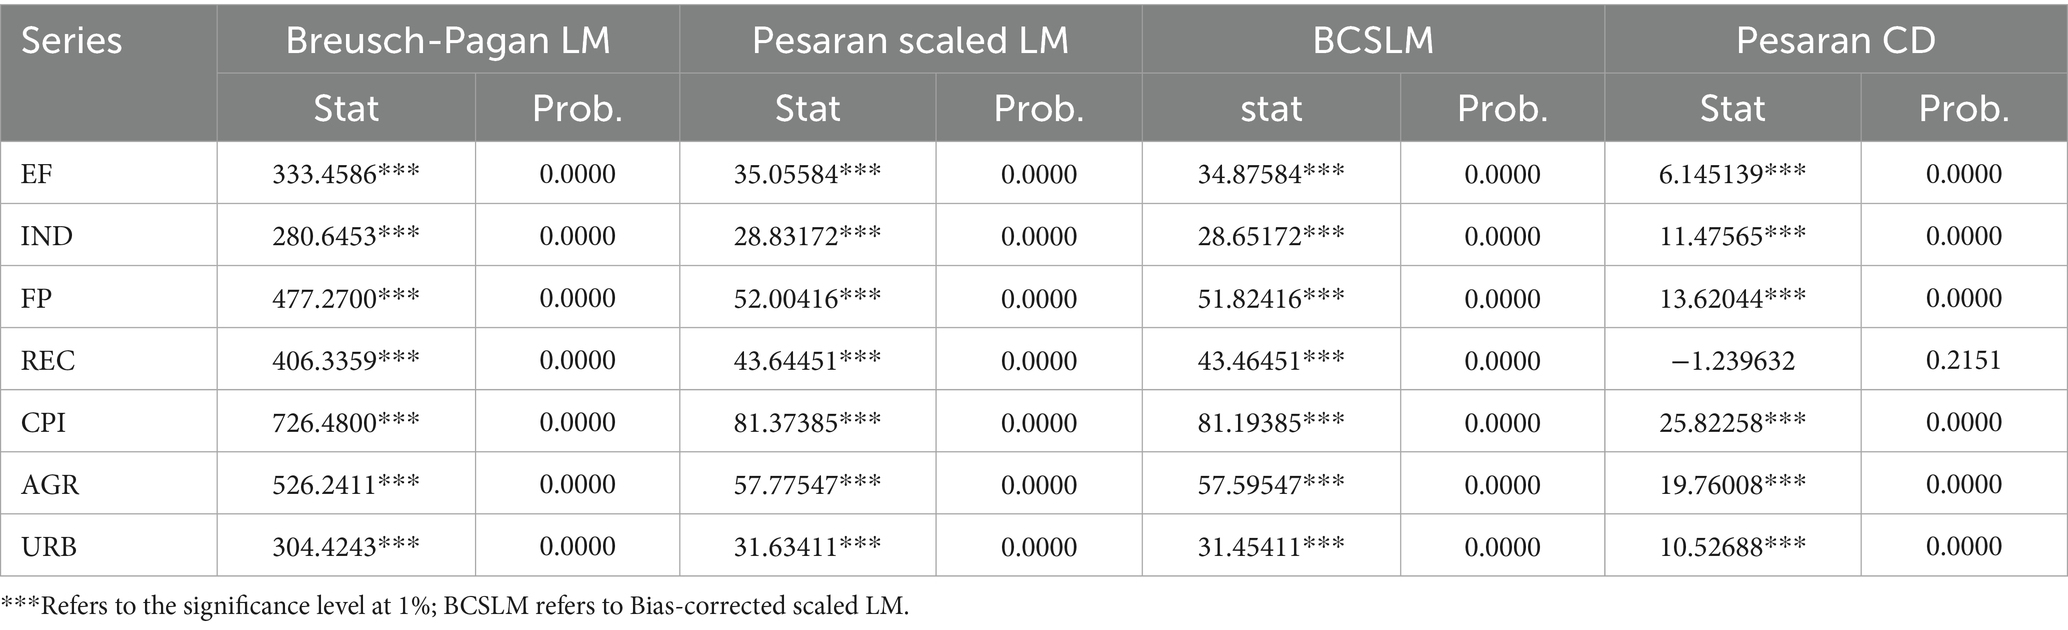
Table 4. Cross-sectional dependence test.
4.4 Slope homogeneity outcome
The results displayed in Table 5, which pertain to the slope homogeneity test, reveal significant findings regarding the variation in slopes across the observed data. The Delta statistic is reported as 6.403, accompanied by a probability value of 0.0000, indicating a statistically significant presence of heterogeneity among the slopes. This suggests that the relationship between the variables is not uniform across the sample; rather, it varies significantly from one observation to another. Moreover, the Adjusted Delta statistic is also noteworthy, with a value of 3.463 and a corresponding probability of 0.0000. This further reinforces the conclusion that there is substantial variation in the slopes, even after adjusting for other factors. The low p-values associated with both statistics confirm the reliability of these results, implying that the slopes differ meaningfully across the dataset.

Table 5. Slope homogeneity.
4.5 First genration unit root test
The outcomes from Table 6 detail the findings from the panel unit root tests Levin, Lin & Chu (LLC), Im, Pesaran and Shin (IPS), ADF-Fisher, and PP-Fisher demonstrate distinct integration properties across the variables under study. The ecological footprint (EF), industry (IND), food production (FP), renewable energy consumption (REC), consumer price index (CPI), and urbanization (URB) are all non-stationary at their levels, as evidenced by the inability of the majority of tests to reject the null hypothesis of a unit root. However, once these variables are first differenced, all four tests uniformly reject the null at the 1% significance level, indicating that they are stationary in their first difference form and thus integrated of order one, I(1). In contrast, agricultural activity (AGR) stands out as the only variable that is stationary at level, with all unit root tests strongly rejecting the presence of a unit root. Overall, the findings suggest that while AGR is level-stationary, the remaining variables EF, IND, FP, REC, CPI, and URB exhibit stationarity only after first differencing.
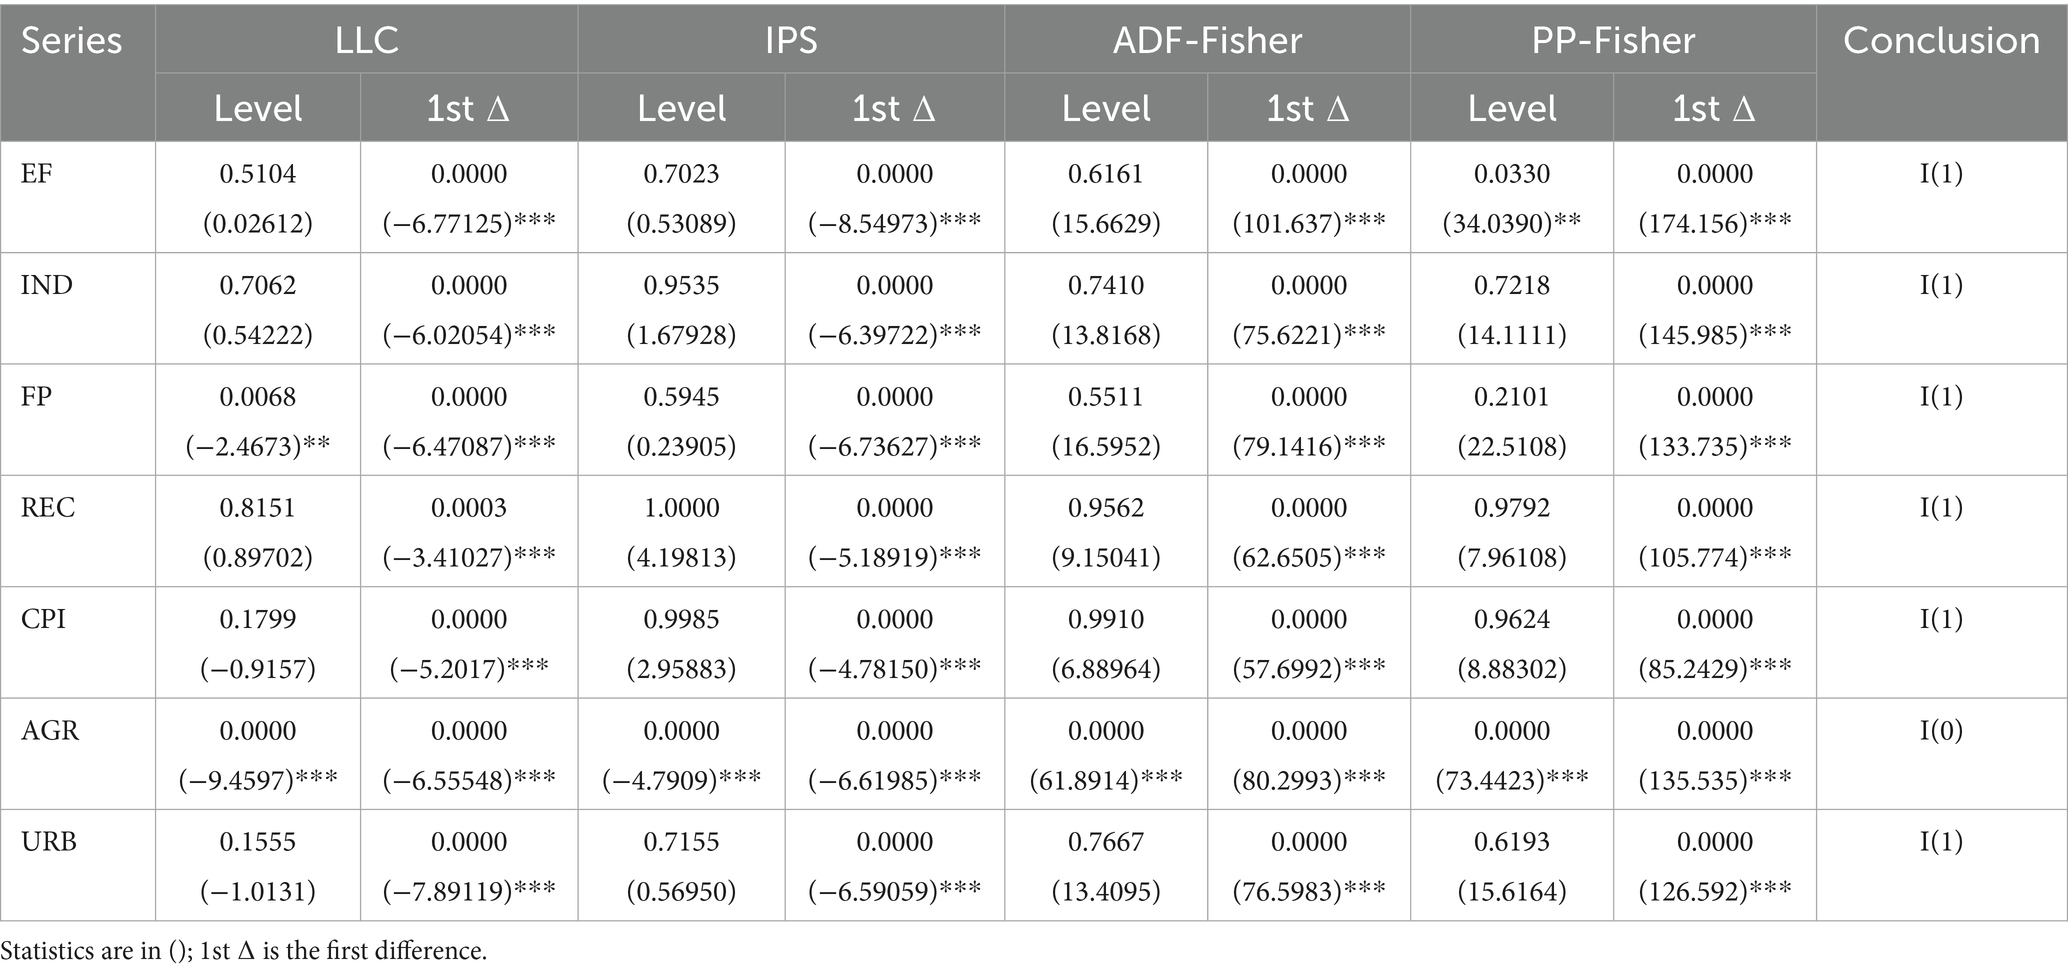
Table 6. Panel unit root test results.
4.6 Second generation unit root CIPS and CADF results
Table 7 presents the results of the second-generation unit root tests CIPS and CADF, indicating that most variables are non-stationary at their level form but become stationary after first difference, thus confirming they are integrated of order one (I(1)). Specifically, ecological footprint (EF), industry (IND), renewable energy consumption (REC), consumer price index (CPI), agriculture (AGR), and urbanization (URB) exhibit non-stationarity at the level in both tests; however, they show statistically significant stationarity at the 10% level after first differencing. Conversely, food production (FP) is the only variable found to be stationary at the level, as both CIPS and CADF tests report significant values without the need for differencing, indicating it is integrated of order zero (I(0)).
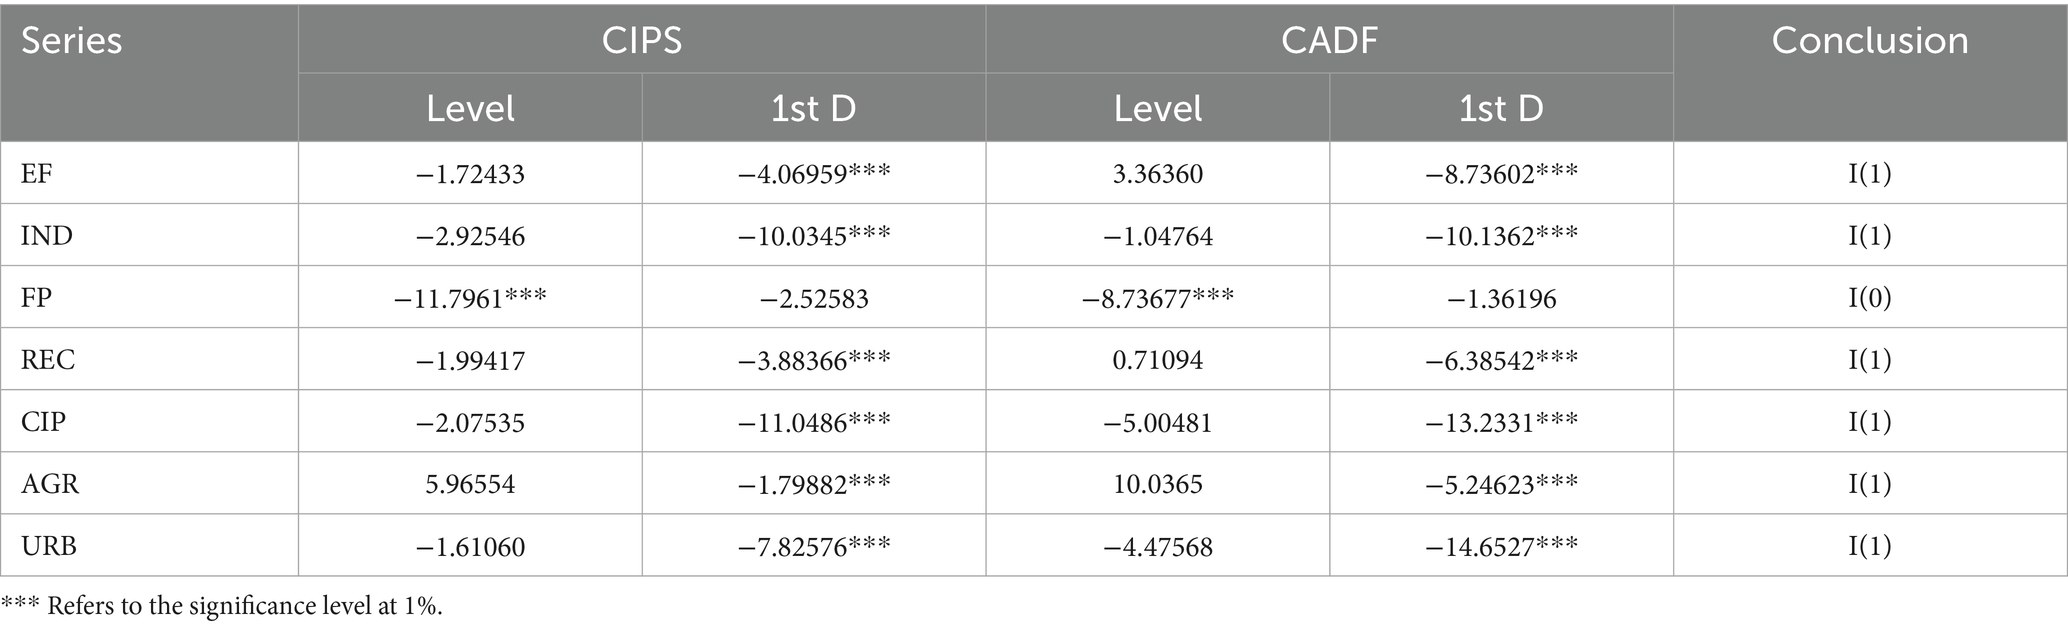
Table 7. Second generation unit root CIPS and CADF results.
4.7 Westerlund cointegration test
The results displayed in Table 8, which summarize the findings of the Westerlund Cointegration Test, offer significant insights into the long-term relationships among the variables studied. The Gτ statistic shows a value of −6.181, accompanied by a z-value of 5.899 and a p-value of 0.004. This suggests a strong rejection of the null hypothesis of no cointegration, indicating that a long-term equilibrium relationship exists among the variables. Similarly, the Gα statistic is recorded at −6.113, with a Z-value of 4.364 and a highly significant p-value of 0.000. This further corroborates the presence of cointegration, reinforcing the notion of a stable long-term relationship among the variables under consideration. In addition, the Pτ statistic registers at −7.153, with a Z-value of 6.385 and a p-value of 0.000. This result also leads to a rejection of the null hypothesis, highlighting the robustness of the cointegration relationship among the series analyzed. Finally, the Pα statistic is reported at −5.365, featuring a z-value of 7.738 and a p-value of 0.000. This further confirms the presence of cointegration, suggesting that these variables maintain a long-term relationship despite short-term fluctuations.
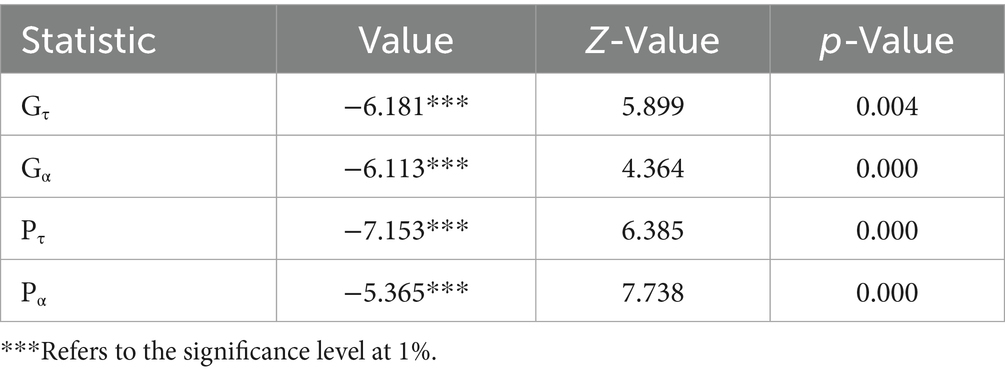
Table 8. Westerlund cointegration test.
4.8 Panel data quantile modeling
The results of the “panel quantile regression analysis” combine with the discussion are presented in Table 9. The findings are presented across various percentiles (10th–90th) of the conditional distribution of ecological footprint (EF), allowing for a detailed examination of the impacts of different factors. The empirical results highlight the diverse effects of various factors on the ecological footprint, and further analysis of additional effects should also be considered. This analysis aims to assist the selected countries in formulating policies aimed at reducing their “ecological footprint.”
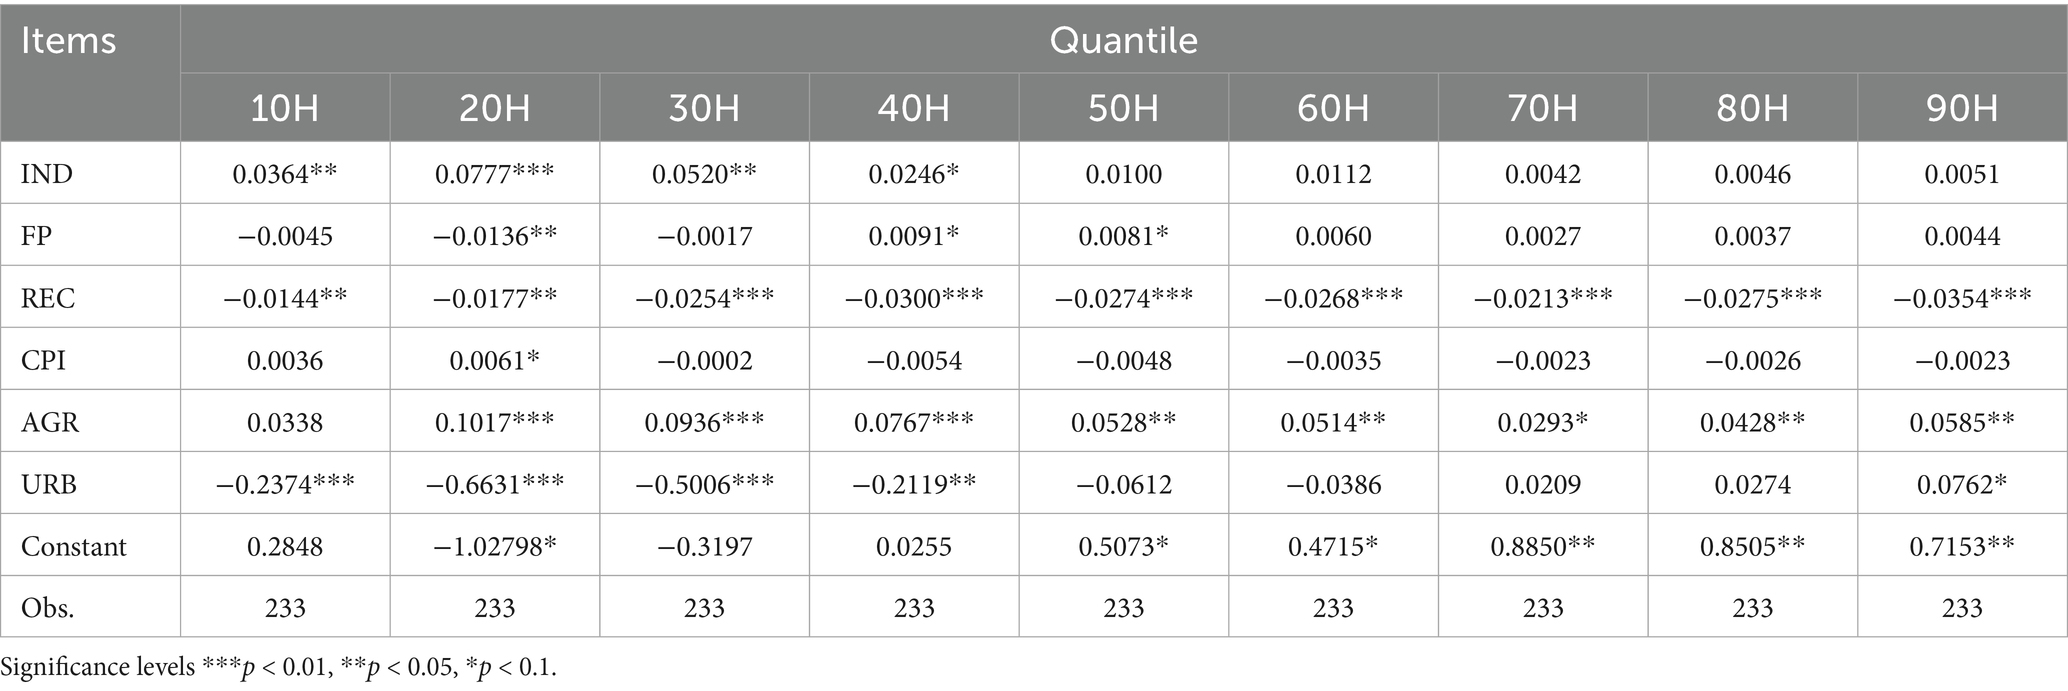
Table 9. Panel quantile regression with ecological footprint (EF) as dependent variable.
The findings regarding the influence of industry on ecological footprint across various quantiles of countries consistently demonstrate a positive and statistically significant impact. Particularly noteworthy is the heightened significance of this impact observed in quantiles exceeding 20H and 30H. These conclusions are corroborated by the investigation carried out by Chen et al. (2022) and Quito et al. (2023). These studies reached similar conclusions, emphasizing the positive and significant influence of industrialization on ecological footprint. Furthermore, they suggested that governments of different countries should actively capitalize on this opportunity by fostering the development of the industrial sector, intensifying investments in human capital, and expediting the modernization of energy sectors (Chen et al., 2022; Quito et al., 2023). This underscores the importance of strategic policy interventions aimed at harnessing the positive impacts of industrialization on ecological sustainability. These insights are particularly relevant to the United Nations Sustainable Development Goals (SDGs), notably SDG 9 (Industry, Innovation, and Infrastructure), SDG 7 (Affordable and Clean Energy), and SDG 13 (Climate Action), which collectively emphasize the importance of promoting sustainable industrial growth while mitigating environmental impacts.
The relationship between food production and the ecological footprint exhibits a distinct nonlinear pattern across various quantiles. Specifically, the analysis reveals statistically significant negative effects in the 10th, 20th, and 30th quantiles, suggesting that in economies or regions experiencing lower levels of ecological pressure, increased food production may contribute to environmental improvement. This inverse relationship could be attributed to the adoption of resource-efficient agricultural practices, technological innovations in crop management, and sustainable land use, which collectively enhance productivity while minimizing ecological harm (Ali et al., 2021; Setsoafia et al., 2022). In such contexts, the transmission mechanism operates through gains in efficiency, reduced waste, and conservation-oriented production systems. Conversely, in the higher quantiles (40th–90th) which correspond to more ecologically burdened environments, the impact of food production becomes positive and statistically significant, indicating a tendency toward environmental degradation. This outcome may be driven by the intensification of agriculture beyond sustainable limits, involving increased use of synthetic fertilizers and pesticides, encroachment into marginal lands, and a heavier reliance on energy-intensive mechanization and livestock production (Ali et al., 2021; Aschemann-Witzel et al., 2023; Bambi and Pea-Assounga, 2025). Through this transmission channel, the expansion of food output exacerbates ecological stress via deforestation, greenhouse gas emissions, and depletion of soil and water resources. These findings align with prior empirical research underscoring agriculture’s dual role: while sustainable intensification can mitigate environmental impacts, unchecked intensification under high ecological load tends to amplify environmental degradation (Liao and Brown, 2018; Saqib et al., 2024). Ultimately, the environmental outcome of food production hinges not solely on scale, but critically on production methods, resource constraints, and ecological context. This aligns directly with the objectives of SDG 2 (Zero Hunger), SDG 12 (Responsible Consumption and Production), and SDG 13 (Climate Action), highlighting the importance of promoting sustainable agricultural intensification that secures food availability while preserving environmental integrity.
The impact of renewable energy consumption on ecological footprint demonstrates a consistent negative and statistically significant effect. This effect appears to be particularly pronounced in quantile 40H, with a coefficient of −0.0300, and escalates in quantile 90H, reaching a coefficient of −0.0354. This pattern aligns with the findings of Li et al. (2022) in their study titled “Does renewable energy reduce ecological footprint at the expense of economic growth?,” which also confirms the negative effect of “renewable energy consumption” on “ecological footprint.” “These results suggest that higher levels of renewable energy consumption contribute to reducing the ecological footprint, especially in countries with larger ecological footprints.” Furthermore, Levine and Kendall (2006) provide additional support for these findings, demonstrating that improving energy consumption efficiency represents a pivotal and effective approach to addressing ecological challenges. This convergence of evidence underscores the importance of prioritizing renewable energy investments and enhancing energy efficiency measures as integral components of sustainable development strategies aimed at mitigating environmental impacts. This is fully consistent with the aims of SDG 7 (Affordable and Clean Energy), SDG 13 (Climate Action), and SDG 12 (Responsible Consumption and Production), which collectively emphasize the promotion of clean energy adoption and resource efficiency as key strategies for reducing environmental pressures and ensuring long-term ecological sustainability.
The analysis of the consumer price index (CPI) demonstrates a nonlinear and asymmetric relationship with the ecological footprint across different quantiles. Notably, CPI exerts positive and statistically significant effects in the lower quantiles (10th and 20th), while negative and statistically significant effects are observed from the 30th through the 90th quantiles. This variation suggests the existence of diverse transmission mechanisms shaped by differences in environmental stress levels, consumption behavior, and macroeconomic structure. In the lower quantiles (10H and 20H), typically reflective of economies with relatively low ecological pressure and less stringent environmental controls, a rise in CPI may signal inflationary trends that stimulate increased domestic output, particularly in resource-intensive sectors such as agriculture, manufacturing, and energy. This production surge, driven by persistent demand and the limited responsiveness of essential goods to price changes, may heighten resource extraction and environmental degradation, thus elevating the ecological footprint. These findings align with the arguments of Limnios et al. (2009) and Semenova (2024), who emphasize that inflation in such contexts often leads to higher emissions and resource consumption due to weak regulatory frameworks and inelastic demand. On the other hand, the negative and significant effects from the 30th to the 90th quantiles suggest that in more ecologically burdened or economically mature settings, rising CPI tends to suppress consumption and industrial activity, leading to a contraction in energy usage and material throughput. This dampening effect on economic activity contributes to a decline in environmental pressure, consistent with the observations of Rondoni and Grasso (2021). In these economies, inflation often prompts a shift toward less resource-intensive consumption, more efficient production practices, and stronger policy enforcement, as noted by Bocken and Allwood (2012). Additionally, persistent inflationary pressures may drive behavioral and technological adaptations, including the adoption of energy-efficient appliances, sustainable transportation, and eco-conscious consumption, all of which serve to reduce the ecological footprint, supporting the insights of Beyer et al. (2024).
The findings reveal that agriculture (AGR) exerts a positive and statistically significant impact on the ecological footprint (EF) across the 20th to 90th quantiles, with the most pronounced effect at the 20th quantile (0.1017) and a moderate increase again at the 90th quantile (0.0585), while the effect in the 10th quantile (0.0338) remains statistically insignificant. This suggests that as agricultural activity expands, it increasingly contributes to environmental degradation, particularly in regions with moderate to high ecological stress. This relationship operates through several key transmission mechanisms. To begin with, the conversion of forests and natural ecosystems into agricultural land drives deforestation, biodiversity loss, and elevated carbon emissions (Kronberg and Ryschawy, 2019). Additionally, the excessive use of agrochemicals such as fertilizers and pesticides pollutes soil and water systems, exacerbating ecological harm. Furthermore, agriculture is a major consumer of freshwater, and unsustainable irrigation practices contribute to water scarcity and land degradation. The sector is also a significant emitter of greenhouse gases, particularly methane from livestock and nitrous oxide from nitrogen-based fertilizers (Johns et al., 2013; Kremen et al., 2012). In more industrialized agricultural systems, the use of energy-intensive machinery and transport further adds to environmental pressure. Collectively, these findings support the notion that while agriculture can be environmentally sustainable under certain conditions, unchecked intensification leads to greater ecological burden (Kronberg and Ryschawy, 2019). As such, it is crucial to promote sustainable and climate-resilient agricultural practices, aligning with the targets of SDG 2 (Zero Hunger), SDG 12 (Responsible Consumption and Production), and SDG 13 (Climate Action), all of which emphasize the need for productive yet environmentally responsible food systems.
The findings on urbanization’s effect on the ecological footprint demonstrate a complex and heterogeneous relationship, with six quantiles showing statistically significant negative impacts and three quantiles exhibiting positive effects, particularly pronounced at the 20th and 30th quantiles. This indicates that the environmental consequences of urbanization vary considerably depending on a country’s stage of development and the robustness of its urban infrastructure. In economies corresponding to the lower and middle quantiles, the positive association between urbanization and ecological footprint suggests that rapid and often unplanned urban growth tends to intensify environmental degradation. This can be explained by the proliferation of informal settlements, insufficient waste management, increasing energy demands, and inefficient transportation systems, all of which contribute to resource depletion and pollution (Sahoo and Sethi, 2022; Ulucak and Khan, 2020). The lack of comprehensive urban planning and weak regulatory frameworks in these regions further exacerbates the ecological burden associated with urban expansion. Conversely, the negative and significant effects observed in higher quantiles reflect situations where urbanization coincides with improved governance, advanced infrastructure, and sustainable urban planning. In such contexts, cities benefit from efficient public transportation, effective waste treatment, and the implementation of green technologies, which collectively mitigate environmental harm (Luo et al., 2018; Ullah et al., 2023). Furthermore, urban areas in these economies often experience a structural shift toward service-oriented and technology-driven sectors that typically exert lower ecological pressure compared to traditional manufacturing or agriculture (Mehmood, 2024). Additionally, urban concentration in developed regions promotes spatial efficiency by reducing per capita resource consumption through economies of scale in energy use and public services (Nathaniel and Khan, 2020). Such densification fosters sustainable urban development and helps limit the ecological footprint despite increasing population density. This is fully aligned with the objectives of SDG 11 (Sustainable Cities and Communities), SDG 13 (Climate Action), and SDG 12 (Responsible Consumption and Production), as these targets emphasize the vital importance of integrated urban planning, resilient infrastructure development, and sustainable resource management in mitigating the ecological implications of expanding urbanization.
The constant term (constant) varies across quantiles, representing the baseline level of ecological footprint not explained by the independent variables. These findings provide insights into how industrialization, food production, renewable energy consumption, consumer price index, agriculture, and urbanization influence ecological footprint across different quantiles, reflecting the complex dynamics within the dataset encompassing 233 observations.
4.9 Quantile process estimate
Figure 4 presents the quantile regression estimates along with their corresponding confidence intervals across the distribution of ecological footprint (EF). The shaded areas represent 95% confidence bands for the quantile estimates, offering insight into the precision and variability of the coefficients at different quantiles. The vertical axis captures the elasticity of each explanatory variable, illustrating the extent and direction of their effects across the EF distribution. Meanwhile, the horizontal lines indicate the conventional 95% confidence intervals derived from ordinary least squares (OLS) estimates, serving as a reference point for evaluating the robustness of the quantile regression results. By contrasting the quantile-specific estimates with the average effects from OLS, the figure underscores the presence of heterogeneity in the determinants of EF. This nuanced visualization affirms the methodological advantage of quantile regression in uncovering variations in environmental impacts that would otherwise remain obscured in mean-based models, thereby offering richer insights for more targeted and equitable environmental policy formulation.
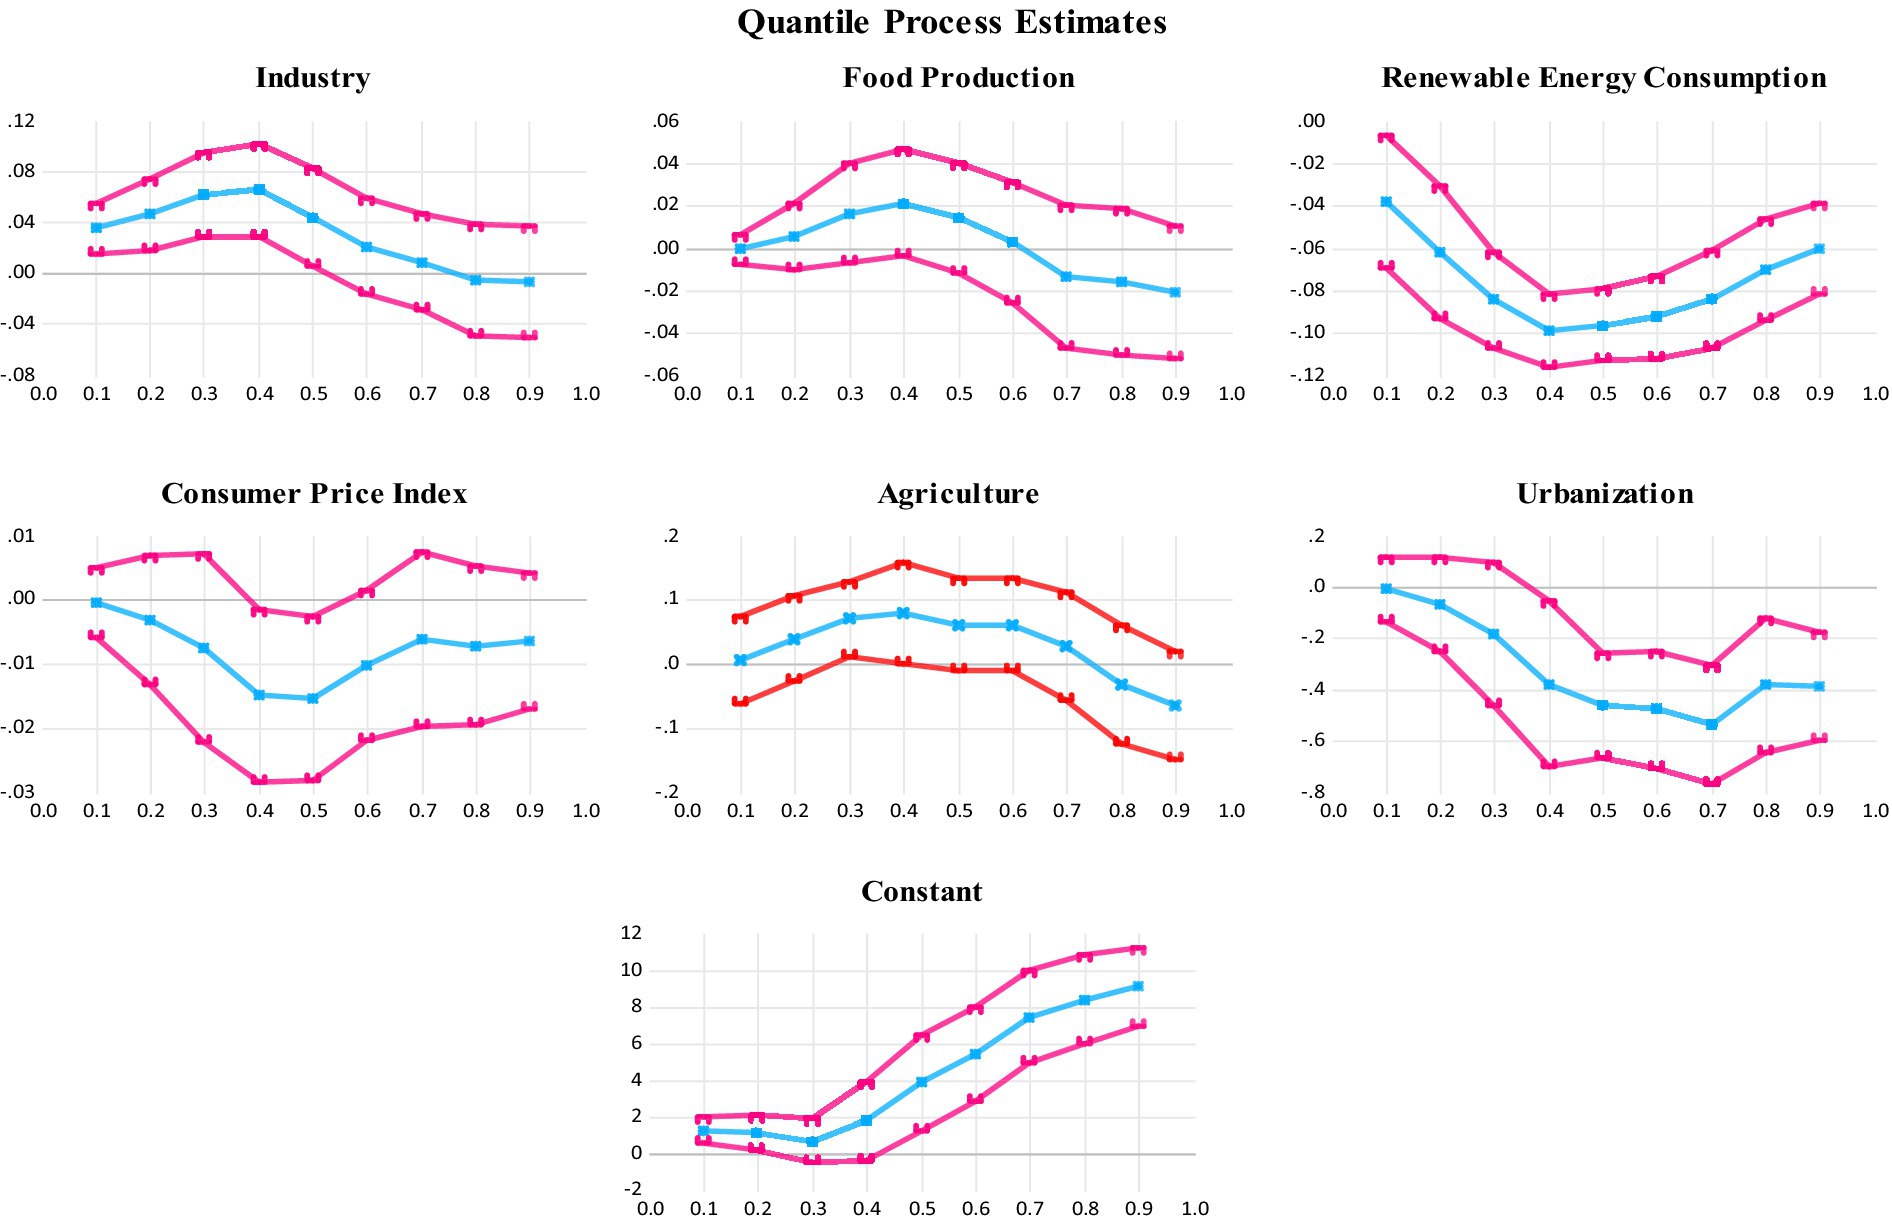
Figure 4. Quantile process estimate.
4.10 Quantile coefficient test
In this section, the objective is to assess the quantile regression coefficient test, with a specific focus on both the “slope equality test” and the “symmetric quantile test.” As demonstrated in Table 10, the outcome of the slope equality test indicates a probability of the Wald test less than 0.05, coupled with a “Chi-Square statistic” value of 561.32, demonstrating statistical significance. This signifies the rejection of the null hypothesis that the slopes are equal, suggesting that the slope equality varies across quantile levels. Similarly, the symmetric quantile test indicates a probability of the Wald test less than 0.05, with a Chi-Square statistic value of 123.83, also deemed statistically significant. This results in rejecting the “null hypothesis,” signifying asymmetric relationships across quantile levels. In other words, it entails rejecting the “null hypothesis” and asserting the presence of asymmetry across quantile levels.
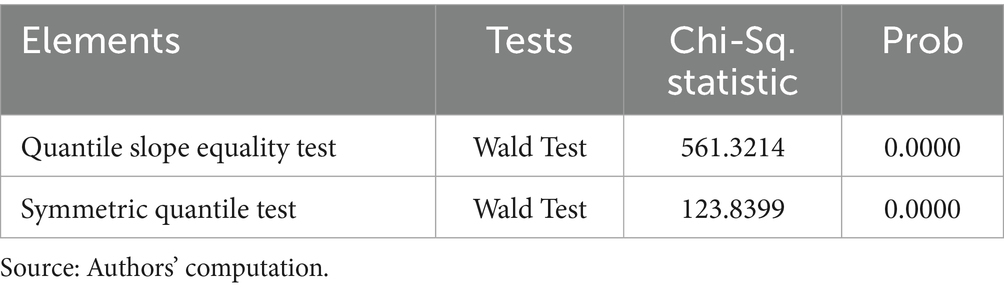
Table 10. Quantile regression coefficient test.
4.11 Robustness outcomes using system GMM
The issue of endogeneity is systematically resolved by introducing appropriate instruments into the specified model and applying the system GMM technique as a robustness check. In this approach, the lagged dependent variable is employed as an endogenous instrument, while the lagged values of explanatory variables and time dummies serve as exogenous instruments. The validity of these instruments is confirmed by the Hansen test, with all p-values exceeding 0.40, whereas the absence of second-order autocorrelation (AR(2) > 0.05) further reinforces the reliability and robustness of the estimates. Moreover, the empirical findings presented in Table 8 highlight the heterogeneous effects of the explanatory variables on ecological footprint. To begin with, industry (IND) exerts a strong and highly significant positive impact at the 1% level. The estimated coefficient of 0.4948* indicates that a 1% rise in industrial activity results in approximately a 0.49% increase in ecological footprint. This finding underscores that, although industrial expansion stimulates economic growth, it simultaneously intensifies environmental degradation through transmission channels such as rising energy demand, reliance on carbon-intensive production methods, and escalating waste generation (Bambi et al., 2024; Bambi and Pea-Assounga, 2024).
In the same vein, food production (FP) is positively and significantly associated with ecological footprint at the 5% level, with a coefficient of 0.3847. This suggests that a 1% increase in food production amplifies ecological pressure by nearly 0.38%. The outcome reflects the environmental costs of modern agricultural intensification, which frequently depends on land conversion, chemical fertilizer usage, and greenhouse gas emissions from livestock. Consistent with prior studies (Saqib et al., 2024; Setsoafia et al., 2022), the transmission channels operate through soil degradation, depletion of freshwater resources, and biodiversity loss, thereby revealing the dual challenge of achieving food security while safeguarding the environment. By contrast, renewable energy consumption (REC) is found to significantly mitigate ecological footprint, as evidenced by its negative coefficient of −0.4185***. This implies that a 1% rise in renewable energy adoption reduces ecological footprint by approximately 0.42%. Such a result highlights the transformative role of clean energy in offsetting environmental pressures by displacing fossil fuel dependency, lowering pollution intensity, and enhancing overall energy efficiency. This finding corroborates the evidence of Li and Wang (2023) and Nathaniel et al. (2020), who also emphasize that the key transmission channels lie in energy substitution effects and reduced carbon emissions.
In contrast, the consumer price index (CPI) yields statistically insignificant results across all specifications, with coefficients fluctuating in sign. This indicates that inflationary dynamics or changes in household consumption prices do not exert a direct or stable influence on ecological footprint in the studied context. The weak and inconsistent effects suggest that any transmission channels from CPI to environmental pressure may be indirect, possibly mediated through altered household demand structures or policy responses to inflation, as highlighted by Limnios et al. (2009) and Semenova (2024). Turning to agriculture (AGR), the results consistently reveal a positive and significant relationship, with coefficients ranging between 0.22 and 0.46, all significant at the 5% level. This implies that agricultural expansion, though economically important, contributes to ecological degradation. The main transmission mechanisms include land degradation, methane emissions from livestock, excessive irrigation, and deforestation practices. Supporting evidence from Johns et al. (2013) and Kremen et al. (2012) affirms that unsustainable agricultural intensification considerably heightens environmental stress.
Finally, urbanization (URB) in Table 11 emerges as the most influential driver of ecological footprint, with strong and highly significant coefficients ranging from 0.65 to 0.88 at the 1% level. This indicates that a 1% increase in urbanization leads to a 0.65–0.88% rise in ecological footprint. The underlying transmission channels stem from rapid population concentration, infrastructure expansion, intensified energy demand, and increased transportation needs in urban areas (Sahoo and Sethi, 2022; Ulucak and Khan, 2020). Taken together, these findings reveal a clear contrast: while industrialization, food production, agriculture, and urbanization significantly exacerbate ecological footprint, renewable energy consumption offers a critical pathway for mitigating environmental stress. Meanwhile, the insignificance of CPI underscores that inflationary dynamics do not represent a decisive determinant of ecological footprint in this framework. Therefore, policy efforts should prioritize scaling up renewable energy adoption, fostering sustainable agricultural practices, and implementing environmentally conscious urban planning in order to balance economic progress with ecological sustainability.
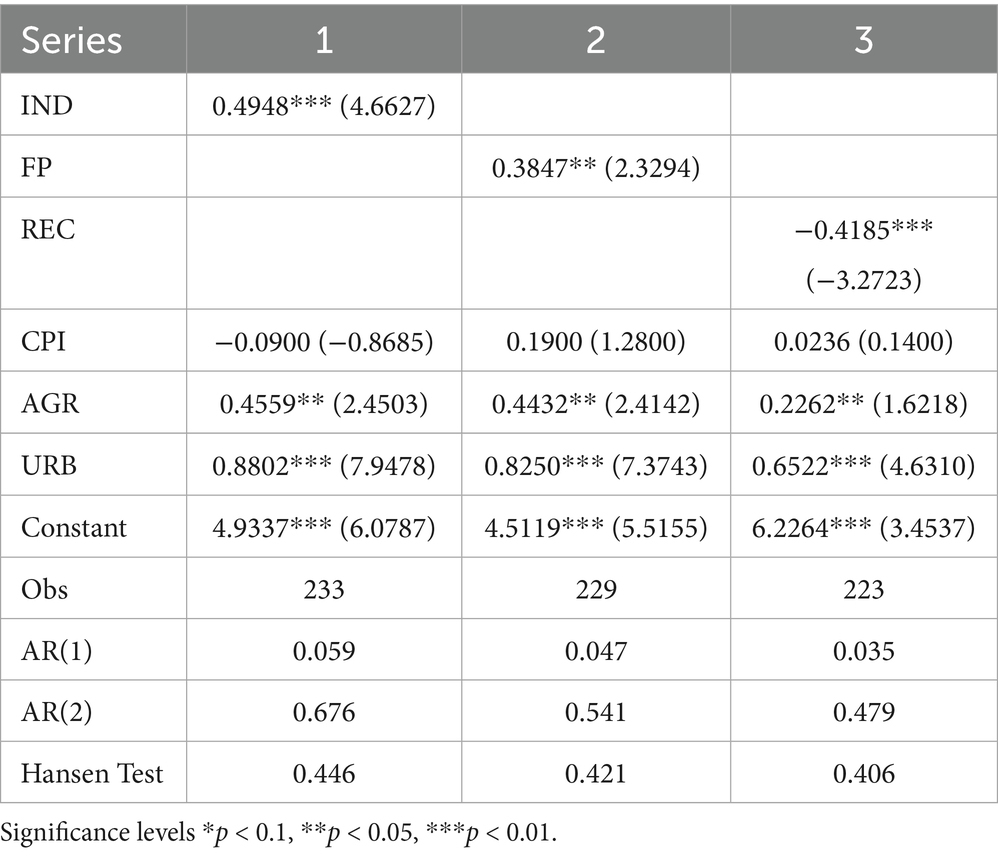
Table 11. Results of system GMM with ecological footprint as dependent variable.
5 Conclusion
This study aims to assess the influence of industrialization, food production, renewable energy consumption, consumer price index (CPI), and urbanization on ecological footprint (EF) by utilizing a balanced panel dataset covering the years 1995–2020 for nine strategically selected Asian countries: China, Singapore, Japan, South Korea, Vietnam, Malaysia, the Philippines, Thailand, and Indonesia. To account for the differential effects across varying levels of ecological pressure, this study employs panel quantile regression. This approach is particularly effective for identifying heterogeneous relationships along the distribution of ecological footprint, and its reliability is further reinforced through robustness checks using the system GMM technique. To begin with, the quantile regression findings demonstrate that industry exerts a significantly positive effect on ecological footprint across all quantiles. Moreover, the magnitude of this effect intensifies notably beyond the 20th and 30th percentiles, suggesting that as countries experience higher environmental pressure, industrial expansion becomes a more prominent driver of ecological degradation. Consequently, these results underscore the urgent need to implement eco-friendly industrial strategies, particularly in highly industrialized economies. Additionally, the impact of food production varies considerably across quantiles. Specifically, at the lower quantiles (10th–30th), food production appears to reduce the ecological footprint, which implies that in countries facing relatively lower ecological stress, food systems may operate in a more sustainable and resource-efficient manner. However, from the 40th to 90th quantiles, the impact becomes significantly positive, indicating that agricultural intensification in more ecologically stressed environments contributes substantially to environmental degradation due to excessive resource use and expanded production. In contrast, renewable energy consumption consistently reveals a negative and statistically significant association with ecological footprint, especially at the 40th and 90th quantiles. This clearly highlights the critical role of renewable energy in mitigating environmental damage, particularly in countries operating under severe ecological stress. Therefore, promoting clean energy alternatives becomes crucial for ensuring sustainable ecological outcomes. Furthermore, the relationship between CPI and ecological footprint is more complex. At lower quantiles, CPI shows a positive effect, possibly reflecting increased consumer and production activity in response to rising prices. However, at higher quantiles, this relationship turns negative, suggesting that inflationary pressures in more environmentally burdened economies may dampen consumption and production, thereby lowering ecological stress.
Meanwhile, agriculture consistently emerges as a significant and positive contributor to ecological footprint across all quantile levels. This consistent pattern reinforces concerns regarding the environmental consequences of traditional agricultural practices, which often involve deforestation, land degradation, and the overuse of water and soil resources. Urbanization, on the other hand, presents a mixed effect depending on the quantile level. Notably, significant impacts are observed at the 20th and 30th percentiles. This implies that while early-stage urban growth may escalate ecological pressures due to infrastructure expansion and energy demand, it also holds potential for environmental improvements through innovations in technology, better infrastructure, and efficient urban planning, particularly in countries with moderate ecological stress. Lastly, the study incorporates the system GMM as a robustness check, which accounts for potential endogeneity, unobserved heterogeneity, and dynamic relationships among the variables, thereby ensuring more reliable and consistent estimates. Taken together, these results provide deeper and more nuanced insights into the intricate interplay between economic and environmental factors, thereby shedding light on the pathways through which sustainable ecological outcomes can be fostered in Asia’s fast-growing economies.
5.1 Practical policy implications
The study’s findings underscore the critical need for targeted policy measures that reduce environmental impacts while fostering sustainable development. Industrialization and green technologies emerge as central areas for policy intervention. Given the consistently positive and statistically significant relationship between industrialization and the ecological footprint, policymakers need to prioritize the adoption of eco-friendly industrial practices. This can be achieved by implementing stricter environmental regulations, offering incentives for the adoption of green technologies, and encouraging industries to shift toward cleaner production methods. These steps will be pivotal in mitigating the environmental impacts of industrialization, especially in higher quantiles where the effects are most significant.
The study also reveals the mixed effects of food production on the ecological footprint, highlighting the need for differentiated agricultural policies. While small-scale, sustainable farming methods such as organic farming, agroecology, and efficient water use help reduce the ecological footprint, large-scale, intensive agricultural practices tend to increase environmental degradation. Therefore, policies should focus on promoting sustainable farming practices, supporting local food systems, and reducing food waste along the supply chain. These efforts will mitigate the negative environmental effects of food production while encouraging more sustainable agricultural practices.
Furthermore, the study emphasizes the importance of transitioning to renewable energy sources. The significant negative impact of renewable energy consumption on the ecological footprint, particularly in higher quantiles, calls for policies aimed at expanding renewable energy infrastructure. Governments should provide financial incentives, subsidies, and support for renewable energy projects, while also investing in research and development to improve the efficiency and sustainability of renewable energy technologies. Additionally, promoting energy efficiency and reducing reliance on fossil fuels will further enhance the positive environmental impacts of renewable energy consumption.
The findings also point to the role of consumer behavior in shaping environmental outcomes. The mixed effects of the consumer price index on the ecological footprint suggest that policies promoting sustainable consumption are essential. To this end, eco-labeling, consumer education on environmental impacts, and encouraging the use of sustainable products are key policy tools. Moreover, revising tax policies to favor environmentally friendly products and penalize those with higher ecological footprints can significantly influence consumer behavior toward more sustainable choices.
Finally, the study addresses the dual effects of urbanization on the ecological footprint, both positive and negative. This highlights the need for comprehensive urban planning policies. Governments should focus on promoting sustainable urban development by integrating green infrastructure, establishing efficient public transportation systems, and implementing sustainable land-use practices. Encouraging the development of smart cities and incorporating green spaces into urban areas will be crucial in mitigating the negative environmental effects of urbanization while enhancing overall sustainability. By addressing these interconnected policy challenges, governments and stakeholders can effectively reduce the ecological footprint, support economic growth, and secure a more sustainable future for generations to come.
5.2 Limitations and future research avenues
Although this study delivers valuable findings, it is important to acknowledge several limitations that also open promising directions for future research. Primarily, the dataset employed is relatively limited in scope and may not fully capture the diverse and heterogeneous impacts of industrialization, agricultural practices, and renewable energy consumption across different geographic regions, economic sectors, and time periods. Therefore, to strengthen the external validity and applicability of the results, subsequent studies should strive to incorporate more comprehensive datasets encompassing a wider array of countries, industries, and longer temporal spans. Moreover, refining the model specifications by including interaction terms for instance, examining how industrial activity interacts with renewable energy usage could uncover important moderating effects and complex interdependencies that remain unexplored (e.g., industry × renewable energy). Other interaction effects may also prove insightful, enabling a deeper understanding of the multifaceted relationships at play.
In addition, regarding the cross-sectional dimension, future investigations could implement a systematic exclusion approach, where one country is omitted at a time while re-estimating the model. Reporting these stepwise results would allow researchers to assess the robustness and sensitivity of findings to the presence or absence of individual countries. Complementarily, conducting country-specific analyses whenever feasible would facilitate meaningful comparisons and reveal localized patterns and idiosyncrasies that aggregate analyses might overlook.
Furthermore, emerging technological innovations, particularly in agricultural technology (agri-tech) and green technologies, represent a significant opportunity to reduce the ecological footprint by enhancing resource efficiency, minimizing emissions, and fostering cleaner, more sustainable production processes. Technologies such as precision farming, smart irrigation, renewable energy-powered machinery, and carbon-neutral industrial operations exemplify this potential. Given the rapid advancement and diffusion of these innovations, it is imperative for future research to thoroughly investigate their long-term environmental consequences, many of which are not yet fully understood or empirically substantiated. Employing sophisticated empirical methodologies, including panel data analysis, spatial econometrics, and machine learning can offer more granular, accurate insights into the extent to which these technological developments contribute to environmental sustainability. Moreover, future studies should place greater emphasis on examining the heterogeneous effects of industry, agriculture, and energy consumption across various socio-economic contexts, governance frameworks, and spatial settings. Such an approach will enable policymakers to tailor interventions that are more context-sensitive and effective in addressing specific environmental challenges. Equally important is the pursuit of longitudinal research that tracks environmental impacts over extended periods, providing critical evidence on the persistence, evolution, and efficacy of different policy measures. By integrating technological progress, spatial heterogeneity, and temporal dynamics, future environmental research can yield more robust and actionable policy guidance aimed at advancing sustainable development objectives. Additionally, consumer behavior plays a pivotal role in shaping environmental outcomes, yet this dimension often remains underexplored. Therefore, future investigations should delve into the social and behavioral drivers of sustainable consumption by exploring cultural values, social norms, and insights from behavioral economics. Understanding these factors is crucial for designing effective policies and interventions that promote environmentally responsible behaviors among consumers. Overall, by addressing these limitations and expanding the scope of inquiry, future research can generate a more comprehensive and nuanced understanding of the complex interactions between industrialization, energy consumption, agriculture, and urbanization. Such knowledge will be essential for developing informed, targeted, and sustainable policy frameworks that effectively contribute to preserving the global environment for future generations.
Data availability statement
The raw data supporting the conclusions of this article will be made available by the authors without undue reservation.
Author contributions
JP-A: Project administration, Validation, Writing – review & editing, Investigation, Formal analysis. PB: Validation, Methodology, Writing – original draft, Conceptualization. DO: Software, Writing – original draft, Visualization, Validation, Data curation.
Funding
The author(s) declare that no financial support was received for the research and/or publication of this article.
Conflict of interest
The authors declare that the research was conducted in the absence of any commercial or financial relationships that could be construed as a potential conflict of interest.
Generative AI statement
The authors declare that no Gen AI was used in the creation of this manuscript.
Any alternative text (alt text) provided alongside figures in this article has been generated by Frontiers with the support of artificial intelligence and reasonable efforts have been made to ensure accuracy, including review by the authors wherever possible. If you identify any issues, please contact us.
Publisher’s note
All claims expressed in this article are solely those of the authors and do not necessarily represent those of their affiliated organizations, or those of the publisher, the editors and the reviewers. Any product that may be evaluated in this article, or claim that may be made by its manufacturer, is not guaranteed or endorsed by the publisher.
References
Ahmad, M., Jiang, P., Majeed, A., Umar, M., Khan, Z., and Muhammad, S. (2020). The dynamic impact of natural resources, technological innovations and economic growth on ecological footprint: an advanced panel data estimation. Resour. Pol. 69:101817. doi: 10.1016/j.resourpol.2020.101817
Ali, A., Xia, C., Mahmood, I., and Faisal, M. (2021). Economic and environmental consequences' of postharvest loss across food supply chain in the developing countries. J. Clean. Prod. 323:129146. doi: 10.1016/j.jclepro.2021.129146
Ansari, M. A., Haider, S., and Masood, T. (2021). Do renewable energy and globalization enhance ecological footprint: an analysis of top renewable energy countries? Environ. Sci. Pollut. Res. 28, 6719–6732. doi: 10.1007/s11356-020-10786-0
Appiah, M., Li, M., Naeem, M. A., and Karim, S. (2023). Greening the globe: uncovering the impact of environmental policy, renewable energy, and innovation on ecological footprint. Technol. Forecast. Soc. Change 192:122561. doi: 10.1016/j.techfore.2023.122561
Arellano, M., and Bond, S. (1991). Some tests of specification for panel data: Monte Carlo evidence and an application to employment equations. Rev. Econ. Stud. 58, 277–297. doi: 10.2307/2297968
Aschemann-Witzel, J., Mulders, M. D., and Mouritzen, S. L. T. (2023). Outside-in and bottom-up: using sustainability transitions to understand the development phases of mainstreaming plant-based in the food sector in a meat and dairy focused economy. Technol. Forecast. Soc. Change 197:122906. doi: 10.1016/j.techfore.2023.122906
Bambi, P. D. R., Batatana, M. L. D., Appiah, M., and Tetteh, D. (2024). Governance, institutions, and climate change resilience in sub-Saharan Africa: assessing the threshold effects. Front. Environ. Sci. 12:1352344. doi: 10.3389/fenvs.2024.1352344
Bambi, P. D. R., and Pea-Assounga, J. B. B. (2024). Assessing the influence of land use, agricultural, industrialization, CO2 emissions, and energy intensity on cereal production. J. Environ. Manag. 370:122612. doi: 10.1016/j.jenvman.2024.122612
Bambi, P. D. R., and Pea-Assounga, J. B. B. (2025). Exploring the dynamic nexus of factors shaping crop production. Renew. Sust. Energ. Rev. 210:115162. doi: 10.1016/j.rser.2024.115162
Beyer, B., Chaskel, R., Euler, S., Gassen, J., Großkopf, A. K., and Sellhorn, T. (2024). How does carbon footprint information affect consumer choice? A field experiment. J. Account. Res. 62, 101–136. doi: 10.1111/1475-679X.12505
Bocken, N. M., and Allwood, J. (2012). Strategies to reduce the carbon footprint of consumer goods by influencing stakeholders. J. Clean. Prod. 35, 118–129. doi: 10.1016/j.jclepro.2012.05.031
Carolan, M. S. (2004). Ecological modernization theory: what about consumption? Soc. Nat. Resour. 17, 247–260. doi: 10.1080/0894120490270294
Chai, C., Zhang, B., Li, Y., Niu, W., Zheng, W., Kong, X., et al. (2023). A new multi-dimensional framework considering environmental impacts to assess green development level of cultivated land during 1990 to 2018 in China. Environ. Impact Assess. Rev. 98:106927. doi: 10.1016/j.eiar.2022.106927
Chen, Y., Cheng, L., and Lee, C.-C. (2022). How does the use of industrial robots affect the ecological footprint? International evidence. Ecol. Econ. 198:107483. doi: 10.1016/j.ecolecon.2022.107483
Chowdhury, M. A. F., Shanto, P. A., Ahmed, A., and Rumana, R. H. (2021). Does foreign direct investments impair the ecological footprint? New evidence from the panel quantile regression. Environ. Sci. Pollut. Res. 28, 14372–14385. doi: 10.1007/s11356-020-11518-0
Destek, M. A., and Manga, M. (2021). Technological innovation, financialization, and ecological footprint: evidence from BEM economies. Environ. Sci. Pollut. Res. 28, 21991–22001. doi: 10.1007/s11356-020-11845-2
Hansen, L. P. (1982). Large sample properties of generalized method of moments estimators. Econometrica: J. Econom Soc, 1029–1054. doi: 10.2307/1912775
Hossain, A., Krupnik, T. J., Timsina, J., Mahboob, M. G., Chaki, A. K., Farooq, M., et al. (2020). “Agricultural land degradation: processes and problems undermining future food security” in Environment, climate, plant and vegetation growth. eds. M. Hasanuzzaman, et al. (Cham: Springer), 17–61.
Huang, S.-L., Yeh, C.-T., and Chang, L.-F. (2010). The transition to an urbanizing world and the demand for natural resources. Curr. Opin. Environ. Sustain. 2, 136–143. doi: 10.1016/j.cosust.2010.06.004
Hussain, M., Wang, W., and Wang, Y. (2022). Natural resources, consumer prices and financial development in China: measures to control carbon emissions and ecological footprints. Resour. Pol. 78:102880. doi: 10.1016/j.resourpol.2022.102880
Johns, T., Powell, B., Maundu, P., and Eyzaguirre, P. B. (2013). Agricultural biodiversity as a link between traditional food systems and contemporary development, social integrity and ecological health. J. Sci. Food Agric. 93, 3433–3442. doi: 10.1002/jsfa.6351
Kazemzadeh, E., Fuinhas, J. A., Salehnia, N., and Osmani, F. (2023). The effect of economic complexity, fertility rate, and information and communication technology on ecological footprint in the emerging economies: a two-step stirpat model and panel quantile regression. Qual. Quant. 57, 737–763. doi: 10.1007/s11135-022-01373-1
Khan, I., Muhammad, I., Sharif, A., Khan, I., and Ji, X. (2024). Unlocking the potential of renewable energy and natural resources for sustainable economic growth and carbon neutrality: a novel panel quantile regression approach. Renew. Energy 221:119779. doi: 10.1016/j.renene.2023.119779
Khan, Q. R., Anwar, A., Muhammad, T., Ghafoori, N., and Ahmad, M. (2024). Asymmetric effects of high-tech industry and presence of pollution-haven hypothesis in APEC countries: fresh evidence with panel quantile regression. Clean Techn. Environ. Policy 26, 2643–2660. doi: 10.1007/s10098-023-02703-z
Koenker, R., and Bassett, G. Jr. (1978). Regression quantiles. Econometrica 46, 33–50. doi: 10.2307/1913643
Kremen, C., Iles, A., and Bacon, C. (2012). Diversified farming systems: an agroecological, systems-based alternative to modern industrial agriculture. Ecol. Soc. 17, 1–19. doi: 10.5751/ES-05103-170444
Kronberg, S. L., and Ryschawy, J. (2019). “Negative impacts on the environment and people from simplification of crop and livestock production” in Agroecosystem diversity (London, United Kingdom: Elsevier), 75–90.
Levine, S., and Kendall, K. (2006). Energy efficiency and conservation: opportunities, obstacles, and experiences. Vt. J. Environ. Law 8:101. doi: 10.2307/vermjenvilaw.8.1.101
Liao, C., and Brown, D. G. (2018). Assessments of synergistic outcomes from sustainable intensification of agriculture need to include smallholder livelihoods with food production and ecosystem services. Curr. Opin. Environ. Sustain. 32, 53–59. doi: 10.1016/j.cosust.2018.04.013
Liao, J., Liu, X., Zhou, X., and Tursunova, N. R. (2023). Analyzing the role of renewable energy transition and industrialization on ecological sustainability: can green innovation matter in OECD countries. Renew. Energy 204, 141–151. doi: 10.1016/j.renene.2022.12.089
Limnios, E. A. M., Ghadouani, A., Schilizzi, S. G., and Mazzarol, T. (2009). Giving the consumer the choice: a methodology for product ecological footprint calculation. Ecol. Econ. 68, 2525–2534. doi: 10.1016/j.ecolecon.2009.04.020
Lin, B., Omoju, O. E., and Okonkwo, J. U. (2015). Impact of industrialisation on CO2 emissions in Nigeria. Renew. Sust. Energ. Rev. 52, 1228–1239. doi: 10.1016/j.rser.2015.07.164
Li, R., and Wang, Q. (2023). Does renewable energy reduce per capita carbon emissions and per capita ecological footprint? New evidence from 130 countries. Energy Strateg. Rev. 49:101121. doi: 10.1016/j.esr.2023.101121
Li, R., Wang, X., and Wang, Q. (2022). Does renewable energy reduce ecological footprint at the expense of economic growth? An empirical analysis of 120 countries. J. Clean. Prod. 346:131207. doi: 10.1016/j.jclepro.2022.131207
Liu, Y., Gong, X., Yüksel, S., Dinçer, H., and Aydın, R. (2021). A multidimensional outlook to energy investments for the countries with continental shelf in East Mediterranean region with hybrid decision making model based on IVIF logic. Energy Rep. 7, 158–173. doi: 10.1016/j.egyr.2020.11.196
Luo, W., Bai, H., Jing, Q., Liu, T., and Xu, H. (2018). Urbanization-induced ecological degradation in Midwestern China: an analysis based on an improved ecological footprint model. Resour. Conserv. Recycl. 137, 113–125. doi: 10.1016/j.resconrec.2018.05.015
Machado, J. A. F., and Santos Silva, J. M. C. (2019). Quantiles via moments. J. Econ. 213, 145–173. doi: 10.1016/j.jeconom.2019.04.009
Marasinghe, J. P., Senanayake, H., Saravanabhava, N., Arambepola, C., Condous, G., and Greenwood, P. (2014). History, pelvic examination findings and mobility of ovaries as a sonographic marker to detect pelvic adhesions with fixed ovaries. J. Obstet. Gynaecol. Res. 40, 785–790. doi: 10.1111/jog.12234
Mehmood, U. (2024). Assessing the impacts of eco-innovations, economic growth, urbanization on ecological footprints in G-11: exploring the sustainable development policy options. J. Knowl. Econ. 15, 16849–16867. doi: 10.1007/s13132-024-01759-6
Mohamed, E. F., Abdullah, A., Jaaffar, A. H., and Osabohien, R. (2024). Reinvestigating the EKC hypothesis: does renewable energy in power generation reduce carbon emissions and ecological footprint? Energy Strateg. Rev. 53:101387. doi: 10.1016/j.esr.2024.101387
Mol, A. P. (2000). The environmental movement in an era of ecological modernisation. Geoforum 31, 45–56. doi: 10.1016/S0016-7185(99)00043-3
Musa, M., Gao, Y., Rahman, P., Albattat, A., Ali, M. A. S., and Saha, S. K. (2023). Sustainable development challenges in Bangladesh: an empirical study of economic growth, industrialization, energy consumption, foreign investment, and carbon emissions—using dynamic ARDL model and frequency domain causality approach. Clean Techn. Environ. Policy 26, 1799–1823. doi: 10.1007/s10098-023-02680-3
Nathaniel, S., Anyanwu, O., and Shah, M. (2020). Renewable energy, urbanization, and ecological footprint in the Middle East and North Africa region. Environ. Sci. Pollut. Res. 27, 14601–14613. doi: 10.1007/s11356-020-08017-7
Nathaniel, S., and Khan, S. A. R. (2020). The nexus between urbanization, renewable energy, trade, and ecological footprint in ASEAN countries. J. Clean. Prod. 272:122709. doi: 10.1016/j.jclepro.2020.122709
Opoku, E. E. O., and Aluko, O. A. (2021). Heterogeneous effects of industrialization on the environment: evidence from panel quantile regression. Struct. Change Econ. Dyn. 59, 174–184. doi: 10.1016/j.strueco.2021.08.015
Pan, L., Amin, A., Zhu, N., Chandio, A. A., Naminse, E. Y., and Shah, A. H. (2022). Exploring the asymmetrical influence of economic growth, oil price, consumer price index and industrial production on the trade deficit in China. Sustainability 14:15534. doi: 10.3390/su142315534
Patra, S., Sahoo, S., Mishra, P., and Mahapatra, S. C. (2018). Impacts of urbanization on land use/cover changes and its probable implications on local climate and groundwater level. J. Urban Manag. 7, 70–84. doi: 10.1016/j.jum.2018.04.006
Pea-Assounga, J. B. B., Bambi, P. D. R., Jafarzadeh, E., and Ngapey, J. D. N. (2025). Investigating the impact of crude oil prices, CO2 emissions, renewable energy, population growth, trade openness, and FDI on sustainable economic growth. Renew. Energy 241:122353. doi: 10.1016/j.renene.2025.122353
Peiró, L. T., Martin, N., Méndez, G. V., and Madrid-López, C. (2022). Integration of raw materials indicators of energy technologies into energy system models. Appl. Energy 307:118150. doi: 10.1016/j.apenergy.2021.118150
Powell, D. (2016). RAND Corporation From the SelectedWorks of David Powell Quantile regression with nonadditive fixed effects quantile regression with nonadditive fixed effects*. Berlin, Germany: Spring.
Quito, B., del Río-Rama, M. d. l. C., Álvarez-García, J., and Durán-Sánchez, A. (2023). Impacts of industrialization, renewable energy and urbanization on the global ecological footprint: a quantile regression approach. Bus. Strat. Environ. 32, 1529–1541. doi: 10.1002/bse.3203
Raghutla, C., Padmagirisan, P., Sakthivel, P., Chittedi, K. R., and Mishra, S. (2022). The effect of renewable energy consumption on ecological footprint in N-11 countries: evidence from panel quantile regression approach. Renew. Energy 197, 125–137. doi: 10.1016/j.renene.2022.07.100
Rahman, A., Farrok, O., and Haque, M. M. (2022). Environmental impact of renewable energy source based electrical power plants: solar, wind, hydroelectric, biomass, geothermal, tidal, ocean, and osmotic. Renew. Sust. Energ. Rev. 161:112279. doi: 10.1016/j.rser.2022.112279
Raihan, A., Muhtasim, D. A., Farhana, S., Pavel, M. I., Faruk, O., Rahman, M., et al. (2022). Nexus between carbon emissions, economic growth, renewable energy use, urbanization, industrialization, technological innovation, and forest area towards achieving environmental sustainability in Bangladesh. Energy Climate Change 3:100080. doi: 10.1016/j.egycc.2022.100080
Rondoni, A., and Grasso, S. (2021). Consumers behaviour towards carbon footprint labels on food: a review of the literature and discussion of industry implications. J. Clean. Prod. 301:127031. doi: 10.1016/j.jclepro.2021.127031
Sahoo, M., and Sethi, N. (2022). The dynamic impact of urbanization, structural transformation, and technological innovation on ecological footprint and PM2. 5: evidence from newly industrialized countries. Environ. Dev. Sustain. 24, 4244–4277. doi: 10.1007/s10668-021-01614-7
Salari, T. E., Roumiani, A., and Kazemzadeh, E. (2021). Globalization, renewable energy consumption, and agricultural production impacts on ecological footprint in emerging countries: using quantile regression approach. Environ. Sci. Pollut. Res. 28, 49627–49641. doi: 10.1007/s11356-021-14204-x
Salehi, M., Khajehpour, H., and Saboohi, Y. (2020). Extended energy return on investment of multiproduct energy systems. Energy 192:116700. doi: 10.1016/j.energy.2019.116700
Saqib, N., Usman, M., Ozturk, I., and Sharif, A. (2024). Harnessing the synergistic impacts of environmental innovations, financial development, green growth, and ecological footprint through the lens of SDGs policies for countries exhibiting high ecological footprints. Energy Policy 184:113863. doi: 10.1016/j.enpol.2023.113863
Semenova, A. (2024). Rising temperatures and rising prices: the inflationary impacts of climate change and the need for degrowth-based solutions to the ecological crisis. Globalizations 21, 103–120. doi: 10.1080/14747731.2023.2222482
Setsoafia, E. D., Ma, W., and Renwick, A. (2022). Effects of sustainable agricultural practices on farm income and food security in northern Ghana. Agric. Food Econ. 10, 1–15. doi: 10.1186/s40100-022-00216-9
Sharif, A., Baris-Tuzemen, O., Uzuner, G., Ozturk, I., and Sinha, A. (2020). Revisiting the role of renewable and non-renewable energy consumption on Turkey’s ecological footprint: evidence from quantile ARDL approach. Sustain. Cities Soc. 57:102138. doi: 10.1016/j.scs.2020.102138
Ullah, A., Tekbaş, M., and Doğan, M. (2023). The impact of economic growth, natural resources, urbanization and biocapacity on the ecological footprint: the case of Turkey. Sustainability 15:12855. doi: 10.3390/su151712855
Ulucak, R., and Khan, S. U.-D. (2020). Determinants of the ecological footprint: role of renewable energy, natural resources, and urbanization. Sustain. Cities Soc. 54:101996. doi: 10.1016/j.scs.2019.101996
Wackernagel, M., Schulz, N. B., Deumling, D., Linares, A. C., Jenkins, M., Kapos, V., et al. (2002). Tracking the ecological overshoot of the human economy. Proc Natl Acad Sci. 99, 9266–9271. doi: 10.1073/pnas.142033699
Wallace, J. (2000). Increasing agricultural water use efficiency to meet future food production. Agric. Ecosyst. Environ. 82, 105–119. doi: 10.1016/S0167-8809(00)00220-6
Wang, Q., Ge, Y., and Li, R. (2025). Does improving economic efficiency reduce ecological footprint? The role of financial development, renewable energy, and industrialization. Energy Environ. 36, 729–755. doi: 10.1177/0958305X231183914
Yang, B., and Usman, M. (2021). Do industrialization, economic growth and globalization processes influence the ecological footprint and healthcare expenditures? Fresh insights based on the STIRPAT model for countries with the highest healthcare expenditures. Sustain. Prod. Consum. 28, 893–910. doi: 10.1016/j.spc.2021.07.020
Keywords: industry, agriculture, food production, renewable energy consumption, ecological footprint, panel quantile regression
Citation: Pea-Assounga JBB, Bambi PDR and Opoko Apendi DA (2025) Impact of agriculture, industry, food production, renewable energy consumption, urbanization, and consumer price index on ecological footprint: evidence from Asian economies. Front. Sustain. Food Syst. 9:1653025. doi: 10.3389/fsufs.2025.1653025
Edited by:
Shashika D. Rathnayaka, University of Aberdeen, United KingdomReviewed by:
Chandika Gunasinghe, University of Ruhuna, Sri LankaSyed Abbas, Cardiff Metropolitan University, United Kingdom
Copyright © 2025 Pea-Assounga, Bambi and Opoko Apendi. This is an open-access article distributed under the terms of the Creative Commons Attribution License (CC BY). The use, distribution or reproduction in other forums is permitted, provided the original author(s) and the copyright owner(s) are credited and that the original publication in this journal is cited, in accordance with accepted academic practice. No use, distribution or reproduction is permitted which does not comply with these terms.
*Correspondence: Jean Baptiste Bernard Pea-Assounga, YXNwZWFqZWFuYmFwdGlzdGVAeWFob28uZnI=; YXNwZWFqZWFuYmFwdGlzdGVAdWpzLmVkdS5jbg==; Prince Dorian Rivel Bambi, cHJpbmNlYmFtYmkzMTVAZ21haWwuY29t