 Xiaoluan Liu
 Fangbin Qiao*
- China Economics and Management Academy, Central University of Finance and Economics, Beijing, China
Introduction: Since 2015, China's supportive policies and external economic shocks have intensified rural-urban migration dynamics, leading to a significant rise in return migration. While extensive research has examined the determinants and impacts of rural–urban migration, studies on return migration—particularly its effects on agricultural productivity—remain inconsistent and often overlook migrants' heterogeneous motivations.
Methods: Using nationally representative data, this study employs fixed effects models, instrumental variables, and propensity score matching to address endogeneity concerns. It estimates both the average impact of return migration and the differential effects of voluntary vs. involuntary return on agricultural productivity, further exploring underlying mechanisms.
Results: Voluntary returnee households exhibit higher agricultural productivity than non-migrant households, though they constitute a minority. In contrast, involuntary returnee households—who form the majority—show lower productivity. Mechanism analyses indicate that voluntary returnees enhance productivity through improved information acquisition and total factor productivity, whereas involuntary returnees suffer from constraints related to health and family care responsibilities.
Discussion: This study clarifies the mixed evidence on return migration and agricultural productivity by revealing opposing effects among voluntary vs. involuntary returnees. Policy efforts should attract and enable voluntary returnees through digital infrastructure and skills training, while addressing health and care constraints faced by involuntary returnees via improved rural medical and childcare services. Such targeted interventions can help maximize positive impacts and mitigate barriers to agricultural productivity.
1 Introduction
Since 2015, China has implemented a series of supportive policies such as the returnee entrepreneurship pilot program and rural revitalization initiatives, along with poverty alleviation efforts and county-level industrial upgrading, which have significantly strengthened the pull factors of rural areas. At the same time, successive shocks including the 2008 global financial crisis, the COVID-19 pandemic in 2020, and the sustained decline in exports in 2022 have amplified the urban push factors. The combined forces have made the return migration of rural migrant workers increasingly prominent. Against this backdrop, the phenomenon of return migration in China has attracted widespread scholarly attention. Both the determinants and impact of rural-urban migration have been extensively studied (Zhao, 1999; Rozelle et al., 1999; Ge et al., 2020; Bairoliya and Miller, 2021; Garriga et al., 2023; Zhang and Song, 2003; Mullan et al., 2011). However, studies on return migration have recently become a primary research topic in migration studies in China (for example, Hagan and Thomas Wassink, 2020; Zhang et al., 2020; He et al., 2021; Hu et al., 2023; Murphy, 2000; Hu et al., 2011; Meng and Zhao, 2018). This scholarly evolution reflects tangible demographic shifts: official statistics report over 19 million migrant workers returning to rural origins for local employment in 2020 alone (Ministry of Agriculture and Rural Affairs, 2021), signaling a structural transformation in labor mobility patterns.
Regarding return migration, the literature explains the phenomenon through several theoretical frameworks, including the push-pull theory, the neoclassical approach, the New Economics of Labor Migration (NELM), and optimal decision theory (Bilecen, 2022). Mohamed and Abdul-Talib (2020) apply the push-pull framework, noting that return migration is driven by various push forces in host cities (e.g., policies, housing costs, and adaptation challenges) and pull forces from home regions (e.g., local development and family ties). The neoclassical approach emphasizes rational choice and human capital, arguing that migrants return when the utility of remaining in host cities does not offset the socio-psychological costs (Ette et al., 2021). The NELM perspective views migration as temporary, with migrants working in cities to earn higher wages, save, and remit before returning (Tezcan, 2019; Schiele, 2021). Finally, optimal decision theory considers return migration part of rational decision-making aimed at maximizing overall benefits (Hamdouch and Wahba, 2015).
The literature has established significant linkages between return migration and occupational transitions toward nonfarm employment. Empirical evidence suggests that returnees exhibit systematically higher probabilities of engaging in nonagricultural activities compared to non-migrant rural residents (Zhao, 2003). This pattern manifests particularly in nonfarm self-employment and wage employment, as demonstrated in multiple cross-country studies (De Vreyer et al., 2010; Démurger and Xu, 2011; Wahba, 2021; Flahaux, 2021; Bucheli and Fontenla, 2025; Martin and Radu, 2012). Such labor reallocation effects contribute meaningfully to local economic development, primarily through expanded industrial and service sector participation (Wang et al., 2003; Zhu et al., 2021).
The empirical literature presents mixed evidence regarding return migration's effects on agricultural productivity. For example, Shi and Yang (2011) found that return migrants' land productivity is 18.70% higher than that of non-returnees. Qian et al. (2016) took livestock cultivation as an example and proved that return migration increased agricultural productivity by 19.34%. Similar positive impacts have also been identified in other studies (Ma, 2002; Hausmann and Nedelkoska, 2018; Xiao and Luo, 2023; Wu et al., 2023). However, some studies have shown that return migration has no impact on agricultural productivity (Bai and He, 2002; Zhang and Wang, 2021). Thus, the impact of return migration on agricultural productivity remains unclear. This paper argues that a more fine-grained analysis of the characteristics of return migrant workers may help explain the differing conclusions regarding agricultural productivity. Previous studies have primarily examined the overall impact of return migration on agricultural productivity while overlooking the heterogeneous effects of different return motivations. As the proportion of returnees driven by different reasons shifts across periods, the general conclusions drawn in these studies may no longer hold, leading to variations in results. Moreover, much of the existing research has focused on regions where policies actively encouraged return migration, resulting in a higher share of voluntary returnees. Under such circumstances, it is not surprising that these studies tend to report predominantly positive outcomes.
Recent studies have refined returnee classifications beyond the traditional “successful vs. unsuccessful” dichotomy Gmelch, (1980). Wang and Fan (2006) categorize returnees by motivation: voluntary returnees who return for investment or career purposes, involuntary returnees who return due to health, age, or inability to find urban employment, and those returning for family reasons. Liu and Shi (2017) argue that family-related returns—such as caregiving, marriage, or child-rearing—often involve trade-offs with personal development, making them effectively involuntary. Consistently, the IOM1 (2012) defines voluntary return as a free, informed choice without coercion, whereas coerced returns are involuntary (Mensah, 2016). This study classifies family-motivated returnees as involuntary.
Therefore, this study advances the literature by using nationally representative data to overcome the regional and voluntary-returnee biases of prior research, and by employing fixed effects models, instrumental variables, and propensity score matching to address endogeneity concerns caused by both observed and unobserved variables. It first estimates the average impact of return migration. Subsequently, it estimates the differential impacts of voluntary and involuntary return migration on agricultural productivity. Finally, the mechanisms driving the differential impacts of voluntary and involuntary return migration are analyzed. This paper makes three main contributions. First, it provides a more detailed distinction of returnees with different characteristics and examines their heterogeneous impacts on agricultural productivity, thereby addressing the inconsistencies in previous findings. Second, while most prior studies focused on regions with policies that encouraged return migration—resulting in a higher share of voluntary returnees—this paper employs nationally representative data to conduct a more comprehensive analysis. Third, whereas earlier research mainly examined changes in agricultural engagement or investment resulting from return migration, this study identifies agricultural production capacity as the key mechanism influencing agricultural productivity, offering a more direct understanding of productivity changes.
The main conclusions of this paper are as follows: First, using a fixed effects model, we find that the agricultural productivity of voluntary returnee families is higher than that of non-returnee families, but such families constitute only a relatively small proportion, whereas the agricultural productivity of involuntary returnee families is lower than that of non-returnee families, and these families account for a large proportion. Second, in the mechanism analysis, using the fixed effects model, we find that voluntary returnee families exert a positive impact on agricultural productivity, partly because they possess stronger information acquisition capabilities, which lead to higher total factor productivity in agriculture for their households. Third, health issues and/or family care responsibilities reduce the total factor productivity in agriculture for involuntary returnee families, thereby resulting in a decline in agricultural productivity. Moreover, our conclusions remain robust after conducting instrumental variable tests and propensity score matching (PSM).
The rest of the paper is organized as follows. Section 2 describes the data used in the study and characterizes the key differences between voluntary and involuntary returnees in terms of personal characteristics, household situations, and agricultural productivity. Section 3 employs a fixed effects model to analyze the overall impact of migration. Subsequently, the robustness of the findings is verified using the instrument variable and PSM approaches. Finally, the differential impacts of voluntary and involuntary returnees are estimated. In Section 4, we assess and compare the agricultural production ability of voluntary and involuntary returnees. Furthermore, we examine the mechanisms driving the differential impacts of voluntary and involuntary returnees from two perspectives—information retrieval skills and health issues or family caregiving responsibilities. Finally, Section 5 summarizes the key findings of the study.
2 Data and methods
2.1 Data source
The data used in this study are from the China Labor-force Dynamic Survey (CLDS) conducted by Sun Yat-sen University.2 To ensure randomization, the survey employs a multi-stage, multi-layer probability proportional to size sampling method. As a nationally representative dataset, the survey employs samples from 29 provinces and municipalities (excluding Tibet, Hainan, and the special administrative regions of Hong Kong, Macau, and Taiwan)3. To date, four rounds of survey data (i.e., 2012, 2014, 2016, and 2018) are publicly available. The panel dataset used in this study included 23,845 observations. The basic characteristics of the samples are presented in the first column of Table 1.
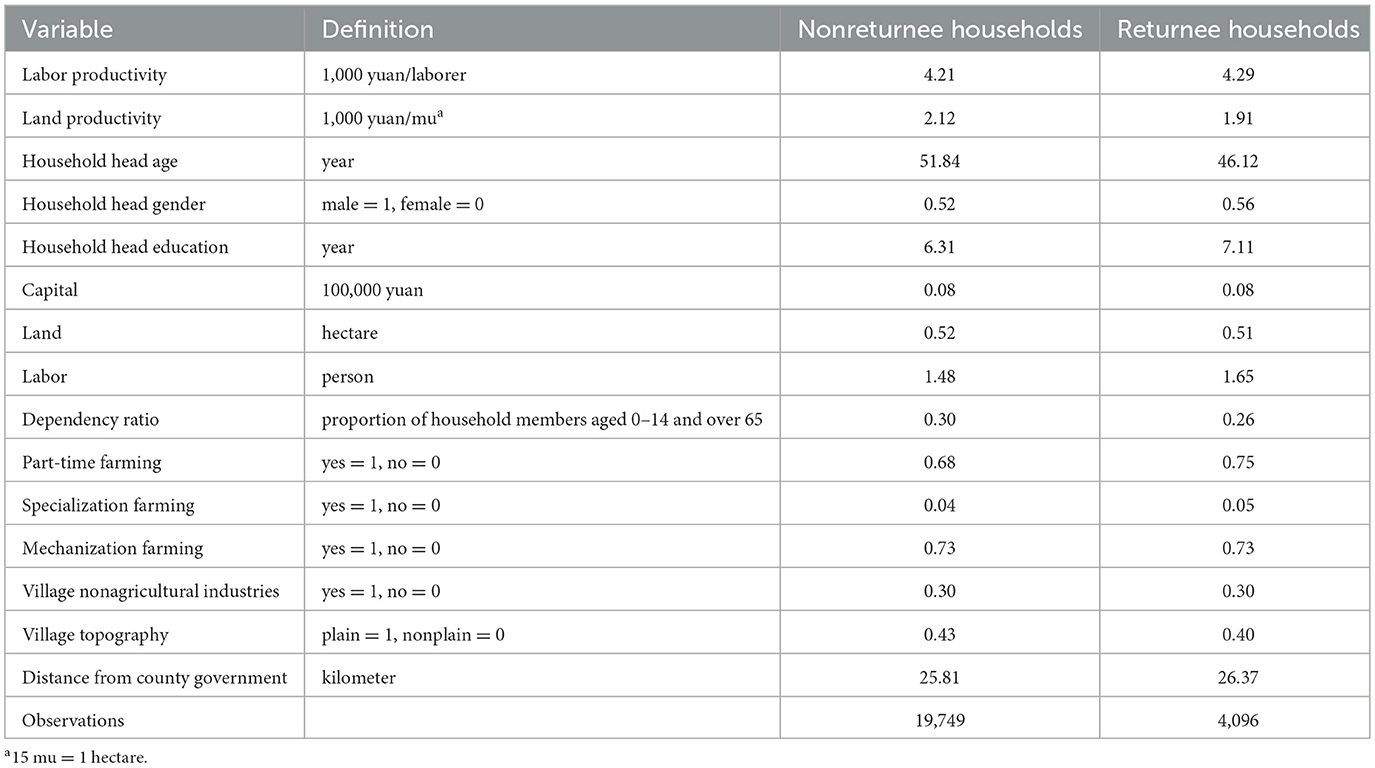
Table 1. Definitions of variables and their statistical characteristics.
As presented in Table 1, 4,096 of the 23,845 observations (or 17.18%) are returnee households, defined as those with at least one return migrant. The share of return migration is consistent with that of previous studies. For instance, Zhang and Wang (2021) and Xiao and Luo reported that returnee households comprised 17.86% and 16.60% of the total sample, respectively.
2.2 Agricultural productivity and return migration
We use two variables to measure agricultural productivity—land productivity (measured in 1,000 yuan per mu, where 15 mu equals 1 hectare) and labor productivity (measured in 1,000 yuan per laborer). These two indicators are widely adopted in the literature. For instance, land productivity was used to measure agricultural productivity by Li et al. (2010) and Qian and Hong (2016); meanwhile, labor productivity was used by Li et al. (2010), Xu and Zhang (2016), and Zhang and Wang (2021).
Unlike previous studies (e.g., Shi and Yang, 2011; Qian et al., 2016), the data presented in Table 1 reveal that return migration has not led to an enhancement in agricultural productivity. As evident in the first row, although the average labor productivity of returnee households, which is 4,290 yuan per person, is slightly higher than that of nonreturnee households (4,210 yuan per person)—the difference is not statistical significant. Additionally, as indicated in the second row, the average land productivity of households with returnees stands at 1,910 yuan per mu, which is below the average land productivity of nonreturnee households (2,120 yuan per mu). Thus, there is no substantial discrepancy in either labor or land productivity between households with returnees and those without.
In addition, returnee households exhibit a significantly higher level of input in agricultural production compared with nonreturnee households. For instance, returnees tend to be younger, male household heads, and more educated compared with nonreturnee households (Rows 3–5). In addition, although there is no difference in capital and land investments between returnee and nonreturnee households, the labor input of returnee households is notably higher than that of nonreturnee households (Rows 6–8). Finally, returnee and nonreturnee households exhibit similarities in terms of farming and village characteristics (Rows 9–15).
Overall, the data in Table 1 indicate that the agricultural productivity of returnee households is not significantly higher than that of nonreturnee households. This is in stark contrast to the majority of previous literature, which suggests that return migration has a positive impact on agricultural productivity in the places of origin (e.g., Zhao, 2002; Ma, 2002; Shi and Yang, 2011; Shi and Wang, 2013; Qian et al., 2016; Hausmann and Nedelkoska, 2018; Zhang and Wang, 2021; Xiao and Luo, 2023).
2.3 Voluntary and involuntary returnees and their impact on agricultural productivity
To understand why return migration fails to influence agricultural productivity, we categorize return migrants into two distinct groups—voluntary and involuntary returnees. According to the International Organization for Migration (IOM) (2012), “voluntary return” is based on an individual's voluntary decision, which has two elements: freedom of choice, that is, no physical, psychological, or material pressure; and an informed decision, including having sufficient available, accurate, and comprehensive information as the basis for decision-making. In the paper, only one type of voluntary returnees is included, that is, the return migration driven by the belief that they can achieve a higher income there (Wang and Fan, 2006). Conversely, any return decision made under any form of compulsion, threat, and pressure is “involuntary return” (Mensah, 2016). These involuntary returns are typically prompted by four factors—declining health, the responsibility of caring for family members, inability to secure employment in urban areas, and difficulties adapting to city life (Liu and Shi, 2017).
Table 2 indicates that voluntary return migration is modest in scale, whereas involuntary return migration remains predominant. As presented in the first row, households with voluntary returnees only comprise 13.06% of all returnee households, whereas households with involuntary returnees comprise 86.94% of the total. Further observation reveals that poor health status and the need to take care of family members are the two major reasons for involuntary return, accounting for 25.39% (22.07/86.94 × 100%) and 54.51% (47.39/86.94 × 100%), respectively. The poor health status of returnees, either their own or that of their family members, can have an adverse impact on agricultural production.
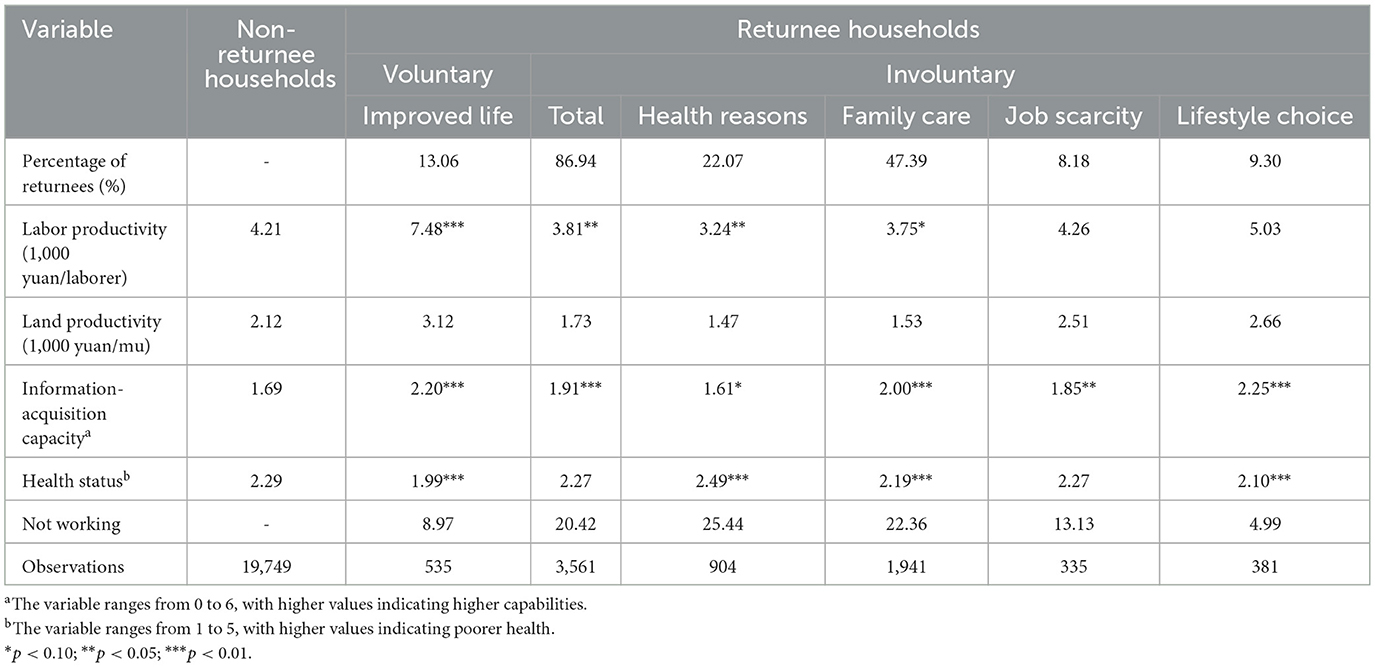
Table 2. Comparison of voluntary returnee, involuntary returnee, and non-returnee households.
As presented in Table 2, the productivity of voluntary returnees is higher than that of involuntary returnees. As presented in the second row of Table 2, the average productivity of voluntary returnees is 7,480 yuan per laborer, which is 77.67% higher than that of households without return migrants (4,210 yuan per laborer). Meanwhile, the labor productivity of involuntary returnees is 9.50% lower than that of nonreturnee households (3,810 vs. 4,210 yuan per laborer). Similar results were obtained when comparing land productivity—households with voluntary returnees have a land productivity of 3,120 yuan per mu; households with involuntary returnees have 1,730 yuan per mu; and households without returnees have 2,120 yuan per mu, as presented in the third row of Table 2.
The finding is expected because compared with voluntary returnees, involuntary returnees cannot fully concentrate on agricultural production. Following Goyal (2010) and Ragasa et al. (2013), this study uses information acquisition capacity to denote farmers' ability in agricultural production. As presented in the fourth row of Table 2, voluntary and involuntary returnees have higher information acquisition capacity (2.20 and 1.91) than nonreturnees (1.69). Moreover, the health status of involuntary returnee households (2.27) is worse than that of voluntary returnee households (1.99). Additionally, more than 20% of involuntary returnees are unable to work due to their health or the need to care for family members (Row 5). Therefore, the lower productivity of involuntary returnee households may, at least partially, result from their physical health problems and their family care responsibilities.
3 Results and discussion
Table 1 reveals that return migration has no impact on agricultural production. Table 2 indicates that while voluntary migration has a positive impact, involuntary migration has a negative impact on agricultural productivity. However, these findings might be misleading due to the presence of other confounding factors. To isolate the impact of return migration, we establish and estimate econometric models.
3.1 Overall impact of return migration on agricultural productivity
First, we estimate the overall impact of return migration on agricultural productivity. The regression equation is as follows:
In Equation 1, Productivityit denotes the agricultural productivity of household i in year t. In this study, agricultural productivity is measured by labor and land productivity. εit is the stochastic disturbance term.
The first independent variable, Returnit, indicates whether a household is a returnee household, denoted as 1 if there is at least one returnee and 0 if otherwise. The coefficient β11 represents the difference in agricultural productivity between returnee and nonreturnee households. A significantly positive coefficient indicates that the agricultural productivity of returnee households is higher than that of nonreturnee households. Conversely, an estimated coefficient that is not significantly different from zero implies that there is no relationship between return migration and agricultural productivity.
Xit represents other variables affecting agricultural productivity, including the characteristics of the household head, family, and village. Household head characteristics include the age, gender, and education of the household head (e.g., Xiao and Luo, 2023). Family characteristics encompass capital (100,000 yuan), land (hectare), number of agricultural labors, dependency ratio (proportion of family members aged 0–14 and over 65), part-time farming (yes = 1), specialization farming (yes = 1), and mechanized farming (yes = 1) (e.g., Zhao, 2002; Démurger and Xu, 2011; Hu and Shi, 2013). Village characteristics include the presence of nonagricultural industries (yes = 1), village topography (plain = 1), and the distance from the village to the county government (with the assumption that a shorter distance indicates better economic development) (e.g., Zhao, 2002; Hu and Shi, 2013).
Finally, IDi represents the household dummies while Year represents the year dummy variable. The IDi variable primarily controls for omitted variables at the household level that do not change over time and may affect agricultural productivity, such as household preferences and other unobservable variables. Similarly, Year mainly controls for factors affecting all households that vary over time, such as macroeconomic conditions at different times. The inclusion of these dummy variables makes Equation 1 a two-way fixed effect model.
The estimation results of Equation 1 unequivocally indicate that return migration does not exert a significant influence on agricultural productivity. As presented in the first row of Table 3, the estimated coefficients associated with returnee households are statistically nonsignificant. The estimation results indicate that return migration does not affect either labor or land productivity (Columns 1–2). This observation aligns with the finding presented in Table 1, where other variables that may influence agricultural productivity were not considered.
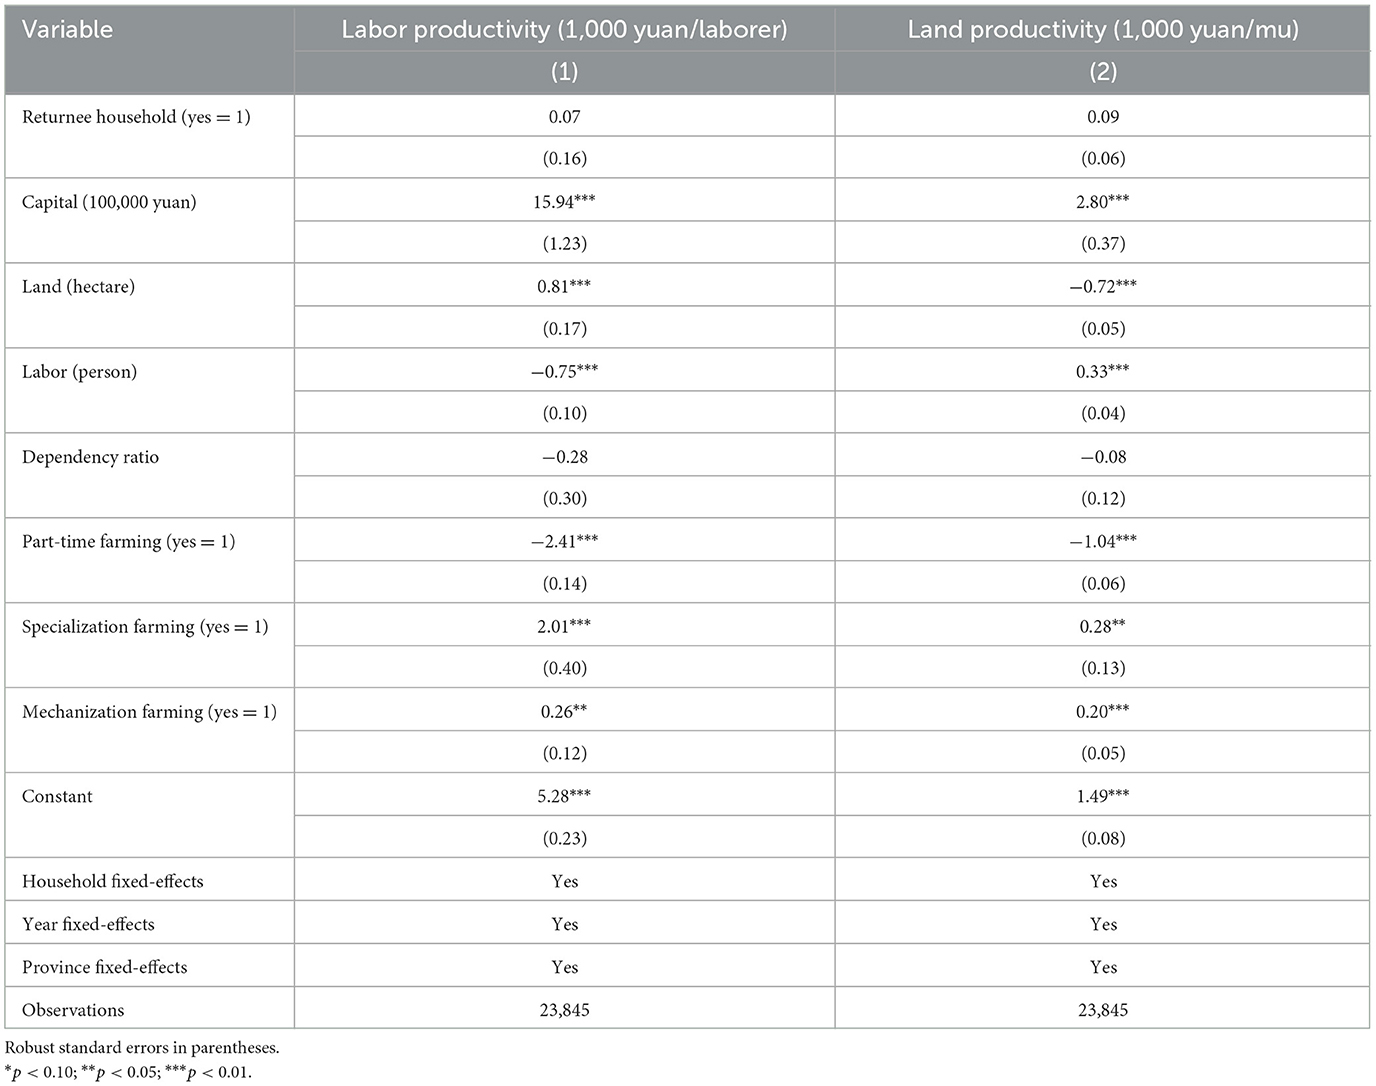
Table 3. Impact of return migration on agricultural productivity.
To test the robustness of our findings, we reran the model under two different scenarios. Table 3 addresses the endogeneity issue stemming from time-invariant omitted variables caused by the household fixed effects model. However, there may still be endogeneity concerns related to the variable indicating whether a household is a returnee household, such as reverse causation issue and self-selection bias problem.
Agricultural productivity can affect whether migrant workers return, posing a reverse causality issue (Shi and Yang, 2011; Qian et al., 2016). To address this issue, we followed (Qian et al. 2016) and (Hausmann and Nedelkoska 2018) by employing the average village return rate as an instrumental variable. The average village return rate is closely related to whether a household is a returnee household. Due to the existence of migrant networks (Zhao, 2003; Qian et al., 2016), migrant workers from a village are likely to gather in the same area for work, thus the return flow of some may lead to similar behavior by others, exhibiting a herd effect (Piracha and Vadean, 2010). However, the average village return rate does not affect the agricultural productivity of a household. Because it is calculated as the average return rate of all other households in the village, excluding the household being analyzed. It will not directly affect a family's agricultural productivity. Agricultural productivity is more influenced by agricultural production investment, etc. (Wang and Yang, 2013; Xiao and Luo, 2023). As presented in Table 4, return migration continues to have a nonsignificant impact on agricultural productivity, despite the validity of the instrumental variable (Rows 1–2).
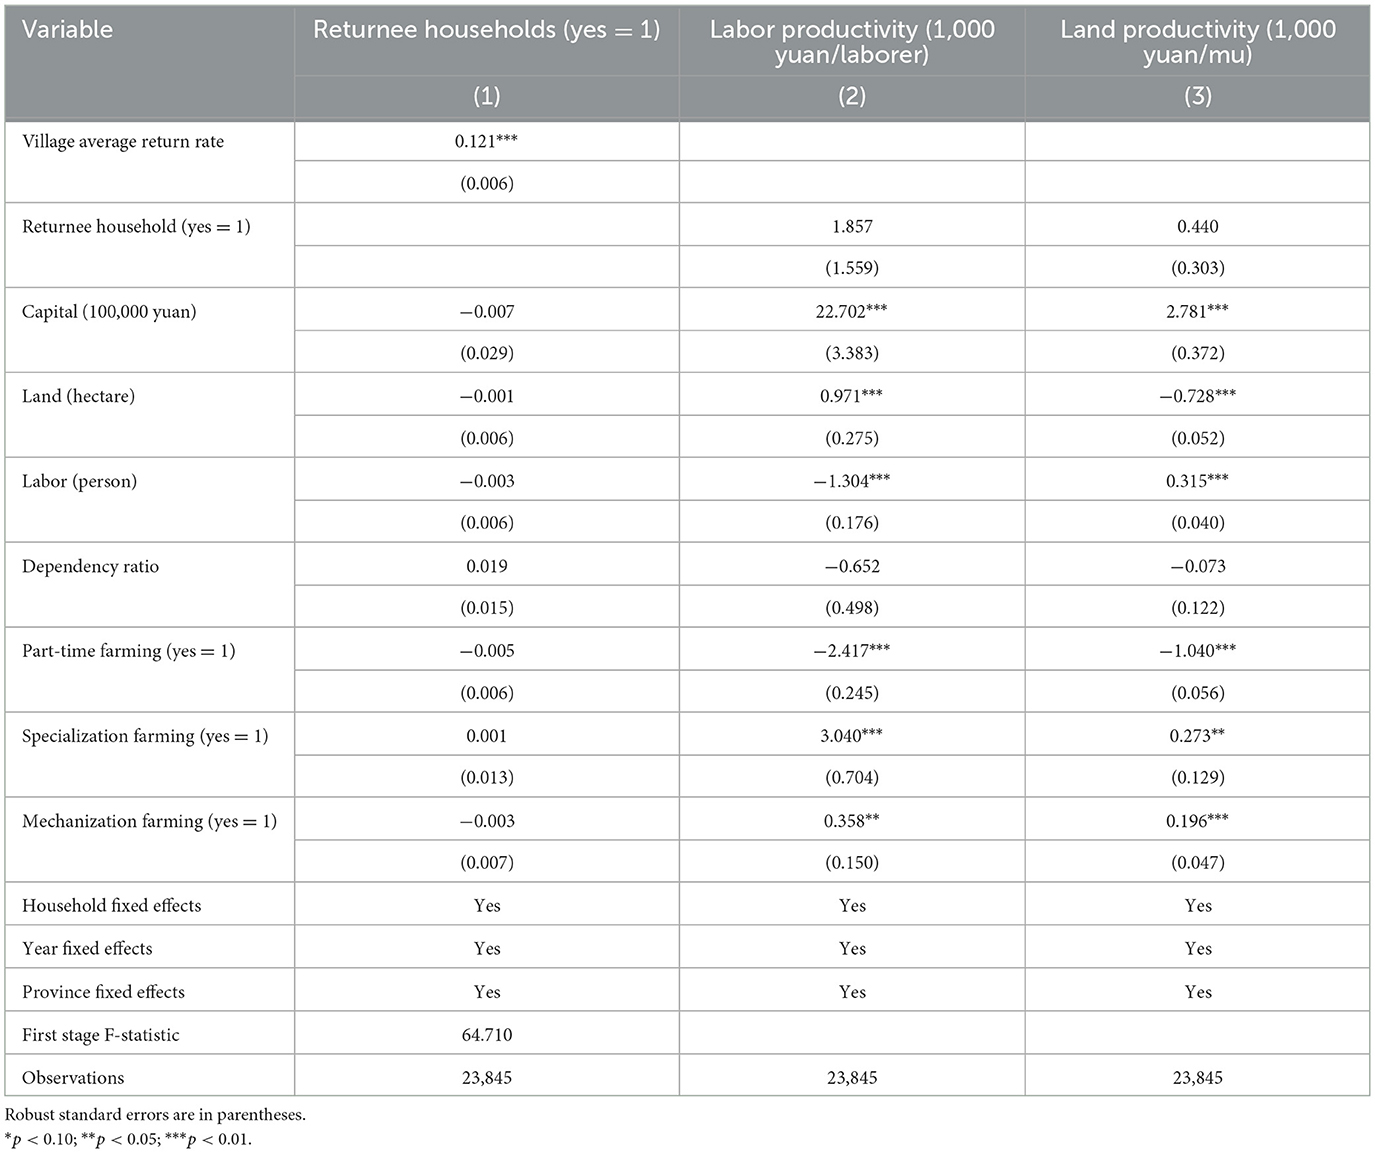
Table 4. Impact of return migration on agricultural productivity using instrumental variable method.
Further, the dataset may be subject to a self-selection bias. Specifically, an individual's personal preference or willingness to pay a premium for return migration varies and remains unobserved (Wahba, 2015; Batista et al., 2017). To mitigate this issue, following previous studies, we utilize PSM (e.g., Barrett and Goggin, 2010; Fransen et al., 2017). The estimation results indicate that after accounting for potential self-selection bias, the nonsignificant effect of return migration on agricultural productivity persists (Table 5).

Table 5. Average treatment effect of return migration on agricultural productivity using PSM.
In summary, Tables 3–5 demonstrate that the cumulative effect of return migration on agricultural productivity is not significant. This finding concurs with the descriptive analysis presented in Table 1. In the subsequent sections, we delve deeper into the reasons behind the absence of a notable overall impact of return migration.
3.2 Agricultural productivity of voluntary and involuntary returnees
To understand why the overall impact of return migration is insignificant, we estimate the impacts of voluntary and involuntary returnees separately, as in Table 2. To do so, we add an interaction term to indicate whether a household is a voluntary returnee household in Equation 1, which becomes:
In Equation 2, Voluntaryit represents whether a household is a voluntary returnee household. η1it is the stochastic disturbance term. All the other variables are as same as in Equation 1.
Unlike Equation 1, which assumes that the impact of voluntary returnees is the same as that of involuntary returnees, Equation 2 estimates their impacts separately. Specifically, α11 captures the difference in agricultural productivity between involuntary returnee and nonreturnee households. α12 represents the difference between voluntary and involuntary returnee households. Thus, α11 + α12 represents the difference between voluntary returnee and nonreturnee households.
Table 6 indicates that the agricultural productivity of voluntary returnee households is higher than that of nonreturnee households, and the difference between involuntary returnee and nonreturnee households is insignificant. As presented in the first row of Table 6, the estimated coefficients of returnee households are statistically insignificant in the labor productivity and land productivity functions, indicating that there is no difference in agricultural productivity between involuntary returnee and nonreturnee households. However, as presented in the second row, the estimated coefficients of the interaction term are significant in labor productivity, implying that the difference between voluntary and involuntary returnee households is statistically significant.4 To obtain the difference between voluntary returnee and nonreturnee households, we sum the estimated coefficients of the first two rows. We find that the voluntary returnee households earned 610 yuan (620 – 10 = 610 yuan per laborer) more per laborer than nonreturnee households (F-value = 3.02, p-value = 0.08). Similarly, the land productivity of voluntary returnee households is 240 yuan higher than that of nonreturnee households (F-value = 3.05, p-value = 0.08).
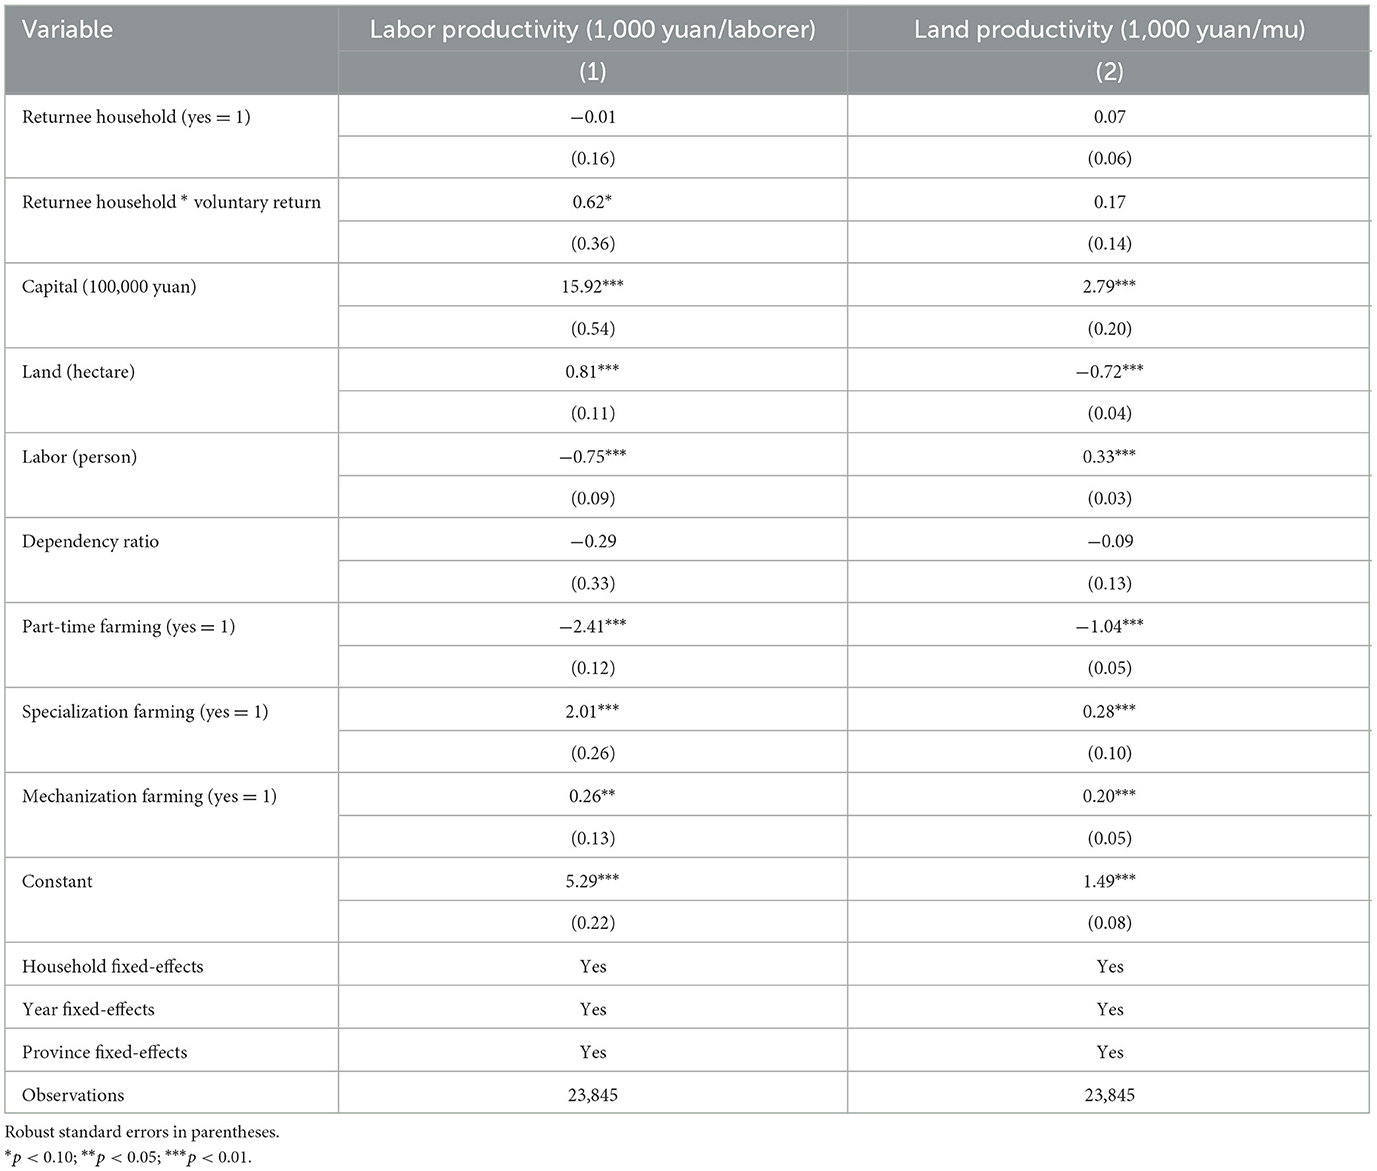
Table 6. Differential impact of voluntary returnee households on agricultural productivity.
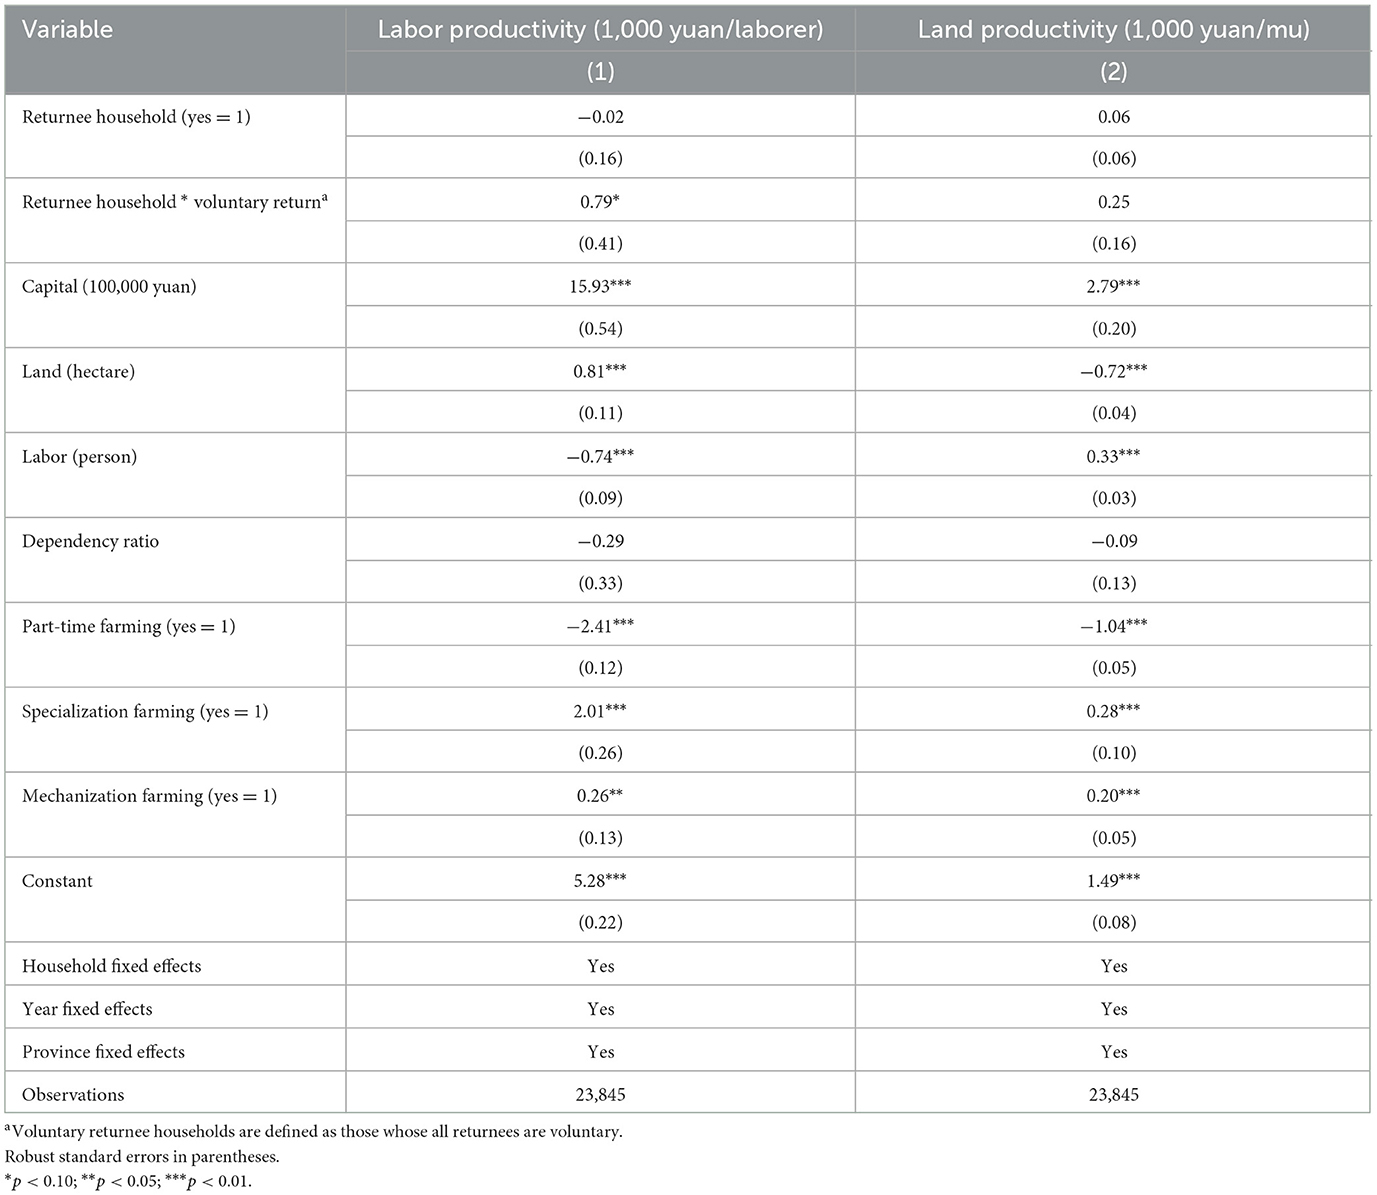
Table 7. Differential impact of voluntary returnee households on agricultural productivity.
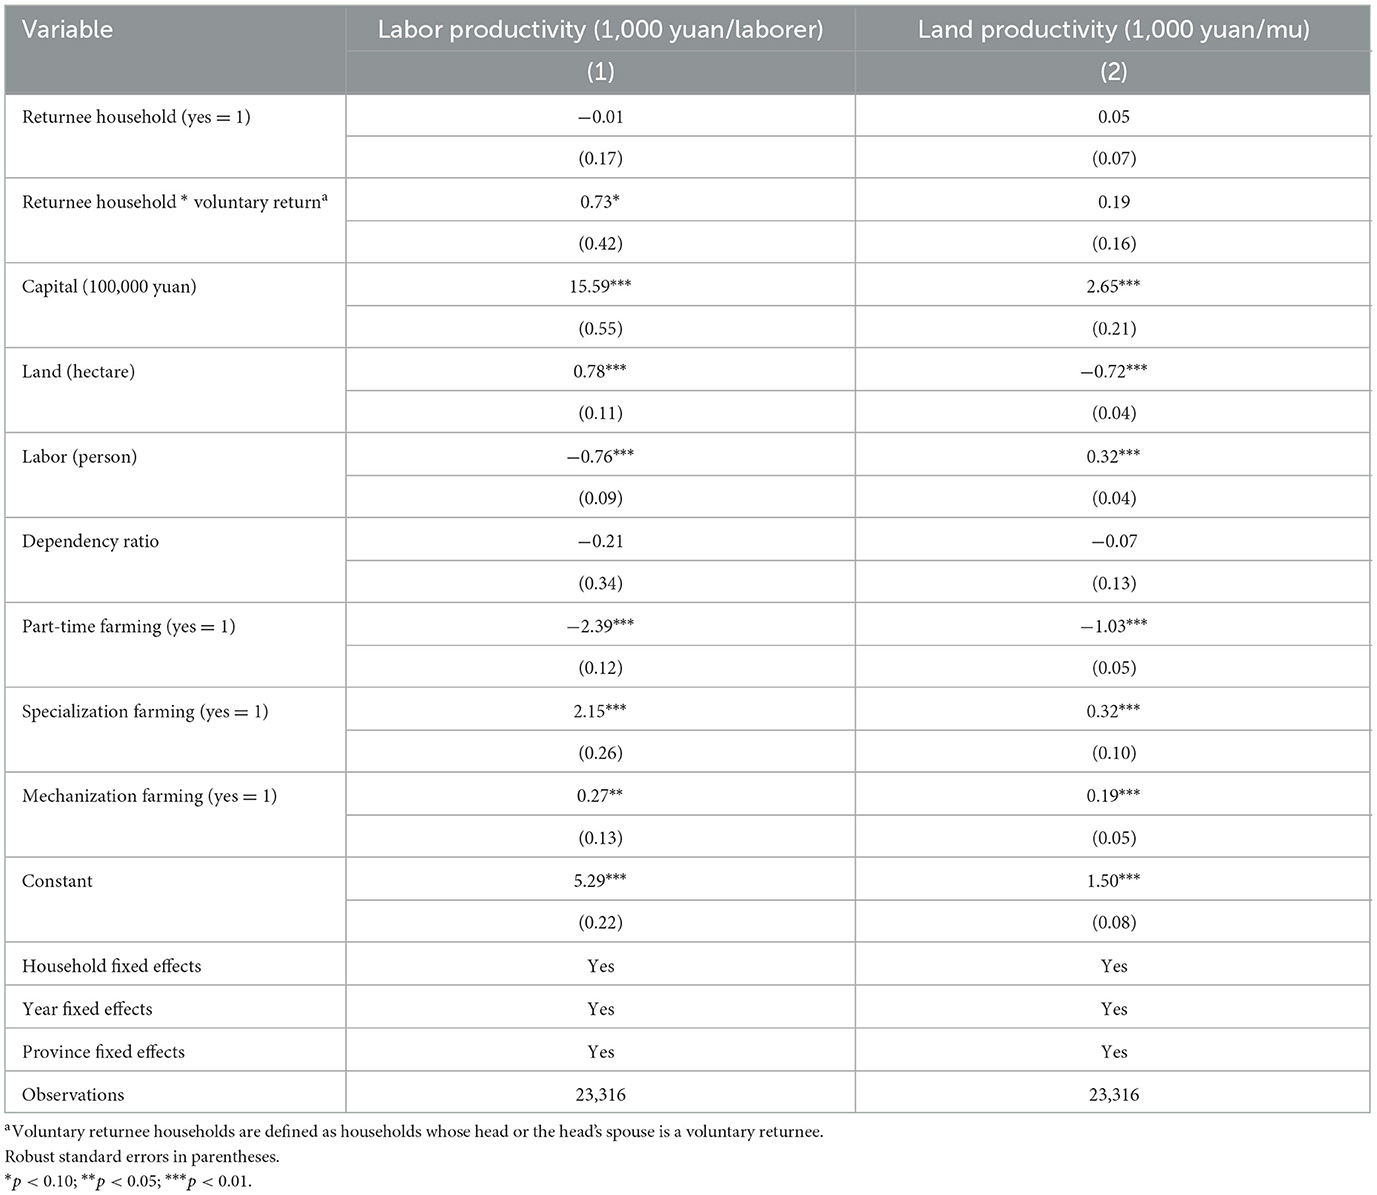
Table 8. Differential impact of voluntary returnee households on agricultural productivity.
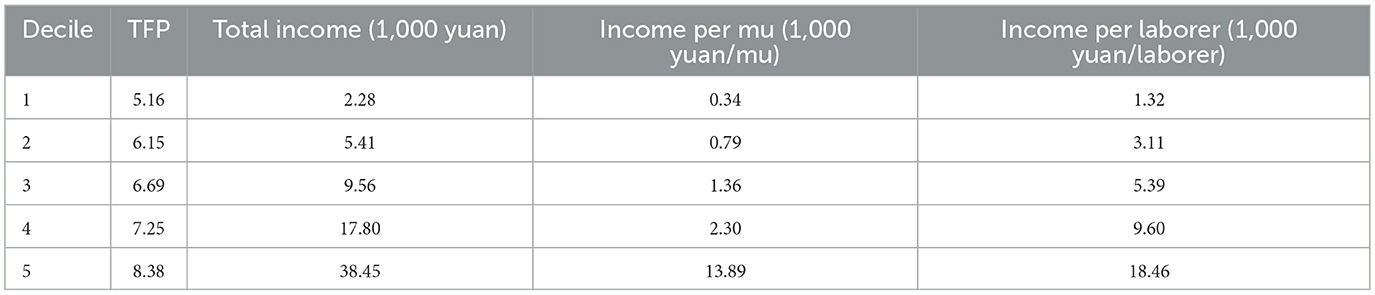
Table 9. Comparison of TFP with other efficiency indicators in agriculture.
Notably, the estimation in Table 6 aligns with the findings in Table 3. Hence, Table 6 reveals that the agricultural productivity of households with voluntary returnees is higher than that of nonreturnee households. However, there is no significant disparity in agricultural productivity between involuntary returnee and nonreturnee households. However, as indicated in Table 2, voluntary returnee households comprise only 13.06% of total returnees. Thus, it is unsurprising that the overall impact of return migration, as presented in Table 3, is insignificant.
4 Mechanism of the impact of return migration on agricultural productivity
In this section, we delve into the reasons behind the differential impacts of voluntary and involuntary returnees on agricultural productivity. Prior studies have indicated that the migration experience can enhance farmers' personal abilities, particularly their information-acquisition capacity (Shi and Yang, 2011). This enhancement contributes to the improvement of total factor productivity (TFP) in agricultural production, ultimately leading to an increase in agricultural productivity (Ding et al., 2011).
To validate this relationship, we first calculate the TFP for the various household types, that is, voluntary returnees, involuntary returnees, and nonreturnee households. We then examine the correlation between TFP and these household types. Finally, we delve into the determinants of TFP, focusing on information acquisition capacity and health status. This analysis aims to uncover the mechanisms behind the differences in agricultural productivity among the three household types.
4.1 TFP among different types of households
Following previous studies (e.g., Zhu et al., 2011; Gai et al., 2017; Wang et al., 2020; Chari et al., 2021; Adamopoulos et al., 2022), we use Equation 3 to calculate TFP.
In Equation 3, Rit represents farmer i's income in year t. θ1, θ2, and θ3 are the substitution elasticities for land (M), capital (K), and labor (L), respectively.
Following Gai et al. (2017) and Wang et al. (2020), this study estimated a fixed effects model to obtain these elasticities. Taking the logarithm of both sides of Equation 3 for various output and input types, incorporating time and household fixed effects, and adding an error term, we obtain an equation that can be estimated.5 The estimated θ1, θ2, and θ3 are then standardized based on constant returns to scale (i.e., ), following Li et al. (2010) and Zhu et al. (2011).6 The calculated elasticities of the land (), capital (), and labor () factors are consistent with those of previous studies (e.g., Zhu et al., 2011; Hausmann and Nedelkoska, 2018; Xiao and Luo, 2023).
Figure 1 depicts the calculated TFP among various types of households. By incorporating the standardized elasticities into Equation 3, we derive the specific values of TFP for each household type. We then compute the average TFP for voluntary returnee, involuntary returnee, and nonreturnee households.7 As presented in Panel A, the TFP of returnee households is slightly lower than that of nonreturnee households, indicating that returnee households do not lead to an increase in agricultural productivity. Meanwhile, Panel B indicates that the TFP of voluntary returnee households is significantly higher than that of nonreturnee households, which is higher than that of involuntary returnee households.
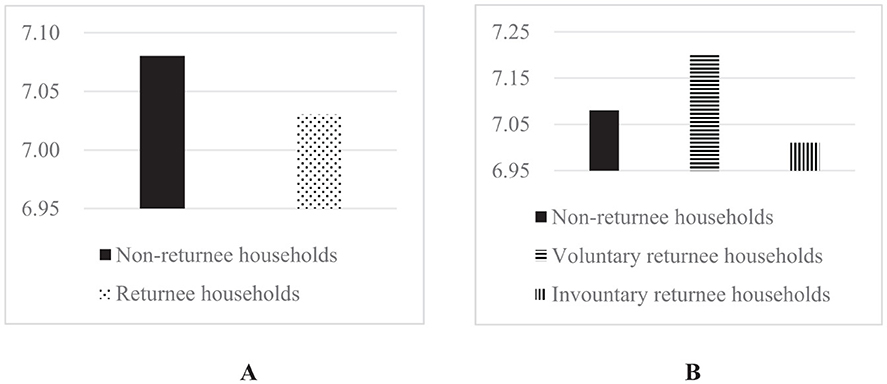
Figure 1. TFP of returnee and non-returnee households. This Figure depicts the agricultural TFP of non-returnee and returnee households. As shown in the (A), the agricultural TFP of returnee households is lower than that of non-returnee households. (B) divides returnee households into voluntary returnee households and involuntary returnee households. The conclusion is that the agricultural TFP of voluntary returnee households is significantly higher than that of non-returnee households, while that of involuntary returnee households is significantly lower than that of non-returnee households.
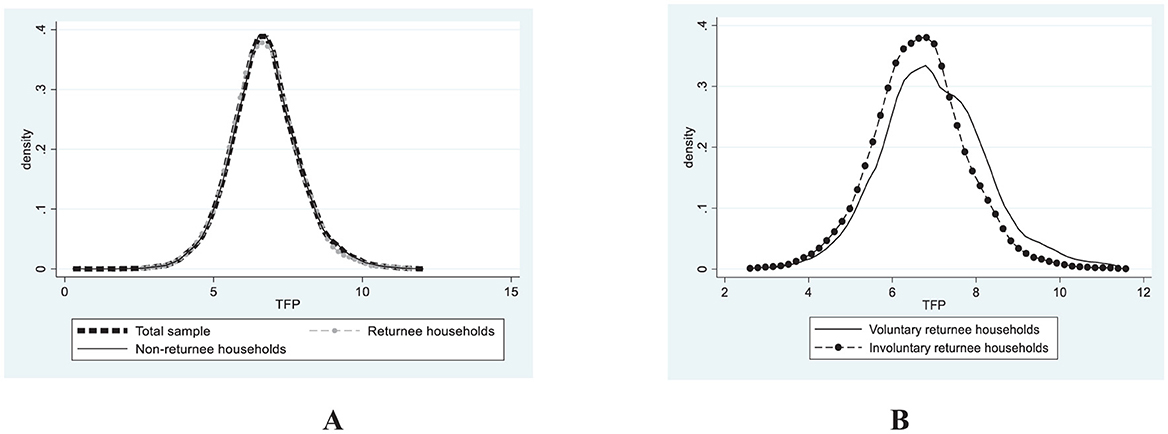
Figure 2. Kernel density estimate of agricultural TFP. This Figure depicts the kernel density estimates of agricultural TFP for voluntary and involuntary returnee households. (A) describes the kernel density estimates of agricultural TFP for the total sample, returnee households and non-returnee households, and (B) describes the kernel density estimates of agricultural TFP for voluntary and involuntary returnee households. As shown in the figure, the kernel density estimate graph of agricultural TFP of various households roughly follows a normal distribution form.
4.2 Impact of return migration on TFP
To test whether return migration affects agricultural productivity via TFP, we define the following model:
All the variables in Equations 4 and 5 are as discussed above. TFP is measured using the natural logarithm form.
The estimation results of Equations 4 and 5 are presented in Table 10. The first two columns present the estimation results for Equation 4, whereas Columns 3–6 present the estimation results for Equation 5. Column 1 presents the results without the interaction term, whereas Column 2 includes the interaction term. Columns 3 and 4 report the estimation results when labor productivity is the dependent variable. Finally, Columns 5 and 6 display the estimation results when land productivity is the dependent variable.
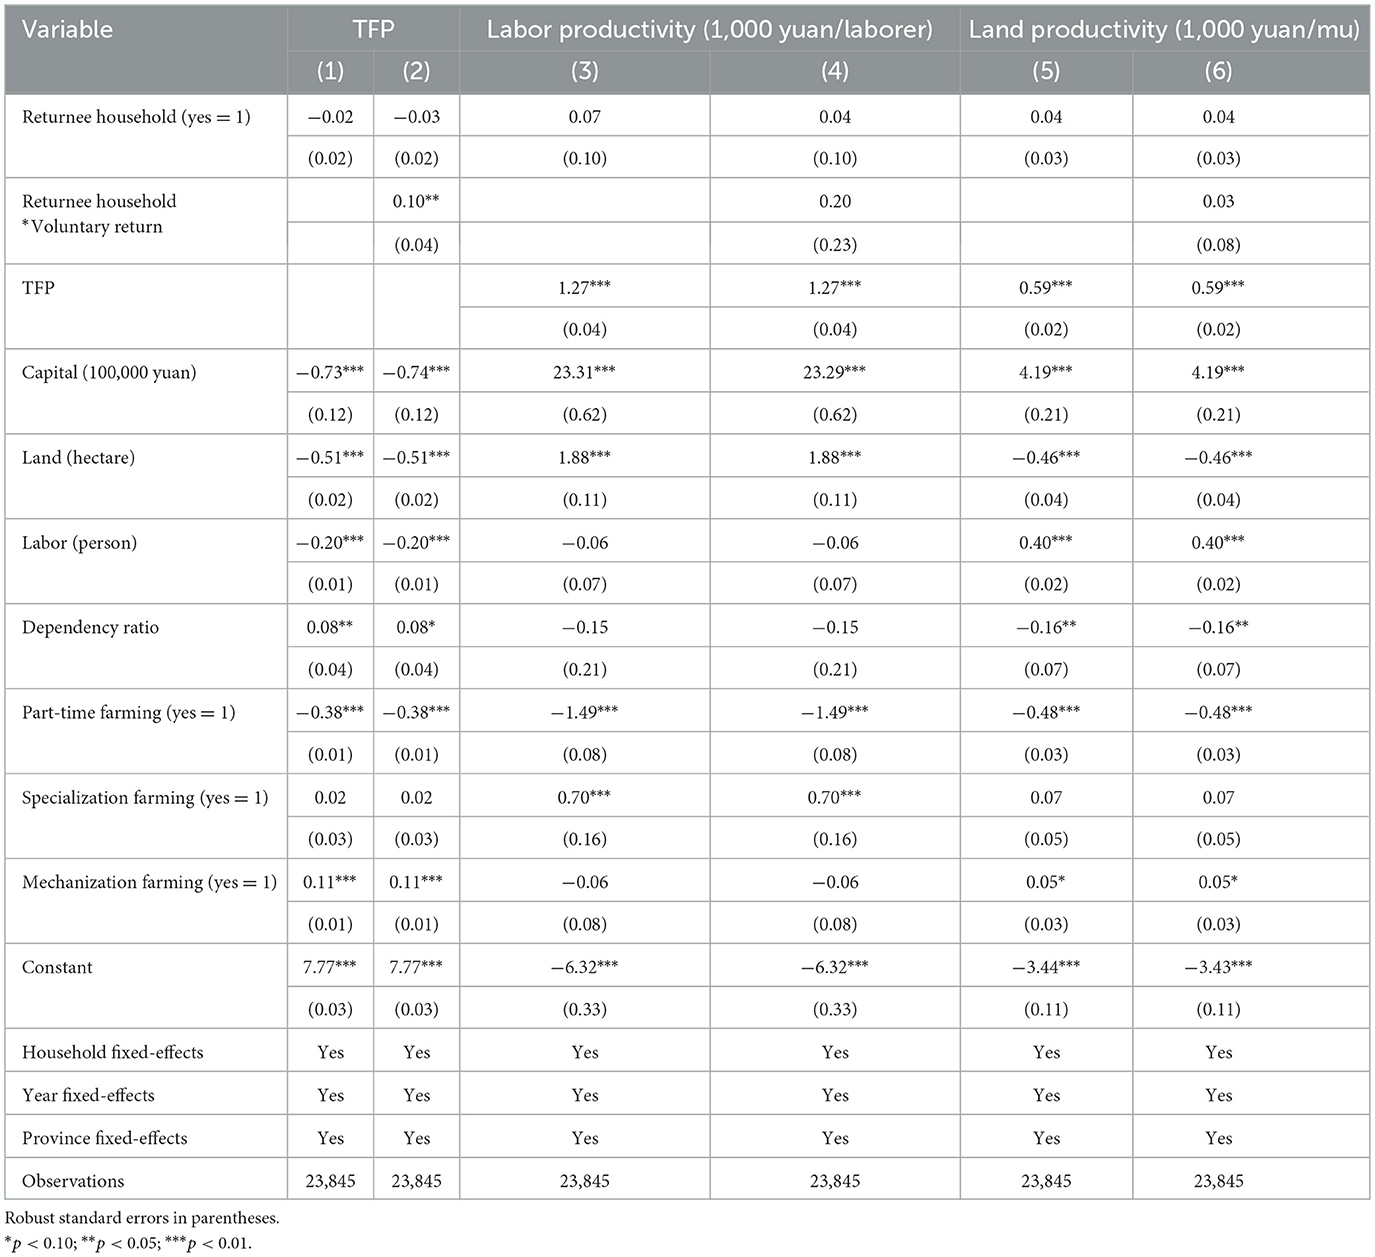
Table 10. Return migration's effect on agricultural productivity via TFP.
As expected, the first two columns of Table 10 demonstrate that involuntary return migration negatively affects TFP, whereas voluntary return migration positively affects TFP. In the first row, the estimated coefficient for overall return migration, which encompasses voluntary and involuntary returnees, is insignificant. In contrast, the estimated coefficient for the interaction term, representing the differential impact of voluntary returnees, is positive and statistically significant, indicating a significant increase in TFP among households with voluntary returnees, particularly in comparison with nonreturnee households.8
The estimation results presented in Table 10 support the mechanism through which return migration impacts agricultural productivity via TFP. As presented in Row 3 of Columns 3–6, the estimated coefficients for TFP are positive and statistically significant. This finding indicates a significant positive correlation between TFP and both labor and land productivity, confirming that improvements in TFP directly contribute to increased agricultural productivity. Therefore, Table 10 demonstrates that voluntary and involuntary return migration have distinct impacts on TFP, which in turn has varying effects on agricultural productivity.
In Columns 4 and 6, the estimated coefficient for the returnee variable and the interaction term between returnee and voluntary households are insignificant. This finding implies that the differential impacts of voluntary and involuntary returnees on agricultural productivity can primarily be explained by their effects on TFP. After considering the influence of TFP, the distinctions between voluntary returnees, involuntary returnees, and nonreturnees on agricultural productivity, as initially outlined in Table 6, become less pronounced. Thus, when TFP is factored in the model, the differences in the impact these types of households have on agricultural output diminish.9
4.3 Impact of information acquisition ability and health status on TFP
Why do involuntary returnees have a lower TFP than voluntary returnees? In this subsection, we aim to identify the factors contributing to this disparity. Our investigation centers on the influence of households' information-acquisition ability and households' health status. To this end, we established the following models:
In Equation 6, Inforit represents households' information acquisition capabilities10. The information acquisition capability index is constructed by summing responses to the following three questions:(1) Household internet use: 0 indicates no access, 1 indicates access via either mobile phone or computer, and 2 indicates access via both; (2) Number of books in the household: 0 indicates no books, 1 indicates a number of books below the sample mean, and 2 indicates a number of books above the sample mean; (3) Household telephone use: 0 indicates no telephone, 1 indicates access to either a landline or a mobile phone only, and 2 indicates access to both. Following previous studies (e.g., Gao and Niu, 2019; Xiao and Luo, 2023), it ranges from 0 to 6, with higher values indicating higher capabilities. Previous studies have demonstrated that improving information-acquisition capabilities helps farmers gain a deeper understanding of advanced agricultural production technologies or best practices (Goyal, 2010; Ragasa et al., 2013), thereby contributing to an increase in TFP. In Equation 7, Healthit represents the average self-rated health status of family members11, ranging from 1 to 5, with higher values indicating poorer health. Poor health status is intuitively associated with lower TFP as it can hinder farmers' ability to engage in productive activities. In addition, because health status is self-reported, it may deviate to some extent from respondents' actual physical conditions. Among rural populations, many individuals may have health problems without being aware of them. The data used in this study cannot provide an objective measurement of individual health conditions. Future research would benefit from incorporating more objective health indicators. All the other variables in Equations 6–8 remain the same as previously defined.
The estimation results of Table 11 validate that migration experience positively impacts households' information-acquisition capabilities, leading to an increase in TFP. As evident in Columns 1 and 2 of Table 11, the estimated coefficients for all returnees, involuntary returnees, and voluntary returnees are positive and statistically significant. This implies that these households' information-acquisition capabilities improved after migration (Rows 1–2), subsequently enhancing their TFP (Row 3).

Table 11. Returnee households' effect on TFP via information acquisition capabilities and health status.
Meanwhile, involuntary returnee households tend to have a poorer health status than voluntary returnees, which contributes to a decrease in TFP. Row 1 of Table 11 indicates that the health status of involuntary returnee households is comparable to that of nonreturnee households, whereas the health status of voluntary returnee households is superior (Column 4). The positive effect of health status on TFP (Row 4) results in a higher TFP among voluntary returnee households, resulting in greater agricultural productivity.
5 Conclusions and suggestions
The literature on whether return migration can improve agricultural productivity in China is inconsistent. Using nationally representative panel data from the CLDS for 2012, 2014, 2016, and 2018, this study investigates differences in agricultural productivity among households with voluntary returnees, involuntary returnees, and nonreturnees. This study draws three main conclusions. First, voluntary returnee households positively impact agricultural productivity, but such households constitute a small proportion of the total returnees; meanwhile, the adverse effects caused by involuntary returnee households on agricultural productivity are more dominant. Second, the agricultural production performance of voluntary returnee households is better because these households possess stronger information acquisition capabilities, leading to higher TFP in agricultural production. Third, poor health issues reduce the TFP of involuntary returnee households, leading to a reduction in agricultural productivity.
The findings of this study have significant policy implications. First, to strengthen the positive impact of voluntary returnees on agricultural productivity, it is essential to attract more voluntary returnees and to address the structural barriers that constrain their productivity gains. Although voluntary returnees benefit from stronger information access, the rural digital divide—such as limited broadband penetration and insufficient mobile network coverage—restricts the full realization of these advantages. Therefore, policymakers should intensify the implementation of existing rural information infrastructure initiatives and digital skills training programs, such as the “Broadband China” strategy and digital village pilot policies. By narrowing the rural digital divide, measures like village-level information service stations can enhance returnees' access to information and improve the efficiency of technology adoption.
Second, for involuntary returnees, their productivity is often constrained by poor health conditions and care responsibilities. Targeted support should thus be provided in areas such as healthcare and childcare. Specifically, efforts should be made to strengthen the urban-rural health insurance system, optimize the reimbursement catalog for chronic diseases under the New Rural Cooperative Medical Scheme, and integrate these improvements with “Internet Plus Healthcare” pilot programs to reduce medical costs. In addition, the rural elderly care service system should be reinforced by developing household-based elderly care stations and offering home-based services for disabled seniors. Furthermore, local governments should expand affordable childcare programs in rural communities to alleviate the care burden on working-age household members.
Data availability statement
The original contributions presented in the study are included in the article/supplementary material, further inquiries can be directed to the corresponding author.
Author contributions
XL: Data curation, Methodology, Software, Writing – original draft, Writing – review & editing. FQ: Conceptualization, Formal analysis, Funding acquisition, Methodology, Supervision, Writing – original draft, Writing – review & editing.
Funding
The author(s) declare that financial support was received for the research and/or publication of this article. The research was funded by the initial financial support from the National Natural Sciences Foundation of China (71773150).
Conflict of interest
The authors declare that the research was conducted in the absence of any commercial or financial relationships that could be construed as a potential conflict of interest.
Generative AI statement
The author(s) declare that no Gen AI was used in the creation of this manuscript.
Any alternative text (alt text) provided alongside figures in this article has been generated by Frontiers with the support of artificial intelligence and reasonable efforts have been made to ensure accuracy, including review by the authors wherever possible. If you identify any issues, please contact us.
Publisher's note
All claims expressed in this article are solely those of the authors and do not necessarily represent those of their affiliated organizations, or those of the publisher, the editors and the reviewers. Any product that may be evaluated in this article, or claim that may be made by its manufacturer, is not guaranteed or endorsed by the publisher.
Footnotes
1. ^Return migration. Accessed from http://www.iom.int/jahia/Jahia/managing-migration-return-migration.
2. ^Data Availability. We released the code and data used in this work at a publicly accessible GitHub Repository (https://anonymous.4open.science/r/eco). Due to website maintenance, the original data are currently unavailable to the public. The data are available on request through Y3NzZGF0YUBtYWlsLnN5c3UuZWR1LmNu.
3. ^Data are from the China Labor-force Dynamics Survey (CLDS) 2012, Survey Manual compiled by the Center for Social Science Survey, Sun Yat-sen University.
4. ^In this study, voluntary returnee households are defined as households with at least one voluntary returnee. To examine the robustness of this definition, we rerun Equation 2 under two alternative scenarios. First, we redefine voluntary returnee households as those whose all returnees are voluntary. Second, we consider households whose household head or the head's spouse is a voluntary returnee as voluntary returnee households. As evident in the estimation results presented in Tables 7, 8, these alternative definitions yield similar findings to those in Table 6. Therefore, we conclude that the definition of voluntary returnee households does not introduce estimation bias.
5. ^The estimation results are available upon request.
6. ^
7. ^We use two methods to validate our TFP calculations. Figure 2 depicts that the TFP distributions align with normal distributions. Additionally, we compare our TFP with agricultural income indicators, revealing a positive correlation in Table 9.
8. ^The sum of the first and second rows is significant (F-value = 3.27, p-value = 0.07).
9. ^The sum of the first and second rows are insignificant (F-values = 1.16 and 0.90, p-values = 0.28 and 0.34, respectively).
10. ^We validated the reliability and construct validity of this index using both factor analysis and Cronbach's α.
11. ^The Granger-causality test shows that while health status does not Granger-cause returnee household migration (p = 0.421), returnee households significantly Granger-cause subsequent health status deterioration (p = 0.006).
References
Adamopoulos, T., Brandt, L., Leight, J., and Restuccia, D. (2022). Misallocation, selection, and productivity: a quantitative analysis with panel data from China. Econometrica 90, 1261–1282. doi: 10.3982/ECTA16598
Bai, N. S., and He, Y. P. (2002). Return home or go out to work? A study on the return flow of rural labor force in Anhui and Sichuan provinces. Sociol. Stud. 3, 64–78. doi: 10.19934/j.cnki.shxyj.2002.03.006
Bairoliya, N., and Miller, R. (2021). Social insurance, demographics, and rural-urban migration in China. Reg. Sci. Urban Econ. 91:103615. doi: 10.1016/j.regsciurbeco.2020.103615
Barrett, A., and Goggin, J. (2010). Returning to the question of a wage premium for returning migrants. Natl. Inst. Econ. Rev. 213, 43–51. doi: 10.1177/0027950110380326
Batista, C., McIndoe-Calder, T., and Vicente, P. C. (2017). Return migration, self-selection and entrepreneurship. Oxford Bull. Econ. Stat. 79, 797–821. doi: 10.1111/obes.12176
Bilecen, T. (2022). To stay or to return? A review on return migration literature. Migr. Lett. 19, 367–385. doi: 10.33182/ml.v19i4.2092
Bucheli, J. R., and Fontenla, M. (2025). The impact of return migration on economic development. Rev. Econ. Stat. 107, 393–407. doi: 10.1162/rest_a_01273
Chari, A., Liu, E. M., Wang, S. Y., and Wang, Y. (2021). Property rights, land misallocation, and agricultural efficiency in China. Rev. Econ. Stud. 88, 1831–1862. doi: 10.1093/restud/rdaa072
De Vreyer, P., Gubert, F., and Robilliard, A. S. (2010). Are there returns to migration experience? An empirical analysis using data on return migrants and non-migrants in West Africa. Ann. Econ. Stat. 307–328. doi: 10.15609/annaeconstat2009.97-98.307
Démurger, S., and Xu, H. (2011). Return migrants: the rise of new entrepreneurs in rural China. World Dev. 39, 1847–1861. doi: 10.1016/j.worlddev.2011.04.027
Ding, S., Meriluoto, L., Reed, W. R., Tao, D., and Wu, H. (2011). The impact of agricultural technology adoption on income inequality in rural China: evidence from southern Yunnan Province. China Econ. Rev. 22, 344–356. doi: 10.1016/j.chieco.2011.04.003
Ette, A., Sauer, L., and Fauser, M. (2021). “Settlement or return? The intended permanence of emigration from Germany across the life course,” in The Global Lives of German Migrants: Consequences of International Migration Across the Life Course (Cham: Springer International Publishing), 101–118. doi: 10.1007/978-3-030-67498-4_6
Flahaux, M. L. (2021). Reintegrating after return: conceptualisation and empirical evidence from the life course of Senegalese and Congolese migrants. Int. Migr. 59, 148–166. doi: 10.1111/imig.12705
Fransen, S., Ruiz, I., and Vargas-Silva, C. (2017). Return migration and economic outcomes in the conflict context. World Dev. 95, 196–210. doi: 10.1016/j.worlddev.2017.02.015
Gai, Q. E., Zhu, X., Cheng, M. W., and Shi, Q. H. (2017). Improper allocation of land resources and labor productivity. Econ. Res. J. 52, 117–130. doi: 10.13821/j.cnki.ceq.2014.03.015
Gao, Y., and Niu, Z. H. (2019). Risk aversion, information acquisition capability, and analysis of farmers' adoption behavior of green prevention and control technology. China Rural Econ. 8, 109–127. doi: 10.20077/j.cnki.11-1262/f.2019.08.007
Garriga, C., Hedlund, A., Tang, Y., and Wang, P. (2023). Rural-urban migration, structural transformation, and housing markets in China. Am. Econ. J. Macroecon. 15, 413–440. doi: 10.1257/mac.20160142
Ge, D., Long, H., Qiao, W., Wang, Z., Sun, D., and Yang, R. (2020). Effects of rural–urban migration on agricultural transformation: a case of Yucheng City, China. J. Rural Stud. 76, 85–95. doi: 10.1016/j.jrurstud.2020.04.010
Gmelch, G. (1980). Return migration. Annu. Rev. Anthropol. 9, 135–159. doi: 10.1146/annurev.an.09.100180.001031
Goyal, A. (2010). Information, direct access to farmers, and rural market performance in central India. Am. Econ. J. Appl. Econ. 2, 22–45. doi: 10.1257/app.2.3.22
Hagan, J. M., and Thomas Wassink, J. (2020). Return migration around the world: an integrated agenda for future research. Annu. Rev. Sociol. 46, 533–552. doi: 10.1146/annurev-soc-120319-015855
Hamdouch, B., and Wahba, J. (2015). Return migration and entrepreneurship in Morocco. Middle East Dev. J. 7, 129–148. doi: 10.1080/17938120.2015.1072696
Hausmann, R., and Nedelkoska, L. (2018). Welcome home in a crisis: effects of return migration on the non-migrants' wages and employment. Eur. Econ. Rev. 101, 101–132. doi: 10.1016/j.euroecorev.2017.10.003
He, X., Dong, M., and Zhou, Y. (2021). Return migration of rural migrant workers and rural resource allocation under the context of rural revitalization: a micro analysis based on the behavior of returned migrant workers. J. Financ. Econ. 47, 19–33. doi: 10.16538/j.cnki.jfe.20200806.101
Hu, F., and Shi, Y. (2013). Return migration selectivity and non-agricultural employment: evidence from Hubei Province. Popul. J. 35, 71–80. doi: 10.3969/j.issn.1004-129X.2013.02.008
Hu, F., Xu, Z., and Chen, Y. (2011). Circular migration, or permanent stay? Evidence from China's rural–urban migration. China Econ. Rev. 22, 64–74. doi: 10.1016/j.chieco.2010.09.007
Hu, Y., Wang, Y., and Zhang, P. (2023). Anti-urbanization and rural development: evidence from return migrants in China. J. Rural Stud. 103:103102. doi: 10.1016/j.jrurstud.2023.103102
International Organization for Migration (IOM) (2012). Return Migration. Available online at: http://www.iom.int/jahia/Jahia/managing-migration-return-migration
Li, G. C., Feng, Z. C., and Fan, L. X. A. (2010). Are small farmers really more efficient? Empirical evidence from Hubei Province. Econ. Q. 9, 95–124. doi: 10.13821/j.cnki.ceq.2010.01.010
Liu, Y. X., and Shi, F. H. (2017). Analysis of the factors influencing migrant workers' return flow. Zhejiang Soc. Sci. 8, 86–92. doi: 10.14167/j.zjss.2017.08.010
Ma, Z. (2002). Social-capital mobilization and income returns to entrepreneurship: the case of return migration in rural China. Environ. Plan. A 34, 1763–1784. doi: 10.1068/a34193
Martin, R., and Radu, D. (2012). Return migration: the experience of Eastern Europe. Int. Migr. 50, 109–128. doi: 10.1111/j.1468-2435.2012.00762.x
Meng, L., and Zhao, M. Q. (2018). Permanent and temporary rural–urban migration in China: evidence from field surveys. China Econ. Rev. 51, 228–239. doi: 10.1016/j.chieco.2017.10.001
Mensah, E. A. (2016). Involuntary return migration and reintegration. The case of Ghanaian migrant workers from Libya. J. Int. Migr. Integr. 17, 303–323. doi: 10.1007/s12134-014-0407-8
Ministry of Agriculture and Rural Affairs (2021). National Video Conference to Promote Entrepreneurship and Employment of Returnees. Available online at: https://www.gov.cn/xinwen/2021-03/16/content_5593221.htm (accessed March 15, 2021).
Mohamed, M. A., and Abdul-Talib, A. N. (2020). Push–pull factors influencing international return migration intentions: a systematic literature review. J. Enterprising Communities 14, 231–246. doi: 10.1108/JEC-01-2020-0004
Mullan, K., Grosjean, P., and Kontoleon, A. (2011). Land tenure arrangements and rural–urban migration in China. World Dev. 39, 123–133. doi: 10.1016/j.worlddev.2010.08.009
Murphy, R. (2000). Return migration, entrepreneurship and local state corporatism in rural China: the experience of two counties in south Jiangxi. J. Contemp. China 9, 231–247. doi: 10.1080/713675936
Piracha, M., and Vadean, F. (2010). Return migration and occupational choice: evidence from Albania. World Dev. 38, 1141–1155. doi: 10.1016/j.worlddev.2009.12.015
Qian, L., and Hong, M. Y. (2016). Non-agricultural employment, land transfer, and changes in agricultural production efficiency—an empirical analysis based on CFPS. China Rural Econ. 12, 2–16. doi: 10.20077/j.cnki.11-1262/f.2016.12.001
Qian, W., Wang, D., and Zheng, L. (2016). The impact of migration on agricultural restructuring: evidence from Jiangxi Province in China. J. Rural Stud. 47, 542–551. doi: 10.1016/j.jrurstud.2016.07.024
Ragasa, C., Berhane, G., Tadesse, F., and Taffesse, A. S. (2013). Gender differences in access to extension services and agricultural productivity. J. Agric. Educ. Ext. 19, 437–468. doi: 10.1080/1389224X.2013.817343
Rozelle, S., Taylor, J. E., and de Brauw, A. (1999). Migration, remittances, and agricultural productivity in China. Am. Econ. Rev. 89, 287–291. doi: 10.1257/aer.89.2.287
Schiele, M. (2021). Life satisfaction and return migration: analysing the role of life satisfaction for migrant return intentions in Germany. J. Ethn. Migr. Stud. 47, 110–129. doi: 10.1080/1369183X.2020.1763786
Shi, Z. L., and Wang, J. (2013). The experience of working outside and the acquisition of new technology by rural labor. J. Cent. South Univ. Financ. Econ. 2, 48–56. doi: 10.3969/j.issn.1003-5230.2013.02.007
Shi, Z. L., and Yang, Y. Y. (2011). The impact of working outside on the capacity development of rural labor and policy implications. Manag. World 12, 40–54. doi: 10.19744/j.cnki.11-1235/f.2011.12.005
Tezcan, T. (2019). Return home? Determinants of return migration intention amongst Turkish immigrants in Germany. Geoforum 98, 189–201. doi: 10.1016/j.geoforum.2018.11.013
Wahba, J. (2015). Selection, selection, selection: the impact of return migration. J. Popul. Econ. 28, 535–563. doi: 10.1007/s00148-015-0541-4
Wahba, J. (2021). Who benefits from return migration to developing countries?. IZA World Labor. doi: 10.15185/izawol.123.v2
Wang, L., Yang, R. D., and Wu, B. (2020). A study on the total factor productivity of Chinese farmers' agricultural production. Manag. World 36, 77–93. doi: 10.19744/j.cnki.11-1235/f.2020.0185
Wang, W. W., and Fan, C. C. (2006). Success or failure: selectivity and reasons of return migration in Sichuan and Anhui, China. Environ. Plan. A 38, 939–958. doi: 10.1068/a37428
Wang, X. Y., Cui, C. Y., and Zhao, Y. (2003). Working outside and returning home: employment transformation and rural development—a study on some migrant workers returning to their hometowns to start businesses. Manag. World 7, 99–109. doi: 10.19744/j.cnki.11-1235/f.2003.07.013
Wang, Z. C., and Yang, W. G. (2013). Self-employment or wage-employment? On the occupational choice of return migration in rural China. China Agric. Econ. Rev. 5, 231–247. doi: 10.1108/17561371311331115
Wu, X., Chen, L., Ma, L., Cai, L., and Li, X. (2023). Return migration, rural household investment decision, and poverty alleviation: evidence from rural Guangdong, China. Growth Change 54, 304–325. doi: 10.1111/grow.12656
Xiao, J., and Luo, B. L. (2023). An important issue in the modernization of Chinese agriculture: who will transform traditional agriculture? Evidence from the impact of migrant workers' return on agricultural specialized operations. Reform 8, 82–100. doi: 10.19985/j.cnki.cn11-1591/d.2023.08.007
Xu, J. G., and Zhang, X. (2016). The progress of agricultural productivity, labor transfer, and the joint development of industry and agriculture. Manag. World 7, 76–87. doi: 10.19744/j.cnki.11-1235/f.2016.07.008
Zhang, F. B., and Wang, H. Z. (2021). Labor return to hometown, factor allocation, and agricultural productivity. J. South China Agric. Univ. 20, 73–84. doi: 10.7671/j.issn.1672-0202.2021.03.007
Zhang, J., Huang, J., Wang, J., and Guo, L. (2020). Return migration and Hukou registration constraints in Chinese cities. China Econ. Rev. 63:101498. doi: 10.1016/j.chieco.2020.101498
Zhang, K. H., and Song, S. F. (2003). Rural–urban migration and urbanization in China: evidence from time-series and cross-section analyses. China Econ. Rev. 14, 386–400. doi: 10.1016/j.chieco.2003.09.018
Zhao, Y. (1999). Leaving the countryside: rural-to-urban migration decisions in China. Am. Econ. Rev. 89, 281–286. doi: 10.1257/aer.89.2.281
Zhao, Y. (2002). Causes and consequences of return migration: recent evidence from China. J. Comp. Econ. 30, 376–394. doi: 10.1006/jcec.2002.1781
Zhao, Y. (2003). The role of migrant networks in labor migration: the case of China. Contemp. Econ. Policy 21, 500–511. doi: 10.1093/cep/byg028
Zhu, X., Shi, H. Q., and Gai, Q. E. (2011). Distortion in factor allocation and total factor productivity in agriculture. Econ. Res. J. 46, 86–98. doi: 10.3969/j.issn.1002-7246.2011.05.006
Keywords: return migration, agricultural productivity, voluntary return, involuntary return, China
Citation: Liu X and Qiao F (2025) Productivity or burden? How voluntary and involuntary returnees reshape agriculture. Front. Sustain. Food Syst. 9:1653775. doi: 10.3389/fsufs.2025.1653775
Received: 27 June 2025; Accepted: 25 August 2025;
Published: 10 September 2025.
Edited by:
Heer Wang, Kunming University of Science and Technology, ChinaReviewed by:
Haimanot B. Atinkut, Bahir Dar University, EthiopiaYue Zhang, University of Science Malaysia, Malaysia
Copyright © 2025 Liu and Qiao. This is an open-access article distributed under the terms of the Creative Commons Attribution License (CC BY). The use, distribution or reproduction in other forums is permitted, provided the original author(s) and the copyright owner(s) are credited and that the original publication in this journal is cited, in accordance with accepted academic practice. No use, distribution or reproduction is permitted which does not comply with these terms.
*Correspondence: Fangbin Qiao, cWlhb2ZhbmdiaW5AY3VmZS5lZHUuY24=