 N. P. Thakur1*Dileep Kachroo1Parshotam Kumar1A. K. Gupta1N. Ravishankar2V. Khajuria1Vikas Koul1Meenakshi Attri1
 Swati Mehta3*
 Graciela Dolores Avila-Quezada4
 Mohamed A. Mattar5*
 Ali Salem6,7*
- 1AICRP-IFS, Sher-e-Kashmir University of Agricultural Sciences and Technology of Jammu, Jammu, India
- 2ICAR-Indian Institute of Farming System Research, Meerut, India
- 3School of Agriculture, Lovely Professional University, Phagwara, India
- 4Facultad de Ciencias Agrotecnológicas, Universidad Autónoma de Chihuahua, Chihuahua, Mexico
- 5Prince Sultan Bin Abdulaziz International Prize for Water Chair, Prince Sultan Institute for Environmental, Water and Desert Research, King Saud University, Riyadh, Saudi Arabia
- 6Department of Civil Engineering, Faculty of Engineering, Minia University, Minya, Egypt
- 7Structural Diagnostics and Analysis Research Group, Faculty of Engineering and Information Technology, University of Pécs, Pécs, Hungary
Introduction: Indian agriculture faces major challenges including declining profitability, shrinking landholdings, rising input costs, and soil fertility degradation, all exacerbated by climate change. Small and marginal farmers, constituting about 90% of the sector, are particularly vulnerable. Integrated Farming Systems (IFS) offer a pathway to diversified, resource-efficient, and sustainable farming. This study aimed to develop and evaluate a 1 ha IFS model under irrigated subtropical conditions of Jammu, India.
Materials and Methods: A diversified IFS model was implemented comprising cereals, vegetables, fodder crops, horticultural plantations, a dairy unit, poultry–cum–fishery system, mushroom cultivation, a biogas unit, and vermicomposting. Emphasis was placed on recycling farm resources to reduce external input dependence. Productivity was measured as rice equivalent yield (REY), with economic analysis covering costs, returns, and benefit–cost ratio. Employment generation was expressed in man-days/ha. Soil samples from different zones were analyzed for organic carbon and bulk density.
Results: The IFS achieved annual productivity of 23.55 t REY/ha and net profitability of ₹3.05 lakhs/ha, while generating 481 man-days/ha of employment. Animal-based components contributed the highest share of profit (45.5%). Recycling of resources met about 75% of on-farm input requirements, reducing external input costs by ~40%. Soil organic carbon increased significantly, and bulk density decreased, particularly in horticultural and plantation zones. The system also provided food and nutritional security for a five-member household.
Discussion: The IFS model enhanced productivity, profitability, and employment while improving soil health and reducing input dependency. Livestock enterprises were critical for economic stability, and resource recycling improved input efficiency. Diversification supported ecological sustainability and household food security, underscoring IFS as a resilient strategy for smallholder farmers in subtropical irrigated regions.
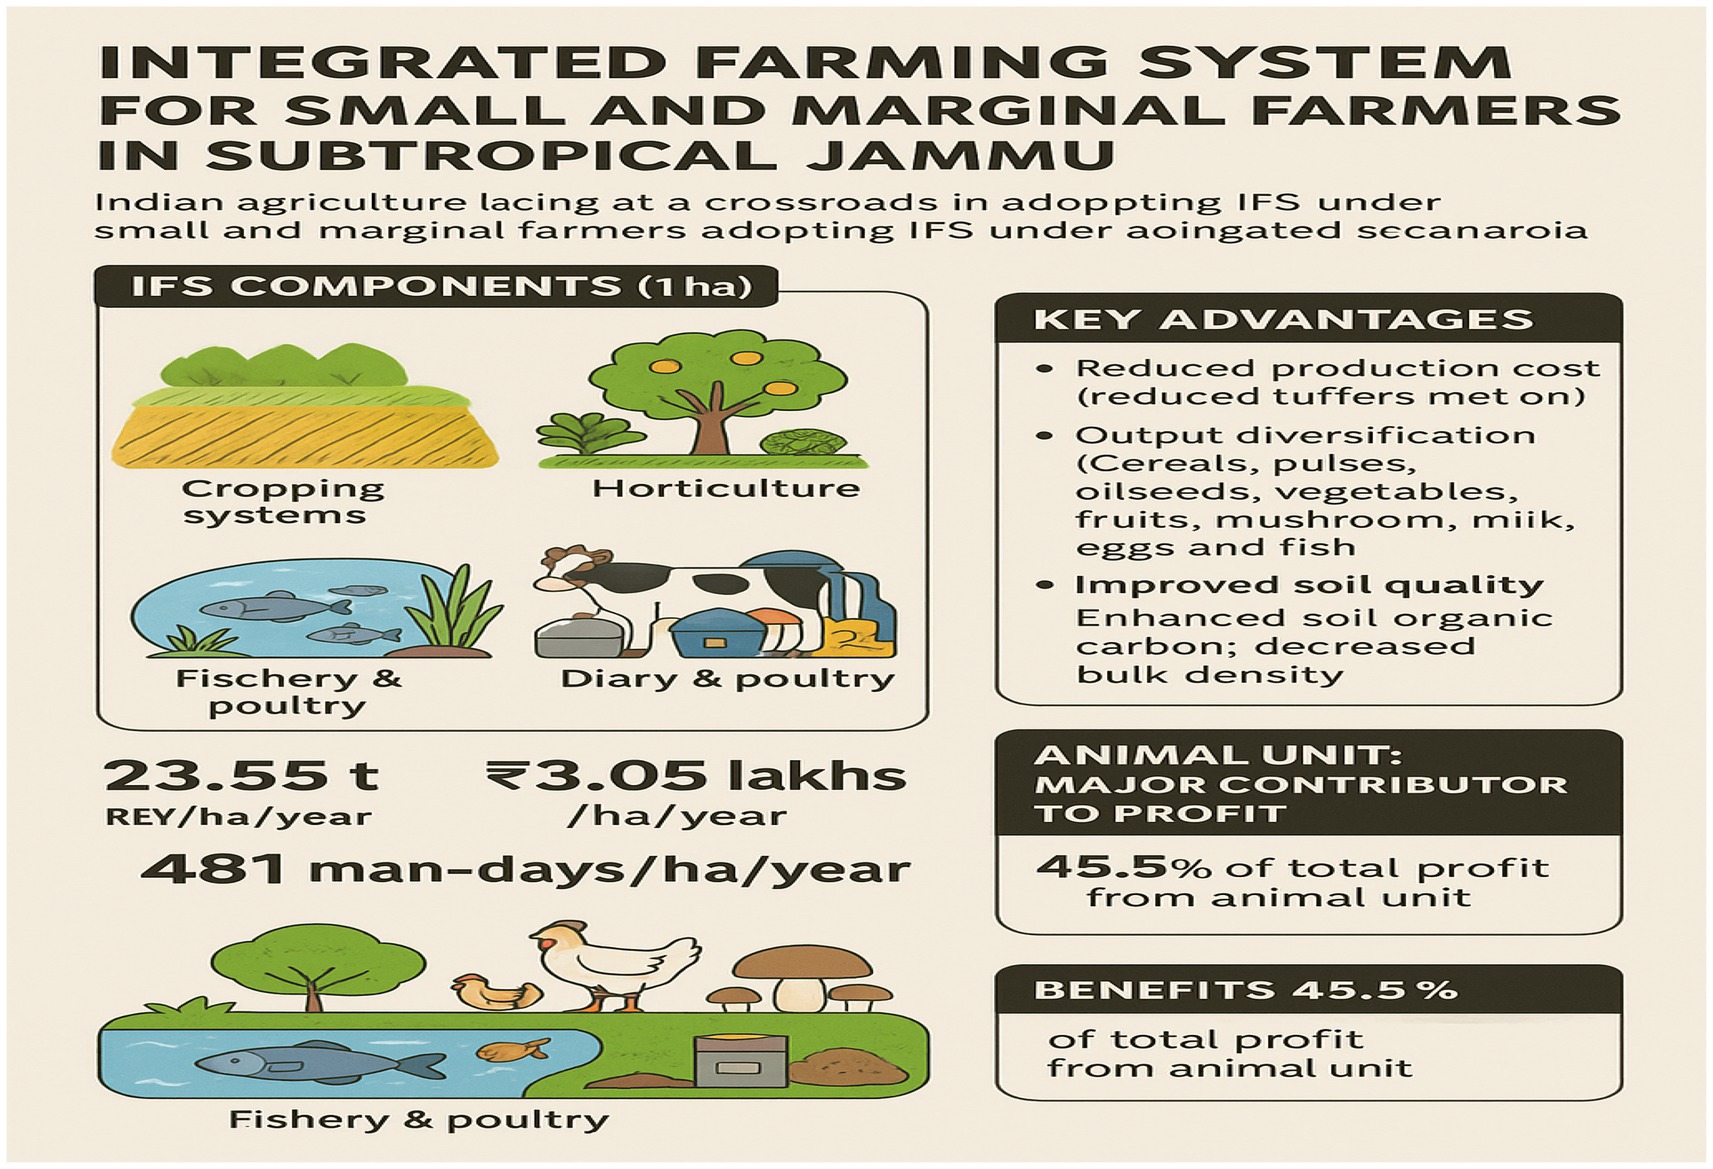
Graphical Abstract.
1 Introduction
India supports 16.8% of the world’s human population and 11% of the livestock population on 4.2% of water resources and 2.3% of the global land with the per capita availability of natural resources of about 4–6 times lesser than the world average (Gill et al., 2009; Yadav and Sharma, 2013; Sharma et al., 2023). Whereas the food grain production potential in India is manifold, keeping in view the climatic diversity and natural resources. After the advent of the Green Revolution, Indian productivity has reached a stagnation phase. Therefore, presently Indian agriculture is at a crossroads due to declining profitability, productivity, per capita landholding, fertility status and the use of costly inputs, vis-à-vis the climatic degradation (Ritchie et al., 2018). Under the increasing population pressure, it becomes imperative to feed 1.40 billion people, which is estimated to become 1.70 billion by 2050 AD, thereby requiring about 480 metric tons of food grains annually (Babu et al., 2020; Fatima et al., 2023). To meet this projected demand of food grains, the agricultural practices needs a tectonic shift from the present practices where the emphasis is on cultivar improvements, improved methods of commodity based practices which has brought tangible results up to certain time and now the need has been felt to overcome and mitigate the current farming crisis by increasing the farmer’s income to manifolds vertically through inducting sustainable and innovative means.
As far as the area under cropping systems is concerned in the Northern part of India, it has been found that the major cropping systems under irrigated and unirrigated ecosystems are rice-wheat, which is presently the backbone of small and marginal farmers’ earnings. Hence, this huge area (10.5 million hectares) under the cropping practices needs to improve by farm diversification (GoI, 2015; Sheng et al., 2018; Paramesh et al., 2021) to mitigate the present challenges and among various practices, integrated farming system (IFS) is being viewed as one of the most appropriate strategy to reverse this trend where, not only productivity can be boosted but also the profitability, sustainability and livelihood security can be guaranteed (Walia et al., 2016).
Due to the heterogeneity of land and climate the IFS approach basically is a farming system having multiple enterprises with respect to structured suitable land under crop, horticulture, livestock, fishery, poultry, or other complementary and supplementary farm enterprises but also inter-relate its by-products with these enterprises at farm level in order to reduce the cost of production, mitigate the climatic change, improve livelihood security and reverse the degrading soil health trend under these intensive cropping systems (Walia and Kaur, 2020). Before developing the IFS model for the rice–wheat cropping system in the north-western Himalaya (Jammu), a structured survey of 450 farm households was conducted (Kachroo et al., 2016) to assess the potential of different farm enterprises for small and marginal farmers. Based on the survey findings, the IFS model was customized for this irrigated Himalayan region. Similar to the cropping pattern in India, the Jammu region of Jammu and Kashmir is no exception with respect to the predominant cropping system prevailing in the area. However, contemporary agricultural practices characterized by the intensive use of synthetic fertilizers, pesticides, and fossil fuel-based energy inputs are increasingly contributing to the degradation of critical natural resources, including soil, water, biodiversity and the broader environment. Additionally, a growing disinterest in agriculture among rural youth has emerged as a significant socio-economic challenge. This reluctance is primarily attributed to the uncertain returns from farming, diminishing profitability, labor-intensive operations and the lack of social prestige associated with the agricultural profession. Indian agriculture remains highly vulnerable to climate variability, input cost inflation, and volatile market dynamics. Consequently, many educated individuals from farming backgrounds are turning away from agriculture in favor of more secure and socially valued non-agricultural careers. Empirical evidence from national surveys conducted by the National Sample Survey Office (NSSO) and policy assessments by national institution for transforming india (NITI) Aayog corroborate this trend, indicating that a substantial proportion of farming households prefer alternative career paths for the next generation. This paradigm shift highlights the critical need for systemic reforms to make agriculture more profitable, technologically progressive and socially accepted in Jammu and Kashmir, India. Hence, the IFS approach has been found most viable under these situations. Its adoption can not only help in enhancing resource use efficiency, reduce dependency on external inputs, diversify income, and return on a monthly basis the income of a calendar crop year, and contribute to the vision of the Government of India with respect to “Viksit Bharat,” doubling the farmer’s income.
2 Materials and methods
2.1 Experimental detail
An IFS live model under a 1.0-ha area was established for the evaluation of various IFS parameters during 2017–23 at Farming System Research Center, Chatha, SKUAST-J, under All Indian Coordinated Research Project (AICRP-IFS), UT of Jammu and Kashmir in the Indian Mediterranean Ecosystem of the North-Western Himalayan Region, featured by hot summer and cold winter. The experimental model area is located at 32°–40° North Latitude and 74°–50° East longitudes, and an altitude of 365 m above mean sea level. As per the land use classification of Jammu and Kashmir, the area of 1.0 ha falls under the small landholding farmer. The model was established keeping in view of the topography and other variable factors affecting the production and farm income, in addition to helping resource-poor small farmers toward attaining livelihood security. The model showed the device is scaleable (upscale and downscale) to meet the solutions for marginal farmers as well. The model has been devised keeping in view of the 05 farm family members, time distribution availability with respect to drudgery input of these 05 farm family members, avoid overlapping of farm operations, generation of monthly income reducing the burden on chemical fertilizers through step wise reduction on its dependence and by generating its own organic manures using farm waste and recycling of its by-products for interdependence of various enterprises, which includes crop, horticulture, animal, poultry, mushroom, biogas, plantation of trees on boundaries and fishery unit. The model has been devised to calculate farm income on a monthly basis to overcome the cash flow of small farmers. The idea of recycling the farm waste and plantation of boundary trees and removal of chemical fertilizers was mainly to strengthen the sustainability by mitigating the greenhouse (GHG) gases produced under the present agricultural practices.
2.2 Components of IFS model
The choice of the IFS module depends on various farming situations. Farmers can choose from a range of site-specific and socially acceptable modules for integration, including combinations such as crops with fodder, the interplanting of fruit crops with vegetables and fodder, dairy farming, poultry farming, mushroom cultivation, biogas production, boundary and buffer strip plantations, agroforestry systems, and horti-pasture integration. The selection of these modules depends on the availability of resources such as land, labor and capital. Owing to the variable nature of India’s climate, soil, crops, growing seasons, livestock, and special preferences, as well as access to resources and assistance, the development and implementation of IFS suitable for various agroecosystems are crucial (Panwar et al., 2021). The components include arable crops and other allied enterprises listed earlier, and high-value crops, which, along with value added to the system, further increase the economic returns to resource-poor farmers (Figure 1).
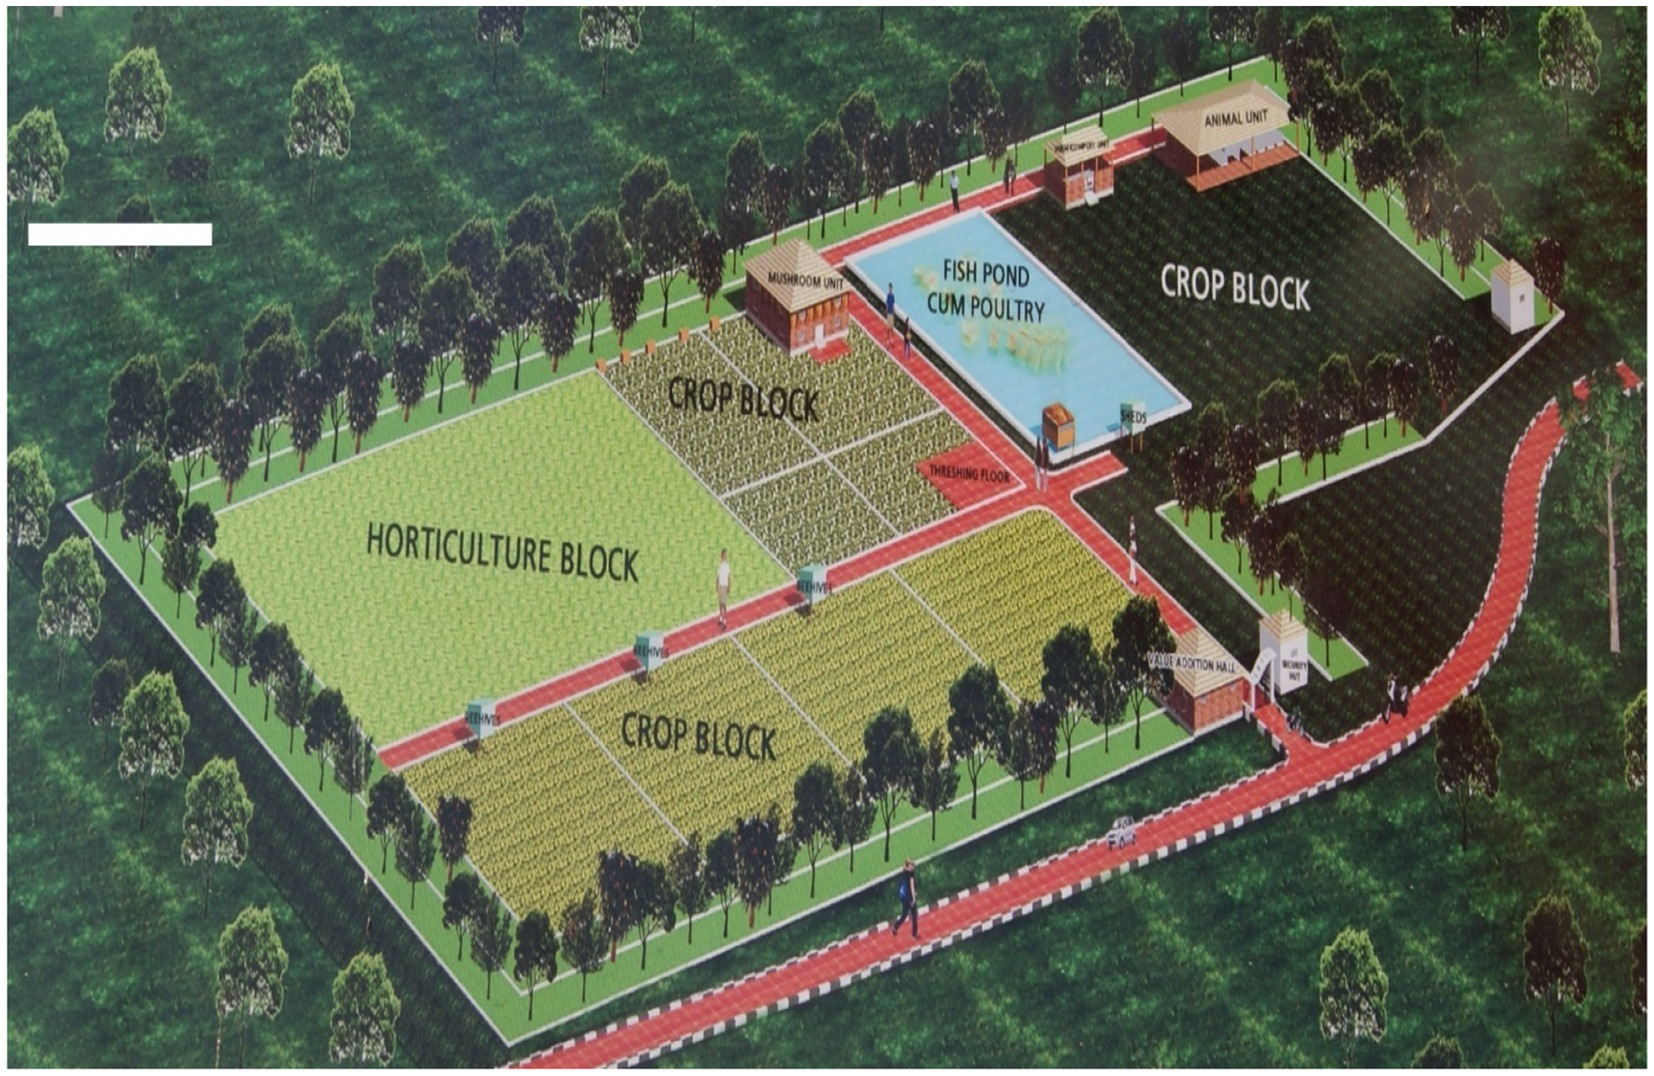
Figure 1. Three-dimensional 1.0 ha scaleable layout of the IFS model, depicting various farm enterprises (land distribution under each component reflected in Table 1).
The various components studied under this experiment were cropping systems (rice-wheat-green manuring, rice-potato-black gram, rice-mustard-black gram and berseem + oat and maize + sorghum with hybrid napier on bund) + horticulture (guava as main crop, lemon and mango (amarpali) as boundary crop and broccoli, knol khol, cabbage, cauliflower, radish, okra, hag sag, and turnip as intercrops) + dairy (two cows, one buffalo, two heifers) including biogas and vermicompost unit + fish cum poultry) + mushroom (Dhingri and Button).
2.3 Land allocation and percent share of different enterprises
The choice of different enterprises and percent share of land allocated were based on the resource characterization survey of the locale of study, and according to the five members, the family requirement of small and marginal farmers (Table 1).
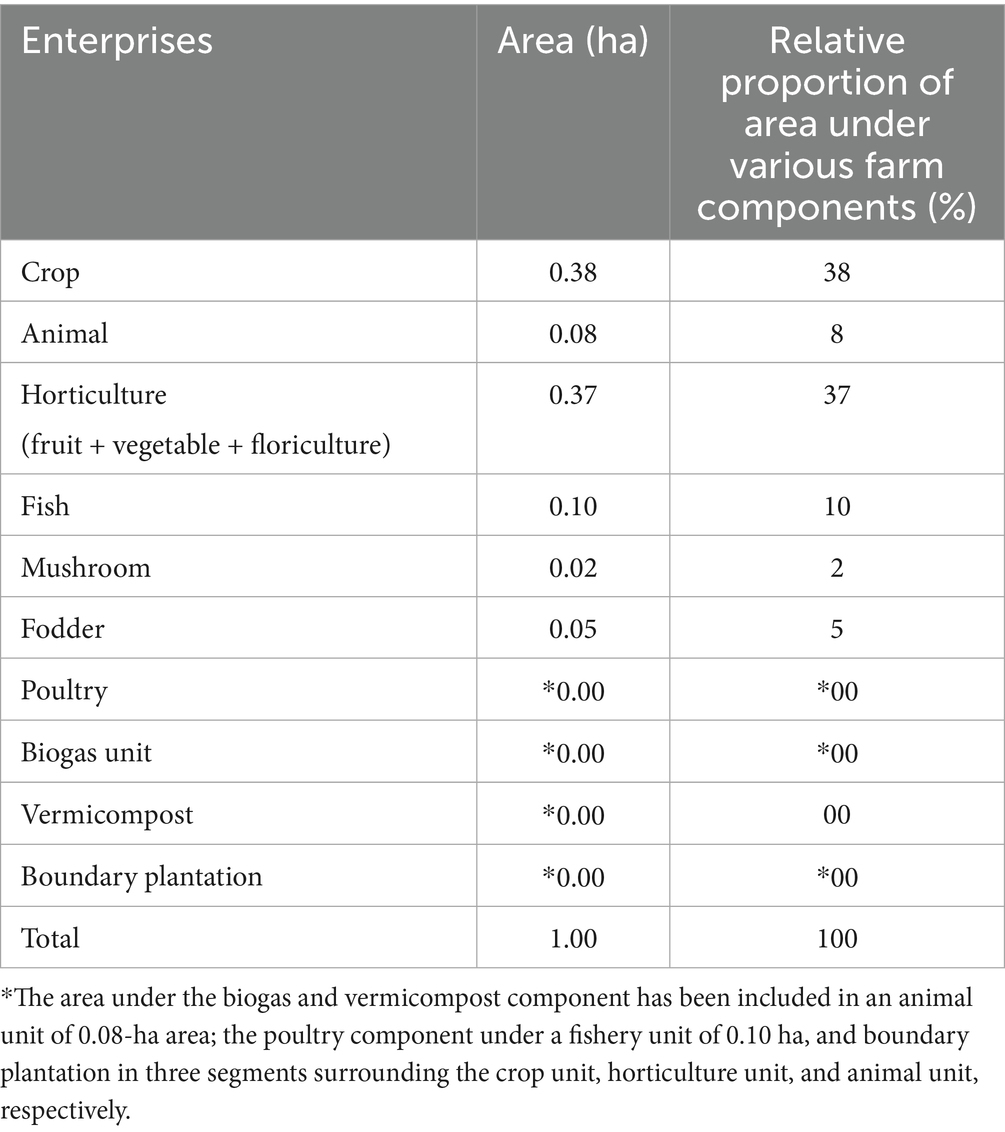
Table 1. Land allocation and percent share of different enterprises under IFS.
The farm land allocated under various farm enterprises has been based on the nutritional requirement of the farm family as per the standardized by the Indian Council of Medical Research (ICMR) guidelines.
2.4 Crop enterprises
Three cropping systems mainly rice (B-370)-wheat (PBW 550)-green manuring (Dhaincha) (2,176 m2), rice (PUSA 1121)-potato (Kufri Sindhuri)-black garam (NUL-7) (576 m2), and rice (PUSA-1121)-fodder maize (African tall) + cowpea (PUSA-Komal)-mustard (JS-69) (1,050 m2) has been included in the crop enterprise based on the farmer’s family requirement and it is marketable surplus. In addition, the use of its by-products in the given enterprises in the farming system model to build an interlinking and inter-independent chain. The soil of the IFS model was sandy clam loam in texture, having alkalinesoil pH (8.1) measured by glass electrode pH meter method, low in organic carbon (0.34) measured by Walkley and Black (1934) fast titration method, low in available nitrogen (162 kg/ha) determined by alkaline KMnO4 method as described by medium in available phosphorus (14.0 kg/ha) was extracted by the procedure of Olsen et al. (1954) and measured by ascorbic acid blue color method using spectrophotometer and medium in available potash (130 kg/ha) extracted by neutral ammonium acetate Jackson (1973) method as measured by flame photometer, whereas total soil organic carbon was calculated using the dry combustion method (Houba et al., 1995), and microbial biomass carbon (MBC) was measured by choloroform fumigation extraction method (Vance et al., 1987) (Table 2).
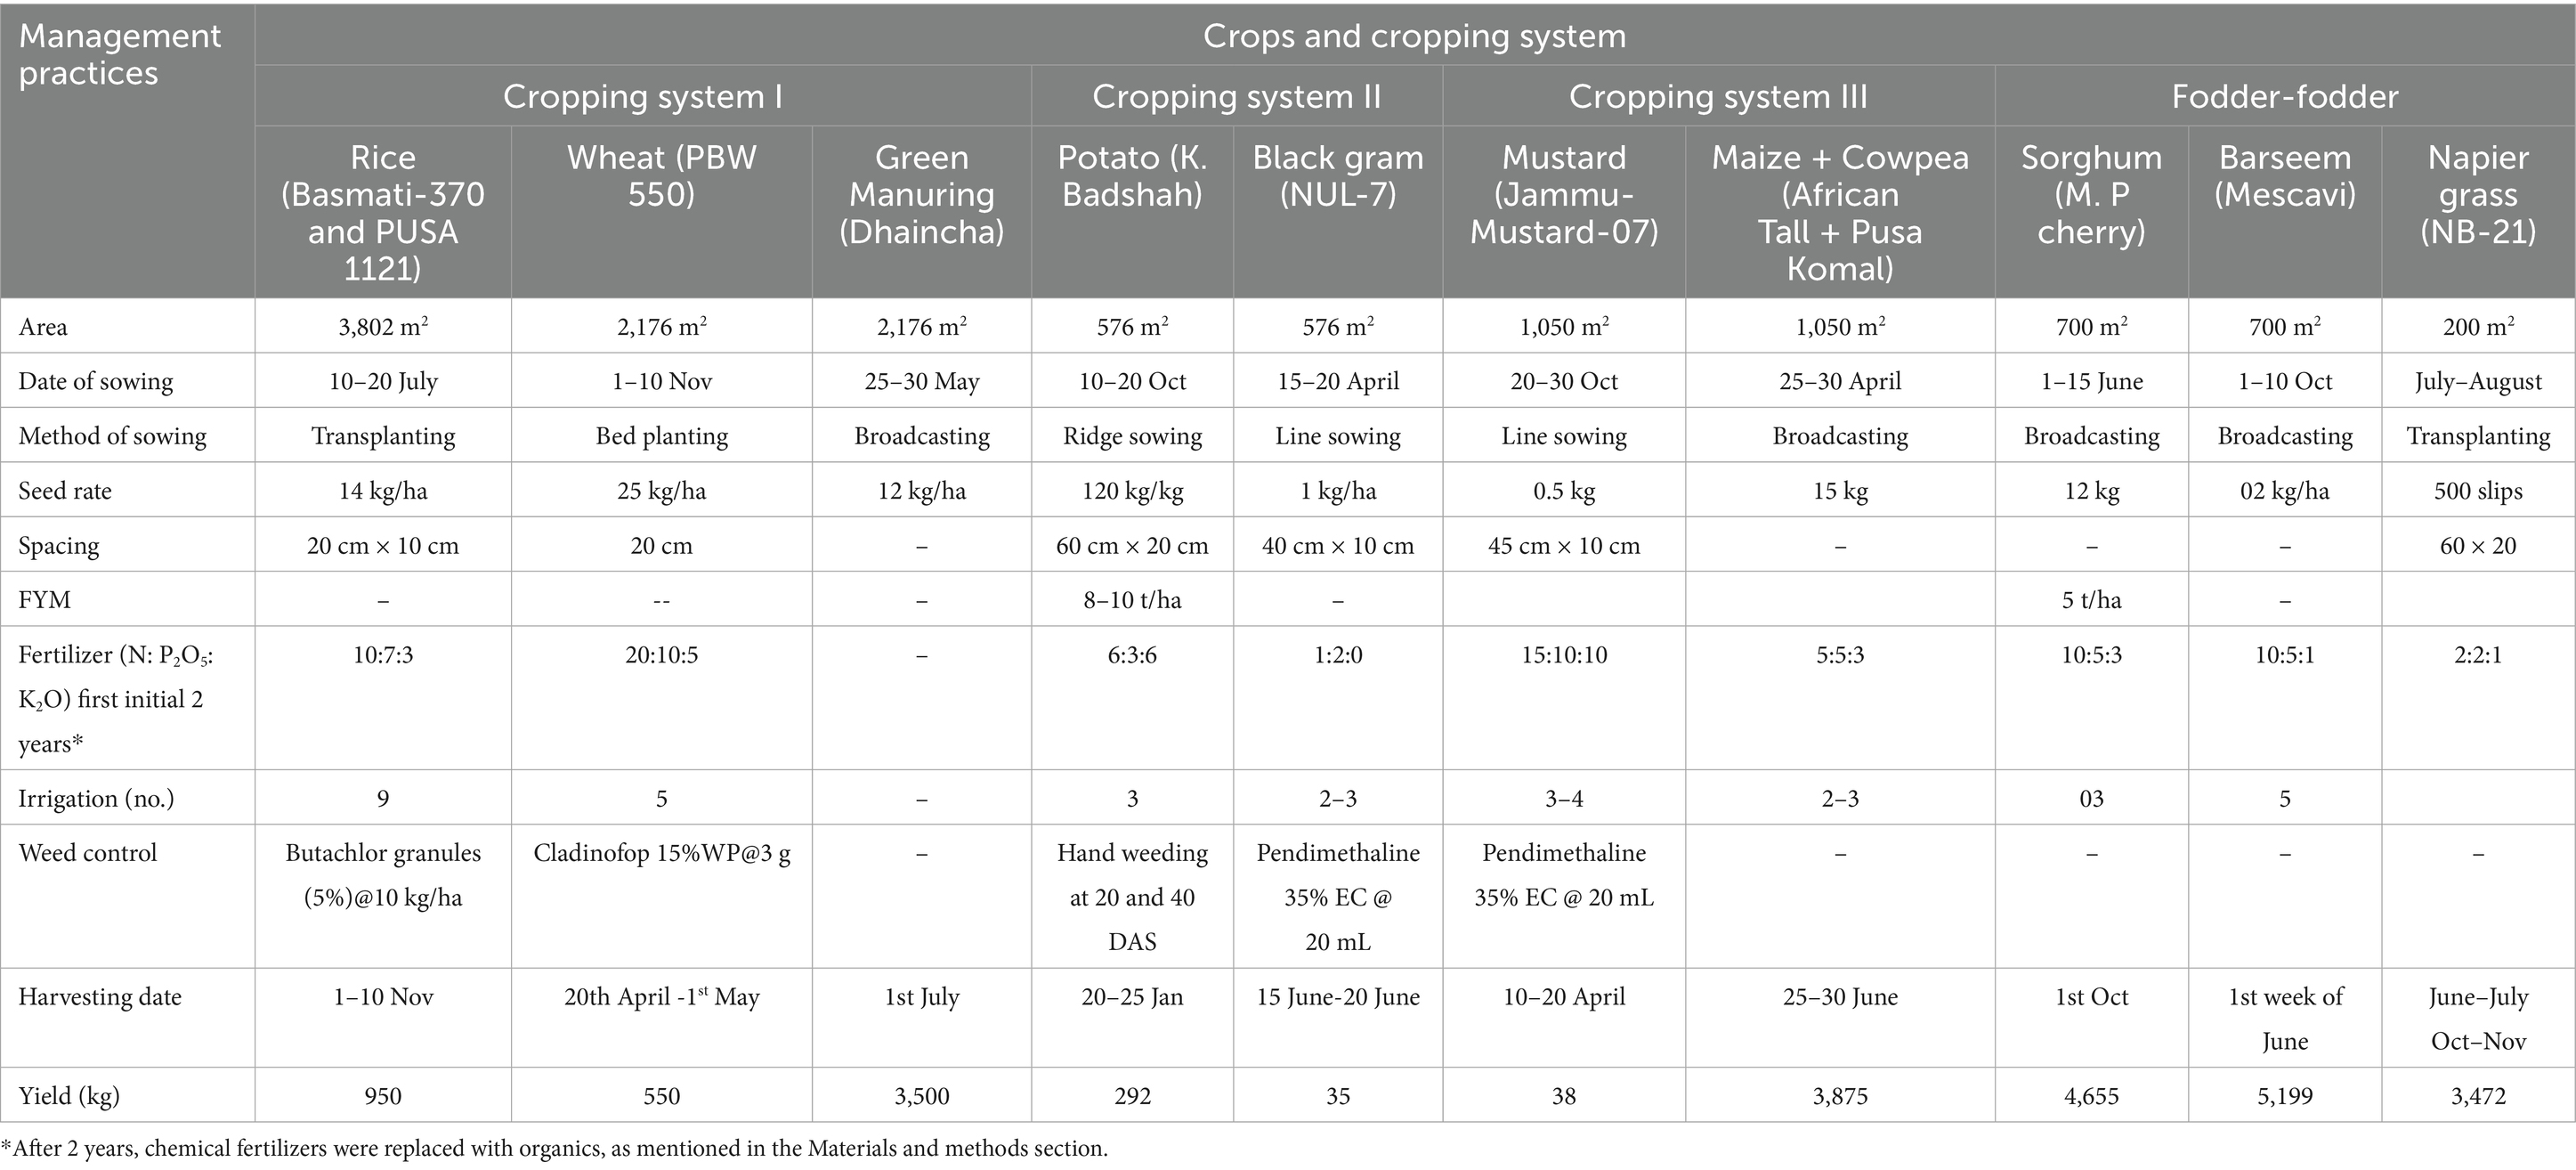
Table 2. Crop management practices for under different cropping systems (2017–23).
Initially, in the 1st and 2nd years, the standardized crop production practices were followed as per the recommendation of the package of practices in SKUAST-Jammu, which was later modified with respect to the application of inorganic fertilizers in the following trend, keeping in view the basis of soil test-based recommendation. 100% chemical fertilizers in the 1st and 2nd years, 75%of chemical fertilizers +25% through inbuilt organic fertilizers in the 3rd year and 50% of chemical fertilizers +50% through inbuilt organic fertilizers in the 4th and 5th years and 25% of chemical fertilizers and 75% through inbuilt organic fertilizers in the 6th year. This schedule has certain limitations and is variable depending upon the soil test value at the time of sowing of the main crop in a system.
2.5 Animal unit
Two productive animals, one buffalo (Murrah) and two cows (Holstein Freiser + young ones), based on general small-holding farmers’ practice in the area, have been included in the model. The purebred Murrah at foot based on physical characters has been purchased from Rohtak, Haryana (India), having the capacity of milk production 15 liters per day, whereas the HF at foot cross-breed has been purchased from the productive area of R.S. Pura, Jammu (India), having the capacity of milk production 20 liters per day. The housing structure of the animal was designed in such a way that it consists of a low-cost construction design, an asbestos rooftop, a half brick wall and half open on its three sides (front and sides, a full brick wall at the back side having in an area of 13 × 20 square feeted with coolers and a fan. The surface of the shed has been made of concrete with a rubber mat. The rubber mat has been placed on the concrete for 2 years since its establishment, when a continuous problem of knee ganglion was observed in animals. The rubber mat on the floor helps in easily washing the animal floor, in addition to the prevalent mastitis disease observed in the shed was totally put under control. The feed from the by-products from the cropping and the other crops and grasses was used in the form of fresh and dry fodder. The part of concentrates used in the feeding of animals was generated in the model, and the rest of the concentrate, keeping in view the balance in nutrition, was purchased from the market. The formulation of the feed was devised with the animal nutritionist and later standardized. On average, about 16-kg of fresh dung was realized from buffalo and 14 kg per day was realized from cows. The biogas unit of 2 m3 and four pits of vermicompost (4.8 × 0.9 × 0.7 m) and 4-tank compost units having a size of (4 m × 4 m) were established in the area demarcated in the animal unit for continuous supply of compost/vermicompost/biogas slurry for recycling in the IFS model. The dung so produced from the animals was compartmentalized for various activities, that is, out of 40 kg per day, 25 kg was fed to the biogas unit and the rest was deposited in one section of a 4-tank vermicompost unit. The system was customized after 1 year of establishment of the model, where it was observed that storing cow dung in the open field is losing its nutrient power; therefore, the system of storing the cow dung in one closed chamber proved to be very powerful in terms of nutrient content and fast decomposition of the dung when mixed with other farm waste. The method of composting was standardized, and within 30 days, except in the winter season, the compost was harvested from these tanks regularly and recycled back into the field activities at regular intervals. The slurry so produced from the biogas unit was collected and recycled back into the field or to the composting units, and from that storage tank, fresh cow dung of 10 kg per day at an interval of 15 days was applied in the fish pond of the IFS model. Not only this in order to reduce the cost of infrastructure, portable huts of (4 no.) having size (1.8 × 1.8 × 1.8 m) (6 no. were fabricated for storage of animal feed concentrates and other as and for other field operations in the model. In this model, three tube wells were installed for utilizing the groundwater in the whole system; as per the area where the model was located, the groundwater is shallow, that is, 4 m during summers and 1.5 m during the rainy season.
2.6 Horticulture (fruit + vegetable + floriculture)
A well-planned horticulture unit was established on 0.37 ha of the allocated area of the IFS model. Since the area had a higher water table, it was a challenging task to establish profitable orchards within the system. After two consecutive failures, the plantation raised-bed technique was followed in strips. The two varieties of guava were planted (arkamulia and Allahabad safeda). On raised beds in nine strips at a distance of 5 m × 5 m, whereas the boundary of the horticulture unit was planted with the lemon (Eurica lemon) on its two sides at a distance of 2.5 m. On the third side of the horticulture plants, the mango plantation (amarpali) at a distance of 2.5 m was not only planted in a row in the horticulture block but also extended across the entire field of the crop block as well in an L shape. The strips in between the guava plantation were used for vegetable growing (lady finger, was sown in kharif season (July to September), whereas broccoli, knol khol, and cabbage were grown in Rabi season (October to March). The boundary plantation of lemon and mango was used in the Eastern and Northern peripheral space, and also to serve both as windbreaks and an additional income source. This not only provided a potential long-term fruit yield but also contributed to microclimatic moderation and soil conservation. Overall, the horticultural component not only diversified the production portfolio but also improved the sustainability and resilience of the farming system. In order to meet the challenges of a higher water table, it was additionally a well-planned mechanism to build a continuous supply of nutrition. Apit of (0.45 × 0.45 × 0.45 m) on two sides of the nutrients was applied as per the recommended package of practices, and later it was modified as per the organic fertilizer availability, with the system commensurate with the soil test values. Similarly, for vegetable cultivation, initially the chemical fertilizers were used as per the recommended package of practices (POP) and later the field was supplied with the organic fertilizers, which include vermicompost produced in the system. The soil in the horticulture block was sandy clay loam, having soil organic carbon (SOC) (4.3 g/kg), available nitrogen (195 kg/ha), phosphorus (14.3 kg/ha) and potassium (122 kg/ha). The fruiting of the horticulture was harvested after 3 years of its establishment season.
2.7 Fisherycum poultry unit
2.7.1 Fish pond
An area of 0.10 ha (1,000 m2) of length and breadth of size (50 m × 20 m) was allotted for the establishment of a fishery unit. The area selected was at the lower level and was waterlogged. The pond was established half-dug, half-raised (with the slope ratio of 1:1.5, with its dykes having a depth of 2 m, carefully aligned with the natural slope gradient of the land to ensure effective drainage and management of excess surface water. The tube well in the animal unit was used as a water source to maintain the optimal water level (1.5 m of water depth) as and when required. Before filling the water in the pond, the surface was well sterilized with lime, and three tractor trolley loads approximately 30 quintals of farm yard manure (FYM)) were applied and distributed uniformly. The pond was filled with the water and the polyculture fish species, that is, Catla (Catla-Catla), Rohu (Labeo Rohita), Mrigal (Cirrhinus mrigal), and Grass carp (Ctenopharyngodon Idella) in the stocking ratio of 2.5 (1,250 stocking no): 3.0 (1,500 stocking no.): 2.5 (1,250 stocking no.): 2.0 (1,000 stocking no.), respectively. The fish stocking size was 120–150 mm, and the stocking month was standardized and commenced from September to October. The manuring of the pond was integrated with the animals (cow dung), and droppings of the poultry/urine from animals. The supplementary feed in terms of rice bran + mustard cake in the ratio of 1:1 was applied as per the need, and the rate of feeding was standardized as 2% of the body weight. Periodical harvesting approach was adopted to maintain the population and growth of the fish throughout the harvesting period. At different regular intervals, depending upon the color and viscosity of the water, the BOD was measured. The lime at the rate of 25 kg was applied as and when required, depending upon the pH of the pond water. The dykes of the pond and the top of this half-dug, half-raised pond were fully compressed to avoid water leakage. The space provided at the outer dykes of the pond was utilized by planting initially aloe-vera, which was later replaced with hybrid Napier (NB 21) was planted in the space of (0.6 m × 0.6 m) in three rows on three sides. The two pairs of ducks were also maintained to maintain the ecosystem of the pond, and small poultry duck on the top of the dykes across the pond was established. The fingerlings were purchased from the hatchery of the Department of Fisheries, Government of Jammu and Kashmir, Ghou Manhasan, Jammu.
2.7.2 Poultry
On the top side of the pond, near the animal unit boundary, an area of 10.8 m2 was allocated. The iron-structured poultry cage measuring (3.6 × 3.0 × 2.4 m), which was specifically designed to meet the space and air flow requirements, is essentially for the healthy growth of birds and disease prevention. The cage was placed at a slope of 0.1% toward the fish pond so that the droppings of the poultry, into the fish pond, and the cleaning process become labor efficient, and at the same time, the water body of the fish pond gets properly supplied with the droppings of poultry to maintain the proper growth of the planktons in the fish pond. The cage was designed for 100 21-day-old chicks. Since the 1-day-old chicks were used for rearing the poultry units, a brooder mud hut was designed in the waste area of the animal unit with proper ventilation and a heating mechanism. The 1-day-old chicks after 21 days in the brooder huts were shifted to the main cage of 10.8 m2 (3.6 m × 3.0 m). The 1-day chicks in the brooder hut were properly vaccinated as per the standardized practices. The starter and the finisher feeds were given to the poultry for maintaining the proper growth, nutritional requirements and profitability into consideration. After 45 days for broiler and 60 days for improved poultry breeds, each lot of 100 birds with a mortality of 5% was sold. During the process of poultry rearing in the model, it was standardized that five lots in a crop calendar year were suitable and most profitable. The months, mainly July and August, were when the incidence of the diseases was higher, and the market values of these birds in the Jammu region were comparatively lower. Therefore, no rearing was done in these 2 months. The other small hut behind the animal unit was utilized for housing 20 Cobb broiler/Van Raja/Chabro/Gram Priya birds, serving as backyards for egg laying/meat purposes.
2.8 Mushroom unit head
The mushroom unit of IFS was established in an area of 200 m2. The area allotted was designed and calculated on the basis of the by-products of paddy straw and wheat straw availability within the farm. Out of which 36 m2 (6.0 × 6.0 m) was utilized for making a low-cost housing structure having a height of 3.6 m in the center and 2.4 m on the sides with half concrete and half portion made of thatch covered with an asbestos roof top. Proper ventilation with two exhaust fans was provided inside the structure for maintaining the proper environment. Five to ten quintals of rice and wheat straw was used, that is, 250 polythene bags having a size of (45 × 30 m). The model generated 20 quintals of paddy straw and 12 quintals of wheat straw, with 30%of wheat straw and 10%–15% of paddy straw being recycled for making mushroom compost. The production of mushrooms was performed vertically in an iron rake with a portable size of 1.50 m height, 1.8 m length, containing three shelves with an equi-distance of 0.75 m. One thermometer and two fans were also installed inside the structure for measuring and regulating the temperature and humidity. Two species, namely, Button Mushroom (Strain NBS-5) and Oyster Mushroom (Dhingri), were grown. The rest of the 200 m2, after deducting 36 m2 (6 m × 6 m) area, was used as a concrete threshing floor for making mushroom composting and other farm activities. Normally, the mushroom (Button) cultivation period was standardized as October to the first week of March (15–30o). Whereas, the Oyster mushroom (Pleurotus florida) was grown from January to mid-April within the temperature range of (18–35o). The composting of mushrooms was done manually, following the standard practices as follows in the package of practices. The growth process of the mushroom varies between 35 and 90 days, depending on proper management practices. The fruiting bodies of the mushroom, once they achieve optimum size, are suitable for harvest.
2.9 Fodder block
To meet the green fodder requirement in an animal unit, an area of 0.05 ha was allotted to a fodder block for round-the-year fodder production. The main fodder crops were sorghum (Multicut) + Cowpea in kharif (April to September) and Berseem + Oats (October to March) during rabi were sown as per the standard recommended package of practice of the university. The harvesting was done at different cutting intervals initially after 30 days in a manner to supply 30–40 kg green fodder per day to the milch cows in an animal unit. However, during the lean period of May to June and November to December, the green fodder supply was met from fodder trees, namely Albizia, Grewia, and leuceneae and perennial hybrid napier planted at the dykes of the fish pond at the outer boundary as an interplanting with the poplar trees to maintain the continuous supply of green fodder to animals.
2.10 Biogas unit
A biogas unit with a capacity of 2 m3 was installed as a vital component of the IFS model, aiming to promote energy self-sufficiency and effective waste management on the farm. This unit utilized fresh animal dung, readily available from the livestock component, requiring approximately 25 kg of fresh cow dung daily for its efficient operation. The anaerobic digestion process within the unit produced a clean, renewable form of energy, which served as an eco-friendly substitute for conventional cooking fuels. Over the course of a year, the biogas output from a 2 m3 capacity was estimated to be equivalent to 17 LPG of capacity, 14.5 kg each. The conversion rate has been calculated as per the standard norms provided by Hindustan Petroleum Limited, India.
2.11 Boundary plantation/border planting
Border plantation was strategically implemented along the boundaries of the IFS field to optimize land use, enhance biodiversity, and contribute to long-term sustainability. A variety of multipurpose tree species were selected to serve diverse functions such as food, fodder, and timber production. Fruit-bearing trees like Aonla (Indian Gooseberry) and Karonda were planted to provide seasonal fruits rich in nutrients, offering both nutritional benefits to the farm family and the potential for income through local market sales. In addition to fruit trees, fodder species such as Grewia, Albizia, and luceneae were included to support the livestock unit by supplying green forage, especially during lean periods, thereby reducing dependence on purchased feed. Furthermore, timber species like Teak and Poplar were also integrated into the boundary planting design, aimed at generating long-term economic returns from high-value wood products. This border plantation not only acted as a windbreak and erosion control measure but also contributed to carbon sequestration, improved microclimatic conditions, and enhanced soil organic matter over time. By incorporating a mix of tree species with varied uses, the border plantation served as a productive buffer zone, supporting the ecological and economic goals of the IFS model. Between the boundary plantation and the mango planting, a row of 5 m was accommodated with cultivation of the turmeric crop to combat the shade effect of these trees and enhance productivity and profitability.
2.12 Rice equivalent yield
To enable a uniform comparison of diverse crops and enterprises within the IFS model, the rice equivalent yield (REY) was calculated. This method allows the conversion of the yield of various crops and farm products into a common unit, rice, based on their respective market prices. By multiplying each crop’s yield by its market price, and then dividing the cumulative value by the price of rice, the REY offers a standardized measure that facilitates economic and productivity comparisons across different cropping systems and integrated components. This approach is especially useful in diversified farming systems where multiple outputs, such as cereals, pulses, vegetables, and animal products, are involved, allowing for a consolidated assessment of overall system performance in terms of rice productivity. The coefficient of variation (CV) is used to estimate the rice grain equivalent yield stability of the IFS model; it can measure the variation degree of average crop yield of REY in different years (Borrelli et al., 2014; St-Martin et al., 2017; Döring and Reckling, 2018). A higher CV value indicates lower crop yield stability (Xu et al., 2019).
The equivalent yield was calculated by using the following formula:
where REY denotes rice equivalent yield; Yi = yield of different/product; Pi = price of respective crops/product; P (p) = price of paddy.
2.13 System economic efficiency
System economic efficiency (SEE) was calculated by using the following formula:
To assess the profitability of different cropping and farming systems in relation to the duration for which land is utilized, SEE was calculated. This metric provides insight into how effectively the land is generating economic returns over time. The net return represents the income generated after deducting all input and operational costs. The field occupation period includes the total number of days crops or components, such as vegetables, fodder, or livestock-related activities, utilized on the land. This parameter is particularly useful in integrated and intensive farming systems, where multiple crops and enterprises share land resources at different times. A higher SEE value indicates better economic use of land over time, demonstrating that the farming system is both profitable and time-efficient. It is a valuable tool for comparing different farming strategies, especially when aiming to maximize returns per unit time from limited land resources (Nayaka et al., 2023).
2.14 System profitability
System profitability was calculated by using the following formula:
Net return per hectare per year (Rs/ha/year): This is the total profit (or net income) earned from 1 ha of land over the course of 1 year. It is calculated as total revenue minus total costs associated with the system (crop production, livestock, inputs, labor, etc.) for that hectare. 365: This represents the number of days in a year, used to convert the annual net return into a daily value.
2.15 Employment generation
A person working 8 h a day was considered as one man-day. The labor requirement for different activities was recorded and given in man-days/ha/year. Man-days were calculated for different components separately, and the total number of man-days employed in a year under the IFS model was worked out for each component on a yearly basis and is presented in Table 3.
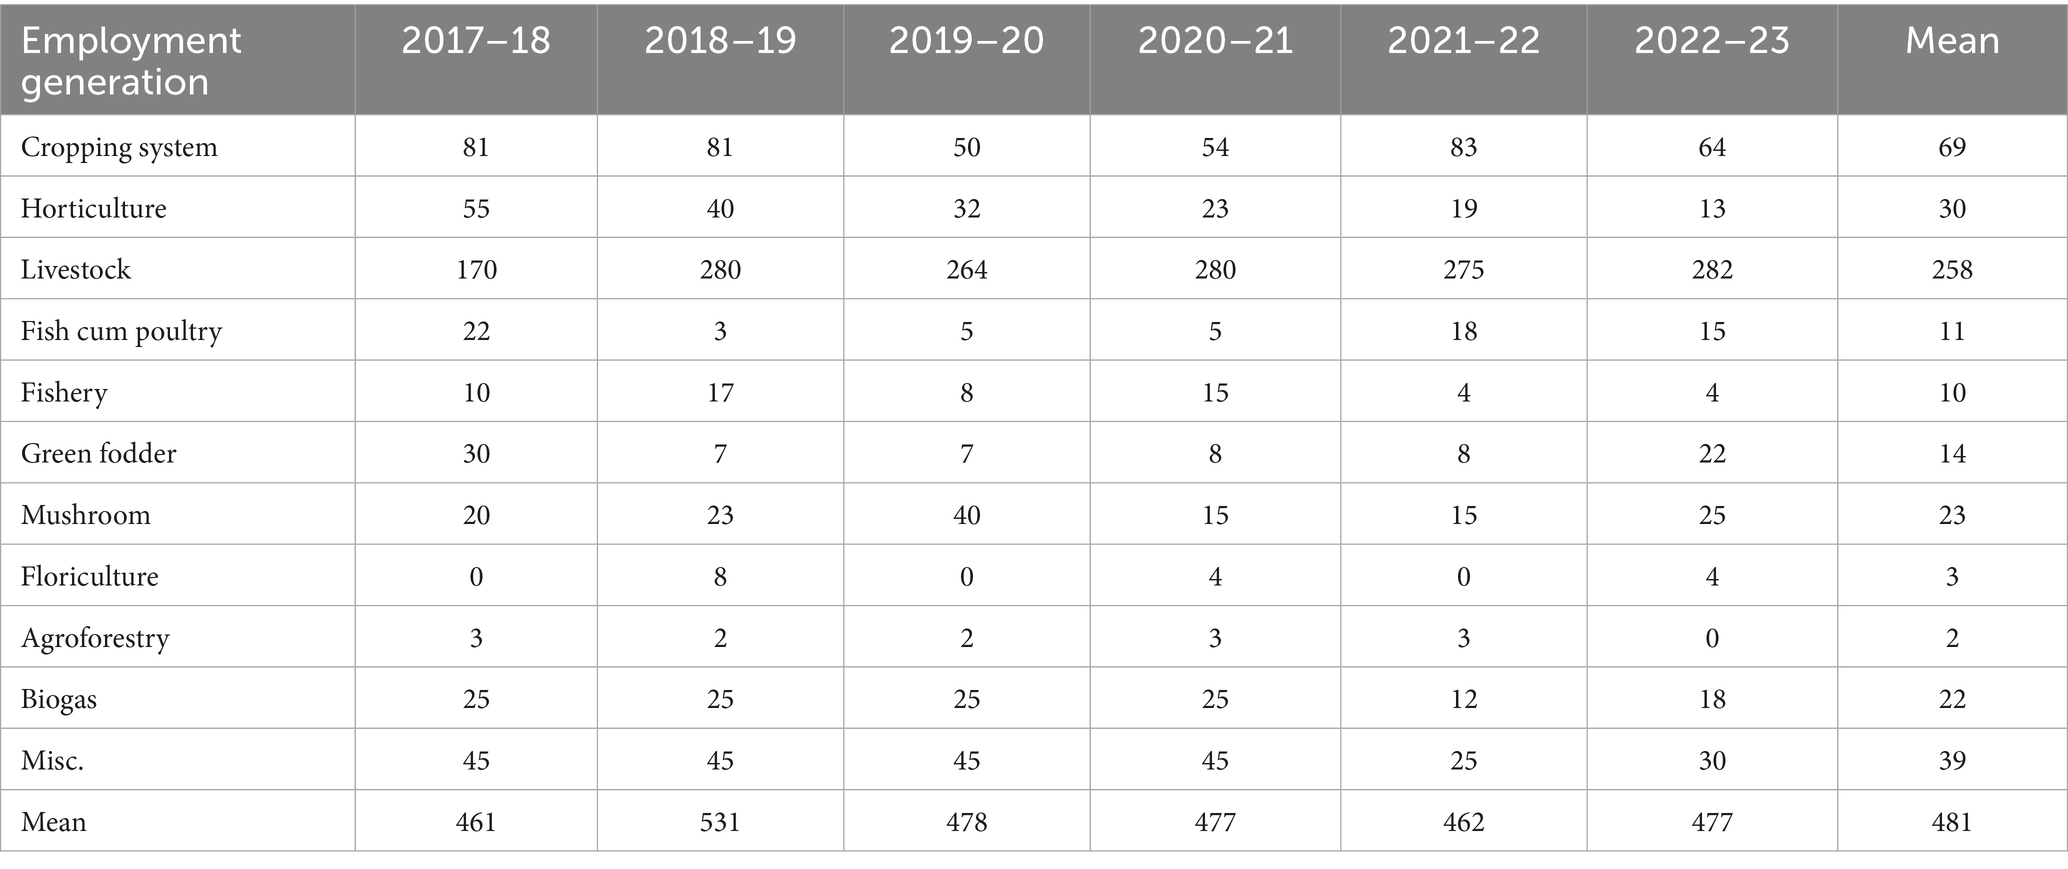
Table 3. Employment generation (mean of 2017–2023).
3 Economic studies
3.1 Cost of cultivation
The cost of different operations done during the crop growth was worked out separately for each item. The manual and mechanical labor power engaged for different operations was recorded on a per-hectare basis, and the cost was calculated for different operations by multiplying by the existing market prices. Similarly, the cost of all inputs was also calculated. The total cost was calculated by adding the expenditure involved in all kinds of operations.
3.2 Gross returns
The gross returns were calculated by multiplying the total grain and straw/ha yield by the prevalent market prices.
3.3 Net returns
The net returns were computed by deducting the total cost of cultivation from the gross returns of each component.
3.4 Benefit–cost ratio
Benefit–cost (B:C) ratio was calculated by dividing the net returns by the cost of cultivation for different components.
3.5 Statistical analysis
The data presented in the manuscript are the mean values. All the observations are statistically analyzed by using the analysis of variance. The results were tested for the treatment mean by applying an F-test of significance on the basis of the null hypothesis (Cochran and Cox, 1957). Wherever necessary, standard errors along with critical differences at 5% level of significance were computed for discriminating the treatment effects from chance effects (Panse and Sukhatme, 1967).
3.6 Sustainability
Sustainable yield index (SYI): It is the ratio of minimum assured seed yield to maximum observed yield (Singh et al., 1990) and mathematically described as follows:
where Ya is the mean yield, σ is the standard deviation of yield, and Ym is the maximum yield obtained under a set of management practices. The yield data from different crop components were processed and interpreted in terms of SYI. The SYI of individual crops was calculated following the equation suggested by Singh et al. (1990). The nearness of SYI to 1.00 implies the closeness to an ideal condition that can sustain maximum crop yield over the years, while deviation from 1.0 indicates the losses to sustainability (Bhindhu and Gaikawad, 1998; Cai et al., 2018; Choudhary et al., 2018).
4 Results and discussion
A 6-year field study (2017–2023) assessed the productivity, economic performance, and sustainability of a diversified cropping system using REY, economic indicators, and sustainability indices. The REY varied notably across the study period, ranging from 176.1 to 244.3 t/ha/year. The highest REY was recorded in 2017–18, followed in descending order by 2020–21, 2019–20, 2018–19, and 2021–22, while the lowest value was observed in 2022–23 (Table 4) because of the varying climatic effects for each component. REY in descending order is mainly attributed to the fluctuation of price in basmati rice in different years. The higher the price, the lower will be the REY value and other production/marketing factors. Cost of production in the IFS model exhibited a consistent upward trend throughout the period, reaching a maximum of ₹570,299 ha−1 in 2022–23. This rise is attributable to escalating input costs and labor wages. Despite increasing expenditures, gross returns also increased steadily, with a peak return of ₹880,912 ha−1 in 2022–23. However, net returns displayed variability, fluctuating between ₹271,179 and ₹321,499 ha−1, mainly because of the varying revenue realized in a system. The lower revenue realized is attributed to fluctuating prices of poultry and their mortality, varying milk yield, and mushroom production. However, on average, the model showed a profitability of 3.05 lakh/ha, which is comparatively higher than the existing farming system in variety (Rs. 1.20/ha/year).
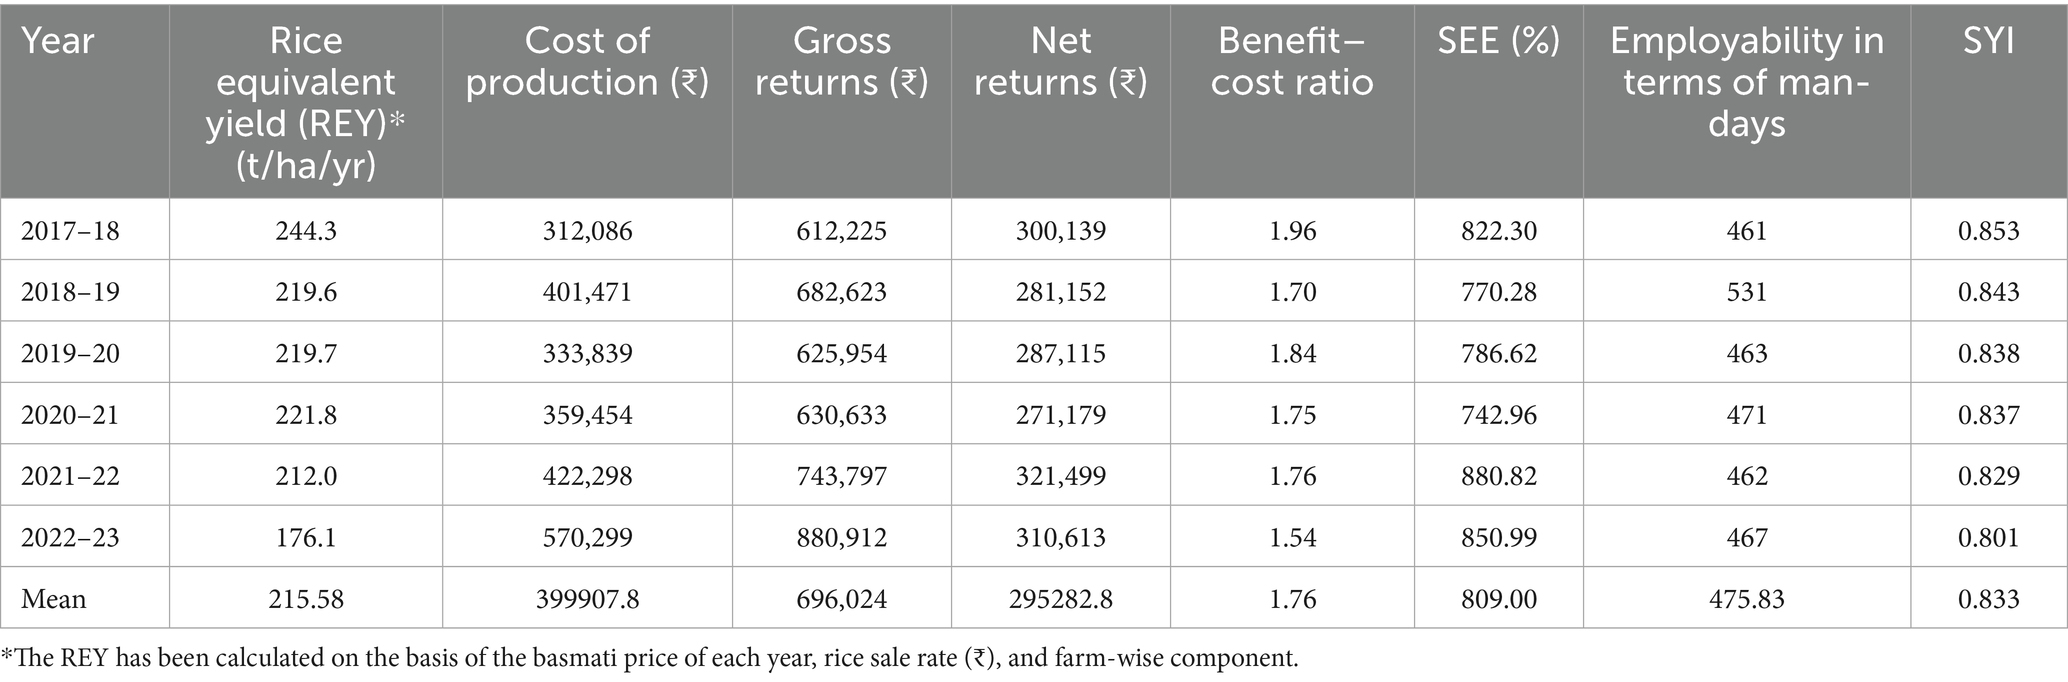
Table 4. Productivity in terms of REY, economics, employment and sustainability in the IFS model (2017–23).
The benefit–cost ratio (BCR), though remaining above the threshold of economic feasibility (1.5) throughout the period, declined from 1.96 in 2017–18 to 1.54 in 2022–23. However, on average, the IFS model B:C ratio in the IFS system is standardized, which gave higher values than the existing farming system in irrigated areas. This trend suggests a gradual reduction in resource-use efficiency.
The sustainability of the system was further evaluated using the SYI. Initially, the SYI stood at 0.853 (2014–2017). During the subsequent years (2017–2023), a rolling SYI between 0.853 and 0.801 was observed, suggesting a slight decline in yield stability. This reduction could be associated with increased production costs or market-driven fluctuations in basmati rice prices. SYI values range from 0 to 1, with lower values indicating greater yield instability, often driven by higher variability in environmental or management factors (Cai et al., 2018; Choudhary et al., 2018). Comparative studies have highlighted the superior sustainability of IFS over conventional monocropping systems. For example, Kumar et al. (2022) reported higher average SYIs in crop + fishery + dairy (0.77) and crop + fishery (0.65) models than much lower values for traditional rice–wheat (0.07) and rice–maize (0.15) systems, which dominate many Indian regions. Similar findings were reported by Panwar et al. (2018), who observed higher SYIs in humid agroecosystems, particularly in a crop + horticulture + dairy + fishery model in Kalyani, West Bengal (0.78). Conversely, subhumid regions like Pantnagar, Uttarakhand, with greater rainfall variability, showed reduced SYI values (0.38). This supports the assertion that lower coefficients of variation in rainfall positively influence sustainability. Mukherjee (2013) also demonstrated enhanced sustainability in mid-hill IFS models in West Bengal, where systems integrating crop + piggery + poultry + dairy achieved indices of 88.5, significantly outperforming sole cropping systems (44.8). Overall, the findings underscore the potential of diversified farming systems to enhance productivity and resilience, although economic viability may be threatened by rising costs and market dynamics, necessitating adaptive management and policy support.
The comparative evaluation of diverse components within IFS revealed marked variability in productivity, economic returns and resource-use efficiency (Table 5 and Figure 2). Among all components, livestock emerged as the most dominant in terms of REY (13,347 kg/year) and net returns (₹155,050), accounting for 50% of the total profit share, despite its relatively low benefit–cost (B:C) ratio of 0.63, suggesting high input requirements. Cropping systems, with a moderate REY of 2,555 kg and net returns of ₹42,309, contributed 13.86% to the overall profitability, reflecting economic sustainability (B:C ratio = 1.23) and substantial employment generation (69 man-days/year). This was probably due to the higher returns from milch animals, including profit from vermicompost and recycling of by-products of crops and other synergy components like mushrooms and poultry.
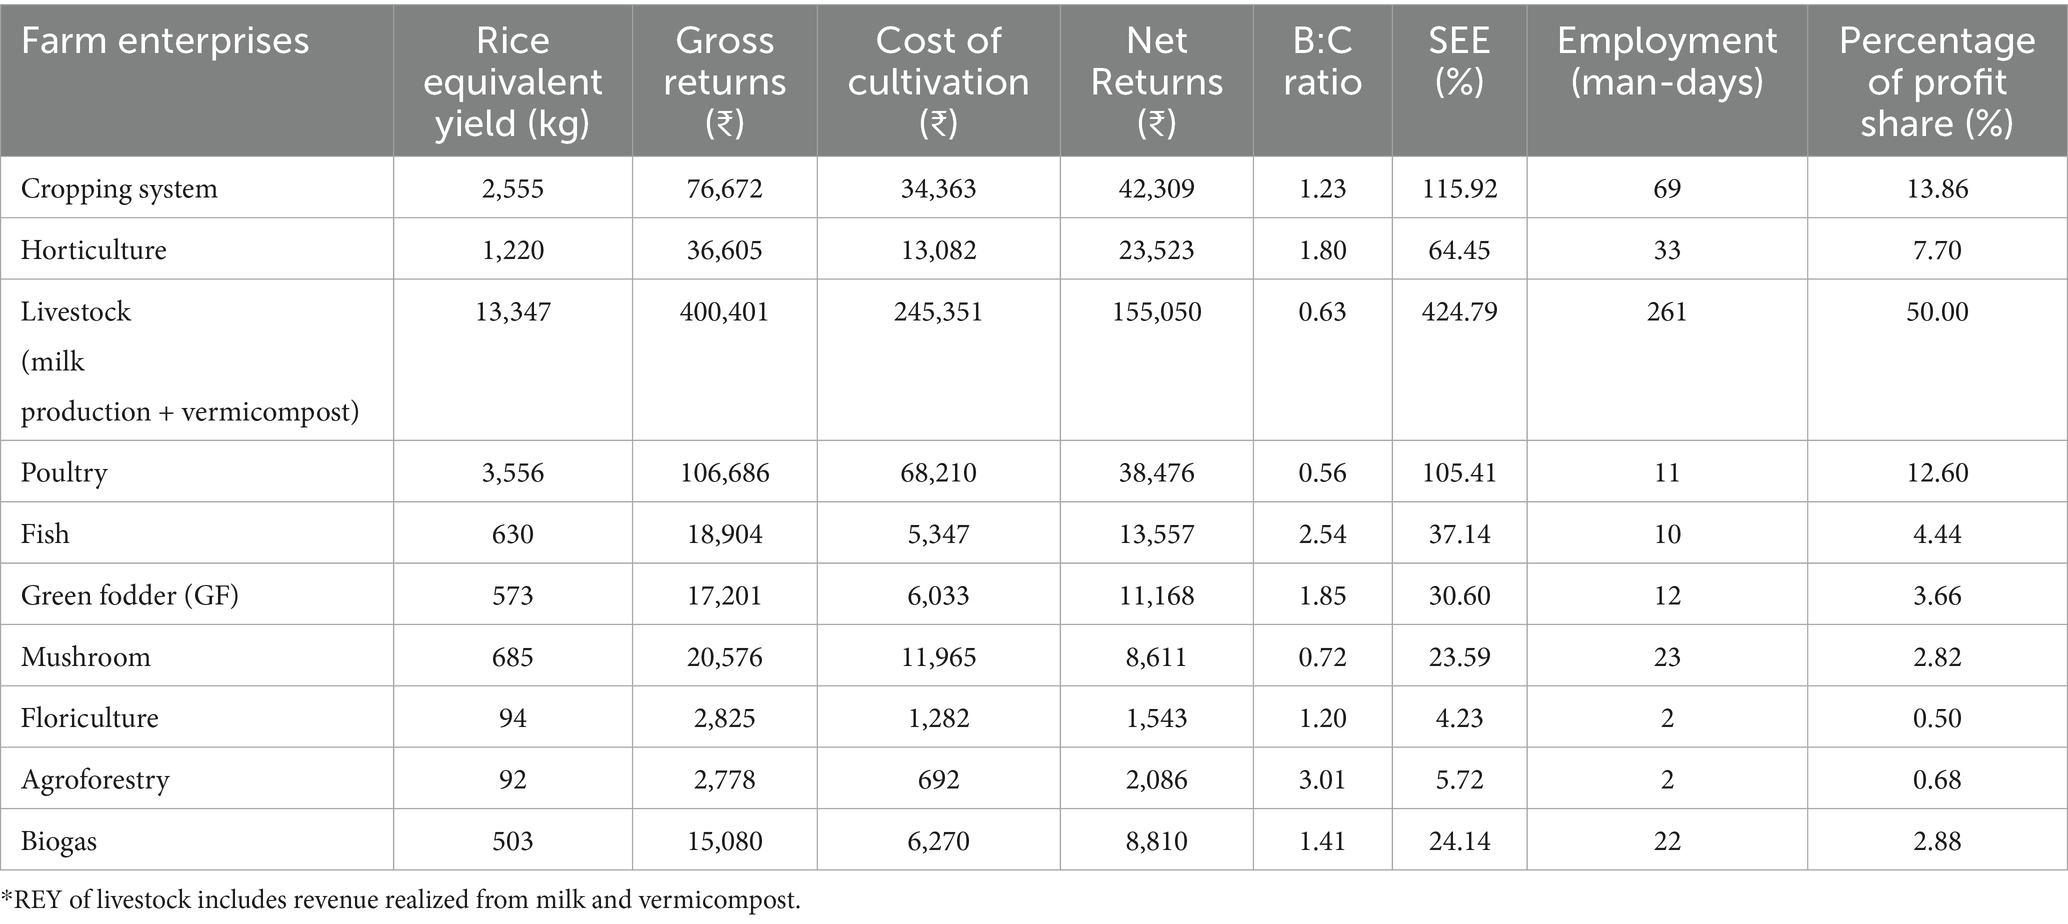
Table 5. Farm enterprise-wise productivity in terms of rice equivalent yield (REY), system economic efficiency (%), employment, and percent share in the IFS model (mean of 2017–2023).
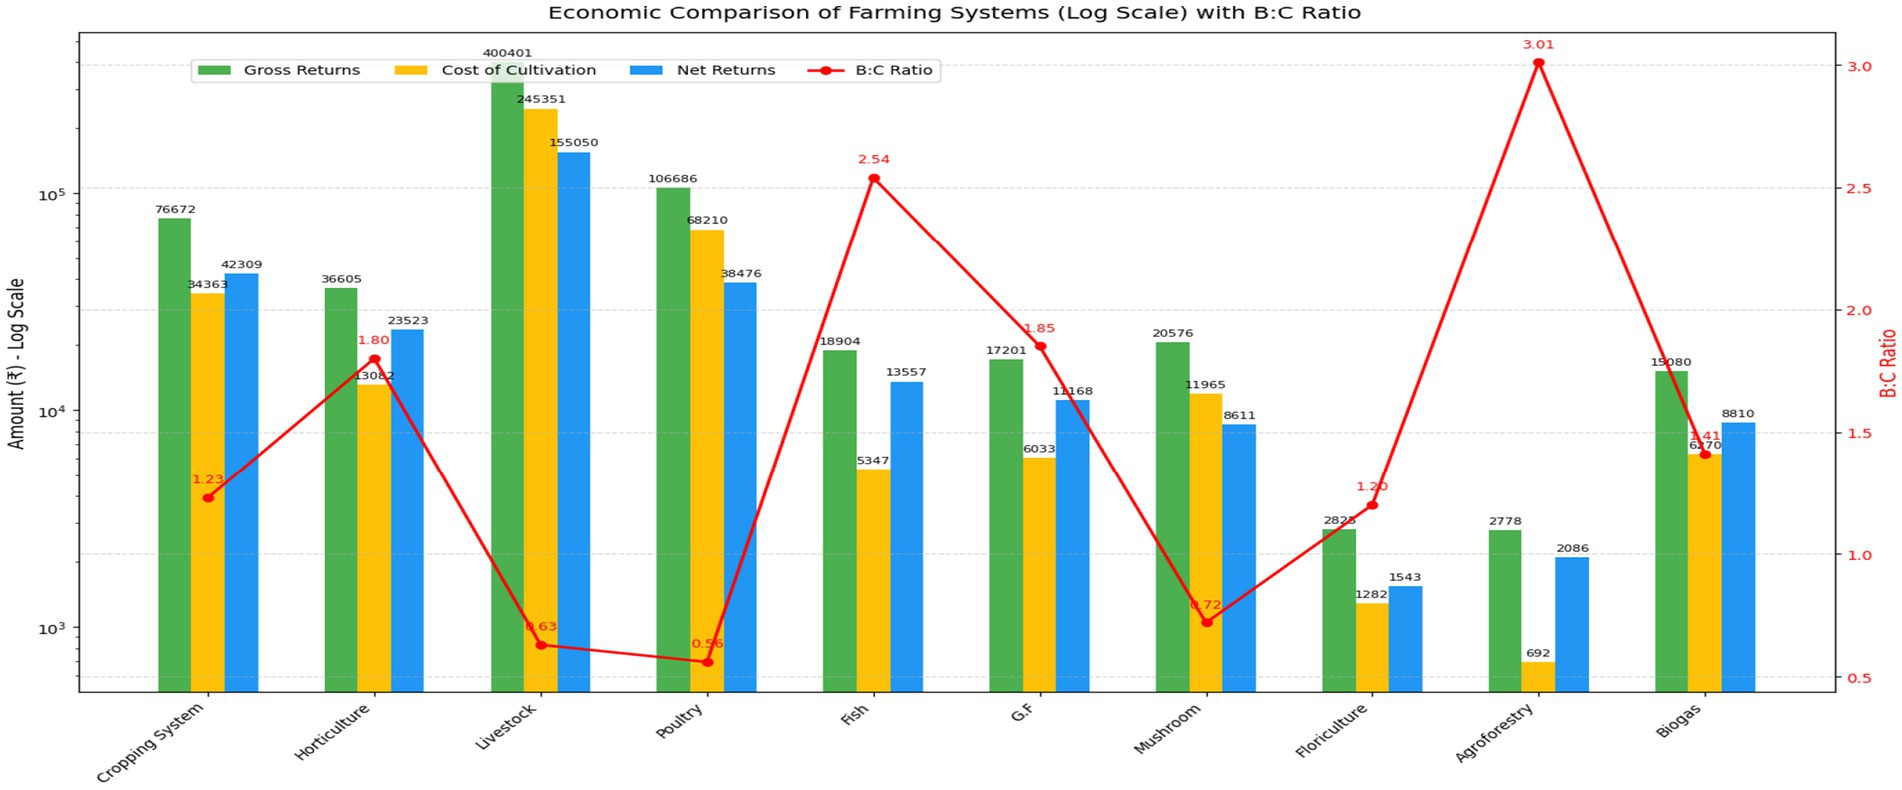
Figure 2. Productivity in terms of rice equivalent yield of different integrated farming system components, economics, employment, and percent share (mean of 2017–2023).
Horticulture showed high economic efficiency (B:C ratio = 1.80) with low input costs and provided considerable net income (₹23,523) from a modest REY (1,220 kg), indicating suitability for smallholders with limited resources. Fishery and agroforestry, although generating REY (630 kg and 92 kg, respectively), exhibited the higher B:C ratios (2.54 and 3.01) due to low input cost in these components of IFS, signifying exceptional profitability per unit investment, and contributed to system diversity and sustainability. Components like mushroom, biogas, and boundary plantation had moderate net returns and profit shares; yet, they contributed to nutrient recycling, value addition, and employment, particularly biogas, which supported recycling of cow dung into usage as cooking gas. The poultry unit of the IFS model also recommended a percentage profit share of 12.60% by generating net returns of Rs. 38,476 with minimum labor requirements.
The SEE varied widely, with the highest values recorded in livestock (424.79), followed by cropping systems (115.92) and poultry (105.41), which was probably due to higher profit realized from these components, pointing to their substantial contribution to system viability. Overall, the findings underscore the complementary roles of diverse IFS components, where integrating high-return sectors, such as livestock and agroforestry, with low-input, high-efficiency enterprises, like fishery and horticulture, can optimize profitability, employment and sustainability under smallholder conditions.
The cost of cultivation across various agricultural components from 2017–18 to 2022–23 shows a consistent upward trend (Table 6), reflecting rising input costs and diversified investments. Among the different sectors, livestock + biogas emerged as the most capital-intensive component, with costs increasing from ₹172,549 in 2017–18 to ₹379,522 in 2022–23, averaging ₹251,621.33 over the period. Fish cum poultry also showed substantial investment, averaging ₹75,228.33, with a noticeable rise in 2022–23. In contrast, horticulture (vegetables and fruits) and mushroom cultivation maintained relatively lower and more variable costs, averaging ₹15,056.50 and ₹11,631.67, respectively. Green fodder remained the least expensive input, averaging just ₹6,032.50. The cropping system remained relatively stable, averaging ₹34,363.33, though it experienced a dip in 2020–21. Overall, the total cost of cultivation increased sharply from ₹312,086 in 2017–18 to ₹570,297 in 2022–23, with an average of ₹402,078.67, indicating an intensifying investment trend in IFSs over time.
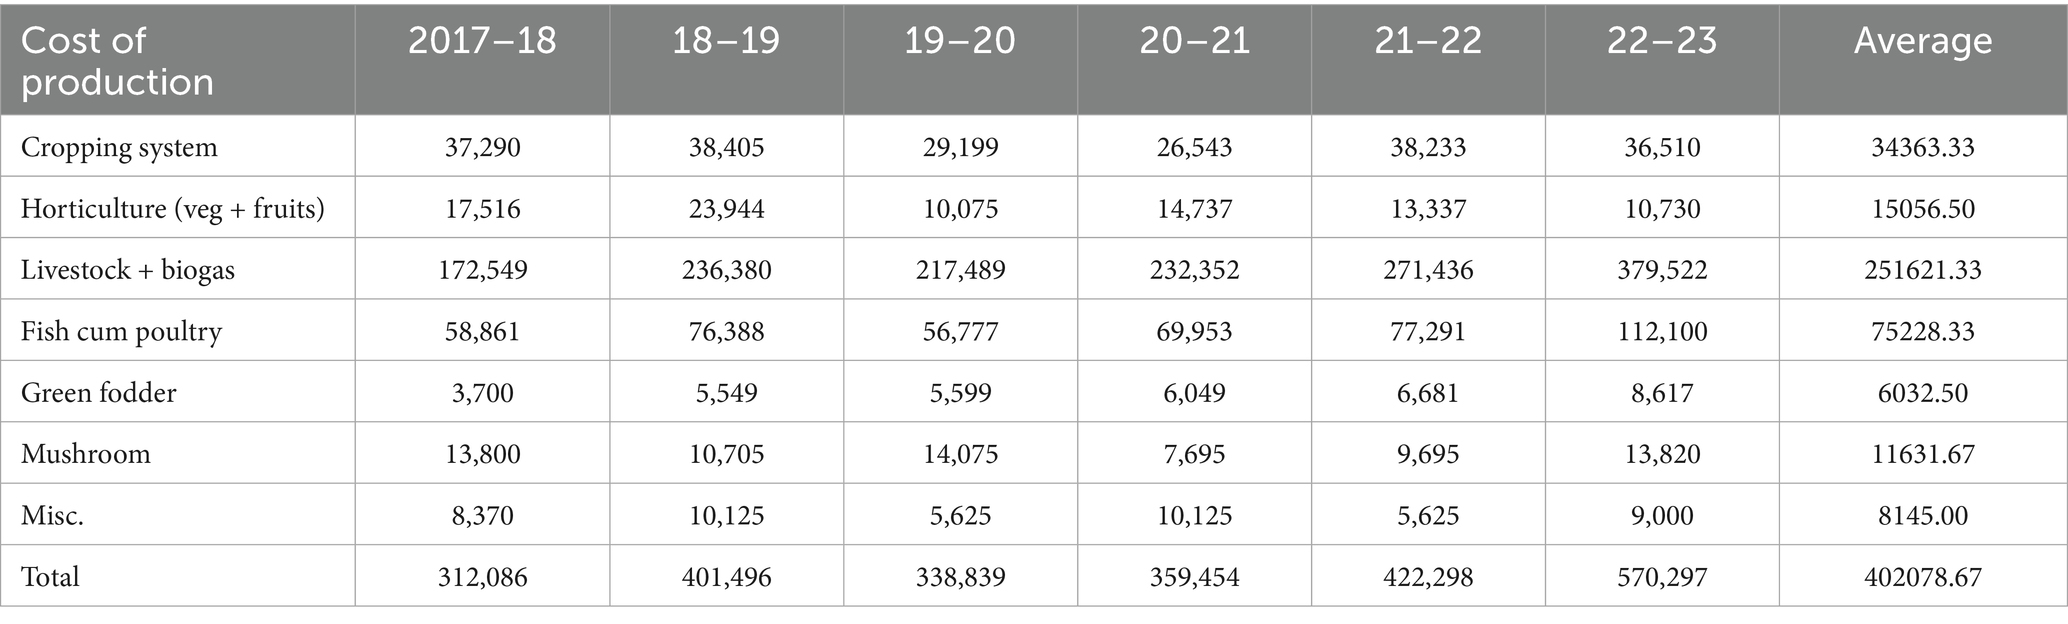
Table 6. Cost of Production (mean of 2017–2023).
Component-wise cost of production of each IFS component was recorded, and the maximum cost of production, which contributes 63% of the total average cost of the IFS model (Rs. 402,078/ha) was found in livestock + biogas unit including farm waste recycling, that is, vermicompost followed by fish cum poultry (19%) and crop unit (8.5%), respectively.
The net returns from 2017–18 to 2022–23 highlight the economic performance of various components within an IFS (Table 7). Livestock consistently delivered the highest returns, averaging ₹1,55,051 over 6 years, with a peak of ₹2,01,538 in 2022–23, due to the sale of young animals underscoring its profitability and central role in farm income. Fish cum poultry, and the cropping system also provided steady contributions, averaging ₹38,310 and ₹42,342, respectively, with both showing relatively stable trends. Horticulture component demonstrated moderate profitability (₹22,856 average), though returns dropped sharply in 2022–23, possibly due to market or climatic factors. Components like fishery, green fodder, mushroom, and biogas contributed modestly, with averages ranging from ₹8,611 to ₹14,557, while floriculture and agroforestry had the lowest returns, averaging ₹1,028 and ₹2,087, respectively. The overall average total net return across all enterprises stood at ₹3,04821, reflecting a balanced yet diversified income structure, with livestock, cropping, and integrated aquaculture-livestock systems being the most financially rewarding.
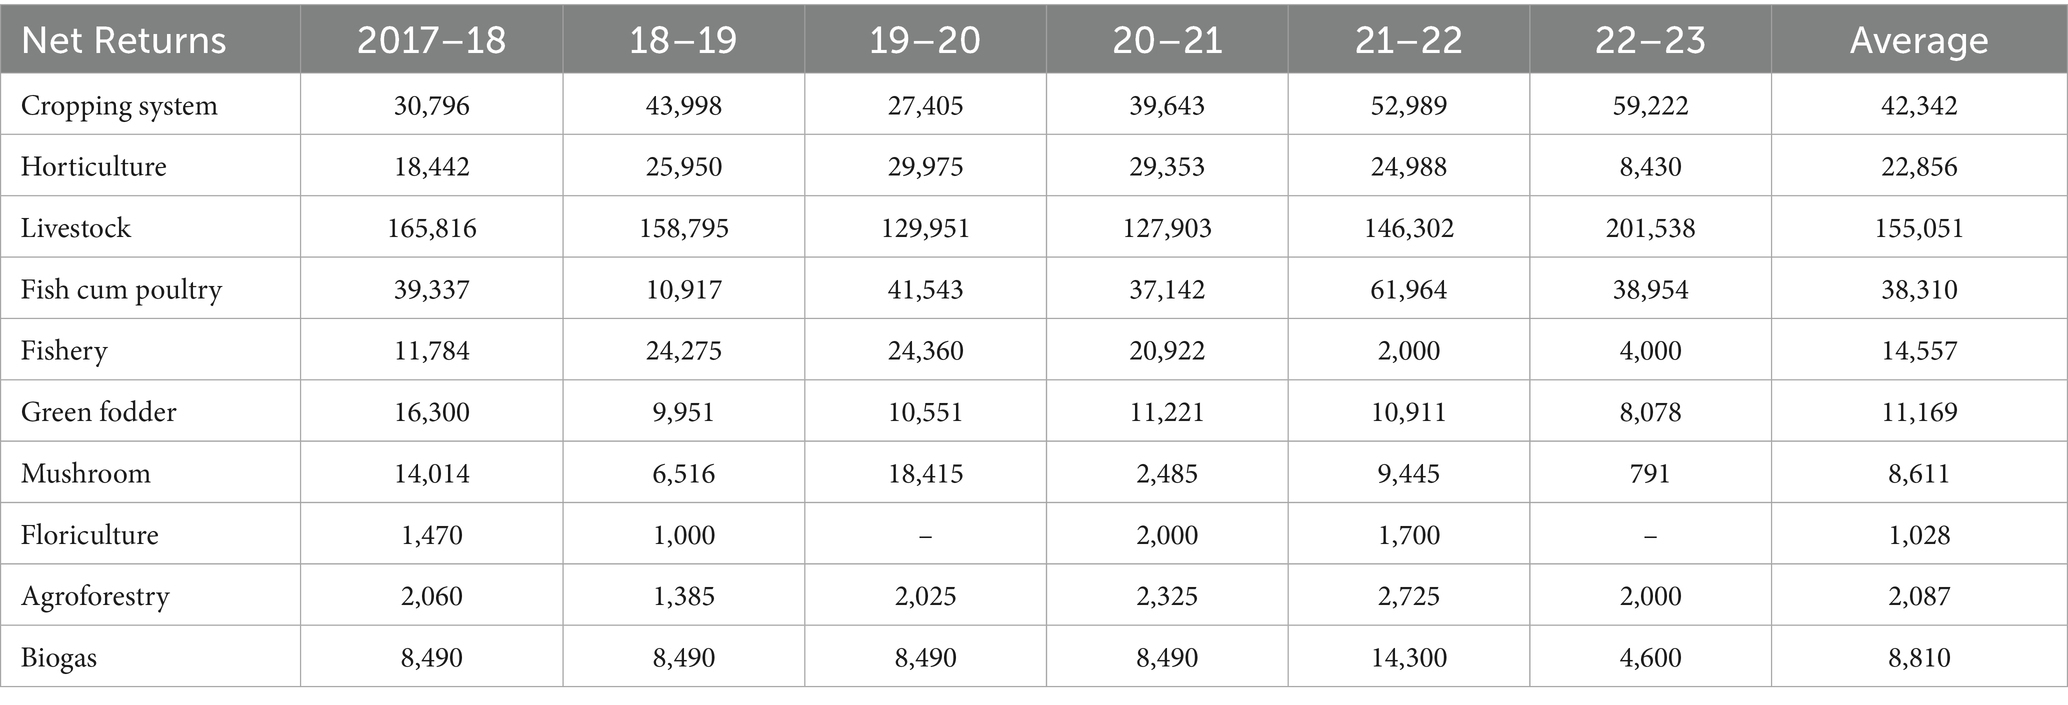
Table 7. Net returns (mean of 2017–2023).
The employment generation data from 2017–18 to 2022–23 reflect the labor demand across various components of an IFS, averaging 481 man-days per year. Livestock consistently emerged as the highest employment generator, averaging 258 man-days (Table 3 and Figure 3), highlighting its labor-intensive nature and key role in rural livelihoods. The cropping system followed, with an average of 69 man-days, showing a relatively stable labor demand. Horticulture showed a declining trend, averaging 30 man-days, likely due to mechanization or reduced area under cultivation. Mushroom cultivation and miscellaneous activities also contributed notably, averaging 23 and 39 man-days, respectively. Other components like fishery, fish cum poultry, green fodder, and biogas had moderate contributions, while floriculture and agroforestry generated minimal employment. Overall, the data underscore the importance of livestock and diversified farm enterprises in enhancing rural employment, with integrated systems providing year-round labor opportunities. It is evident from the research that IFS generated more than 2- to 3-fold additional employment over arable farming. On average, 481 man-days of employment were generated in the 1-ha IFS model within the farm and its components. Among all the components maximum number of 258 man-days was generated in the livestock unit, which contributes about 55% of the total employment generation, followed by the crop unit (14.4%), whereas other components contribute 30% of the total employment generation.
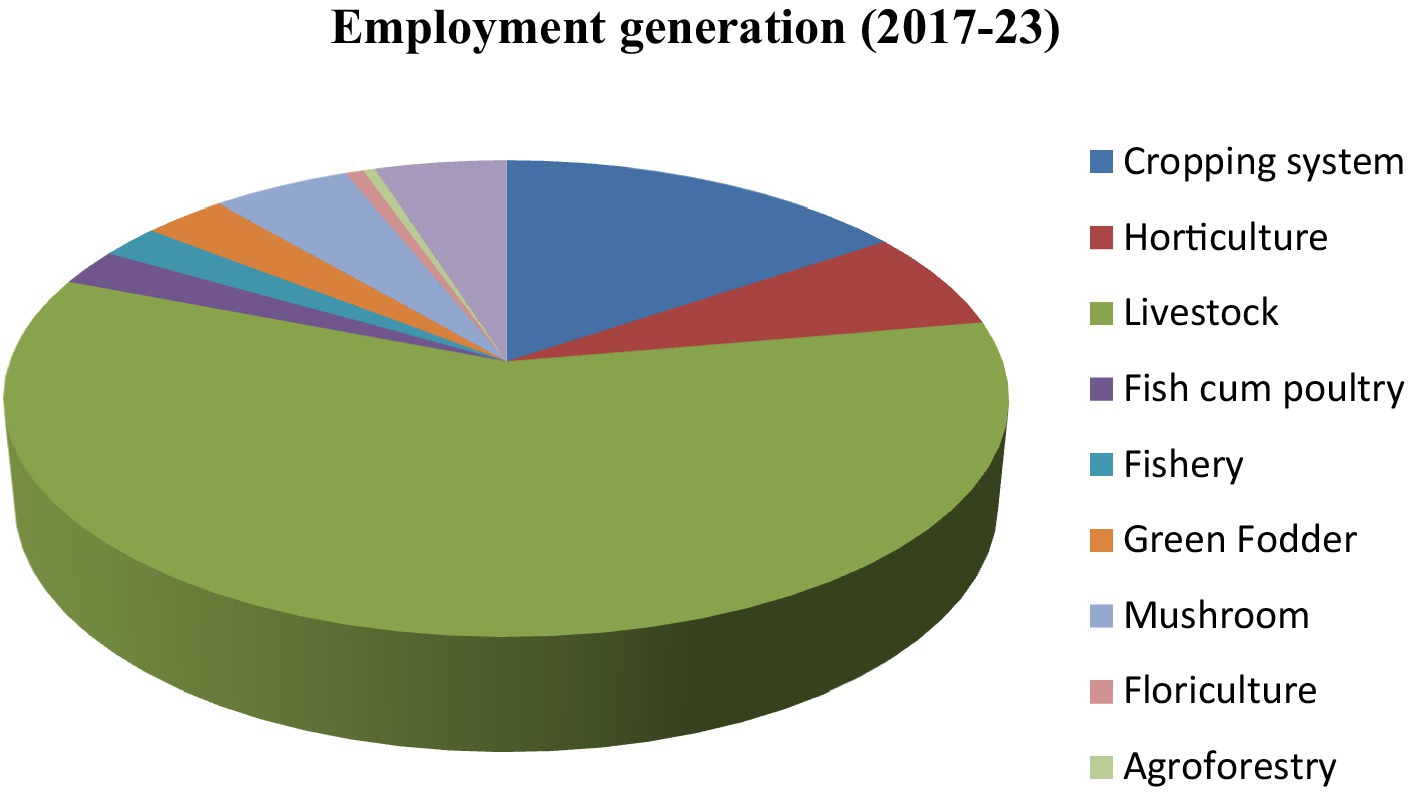
Figure 3. Pie chart representing the average data of employment generation (2017–2023).
4.1 Impact of land use systems under IFS model on soil organic carbon and microbial biomass
Soil quality indicators such as soil organic carbon (SOC), MBC, and total organic carbon (TOC) were assessed under various land-use systems within an IFS model (Table 3). These were measured at soil depths of (0–15 cm) and compared against the initial SOC baseline (5.70 g/kg in the 0- to 15-cm layer) and conventional rice–wheat cropping systems on farmers’ fields (EFFS).
4.1.1 Soil organic carbon dynamics
The SOC content varied significantly across land-use types and soil depths. In the surface layer (0–15 cm), SOC ranged from 5.33 g/kg in EFFS to 10.15 g/kg in the turmeric boundary plantation block, demonstrating substantial enrichment under IFS practices. Among cropping systems, the rice–pea–black gram (R-P-BG) sequence showed higher SOC (8.10 g/kg) than rice–wheat–green manure (R-P-GM; 7.39 g/kg), rice-wheat-green manuring, and rice–maize–fodder (R-M-F; 7.65 g/kg). Horticultural and fodder-based systems also showed elevated SOC, with the maize + sorghum and berseem + oat sequence recording 9.39 g/kg. SOC decreased consistently with soil depth across all treatments, with the least change observed under the perennial fodder block (HYV Napier) and EFFS beyond 30 cm, reflecting limited carbon translocation.
4.1.2 Microbial biomass carbon trends
MBC followed a similar depth-wise decline but showed substantial improvement under diversified IFS components. The turmeric strip plantation exhibited the highest surface MBC (175.34 mg/kg), followed by the fodder block (120.79 mg/kg) and sole horticulture (116.56 mg/kg). Among crop blocks, R-P-BG registered higher MBC (110.20 mg/kg) than R-W-GM (105.50 mg/kg) and R-M-F (108.20 mg/kg). The lowest MBC was observed under the EFFS system (84.78 mg/kg). These results suggest that the inclusion of leguminous crops, perennials, and horticulture positively influenced microbial activity and biomass, indicating improved soil biological health.
4.1.3 Total organic carbon profile
TOC trends paralleled those of SOC and MBC, with the highest values recorded in the boundary plantation (28.00 g/kg at 0–15 cm), significantly exceeding values in EFFS (16.80 g/kg) and the initial status (not specified but inferred to be ~16–17 g/kg based on trends). Crop and fodder-based systems ranged from 19.00 to 24.49 g/kg in the topsoil. The smallest decline in TOC with increasing depth was noted under perennial and boundary systems, highlighting better carbon retention capacity.
The perusal of Table 8 and Figure 4 indicated the input–output potential and also quantified the by-products realized from the IFS model for recycling. In addition, marketable/own farm use production depicted in Figure 4 indicated that the farmer can realize the various components of food used for livelihood and nutritional security of the farm family, whereas part of it is used for his common needs, and part has a marketable surplus. However, as far as by-products are concerned it has been realized that in 1 ha of farm land in irrigated ecosystem rice straw (1912 kg), wheat (1,112 kg), cow-dung (28,200 kg), vermicompost (7,070 kg), spent mushroom compost (700 kg), weed residues (300 kg), dropping of poultry (225 kg), fresh green fodder (17,592 kg), slurry (4,500 kg), and fertile silt of fish pond (4,500 kg after 3 years) was harvested and recycled in the crop component of IFS model.
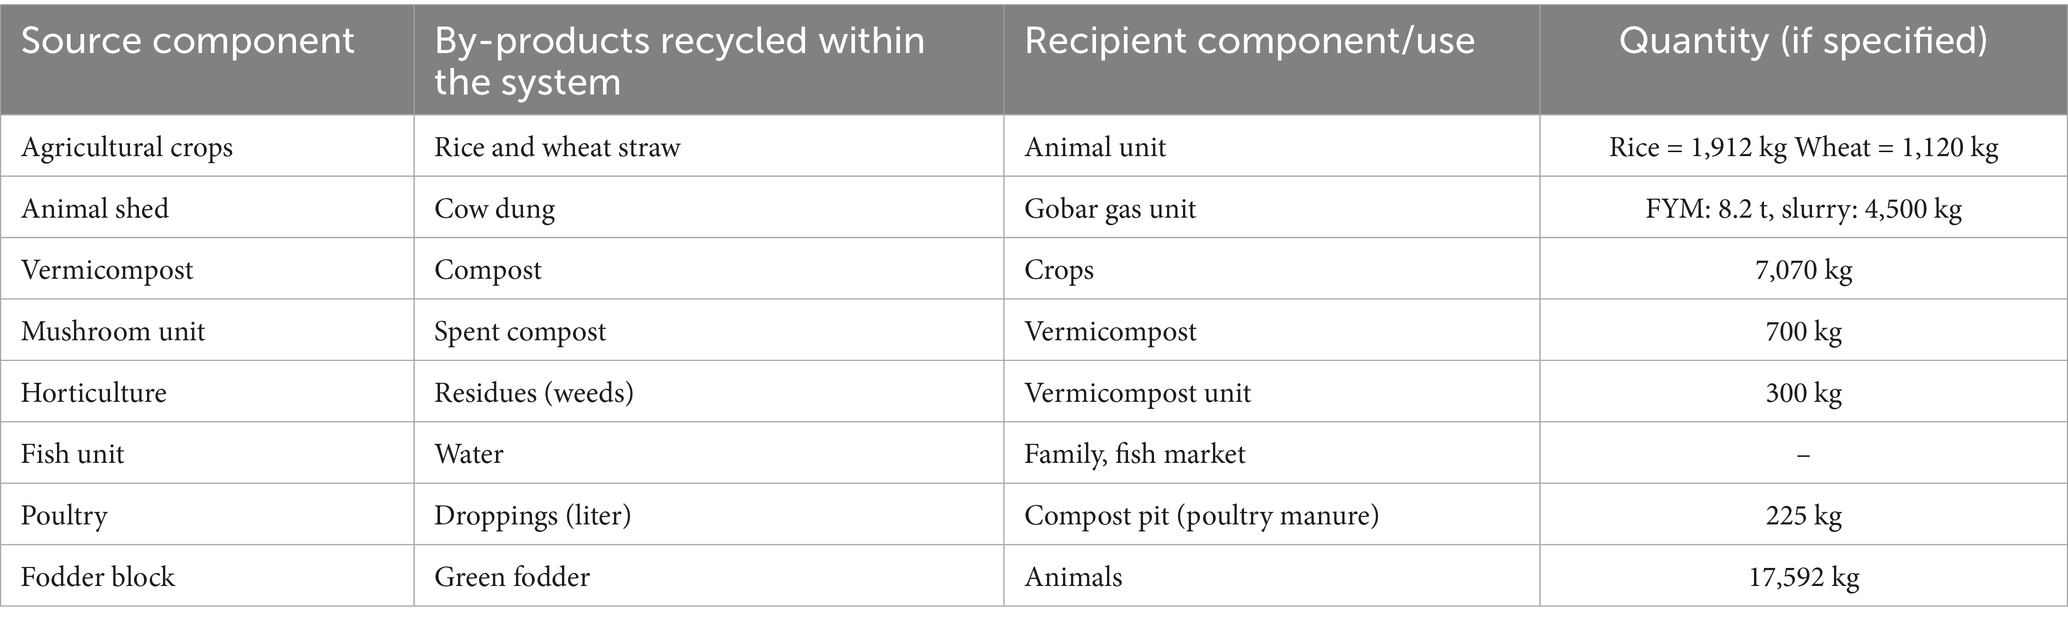
Table 8. Quantification of recycling of various by-products in an IFS model.

Figure 4. Recycling of main and by-products within the IFS model.
5 Conclusion
From the detailed analysis of data generated in the IFS model developed for small farmers of irrigated ecosystem on North-Western Himalayan Region of Jammu, clearly indicates that due to climatic vulnerability and declining productivity, it is possible to not only increase overall production of the farm but also doubled the net income of these small holdings resource poor farmers in a quantified and established IFS model over the period of 6 years than the existing farming system. Each component contributing to the income of the farmer was calculated, and it has been worked out that the crop component contributed (14%), the dairy unit 50%, mushroom cultivation (3%), horticulture (8%), poultry (13%), and fishery (4%). In addition, the carbon sequestration (−19010.8 kg/t/year) attributed on average was made possible, which was attributed to the minimum use of agrochemicals and boundary plantation at the four sides of the IFS model. Each enterprise in this system was standardized in such a way that its by-products are affectively recycled in the system. In addition, the IFS model has increased the employability and has become a sustainable complete model for climate affect mitigation. Because agriculture is an outdoor occupation where several factors affect its production and profitability, interrelated components provide an income insurance cover to farmers for increasing sustainability, livelihood security and nutritional requirements of these farm families owing to climate change. The model is best fit to adopt easily, as it is a low-cost infrastructure and is easily adaptable.
5.1 Recommendation
The IFS model developed at SKUAST-J on a 1-ha land area will probably increase small and marginal farmers’ income manifold, which not only sustains the farmer’s income but also ensures nutritional security by maintaining soil health for future generations under a changing climatic scenario with the efficient recycling of farm by-products. Hence, it is recommended for small and marginal farmers for its dissemination or replication across the UT of Jammu and Kashmir.
Data availability statement
The original contributions presented in the study are included in the article/supplementary material, further inquiries can be directed to the corresponding authors.
Author contributions
NT: Formal analysis, Writing – original draft, Methodology, Conceptualization, Resources, Investigation, Project administration, Data curation. DK: Methodology, Data curation, Writing – original draft, Investigation, Project administration, Resources, Formal analysis, Conceptualization. PK: Methodology, Investigation, Conceptualization, Data curation, Resources, Writing – original draft, Formal analysis, Project administration. AG: Writing – original draft, Resources, Investigation, Project administration, Formal analysis, Data curation, Methodology, Conceptualization. NR: Resources, Writing – original draft, Methodology, Data curation, Conceptualization, Investigation, Project administration, Formal analysis. VKh: Investigation, Writing – original draft, Conceptualization, Formal analysis, Project administration, Data curation, Methodology, Resources. VKo: Conceptualization, Methodology, Project administration, Formal analysis, Resources, Investigation, Writing – original draft, Data curation. MA: Supervision, Writing – review & editing, Visualization. SM: Visualization, Writing – review & editing, Supervision. GA-Q: Visualization, Writing – review & editing, Supervision. AS: Visualization, Supervision, Writing – review & editing. MM: Visualization, Supervision, Writing – review & editing.
Funding
The author(s) declare that financial support was received for the research and/or publication of this article. This work was funded by Ongoing Research Funding program-Research Chairs (ORF-RC-2025-5513), King Saud University, Riyadh, Saudi Arabia.
Acknowledgments
The authors extend their appreciation to the Ongoing Research Funding program-Research Chairs (ORF-RC-2025-5513), King Saud University, Riyadh, Saudi Arabia. The authors wish to acknowledge the ICAR-IIFSR Modipuram for providing financial and technical backup to AICRP-IFS, SKUAST Jammu.
Conflict of interest
The authors declare that the research was conducted in the absence of any commercial or financial relationships that could be construed as a potential conflict of interest.
Generative AI statement
The authors declare that no Gen AI was used in the creation of this manuscript.
Any alternative text (alt text) provided alongside figures in this article has been generated by Frontiers with the support of artificial intelligence and reasonable efforts have been made to ensure accuracy, including review by the authors wherever possible. If you identify any issues, please contact us.
Publisher’s note
All claims expressed in this article are solely those of the authors and do not necessarily represent those of their affiliated organizations, or those of the publisher, the editors and the reviewers. Any product that may be evaluated in this article, or claim that may be made by its manufacturer, is not guaranteed or endorsed by the publisher.
References
Babu, S., Mohapatra, K. P., Das, A., Yadav, G. S., Tahasildar, M., and Singh, R. (2020). Designing energy-efficient, economically sustainable, and environmentally safe cropping system for the rainfed maize–fallow land of the eastern Himalayas. Sci. Total Environ. 722:137874. doi: 10.1016/j.scitotenv.2020.137874
Bhindhu, P. S., and Gaikawad, S. T. (1998). Sustainability yield index of soybean-wheat cropping system as influenced by landform and soil site characteristics. J. Indian Soc. Soil Sci. 46, 86–89.
Borrelli, L., Castelli, F., Ceotto, E., Cabassi, G., and Tomasoni, C. (2014). Maize grain and silage yield and yield stability in a long-term cropping system experiment in northern Italy. Eur. J. Agron. 55, 12–19. doi: 10.1016/j.eja.2013.12.006
Cai, A. D., Zhang, W. J., Xu, M. G., Wang, B. R., Wen, S. L., and Shah, S. A. A. (2018). Soil fertility and crop yield after manure addition to acidic soils in South China. Nutr. Cycl. Agroecosyst. 111, 61–72. doi: 10.1007/s10705-018-9918-6
Choudhary, M., Panday, S. C., Meena, V. S., Singh, S., Yadav, R. P., Mahanta, D., et al. (2018). Long-term effects of organic manure and inorganic fertilization on sustainability and chemical soil quality indicators of soybean-wheat cropping system in the Indian mid-Himalayas. Agric. Ecosyst. Environ. 257, 38–46. doi: 10.1016/j.agee.2018.01.029
Cochran, W. G., and Cox, G. M. (1957). Experimental Designs. second ed. New York: John Wiley and Sons.
Döring, T. F., and Reckling, M. (2018). Detecting global trends of cereal yield stability by adjusting the coefficient of variation. Eur. J. Agron. 99, 30–36. doi: 10.1016/j.eja.2018.06.007
Fatima, A., Singh, V. K., Babu, S., Singh, R. K., Upadhyay, P. K., Rathore, S. S., et al. (2023). Food production potential and environmental sustainability of different integrated farming system models in Northwest India. Front. Sustain. Food Syst. 7:959464. doi: 10.3389/fsufs.2023.959464
Gill, M. S., Singh, J. P., and Gangwar, K. S. (2009). Integrated farming system and agriculture sustainability. Indian J. Agron. 54, 128–139.
GoI. (2015). Agricultural statistics at a glance. Directorate of Economics and Statistics, Department of Agriculture and operation, Ministry of Agriculture, Government of India
Houba, V.J.G., Van Der Lee, J.J, and Novozamsky, I. (1995). Soil and plant analysis, a series of syllabi. Part 5 B: Soil analysis procedures, other procedures. Department of Soil Science and Plant Nutrition, Agricultural University, Wageningen
Jackson, M. L. (1973). Soil chemical analysis: Advanced course. 2nd Edn. Madison, Wisconsin, USA: University of Wisconsin, Department of Soil Science.
Kachroo, D., Kachroo, J., Bhat, A., Thakur, N. P., Gupta, A. K., Khajuria, V., et al. (2016). Characterization of Farming Systems in Jammu Region of Jammu & Kashmir State and its Policy Implications. Afr. J. Agric. Res. 11, 783–791. doi: 10.5897/AJAR2013.8286
Kumar, S., Shivani, D. A., Kumar, U., Kumar, R., Mondal, S., Kumar, A., et al. (2022). Location-specific integrated farming system models for resource recycling and livelihood security for smallholders. Front. Agron. 4, 75–90.
Mukherjee, D. (2013). Potential integrated farming system model in mid hill region of West Bengal situation. Ann. Agric. Res. 34, 264–268.
Nayaka, A. K., Tripathia, R., Dhala, B., Nayaka, A. D., Vijayakumar, S., Satpathy, B., et al. (2023). Eco-efficiency and technical efficiency of different integrated farming systems in eastern India. Int. J. Sustain. 21:2270250. doi: 10.1080/14735903.2023.2270250
Olsen, S.R., Cole, C.V., Watanabe, F.S., and Dean, L.A. (1954) Estimation of available phosphorus in soils by extraction with sodium bicarbonate. Circular U.S. Department of Agriculture. 939
Panse, V. G., and Sukhatme, P. V. (1967). Statistical Methods for Agricultural Workers. second ed. New Delhi: ICAR Publication.
Panwar, A. S., Ravishankar, N., Shamim, M., and Prusty, A. K. (2018). Integrated farming systems: a viable option for doubling farm income of small and marginal farmers. Bull. Indian Soc. Soil Sci. 32, 68–88.
Panwar, A. S., Ravisankar, N., Singh, R., Prusty, A. K., Shamim, M., Ansari, M. A., et al. (2021). Potential integrated farming system modules for diverse ecosystems of India. Indian J. Agron. 55, 15–32.
Paramesh, V., Chakurkar, E. B., Bhagat, T., Sreekanth, G. B., Kumar, H. C., Rajkumar, S., et al. (2021). Impact of integrated farming system on residue recycling, nutrient budgeting and soil health. Indian J. Agric. Sci. 91, 44–48. doi: 10.56093/ijas.v91i1.110923
Ritchie, H., Reay, D., and Higgins, P. (2018). Sustainable food security in India-domestic production and macronutrient availability. PLoS One 13:e0193766. doi: 10.1371/journal.pone.0193766
Sharma, K., Walia, S. S., Dhaliwal, S. S., Saini, K. S., and Bhagat, R. (2023). Residual effect of nitrogen management on succeeding summer moong (Vigna radiata) under maize-wheat-moong rotation. Indian J. Agric. Sci. 93, 762–777. doi: 10.56093/ijas.v93i7.134678
Sheng, F., Cao, C. G., and Li, C. F. (2018). Integrated rice-duck farming decreases global warming potential and increases net ecosystem economic budget in Central China. Environ. Sci. Pollut. Res. 25, 22744–22753. doi: 10.1007/s11356-018-2380-9
Singh, R.P., Das, S.K., Bhaskarrao, U.M., and Reddy, M.N., (1990). Sustainability index under different management: Annual report Hyderabad . CRIDA, India
St-Martin, A., Vico, G., Bergkvist, G., and Bommarco, R. (2017). Diverse cropping systems enhanced yield but did not improve yield stability in a 52-year long experiment. Agric. Ecosyst. Environ. 247, 337–342. doi: 10.1016/j.agee.2017.07.013
Vance, E. D., Brookes, P. C., and Jenkinson, D. S. (1987). An extraction method for measuring soil microbial biomass C. Soil Biol. Biochem. 19, 703–707. doi: 10.1016/0038-0717(87)90052-6
Walia, S. S., and Kaur, T. (2020). “Integration of efficient farm enterprises for livelihood security of small farmers” in Long-term farming systems research. eds. G. S. Bhullar and A. Riar (Cambridge, Massachusetts, USA: Academic Press), 89–100.
Walia, S. S., Aulakh, C. S., Gill, R. S., Dhawan, V., and Kaur, J. (2016). Intensive integrated farming system approach-a vaccination to cure agrarian crisis in the Punjab. Indian J. Econ. Dev. 12, 451–455. doi: 10.5958/2322-0430.2016.00104.9
Walkley, A., and Black, C. A. (1934). An examination of Degtjareff method for determining soil organic and a proved modification of chromic acid titration method. Soil Sci. 37, 29–38. doi: 10.1097/00010694-193401000-00003
Xu, J., Han, H. F., Ning, T. Y., Li, Z. J., and Lal, R. (2019). Long-term effects of tillage and straw management on soil organic carbon, crop yield, and yield stability in a wheat-maize system. Field Crop Res. 233, 33–40. doi: 10.1016/j.fcr.2018.12.016
Keywords: vermicomposting, integrated farming system, nutrient cycling, small and marginal farm holding, benefit cost ratio, REY
Citation: Thakur NP, Kachroo D, Kumar P, Gupta AK, Ravishankar N, Khajuria V, Koul V, Attri M, Mehta S, Avila-Quezada GD, Mattar MA and Salem A (2025) Sustainable integrated farming system model for enhancing profitability, resource efficiency, and soil health for smallholders in the Indian Mediterranean ecosystem of the North-Western Himalayan region. Front. Sustain. Food Syst. 9:1655465. doi: 10.3389/fsufs.2025.1655465
Edited by:
Amit Anil Shahane, Central Agricultural University, IndiaReviewed by:
Ramkrushna Idapuganti, Central Institute for Cotton Research (ICAR), IndiaR. Sammauria, Sri Karan Narendra Agriculture University, India
Copyright © 2025 Thakur, Kachroo, Kumar, Gupta, Ravishankar, Khajuria, Koul, Attri, Mehta, Avila-Quezada, Mattar and Salem. This is an open-access article distributed under the terms of the Creative Commons Attribution License (CC BY). The use, distribution or reproduction in other forums is permitted, provided the original author(s) and the copyright owner(s) are credited and that the original publication in this journal is cited, in accordance with accepted academic practice. No use, distribution or reproduction is permitted which does not comply with these terms.
*Correspondence: N. P. Thakur, bnB0aGFrdXIwOEBnbWFpbC5jb20=; Swati Mehta, c3dhdGltZWh0YTE5MDkuc21AZ21haWwuY29t; Ali Salem, c2FsZW0uYWxpQG1pay5wdGUuaHU=; Mohamed A. Mattar, bW1hdHRhckBrc3UuZWR1LnNh