 Junguo Hua
 Chunhui Ma
 Yu Kang
 Yunfei Jia
- School of Economics and Management, Henan Agricultural University, Zhengzhou, China
Introduction: The cyclical fluctuations characterized by drastic ups and downs in raw milk prices have long been one of the bottlenecks restricting the high-quality development of the Chinese dairy industry.
Methods: To clarify the formation rule of the cyclical fluctuations of raw milk prices in China, this study deeply analyzed the internal mechanism of the periodic fluctuations in raw milk prices from a microscopic perspective. Utilizing price index data from November 2007 to August 2024, we used a two-threshold mechanism transfer model to research the transformation mechanism and duration of the periodic fluctuations in raw milk prices.
Results and discussion: The findings indicated that raw milk price fluctuations exhibit nonlinear mechanism transformations at two critical thresholds: a price index of 107.74 (which reflects an approximate increase of 8% after adjusting for seasonal and pricing factors) and a change rate in the price index of 0.016 (approximately 0). A complete price fluctuation cycle of raw milk comprises four phases: the low-price uptrend phase, the high-price uptrend phase, the high-price downtrend phase, and the low-price downtrend phase. Among these phases, the duration of the upward phases is generally longer than that of the downward phases; the duration of the high-price uptrend phase and the low-price downtrend phase exceeds that of the low-price uptrend phase and the high-price downtrend phase, respectively. Hence, relevant policy suggestions are put forward from four main aspects: strengthening source governance, improving the regulatory mechanism, building an early warning system, and establishing a purchase and storage system.
1 Introduction
Raw milk is a strategic raw material in dairy production (Lu et al., 2025). Its price not only accurately reflects market supply, demand, and expectations but also directly represents production value and processing costs. Thus, the raw milk price plays a critical role in overall signal transmission, supply and demand guidance, and the safety and stability of the dairy industry chain (Yan et al., 2018). However, in recent years, price fluctuations in agricultural products have resembled a roller-coaster ride (Zhang et al., 2025). The cyclical issue of sharp volatility in raw milk prices has also become an urgent problem to be solved in the dairy industry (Acosta et al., 2014; Wang et al., 2023). By the end of December, the average price of raw milk in China's 10 main dairy producing provinces stood at 3.11 yuan/kg, marking a 15.03% decrease compared to the end of 2023. This also represents the third consecutive year of decline in raw milk prices. In 2024, the annual average price of raw milk was 3.32 yuan/kg, while the yearly average milk production cost at monitored dairy farms under the National Dairy Cattle Industry Technology System was 3.46 yuan/kg. The raw milk price has dipped below the cost of production, and even over 80% of dairy farms lose money (Li et al., 2025). In response to the current severe situation of dairy production, it is urgent to reveal the cyclical fluctuation rule of raw milk prices in China. By doing so, effective measures can be taken to prevent dairy farmers from dumping milk and even killing their cows due to falling milk prices, help dairy farms emerge from the predicament as soon as possible, and ensure the long-term stable, healthy, and sustainable development of the dairy industry.
Price fluctuations are a normal phenomenon reflecting the function of the price mechanism. However, due to the long production cycle of raw milk, the price mechanism has a certain lag. During the fluctuation process, prices are prone to periodic sharp ups and downs (Liu et al., 2019), which will frequently lead dairy farmers to dump milk, even kill their cows, and compete for raw milk. According to incomplete statistics, since 2003, China has experienced more than 10 such incidents (Yu et al., 2018). The cyclical fluctuations in raw milk prices have always hindered the healthy development of the dairy industry. Milk is regarded as one of the most volatile agricultural products in the international market (Acosta et al., 2014; Piotr et al., 2020). On the surface, international milk prices (Wang et al., 2023), feed prices (Burak et al., 2021), historical prices (Wang et al., 2020), per capita income (Svetlana and Sebastian, 2022), climate change (Arief et al., 2020), etc., are the key factors influencing the fluctuations of raw milk prices. These factors have significant positive or negative impacts on raw milk prices.
Essentially, the unreasonable benefit distribution, low production efficiency, and the stage characteristics of transformation and adjustment are the fundamental reasons for the sharp fluctuations in raw milk prices (Yu et al., 2018). They are also important factors restricting the further development of the Chinese dairy industry (Yu et al., 2023b). Under the “dairy farmers + dairy stations + dairy processing enterprises” production model, dairy processing enterprises capture 74.7% of revenue distribution, while dairy farmers receive only 9.1% of the benefits (Huan et al., 2020). It can be seen that dairy farmers seriously lack a say in the price formation mechanism of raw milk and have a relatively low status in the industrial chain. The purchase price guidance policy of raw milk can significantly improve the unfavorable situation and effectively promote the balanced distribution of profits among the main players in the dairy supply chain (Hu et al., 2021). In addition, product and quality differentiation in the dairy market will help dairy farmers achieve higher and more stable prices and then expand the profit margins of producers (Wang et al., 2024).
Based on the research perspective of periodic fluctuations in raw milk prices, scholars tend to extract sequences with certain changing trends from the time series data of raw milk prices to depict the fluctuation characteristics of raw milk prices. For instance, Chen et al. (2015) found that the price fluctuations of raw milk exhibit obvious periodicity, as identified through the Census X12 and H-P filtering methods; Liu and Liu (2017) further utilized the B-N decomposition method and discovered the cyclical fluctuations in raw milk prices, with an average cycle of 33 months. Some studies have found that the price fluctuations of raw milk are asymmetric. In other words, the impacts of raw milk price increases and declines differ. The price decline has a relatively large effect on raw milk prices (Kang et al., 2016), and the adjustment speed is also significantly faster (Acosta and Valdés, 2014). However, Wang et al. (2020) believe that after adding the control variables, there is no obvious asymmetry in the price fluctuations of China's raw milk.
Regarding the non-linear characteristics of raw milk price fluctuations, Miao and Xu (2023), using the STECM model, found that the price fluctuations of raw milk exhibit distinct regime-switching characteristics, and the transition speed between different regimes is 1.1924. To visually and flexibly capture the transformation of raw milk prices between different phases, Li and Luan (2017), based on a Markov regime-switching model, found that the fluctuation degree and duration of raw milk prices were different in the rapid rise phase, the steady growth phase, and the decline phase. Among them, the rapid rise phase > the steady growth phase > the decline phase. Yang et al. (2020) further used the MS-GAECH model to investigate the dual asymmetry of raw milk price fluctuations. They found that the raw milk price was more persistent under the state of sharp fluctuations, and the impact brought by “negative news” was greater than that of “positive news.” There is also a threshold effect in the fluctuations of raw milk prices. When the monthly feeding cost per cow is between 718.67 yuan and 917.91 yuan, and the imported raw milk price is between 20.28 and 24.55 yuan/kg, the raw milk price is in a normal operating state. Otherwise, it will fluctuate sharply (Hua et al., 2020).
Existing studies indicate that the price fluctuations of raw milk have obvious periodicity, and the degree and duration of raw milk price fluctuations are significantly different in various phases. However, few articles comprehensively depict the microscopic mechanism of the cyclical fluctuations in raw milk prices, as well as the timing and duration of transitions under different mechanisms. Compared with other methods for analyzing the periodic fluctuations of raw milk prices, the two-threshold mechanism transfer model can adapt to data changes by adjusting thresholds, capturing the dynamic evolution characteristics of the data. Therefore, it can provide a more intuitive economic explanation and higher flexibility and adaptability. For instance, Ou Yang and Li (2023) constructed the two-threshold panel model to analyze the non-linear spillover effect of the Federal Reserve's unexpected monetary policy on Chinese enterprises' R&D, and Hua (2013) studied the inflation persistence in the inflation cycle depicted by the two-threshold variable regime-switching. The application of methods in the literature provides important references for studying the periodic fluctuations of raw milk prices.
Therefore, the marginal contributions of this paper are as follows. The first is to reveal the formation mechanism of the periodic fluctuations in raw milk prices as the main research content, further expand the related research on the fluctuations in raw milk prices, and deepen the understanding of the periodic fluctuation rule of raw milk prices. The second is to depict the microscopic mechanism formed by the periodic fluctuations of raw milk prices under external shocks, based on the law of diminishing marginal returns, the dynamic game theory, and the price leadership model in microeconomics. The third is to use the two-threshold mechanism transfer model to measure the mechanism transformation and duration of the periodic fluctuations in raw milk prices, providing decision-making references for the government to formulate relevant price control policies.
2 Materials and methods
2.1 Theoretical analysis
2.1.1 The dynamic evolution characteristics of periodic fluctuations in raw milk prices
To accurately understand the cyclical fluctuation characteristics of raw milk prices, this paper first conducts CPI reduction on the raw milk price data from May 2006 to September 2024 (with May 2006 as the base = 100) to eliminate the influence of price factors. The result is shown in Figure 1A. Second, it utilizes the Census X12 seasonal adjustment method to separate the cycle and irregular fluctuations from the raw milk price data. The smoothed and cycle fluctuations are finally separated by using the H-P filtering method. The results are shown in Figures 1B–D. Irregular fluctuations refer to price fluctuations caused by occasional events, such as emergencies, animal diseases, epidemics, policy adjustments, and drought in major importing countries. For instance, Australia's severe drought in 2007, the Chinese melamine incident in 2008, the EU's abolition of the milk production quota system in 2015, and the COVID-19 pandemic in 2020, etc. It can be known from Figure 1B that the randomness of irregular fluctuations in raw milk prices is relatively strong. Moreover, during these periods, the random fluctuations in raw milk prices are relatively large.
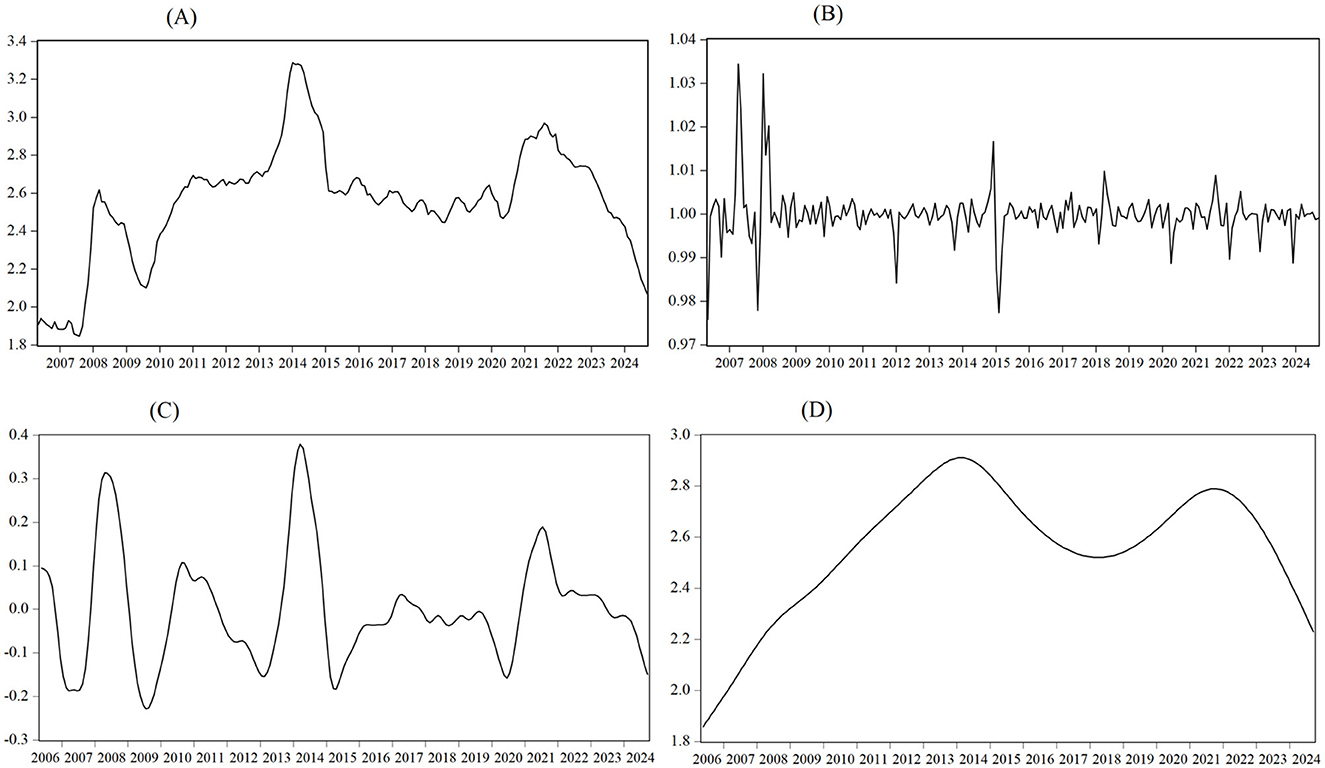
Figure 1. Trend of raw milk price changes. (A) Fluctuations of raw milk prices. (B) Irregular fluctuations of raw milk prices. (C) Cycle fluctuations of raw milk prices. (D) Smoothed fluctuation s of raw milk prices.
In Figure 1C, divided by “trough-to-trough,” the fluctuations of raw milk prices as a whole present five relatively obvious cycles. In addition, the fluctuation amplitude and duration of raw milk prices are different within diverse cycles. Among them, the fluctuation duration of the fourth cycle, from March 2015 to May 2020, was the longest, but the overall fluctuation amplitude was relatively small. It can be seen in Figure 1D that the price fluctuations of raw milk present a trend of “rise-fall-rise-fall,” with three obvious inflection points in February 2014, April 2018, and September 2021. That is, the fluctuations in raw milk prices have non-linear characteristics. Thus, it's essential to precisely capture the dynamic characteristics of raw milk price fluctuations and clarify their microscopic mechanisms at different stages to uncover the evolution pattern of these cyclical fluctuations.
2.1.2 Analysis of the microscopic mechanism of periodic fluctuations in raw milk prices
Given raw milk's perishability and non-storability at room temperature, upstream producers require relatively fixed sales channels to sell raw milk promptly. Downstream dairy processing enterprises also need a stable milk source to ensure an adequate supply of dairy products. As a result, almost all raw milk producers and dairy processing enterprises sign purchase-sale contracts to regulate transactions and foster long-term and stable partnerships. When the expected income is fixed, high prices will increase consumers' input costs and reduce consumer surplus. Therefore, regardless of other external conditions, the sales volume of goods is closely related to the selling price. That is to say, there is a direct relationship between consumer behavior and dairy prices (Li et al., 2023). Considering the oligopoly market structure of the Chinese dairy industry (Yu et al., 2023a), to conveniently analyze the periodic fluctuations of raw milk prices, we assume that there are two dairy processing enterprises, A and B, in a specific area's dairy market. They respectively, have their customers. What's more, all raw milk they purchase can be promptly converted into homogeneous products for sale, meaning purchase volume equals sales volume.
When the milk source is scarce in the upstream production process, dairy processing enterprises i(i = A, B) are in a passive position. Only by raising the purchase price pi, can the purchase volume qi be increased. At this time, the function of the raw milk purchase volume is:
In Equation 1, where ai is the basal raw milk purchase volume of the enterprise i, bi is the influence coefficient of the purchase price on the purchase volume.
In the downstream consumer market, due to the unchanged consumer demand in the short term, dairy processing enterprises can set the market price when raw milk is in short supply. Only when the selling price of dairy products rises to ensure a certain profit margin, will processing enterprises be willing to purchase more raw milk. Considering that the dairy products sold by Enterprise A and Enterprise B are homogeneous, we assume that the selling prices of the two enterprises are the same. If PS is the selling price of dairy products, the function of the sales volume is:
When the milk source is abundant in the upstream production process, processing enterprises i(i = A, B) hold the initiative. Only when the purchase price pi drops, will they be willing to increase the purchase volume qi. At this time, the function of the raw milk purchase volume is:
In Equation 3, where ki represents the potential maximum raw milk purchase volume of the enterprise i, ri is the influence coefficient of the purchase price on the purchase volume.
In the downstream consumer market, because of the abundant supply of raw milk, dairy processing enterprises will use price competition to grab a larger market share. At this time, the function of dairy product sales volume is:
In Equations 2, 4, σ and φ, respectively, represent the potential maximum sales volume of raw milk in the market during periods of scarce and abundant milk sources, β and δ are the influence coefficients of the sales price on the sales volume in the corresponding periods. The total purchase volume of raw milk in the market can be expressed as Equation 5:
Generally, when domestic and international dairy production or trade encounters major external shocks, such as animal disease, drought, and trade friction, there will be an imbalance between supply and demand in the domestic dairy market. This will result in short-term price fluctuations and long-term cyclical fluctuations. The raw milk price will go through the fluctuation process as shown in Figure 2. There are four phases: slow increase, rapid increase, rapid decrease, and slow decrease. The microscopic mechanism analysis of price formation is as follows:
1. The phase of the slow price increase. Suppose that during a certain period, dairy farming or imported raw milk powder is adversely affected by external shocks. As a consequence, there is a shortage of raw milk supply in the domestic market. To maintain the normal supply, dairy processing enterprises need to ensure that the total amount of purchased raw milk remains unchanged. According to the market supply theory, Enterprise A and Enterprise B will increase qA and qB by raising pA and pB, respectively. The rise of pA and pB will also stimulate dairy farmers to increase the input of production factors to increase output and marginal revenue in a short period. At this point, the extent to which the increase in raw milk prices depends on the degree to which the supply curve of raw milk shifts to the left due to external shocks. That is the distance from S0 to S1 in Figure 2A. Due to contractual constraints, when farmers change from cooperating with Enterprise A to cooperating with Enterprise B or from cooperating with Enterprise B to cooperating with Enterprise A, there is a penalty cost. When the difference between purchase prices of processing enterprises is not sufficient to cover default costs, farmers, as rational economic agents, will not choose to default and turn to enterprises with slightly higher purchase prices for raw milk. At this stage, there is no price competition between the two enterprises. Raw milk prices generally show a slow upward trend, as shown in Figure 2A's stage I.
2. The phase of the rapid price increase. The production function of dairy cows has a stage of diminishing marginal output, so there is a limit to the effect of processing enterprises to increase the output of dairy farmers through price incentives. With the further reduction of the total market supply, Enterprise A and Enterprise B can only rely on price competition to increase the purchase volume of raw milk. That is to say, they will try to grab more milk from their competitors by raising the price more steeply. In the raw milk market, dairy farmers are restricted by contractual costs. Only Enterprise A sets the purchase price for raw milk in the period t as:
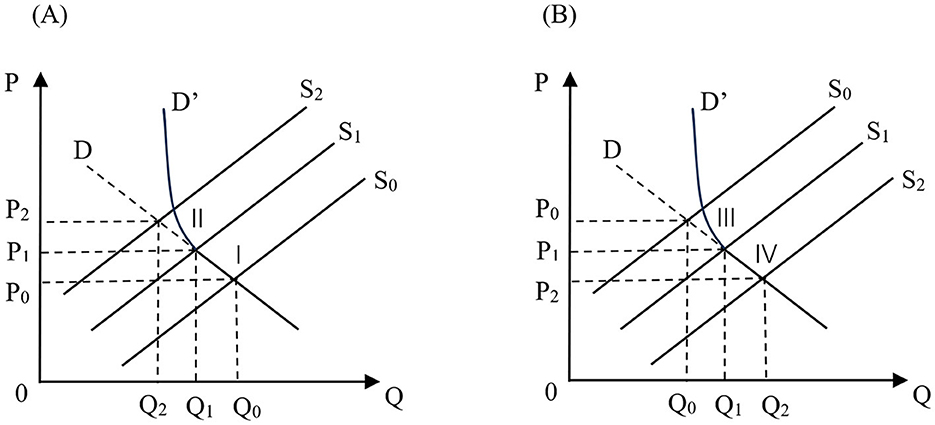
Figure 2. Raw milk price rise and decline phases. (A) Raw milk price rise phase. (B) Raw milk price decline phase.
Farmers who cooperate with Enterprise B will be willing to breach the contract and switch to cooperating with Enterprise A. And then Enterprise A will be able to increase the purchase volume of raw milk. Enterprise A will not stop raising the price until the marginal profit is 0. In Equation 6, cdB represents the conversion cost per unit product of the cooperative farmers with Enterprise B, pBt−1 is the purchase price of raw milk for Enterprise B in the period t − 1, and cmA means the constant marginal production cost of Enterprise A. Similarly, if farmers who cooperate with Enterprise A switch to cooperate with Enterprise B, the purchase price of raw milk by Enterprise B in the period t also needs to be:
In Equation 7, where cdA is the conversion cost per unit product of the cooperative farmers with Enterprise A, pAt−1 represents the purchase price of raw milk for Enterprise A in the period t − 1, and cmB denotes the constant marginal production cost of Enterprise B. As time goes by, the price decision-making processes of Enterprise A and Enterprise B have formed a dynamic game and will further cycle the above process.
As the dairy processing industry is a resource-constrained sector, “whoever holds the milk source will own the market.” When one enterprise detects changes in the market situation, it is bound to make strategic adjustments first, and then other enterprises will follow suit. Suppose Enterprise A is in a dominant position or acts as a leader and takes the lead in setting the price. Enterprise B is in a subordinate position or acts as a follower and makes the decision after the leader sets the price. Next, we use backward induction to analyze the formation process of the final price.
Suppose the final purchase price of raw milk set by the leader enterprise A is pA, then the follower enterprise B will choose to set the price as pB. At this point, if followers want to maximize profits, they need to meet the following requirement (Equation 8):
According to the condition “the purchase volume equals the sales volume,” we can obtain “Q = QS.” Then, the selling price of raw milk can be expressed as Equation 9:
Plugging Equation 9 into Equation 8, the optimal purchase price for the follower enterprise B to maximize profits can be obtained (Equation 10):
Under the price pA set by the leading enterprise A, the profit can be achieved (Equation 11):
By differentiating Equation 11, the optimal purchase price for maximizing the profit of the leading enterprise A can be known (Equation 12):
Substituting Equation 12 into Equation 10, the optimal purchase price of the follower enterprise B can be obtained (Equation 13):
Putting and in Equation 1, the optimal purchase quantities of Enterprise A and Enterprise B can be known, respectively (Equations 14, 15):
Since any unilateral price adjustment by Enterprise A will trigger the same response from Enterprise B, this makes the price adjustment strategy unable to bring additional profits to Enterprise A. The same applies to Enterprise B. Only when both Enterprise A and Enterprise B simultaneously meet the condition that “their price strategies are the optimal responses to each other's strategies” will a stable strategy combination be formed in the market. Otherwise, any deviation from the equilibrium will be offset by the other party's strategy, failing to achieve profit improvement. The same applies to the phase of rapid price decline. Therefore, under respective optimal purchase prices and quantities, Enterprise A and Enterprise B ultimately maximize their profits and are in a Nash equilibrium state. Analogy to the entire monopolistic competition market, the final market price of raw milk is the weighted average of the optimal purchase prices of all dairy processing enterprises in the regional market. During this process, raw milk prices show a rapid upward trend, as shown in Figure 2A's stage II. High profits will prompt the dairy industry to make additional investments and expand the number of dairy cows to increase the production capacity of raw milk. Once one farm starts to expand its inventory, more farms will follow suit. The herd behavior will lead to a serious oversupply after the release of production capacity in the later stage, thus causing a sharp drop in the price of raw milk.
3. The phase of the rapid price decline. The supply elasticity of raw milk production is much greater than the demand elasticity (Zhou et al., 2008). Hence, when the production capacity is released in the late stage and the supply gap is filled, an oversupply of raw milk will start to occur in the market. After capturing the market signal, dairy processing enterprises will immediately choose to lower the purchase price of raw milk. And as long as the purchase price of Enterprise A in the period t is lower than that of Enterprise B in the period t − 1, and the price gap does not exceed the default cost per unit product of Enterprise A (Equation 16):
Enterprise A will continuously lower the purchase price based on the previous price of Enterprise B to maximize its profits until the marginal benefit of dairy farmers is lower than the marginal cost. Processing enterprises are the price setters, while dairy farmers are the price takers (Can and Engindeniz, 2025; Liu et al., 2023). Thus, processing enterprises can adopt a price reduction strategy to guarantee their profits.
Enterprise B is also the same. As long as the purchase price of Enterprise B in the period t is lower than that of Enterprise A in the period t − 1, and the price gap does not exceed the default cost per unit product of Enterprise B (Equation 17):
Based on the previous price of Enterprise A, Enterprise B will continuously reduce the purchase price of raw milk until the maximum profit is achieved. This phase still belongs to the process of the dynamic game, and the formation process of the final price is analyzed using backward induction. If the leader enterprise A eventually sets the price at pA, the follower enterprise B will choose to set the price at pB. At this point, if follower Enterprise B wants to maximize profits, it needs to meet the following requirement (Equation 18):
Based on the condition “Q = QS,” the selling price of raw milk can be deduced as Equation 19:
Carrying Equation 19 to Equation 18, the optimal purchase price for the follower enterprise B to maximize profits can be obtained (Equation 20):
For the leader enterprise A, at the purchase price pA it has set, the profit can be obtained (Equation 21):
By differentiating Equation 21, the optimal purchase price for maximizing the profit of Enterprise A can be determined (Equation 22):
Substituting Equation 22 into Equation 20, the optimal purchase price of the follower enterprise B can be known (Equation 23):
Putting and in Equation 3, the optimal purchase quantities of Enterprise A and Enterprise B can be obtained, respectively (Equations 24, 25):
Ultimately, under respective optimal purchase prices and quantities, Enterprise A and Enterprise B achieve maximum profits and are in a Nash equilibrium state. By analogy, in the entire monopolistic competition market, the final market price of raw milk is also the weighted average of the optimal purchase prices of all dairy processing enterprises in the regional market. The rapid decline trend of raw milk prices is shown in Figure 2B's phase III. This phase will lead to a sharp decline in the profits of the dairy farming industry, and poorly managed enterprises will start to enter a loss-making state.
4. The phase of the slow price decline. When the actual purchase volume of raw milk exceeds the optimal purchase volume, the processing enterprise will stop purchasing raw milk. However, as processing enterprises are also bound by contracts, they cannot easily refuse to accept raw milk from dairy farmers. Considering the long-term cooperation and interest, processing enterprises will try their best to purchase the milk sources of cooperative farmers and address surplus through some measures, like price-off promotions and producing milk powder for storage. Subsequently, based on the competitive and self-digestion situation, the purchase price should be further adjusted. When the digestion cost of excessive raw milk increases or processing enterprises need to participate in market competition through discounted sales, they may further lower the purchase price to maintain or increase the market share. From the overall market performance, raw milk prices show a slow downward trend, as seen in phase IV of Figure 2B. At this point, the continuing slump in raw milk prices will lead to large-scale losses in the dairy farming industry. Even some dairy farmers have begun to dump milk and kill their cows. This phase will not end until the government intervenes or new shocks occur. The formation mechanism of raw milk prices at different phases is shown in Figure 3.
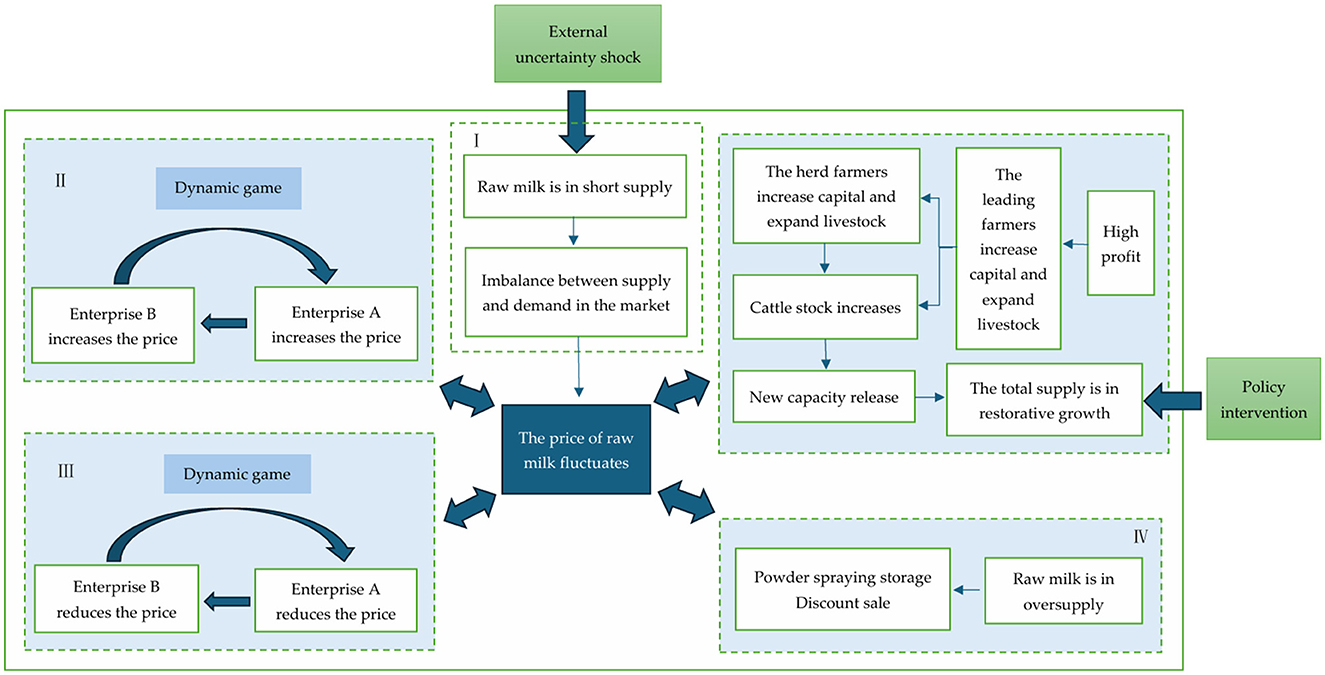
Figure 3. The formation mechanism of raw milk price fluctuations.
2.2 Data sources and processing
To accurately depict the cyclical fluctuation characteristics of raw milk prices, this paper uses the year-on-year price index of raw milk to measure the changes. Given the availability and completeness of the data, the sample period is selected from November 2007 to August 2024. A total of 202 samples were collected. The data is derived from the average price of raw milk in 10 main dairy producing provinces, namely Hebei, Shanxi, Inner Mongolia, Liaoning, Heilongjiang, Shandong, Henan, Shaanxi, Ningxia, and Xinjiang. It is fixedly monitored by the Ministry of Agriculture and Rural Affairs of China. In addition, we make use of Census X12 seasonal adjustment and CPI deflator to eliminate the effects of seasonal and price factors.
2.3 Model setting
On the premise of stable data, referring to the research method of Taylor (2000), the duration of price fluctuations is calculated based on the estimation results of the autoregressive coefficient of raw milk price changes. Its basic expression is:
In Equation 26, where α0 is the constant term, is the autoregressive coefficient, ut is the random errorterm, is a lag operator polynomial. Among them, A(1) = α1 + α2 + ... + αq. The larger A(1) is, the stronger the duration of fluctuations in raw milk prices will be. From the perspective of econometrics, the duration of price fluctuations refers to the length of time over which the dynamic response of prices to external shocks persists. During periods of high and low raw milk prices, and at different stages of upward and downward prices, the duration of fluctuations in raw milk prices may vary significantly. Neither directly using the Equation 26 nor making simple improvements to it can accurately describe the dynamic change characteristics of the duration of fluctuations in raw milk prices.
To accurately describe the periodic fluctuation characteristics of raw milk prices, this paper takes Pt−d as one threshold variable, representing the raw milk prices' lagging t−d periods. Among them, d is the positional parameter to be estimated, which is used to reflect the mechanism transformation of the price change in raw milk under different price fluctuation levels. Furthermore, we define the rate of change in raw milk prices as ΔPt−d = (Pt−d − Pt−d−1)/Pt−d−1. If ΔPt−d > 0 indicates that the price fluctuation is in the upward range; if ΔPt−d < 0 indicates that the price fluctuation is in the downward range; and the larger |ΔPt−d| is, the faster the price rises or falls. Taking ΔPt−d as the other threshold variable can reflect the mechanism transformation of the price change in raw milk during the upward or downward price stage. Therefore, in this paper, by constructing a two-threshold mechanism transfer model, it is depicted that the duration of raw milk price fluctuations undergoes a non-linear transformation with the joint changes of the raw milk price level and the direction of price adjustment. The specific formula is as follows:
In Equation 27, where γ1 and γ2 are the thresholds depicting the timing of the mechanism transformation. The definitions of the remaining variables are the same as before. Specifically, when the price fluctuation Pt−d of raw milk is less than γ1 and the price change rate ΔPt−d is greater than or equal to γ2, this is called mechanism I, and the duration of price fluctuations is measured by the estimated . When the price fluctuation and change rate are, respectively, greater than or equal to the thresholds (γ1, γ2), it is called mechanism II, and the duration of price fluctuations is measured by estimated . When the price fluctuation is greater than or equal to γ1 and the price change rate is less than γ2, it is called mechanism III, and the duration of price fluctuations is measured by the estimated . When the price fluctuation and the rate of price change are, respectively, less than the thresholds (γ1, γ2), it is called mechanism IV, and the duration of price fluctuations is measured by estimated . The different values of reflect the changes in the inertia of price fluctuations under different mechanisms.
2.4 Model estimation and test methods
2.4.1 Estimation method
Chen et al. (2012) systematically expounded the estimation and test method of this model. Let T represent the sample size, q = max(q(1), q(2), q(3), q(4)), , k > q(j)(j = 1, 2, 3, 4). Further, we define the regression coefficient , γ = (γ1, γ2), e = (Pt−d, ΔPt−d). ϕt(γ) is the indicator function, where , , , . Therefore, Equation 27 can be expressed as Equation 28:
Where Xt = (1, Pt−1, Pt−2, ..., Pt−q), , . Because Equation 28 is a non-linear model, under the condition that the parameter (γ, d) is unknown, the estimation of the regression coefficient α(j) cannot be directly obtained. Therefore, assuming that (γ, d) is known, by applying the conditional least squares method to Equation 28, we can obtain Equation 29:
The (γ, d) that minimizes RSS is the to be estimated:
In Equation 30, where RSS(γ, d) represents the sum of squared residuals. The corresponding to is the consistent estimation result of the regression coefficient of the Equation 30.
2.4.2 Test method
Before estimating the Equation 27, it is necessary to first test whether non-linearity exists and the number of mechanisms it contains. This paper refers to the method of Bootstrap for calculating empirical p-values based on F-type statistics proposed by Hansen (1999). The specific steps are as follows:
(1) Set the null hypothesis H0: There is no non-linear relationship; the alternative hypothesis H1: There is a non-linear relationship. Under the condition that the null hypothesis holds, we calculate the sum of squared residuals RSS0 of the linear model. Meanwhile, we also calculate the sum of squared residuals RSS1 under the alternative assumption. Then the true test statistic F0 is calculated (Equation 31):
(2) Repeat process (1) N times using retracted sampling to obtain N F-statistics.
(3) Calculate the empirical p-value:
In Equation 32, where N represents the number of sampling times and is 10,000 (the same as below); n(F > F0) indicates the number of values greater than F0 among N F-values. If the p-value is significant, the null hypothesis is rejected and the alternative hypothesis is accepted. This means that Equation 27 is a non-linear multi-mechanism model. Otherwise, Equation 27 degenerates into a single-mechanism linear model.
If there is a non-linear threshold mechanism transformation in the Equation 27, the number of mechanisms it contains is subsequently examined. The test of three mechanisms against four mechanisms is first realized. Set a null hypothesis that contains three mechanisms: For any α(l) and α(j), there is a certain set of α(l) = α(j), l ≠ j, l, j = 1, 2, 3, 4; an alternative hypothesis containing four mechanisms: For any α(l) and α(j), α(l) ≠ α(j). The test statistics and calculation process of the mechanism quantity are similar to the above-mentioned non-linear test. So there is no need to elaborate further here.
If the null hypothesis is rejected, it indicates that there are four mechanisms in the Equation 27. If not, the Equation 27 has three mechanisms or two mechanisms, and the test of two mechanisms against three mechanisms should continue. Set the null hypothesis : Three of α(j)(j = 1, 2, 3, 4) are equal, that is, the model has two mechanisms; : The model contains three mechanisms. At this point, there are three different combinations of the null hypothesis , and hypothesis tests need to be conducted on each of the three different combinations, respectively. If three sets of null hypotheses in are all rejected, Equation 27 contains three mechanisms. Or else, Equation 27 contains two mechanisms. The specific steps are the same as above.
To sum up, the estimation and test steps of the Equation 27 implemented in this paper are as follows: Firstly, sequential tests are conducted on H0, | (H0 was established), and | (H0 and hold) respectively; secondly, based on the test results, the number of mechanisms contained in Equation 27 is determined; thirdly, the model is estimated according to Equation 29.
3 Results
3.1 Model estimation and test results
The estimation and test methods of Equation 27 proposed by Chen et al. (2012) require that the data be stable. Firstly, the stability of the raw milk price index is judged by using the unit root test. The test results of both PP and KPSS indicate that, for the test type of (c, 0, 0), the raw milk price index passed the significance test. This suggests that the data is a stationary time series.
Secondly, we need to determine the value range of the position parameter d and the threshold parameter γ. Considering the small sample size in this paper, the range of the positional parameter d is set from −3 to 3. To accurately depict the non-linear characteristics of the price changes in raw milk, the value range of the threshold parameter must be within the sample range. If the value range of the threshold parameter is on the outside or boundary of the sample, the non-linear characteristics cannot be reasonably characterized (Ou Yang and Li, 2023). Referring to the practice of Hua (2013), Pt−d and ΔPt−d within the sample periods are arranged in ascending order. The sample points corresponding to the 15% and 85% positions, respectively, are selected as the possible value intervals of γ1 and γ2. As a result, the value range of γ1 is (90.047, 115.221) and γ2 is (-0.018, 0.017).
Finally, based on the test method described earlier, a non-linear test is conducted on the Equation 27, with the null hypothesis H0: α(1) = α(2) = α(3) = α(4). Since there are various forms of alternative assumptions, here we choose H1: α(1) ≠ α(2) = α(3) = α(4). According to the test method introduced in the previous text, 10,000 times repeated sampling is conducted, and then p=0.008 is obtained. This indicates that at the significance level of 1%, the null hypothesis is rejected and the alternative hypothesis is accepted. Raw milk prices will undergo a non-linear transformation mechanism with the change of the threshold. Next, the number of mechanisms contained in the model is examined. The specific test results are shown in Table 1.
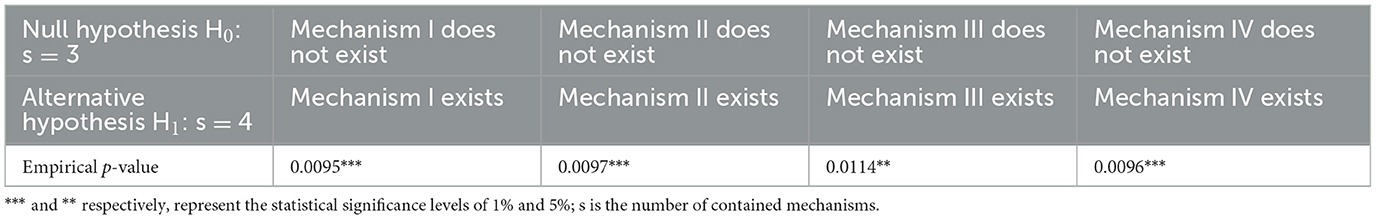
Table 1. Test results of three mechanisms against four mechanisms.
As shown in Table 1, the p-values of the null hypotheses “Mechanism I does not exist,” “Mechanism II does not exist,” and “Mechanism IV does not exist” are significant at the 1% level, while the p-value of the null hypothesis “Mechanism III does not exist” is significant at the 5% level, indicating that all null hypotheses have been rejected. Since the non-linear effect has been confirmed previously, it can be determined without further verification that the duration of fluctuations in raw milk prices involves four mechanisms, namely Mechanism I, Mechanism II, Mechanism III, and Mechanism IV. This is consistent with the results of the theoretical analysis. To sum up, the duration of fluctuations in raw milk prices during the sample period is characterized by four different mechanisms, respectively, which once again proves that the two-threshold mechanism transfer model is suitable for studying the fluctuation of raw milk prices.
3.2 Analysis of estimation results
Based on the threshold parameter search interval set in the previous text, the model is estimated by the non-linear conditional least squares method at each lattice point of the search interval. The estimation result with the smallest sum of squared residuals is the estimation result of the Equation 27. The estimation results of the threshold parameters and the duration of raw milk price fluctuations under four different mechanisms based on the threshold parameters are shown in Table 2.
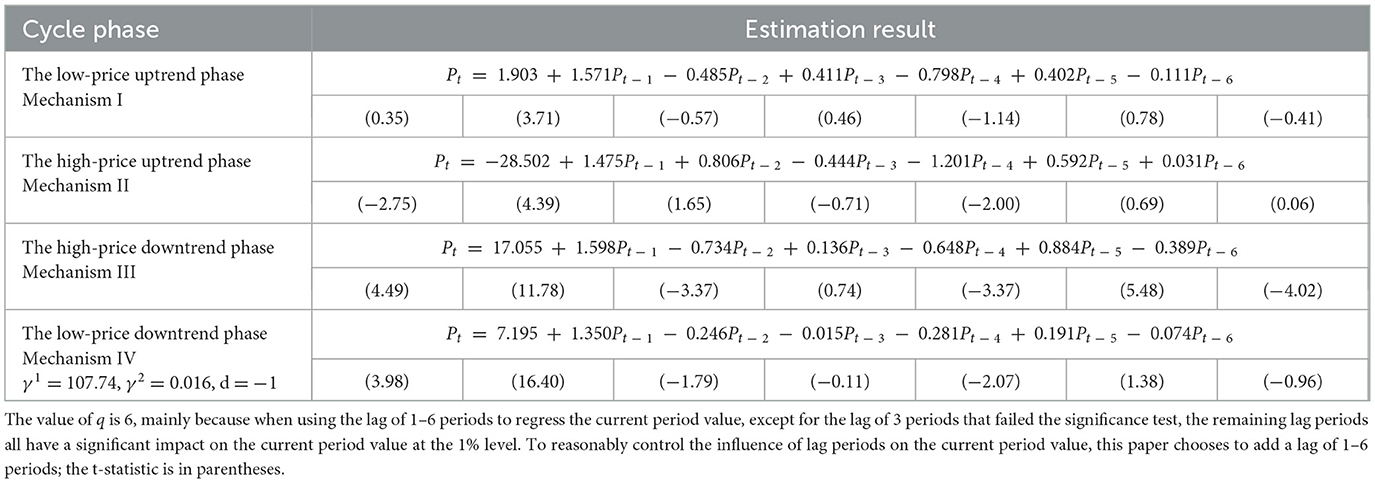
Table 2. Estimation results of the mechanism transformation for the duration of raw milk price fluctuations.
The threshold parameters γ1 = 107.74 and γ2 = 0.016 estimated for Equation 27 indicate that the periodic fluctuations of raw milk prices undergo a non-linear mechanism transformation on both sides of the price index of 107.74 (with a price increase of approximately 8%) and the change rate of 0.016 (approximately equal to 0). This also means that the price index level of 107.74 is the dividing point for the conversion of raw milk prices from low to high, and the price index change rate of 0.016 (approximately equal to 0) is the sign of the upward and downward movement of raw milk prices. Together, they depict the impact of external shocks on raw milk prices. For instance, affected by the drought in New Zealand, the domestic raw milk price index saw a significant increase in 2013. A mechanism change occurred in August 2013, and the raw milk price continued to rise, reaching the highest point of 4.25 yuan/kg in February 2014. The high price drive prompted existing breeding enterprises and farmers to increase capital investment and accelerate the expansion of their livestock. The domestic market has an abundant supply of raw milk, while on the international market, the EU has begun to lift the milk production quota system, leading to global overcapacity. Coupled with the impact of the Ukraine crisis, the demand for milk sources has decreased, causing a significant drop in international milk prices. Driven by the dual forces of capacity release and import shock, the price index of raw milk dropped rapidly. In August 2014, a mechanism shift occurred again. The continuous decline in prices led to the large-scale dumping of milk in various regions at the end of the year. In March 2015, it dropped to the lowest point in history and then entered the next cycle.
Based on the above, the fluctuation cycle of raw milk prices can be divided according to the price index level of 107.74 and the change rate of the price index of 0.016 (Figure 4). For instance, from November 2007 to June 2009, from July 2009 to January 2012, from February 2012 to March 2015, and from April 2015 to August 2024. A complete cycle of raw milk price fluctuations consists of four phases, which are the low-price uptrend phase, the high-price uptrend phase, the high-price downtrend phase, and the low-price downtrend phase. They respectively, correspond to the phases of the slow price increase, the rapid price increase, the rapid price decline, and the slow price decline in theoretical analysis. According to the estimation results in Table 2, the fluctuation duration of raw milk prices in the four phases is 0.99, 1.259, 0.847, and 0.925, indicating that the fluctuations of raw milk prices have a high duration in different cycle phases. That is to say, whether raw milk prices rise or fall, once the fluctuation trend is formed, it is difficult to reverse and shows strong stability and sustainability. This reflects the imbalance in the market supply and demand relationship. It also means that policymakers and market participants should closely monitor the changing trend of raw milk prices and take effective measures promptly to curb the formation of negative effects, so as to protect the overall healthy development of the dairy industry.
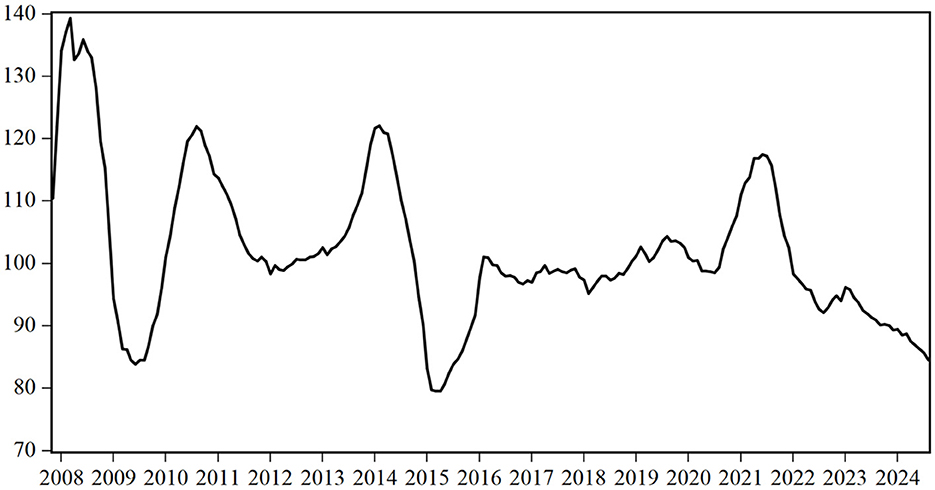
Figure 4. Changing trend of raw milk price index.
Careful comparison also reveals that the duration of the upward phase is significantly higher than that of the downward phase. This is mainly because the production cycle of raw milk is relatively long, and it is difficult for the supply of raw milk to increase significantly in the short term. However, there are fewer restrictions on reducing the supply of raw milk. Under the condition that the overall demand remains stable, the state of insufficient supply takes effect more quickly. Moreover, the duration of the high-price uptrend phase is higher than that of the low-price uptrend phase. This is mainly because, during the low-price uptrend phase, dairy farmers are less likely to breach contracts due to penalty costs. Dairy enterprises appropriately increase the purchase price to stimulate dairy farmers to increase investment and boost output. When this part of the newly added production cannot effectively make up for the supply gap, dairy enterprises will further use price competition to compete for the limited milk sources. As the release of new production capacity takes some time, the duration of the high-price uptrend phase will also be relatively long. Compared with the high-price downtrend phase, the low-price downtrend phase is more persistent. A possible explanation for this is that as the production capacity in the lag period is gradually released, the supply of raw milk in the market is sufficient. Dairy enterprises turn from the disadvantaged party to the advantaged party and adopt a continuous price reduction strategy until they maximize their profits. When the optimal purchase volume is exceeded, considering the long-term cooperation and interest, dairy enterprises will try their best to purchase the milk sources of cooperative farmers. They will lower the price when the cost of digestion increases or when it is necessary to reduce the price for promotion to participate in market competition until the government intervenes in regulation or new shocks occur. Otherwise, the market will remain in the stage of low prices for a relatively long time.
3.3 Further discussion and analysis
From the above analysis, it can be known that the cyclical fluctuations of raw milk prices are mainly attributed to the following aspects.
The first is triggered by external shocks. Due to the differences in resource endowments at home and abroad, the raw milk price is much lower than that in China. Even the price gap is sufficient to cover the transportation cost of converting imported dairy products into raw milk, premium, and freight (Bai et al., 2022). Coupled with the large domestic demand for dairy products and consumers' preferences, China has become a major destination for global dairy product exports (Xue et al., 2021). This has led to the Chinese dairy industry being affected not only by domestic factors such as animal diseases and production costs but also by uncertainties such as animal disease and drought in importing countries. Therefore, no processing enterprise can rely solely on a single supply channel. Instead, it should establish a multi-channel supply system to guard against the impact of external uncertainties and risks.
The second is the failure of the current price formation mechanism. Some regions have established a price formation mechanism where the government provides guidance, the dairy association takes the lead, and the main players in the industrial chain participate. For instance, Shandong, Inner Mongolia, Jilin, and other regions have established coordination committees for raw milk prices. However, this mechanism only plays an important role in price fluctuations caused by changes in production costs. When the market supply is severely short or excessive, the mechanism will still fail and malfunction. By now, the government needs to take compulsory measures to protect the market interests of the main bodies in the industrial chain.
The third is not to control the newly added production capacity promptly. When consumption in the dairy market is relatively stable, the “seesaw effect” between production capacity and raw milk price brings about periodic fluctuations. Timely control of short-term price fluctuations can achieve long-term capacity stability, which can keep the price fluctuations within a reasonable range. In addition, while giving full play to the fundamental role of the market mechanism, it is also necessary to rely on guiding plans to avoid possible negative externalities.
4 Conclusion
4.1 Main conclusion
This paper analyzed the microscopic formation mechanism of the periodic fluctuations in raw milk prices under external shocks and utilized the two-threshold mechanism transfer model to measure the mechanism transformation and duration of the periodic fluctuations in raw milk prices from November 2007 to August 2024, revealing the internal mechanism of the periodic fluctuations in raw milk prices at different phases. The research results show that: First, the fluctuation duration of raw milk prices undergoes a non-linear mechanism transformation along with the combined changes in the raw milk price level and the price change rate. The transformation timing occurs on both sides of the raw milk price index being 107.74 (i.e., the price increase of approximately 8%) and the price index change rate being 0.016 (approximately 0). Based on two threshold points, raw milk prices within the sample period can be divided into four cycles. Secondly, a complete fluctuation cycle of raw milk prices consists of the low-price uptrend phase, the high-price uptrend phase, the high-price downtrend phase, and the low-price downtrend phase. The duration of the four phases' fluctuations is 0.99, 1.259, 0.847, and 0.925, respectively. Among them, the duration of the upward phase is generally higher than that of the downward phase. The duration of the high-price uptrend phase and the low-price downtrend phase is, respectively, higher than that of the low-price uptrend phase and the high-price downtrend phase.
4.2 Policy suggestion
Based on the research conclusions, this paper deems that stabilizing the cyclical fluctuations in raw milk prices should adhere to the following principles: vertically collaborative prevention to avoid the impact of significant external uncertainties; improving the governance mechanism and building a vertical community of interests; predicting and warning accurately and adjusting production capacity promptly by combining short-term and long-term approaches; establish a purchase and storage system to ensure reasonable fluctuations in raw milk prices.
Firstly, strengthen the source governance that triggers cyclical fluctuations, establish a multichannel supply system mainly based on self-supply, and prevent the impact of major external uncertainties. First, dairy cattle breeding enterprises and farmers should attach great importance to the construction of the animal disease prevention and control system, continuously improve the biosecurity prevention and control system of the breeding farms, effectively prevent the impact of epidemic risks, and ensure long-term and stable returns. Second, on the one hand, dairy processing enterprises should strengthen cooperation with large-scale breeding groups and farmers and actively assume the social responsibilities that the industrial chain leaders should fulfill. Meanwhile, they are encouraged to proactively provide technical support, such as dairy cow breeding, disease prevention and control, and digital management with breeding enterprises and farmers. By doing so, cooperative relationships in the upstream and downstream industrial chain are stably established. On the other hand, it is necessary to establish a long-term perspective, balance the interests of the whole, and reduce the reliance on imported raw milk powder. Rationally arrange the product structure, strictly implement the national standards for sterilized milk, and use imported raw milk powder as auxiliary material to effectively regulate the seasonal differences in dairy product consumption. We should utilize a reasonable main and auxiliary proportion structure to cope with the supply shock brought by internal and external uncertainties.
Secondly, improve the industrial organization system and price formation mechanism, build a dairy industry community with reasonable vertical industrial chain benefit distribution, and avoid the occurrence of extreme phenomena as much as possible. The first is to enhance the organization and integration of raw milk production. On the one hand, we should encourage large-scale milk farmers to establish dairy production cooperatives or dairy farmers' associations, so as to enhance the market position of farmers and their say in the price formation mechanism. On the other hand, through the equity-for-equity approach, processing enterprises become shareholders of large-scale breeding farms, and breeding farm owners become shareholders of processing enterprises, truly forming a community of shared interests. The second is to improve the price negotiation system for raw milk. The dairy industry association invites large dairy enterprises, feed processing enterprises, forage planting enterprises, dairy farmers' associations, third-party institutions for raw milk quality inspection, and other member units to participate in the negotiation of raw milk prices. Besides, law firms will be invited to join fully, demonstrating the fairness and impartiality of the negotiation work. At the same time, by taking advantage of the threshold points of price fluctuations and seizing the window period of sharp price fluctuations, the monitoring data and calculated prices are used as references. Price adjustment consultation meetings are held promptly to analyze the situation, reach a consensus, and promptly offer suggestions to governments at all levels to obtain policy support. Third, it is necessary to encourage family ranches or cooperatives with the necessary conditions to develop an integrated manner of production, processing, and sales. Effectively enhance the synergy between the upstream and downstream of the industrial chain, and give full play to the timely regulatory role of the market mechanism on the production capacity of raw milk. Moreover, we need to improve the adaptability and risk resistance of the dairy cow breeding link in the face of external shocks, prevent the sharp fluctuations of raw milk prices, and keep the price fluctuations within a reasonable range.
Thirdly, build a large model for predicting and early warning of raw milk prices and utilize the transformation characteristics of raw milk price fluctuations to regulate market supply and demand in a timely and scientific manner. The first is to use the mechanism transformation law of price evolution to monitor and provide information in time for price intervention. Based on the existing regulatory mechanisms, we can utilize digital technologies such as big data, artificial intelligence, and cloud computing, as well as information from existing dairy industry monitoring points, including supply-side monitoring data, demand-side market sampling survey data, and milk powder import and export data. In addition, we need to organize experts in production management, breeding and reproduction, disease prevention and control, and economic analysis within the dairy industry. Jointly develop a large AI model for predicting and early warning of raw milk prices, which can predict the production operation status and raw milk price trends in various regions in real time, conduct price negotiations promptly, and formulate response plans in advance. Second, effectively implement the record and review system for new production capacity of large-scale breeding enterprises to strictly control the excessive expansion. At the national level, utilize relatively complete monitoring information and the overall supply and demand situation of the market to formulate and announce industrial development plans, guiding the supply and demand regulation of the regional dairy industry. At the same time, divide responsibilities from top to bottom, and implement a record and review system for capacity expansion at different levels to form a healthy development model where industrial development is coordinated with demand growth. We should resolutely control the disorderly expansion of production capacity, prevent the situation where small and medium-sized milk farmers are squeezed out by taking advantage of capital superiority, and stabilize the complementary and harmonious coexistence situation between large-scale farmers' breeding and large enterprises.
Fourthly, establish a milk powder purchase and storage system featuring state entrustment, enterprise storage, on-demand allocation, and appropriate subsidies. Stabilize the basic production capacity by regulating market supply and demand to ensure reasonable fluctuations in raw milk prices. During the stage of raw milk surplus and price decline, the government will purchase the surplus raw milk by powder injection and set a minimum protective price for the purchased milk powder. When the market price is lower than the protective price, enterprises will purchase it at the protective price, and the subsidy fund will bear the price difference. During the stage of raw milk shortage and price increase, the government will appropriately release some reserve milk powder and sell it at market prices. The profits will be partially returned to the fund or used for expanded reproduction, thus forming a closed loop. The stored milk powder can also be specifically used for public welfare projects, such as donating to border defense soldiers and students in poverty-stricken areas, which can not only reduce inventory costs but also enhance social benefits. In addition, adjust the subsidy distribution model for powder spraying, establish a linkage mechanism between the subsidy and the purchase price or purchase volume, and draw on the detailed implementation rules for raw milk powder spraying subsidies issued by the Inner Mongolia Autonomous Region in 2025. Adopt a post-event subsidy form and clearly stipulate that enterprises that fail to meet the raw milk purchase volume requirements will not be subsidized. Integrate the regulation of market supply and demand through the purchase and storage system with the protection of farmers' income through powder spraying subsidies, and establish a dual guarantee mechanism of “short-term support + long-term regulation.” This mechanism can not only play the regulatory role of the government's “visible hand,” preventing enterprises from taking the opportunity to lower grades and prices, but also effectively guarantee farmers' income, stabilize the basic supply of raw milk, and thereby effectively smooth out the cyclical fluctuations in raw milk prices.
Since the research subjects of this paper are the 10 main dairy producing provinces in China, the research conclusions may only be applicable to the Chinese dairy industry and countries with similar dairy industry conditions. They may not be universal in the world. In the future, data from different countries and methods can be used to study the periodicity of raw milk prices.
Data availability statement
The raw data supporting the conclusions of this article will be made available by the authors, without undue reservation.
Author contributions
JH: Conceptualization, Formal analysis, Methodology, Writing – original draft, Writing – review & editing. CM: Data curation, Methodology, Software, Writing – original draft. YK: Formal analysis, Validation, Writing – review & editing. YJ: Funding acquisition, Methodology, Writing – review & editing.
Funding
The author(s) declare that financial support was received for the research and/or publication of this article. This research was funded by National Natural Science Foundation of China Project (No. 72373036), Henan Province Soft Science Project (No. 252400410252), and Henan Province Postdoctoral Fund Support Project (No. 2023H126).
Acknowledgments
Thanks to all the students and teachers who helped with this article and the reviewers for their constructive comments.
Conflict of interest
The authors declare that the research was conducted in the absence of any commercial or financial relationships that could be construed as a potential conflict of interest.
Generative AI statement
The author(s) declare that no Gen AI was used in the creation of this manuscript.
Any alternative text (alt text) provided alongside figures in this article has been generated by Frontiers with the support of artificial intelligence and reasonable efforts have been made to ensure accuracy, including review by the authors wherever possible. If you identify any issues, please contact us.
Publisher's note
All claims expressed in this article are solely those of the authors and do not necessarily represent those of their affiliated organizations, or those of the publisher, the editors and the reviewers. Any product that may be evaluated in this article, or claim that may be made by its manufacturer, is not guaranteed or endorsed by the publisher.
References
Acosta, A., Ihle, R., and Robles, M. (2014). Spatial price transmission of soaring milk prices from global to domestic markets. Agribusiness 30, 64–73. doi: 10.1002/agr.21358
Acosta, A., and Valdés, A. (2014). Vertical price transmission of milk prices: are small dairy producers efficiently integrated into markets? Agribusiness 30, 56–63. doi: 10.1002/agr.21357
Arief, D., Diani, A. S., Sahara, and Antonya, R. S. (2020). Climate change and milk price volatility in Indonesia. Int. J. Econ. Fin. Issues 10, 282–288. doi: 10.32479/ijefi.9184
Bai, Y. H., Li, L., Wang, F. T., Zhang, L. Z., and Xiong, L. C. (2022). Impact of dairy imports on raw milk production technology progress in China. Int. J. Environ. Res. Public Health 19:2911. doi: 10.3390/ijerph19052911
Burak, M., Mehmet Saltuk, A., Mustafa Bahadir, C., Ahmet Cumhur, A., and Mustafa Agah, T. (2021). Factors affecting the price of raw milk in Turkey using panel data analysis. Ciência Rural 51. doi: 10.1590/0103-8478cr20200937
Can, B. A., and Engindeniz, S. (2025). The effects on milk marketing of cooperative partnership of dairy farmers: a case study from Türkiye. Front. Sustain. Food Syst. 8:1451687. doi: 10.3389/fsufs.2024.1451687
Chen, H., Chong, T. T., and Bai, J. (2012). Theory and applications of TAR model with two threshold variables. Econ. Rev. 31, 142–170. doi: 10.1080/07474938.2011.607100
Chen, Z. T., Hu, Y., He, Z., and Liang, J. (2015). Research on the fluctuation pattern of raw milk prices in China. Price Theory Pract. 118–120.
Hansen, B. E. (1999). Threshold effects in non-dynamic panels: estimation, testing, and inference. J. Econ. 93, 345–368. doi: 10.1016/S0304-4076(99)00025-1
Hu, F., Xi, X., Yu, R. J., Xiang, R., Zhang, Y. Y., Ren, Z. M., et al. (2021). Does the price support policy drive a balanced distribution of profits in the Chinese dairy supply chain? Implications for supplier and consumer psychology. Front. Psychol. 12:632355. doi: 10.3389/fpsyg.2021.632355
Hua, J. G. (2013). The inflation persistence and random shock effects in the inflation cycle. J. Finance Econ. 28, 41–53.
Hua, J. G., Chen, Y. F., and Yang, T. (2020). Threshold effect and policy enlightenment on price fluctuation of raw milk in China. Agric. Econ. Manag. 74–84.
Huan, M. L., Chi, L., Chen, P. F., Zhang, L., and Hou, Y. X. (2020). Profit distribution mechanism of fresh milk supply chain: based on modified Shapley value method. China Dairy Ind. 48, 32–37. doi: 10.19827/j.issn1001-2230.2020.01.007
Kang, H. Q., Han, X., Liu, F., and He, Z. W. (2016). Analysis on price fluctuation of fresh milk in China: based on GARCH-type model. Chin. J. Anim. Sci. 52, 9–13.
Li, C. X., and Luan, Y. (2017). Study on the fluctuation of raw milk price in China: based on Markov regime-switching model. Price Theory Pract. 81–84. doi: 10.19851/j.cnki.cn11-1010/f.2017.05.020
Li, S. L., Yao, K., Liu, C. Q., Wang, Y. C., Wang, Z. H., Li, J. X., et al. (2025). The 2024 dairy industry and technology development report. Chin. J. Anim. Sci., 61: 395–398.
Li, Z. Y., Zuo, A. M., and Li, C. X. (2023). Predicting raw milk price based on depth time series features for consumer behavior analysis. Sustainability 15:6647. doi: 10.3390/su15086647
Liu, H., Peng, H., Zhang, C., and Dong, X. X. (2023). Construction and application of milk-feed price ratio model: based on data from large-scale dairy farms in China. Emirates J. Food Agric. 35, 929–939. doi: 10.9755/ejfa.2023.3137
Liu, T. Z., and Liu, F. (2017). Research on the fluctuation law of raw milk prices in China: an analysis based on B-N data decomposition. Chin. J. Anim. Sci. 53, 131–135. doi: 10.54254/2755-2721/53/20241310
Liu, Y. Z., Liu, F., Wang, X., and Song, F. (2019). Analysis of the price lag effect of raw milk supply in China. Chin. J. Anim. Sci. 55, 140–146.
Lu, H., Dang, C. S., Liu, R., Liu, R. N., Zhang, S. F., Xue, Y. L., et al. (2025). The effects of sampling sites, collection time and refrigerated storage duration on microbiota of raw milk from a Chinese dairy farm: an exploratory study. J. Food Prot. 88:100504. doi: 10.1016/j.jfp.2025.100504
Miao, S. S., and Xu, Z. W. (2023). Research on the asymmetry of market price transmission and the change of market power in the Chinese dairy industry under the background of industrial chain reconstruction. Heilongjiang Anim. Sci. Vet. Med. 8–16. doi: 10.13881/j.cnki.hljxmsy.2021.12.0145
Ou Yang, Z. G., and Li, W. (2023). The non-linear spillover effect of the Fed's unexpected monetary policy on Chinese enterprises' RandD. J. Nanchang Univ. 54, 56–76. doi: 10.13764/j.cnki.ncds.2023.01.011
Piotr, B., Marta, G., Wojciech, T., Dagmara, Z., Aneta, B. B., Bartosz, M., et al. (2020). Milk price changes in Poland in the context of the common agricultural policy. Agric. Econ. 66, 19–26. doi: 10.17221/178/2019-AGRICECON
Svetlana, K., and Sebastian, H. (2022). Identifying the determinants of regional raw milk prices in Russia using machine learning. Agriculture 12:1006. doi: 10.3390/agriculture12071006
Taylor, B. J. (2000). Low inflation, pass-through, and the pricing power of firms. Eur. Econ. Rev. 44, 1389–1408. doi: 10.1016/S0014-2921(00)00037-4
Wang, Q. Q., Cheng, R. Z., and Xu, W. F. (2023). Assessing volatility spillover effect between international milk powder and China's raw milk markets in the context of import growth. Cogent. Food Agric. 9:1568041. doi: 10.1080/23311932.2023.2253715
Wang, Q. Q., Wei, L. B., and Wang, W. T. (2020). Empirical analysis of raw milk price volatility in China: based on GARCH model. Issues Agric. Econ. 97–107. doi: 10.13246/j.cnki.iae.20201117.001
Wang, Y. B., Hug, S., Irek, J., and Finger, R. (2024). Product differentiation, quality, and milk price stability: the case of the Swiss cheese market. Appl. Econ. Perspect. Policy 47, 416–435. doi: 10.1002/aepp.13467
Xue, H. D., Li, C. G., and Wang, L. M. (2021). Spatial price dynamics and asymmetric price transmission in skim milk powder international trade: evidence from export prices for New Zealand and Ireland. Agriculture 11:860. doi: 10.3390/agriculture11090860
Yan, Z. R., Xu, Y. Y., Xiao, X. Y., and Li, C. G. (2018). Study on the price spillover effects of both domestic and imported raw milk markets: based on the rolling cointegration and the BEKK-GARCH model. Res. Agric. Mod. 39, 113–121. doi: 10.13872/j.1000-0275.2017.0131
Yang, Y. Y., Wang, M. L., and Shi, Z. Z. (2020). Price fluctuation of fresh milk in China: based on MS-GARCH model double asymmetric effect study. Chin. J. Anim. Sci. 56, 155–160. doi: 10.19556/j.0258-7033.20190820-02
Yu, H. L., Wu, J., and Zhang, R. J. (2018). Study on raw milk price fluctuation, dumping milk, and regulatory policies. J. Huazhong Agric. Univ. 65–72+159. doi: 10.13300/j.cnki.hnwkxb.2018.01.008
Yu, Z. T., Dong, X. X., Li, L. W., Peng, H., and Liu, H. (2023a). Quantitative evaluation, mechanism analysis and regulatory approaches of China's dairy market structure. Chin. J. Agric. Res. Reg. Planning 44, 206–215. doi: 10.7621/cjarrp.1005-9121.20230720
Yu, Z. T., Liu, H., Peng, H., Xia, Q. T., and Dong, X. X. (2023b). Production efficiency of raw milk and its determinants: application of combining data envelopment analysis and stochastic frontier analysis. Agriculture 13:370. doi: 10.3390/agriculture13020370
Zhang, L. H., Wang, F. S., Wang, K. J., He, Z. X., Chen, C., Liu, J. H., et al. (2025). Improving agricultural commodity allocation and market regulation: a novel hybrid model based on dual decomposition and enhanced BiLSTM for price prediction. Front. Sustain. Food Syst. 9:1568041. doi: 10.3389/fsufs.2025.1568041
Keywords: cyclical fluctuation, raw milk price, dynamic game, duration, two-threshold mechanism transfer model, sustainable development
Citation: Hua J, Ma C, Kang Y and Jia Y (2025) Why is dairy production so difficult to stabilize? Research on the micro-mechanism and transformation mechanism of cyclical fluctuations of raw milk prices in China. Front. Sustain. Food Syst. 9:1655741. doi: 10.3389/fsufs.2025.1655741
Received: 28 June 2025; Accepted: 23 September 2025;
Published: 14 October 2025.
Edited by:
Denise Adelaide Gomes Elejalde, Universidade Tecnológica Federal do Paraná Pato Branco, BrazilReviewed by:
Francisco Ernesto Martínez-Castañeda, Universidad Autónoma del Estado de México, MexicoMuhammad Wakhid Musthofa, Sunan Kalijaga State Islamic University Yogyakarta, Indonesia
Copyright © 2025 Hua, Ma, Kang and Jia. This is an open-access article distributed under the terms of the Creative Commons Attribution License (CC BY). The use, distribution or reproduction in other forums is permitted, provided the original author(s) and the copyright owner(s) are credited and that the original publication in this journal is cited, in accordance with accepted academic practice. No use, distribution or reproduction is permitted which does not comply with these terms.
*Correspondence: Yu Kang, Y2hsb2VfeXVrYW5nQDEyNi5jb20=; Yunfei Jia, amlheXVuZmVpQGhlbmF1LmVkdS5jbg==