 Yifeng Tang
 Zhongyi Tan1
- 1School of Public Administration and Law, Hunan Agricultural University, Changsha, China
- 2College of Public Administration, Huazhong University of Science and Technology, Wuhan, China
The policy of returning farmland to wetland in the Dongting Lake Region (DLR) is devised to foster synergy between grain production and ecological protection, while also effectively mitigating land degradation. However, the connotations and the spatial spillover effect of farmland use transition (FUT) in this region remain insufficiently understood. To address these gaps, this study deconstructs the FUT through farmland spatial transition, functional transition and model transition. By using the Sparrow Search Algorithm-Projection Pursuit Model for evaluation, this study analyzes the spatiotemporal pattern evolution characteristics of FUT. Additionally, spatial econometric model is employed to examine the spatial spillover effect of FUT. The results demonstrate that FUT in the DLR showed a fluctuating but overall upward trend. Spatial transition represents an ordinal covariate of model transition, and the two entities together form a mechanism for synergistic evolution that exhibits a biased symbiotic relationship. Strengthening the positive spillover effects of political and socio-economic drivers could promote more balanced FUT. These findings provide a theoretical basis for integrating ecological restoration with sustainable agricultural development in the DLR.
1 Introduction
The research of land use transition is regarded as a more advanced field within the discipline of land system science (Meyfroidt et al., 2018; Geels et al., 2023). As global food demand continues to rise, FUT has become a hot land-use transition research topic (Chen et al., 2023; Liao et al., 2023; Wang and Huang, 2024). Land use transition research framework posits that the FUT encompasses dominant morphology transition and recessive morphology transition (Ge et al., 2020; Long et al., 2020; Zou et al., 2024). The primary objective of FUT is to support regional economic and social development, with a particular focus on the innovating land resource management amidst the ongoing urban–rural transition.
Considerable research has been dedicated to investigating farmland use in the lake region, owing to its potential impact on ecosystems, biodiversity, and water quality (Desta and Fetene, 2020; Asare et al., 2021; Min et al., 2022). The study area of this research is the DLR, located in the middle and lower reaches of the Yangtze River. In line with the United Nations Sustainable Development Goal 2, there are complex trade-offs between farmland use and other land uses in the DLR. The development of state-owned farms and individual polders in the local area between the 1950s and the 1980s was the primary factor contributing to wetland loss and increased vulnerability to floods (Yin et al., 2019; Dong et al., 2022). As the policy of returning farmland to wetland gains recognition as a valuable opportunity to enhance ecosystem function and combat land degradation in the lake region (Bartolucci et al., 2021; Liu et al., 2024; Zhang et al., 2024), the Chinese government has implemented the policy in DLR since 1998. Dominant morphology transition caused by the policy of returning farmland to wetland has been confirmed by previous studies (Long et al., 2022; Xiao et al., 2022; Peng et al., 2023). Since land systems science posits that land is a natural-economic system comprising multiple elements (Meyfroidt et al., 2022), it is essential to analyze recessive morphology transition in the areas where policy of returning farmland to wetland has been implemented.
After constructing the multiple indicators of FUT, scholars have employed various methods, including the multi-index method (Ma et al., 2020), and TOPSIS (Wang et al., 2023) to conduct quantitative assessments. The SSA, a novel artificial intelligence algorithm proposed in 2020, has since been integrated with the PPM. SSA-PPM is adept at capturing the intrinsic linkages and structural characteristics of high-dimensional metrics (Xue and Shen, 2020; Xiang et al., 2022; Awadallah et al., 2023). Therefore, this study uses the SSA-PPM to assess the FUT levels of DLR.
Land use can exert broad-ranging impacts by shaping the spatial structure of the landscape and triggering cascading effects on other land uses in neighboring areas, known as spatial spillover effect (Kassouri, 2021; Boillat et al., 2022; Zhang et al., 2022). The spatial spillover effect of land is recognized by Meyfroidt et al. (2022) as one of the 10 facts of land system science. Existing research has identified the flow of production factors as a key theoretical mechanism driving the generation of spatial spillover effect in FUT (Wang et al., 2024b; Wang et al., 2024a). Nonetheless, the existence of spatial spillovers in the land use of the DLR remains to be determined.
Further research is necessary to gain a deeper understanding of FUT. Firstly, the expansion of the number of factors included in the FUT has rendered existing methodologies incapable of fully utilizing the data or accessing the internal linkages and structural features of high-dimensional indicators. Secondly, the research of DLR’s FUT did not fully incorporate dominant morphology transition and recessive morphology transition into its analytical framework, the synergistic relationship between morphologies have also not been explored in previous research. Finally, it is essential to examine the spatial spillover effect of the FUT, as demanded by the spatial correlation of farmland use. Hence, this paper will reveal the underlying meaning of DLR’s FUT and employs SSA-PPM to quantitative assessment. The spatiotemporal evolution of FUT from 2000 to 2020 is also analyzed, followed by investigation of the synergistic relationship and spatial spillover effect. This paper holds immense theoretical significance in facilitating a profound understanding of FUT, and it offers a solid reference to enhance the spatial coherence of DLR’s land use. The technological route for this paper is shown in Figure 1.
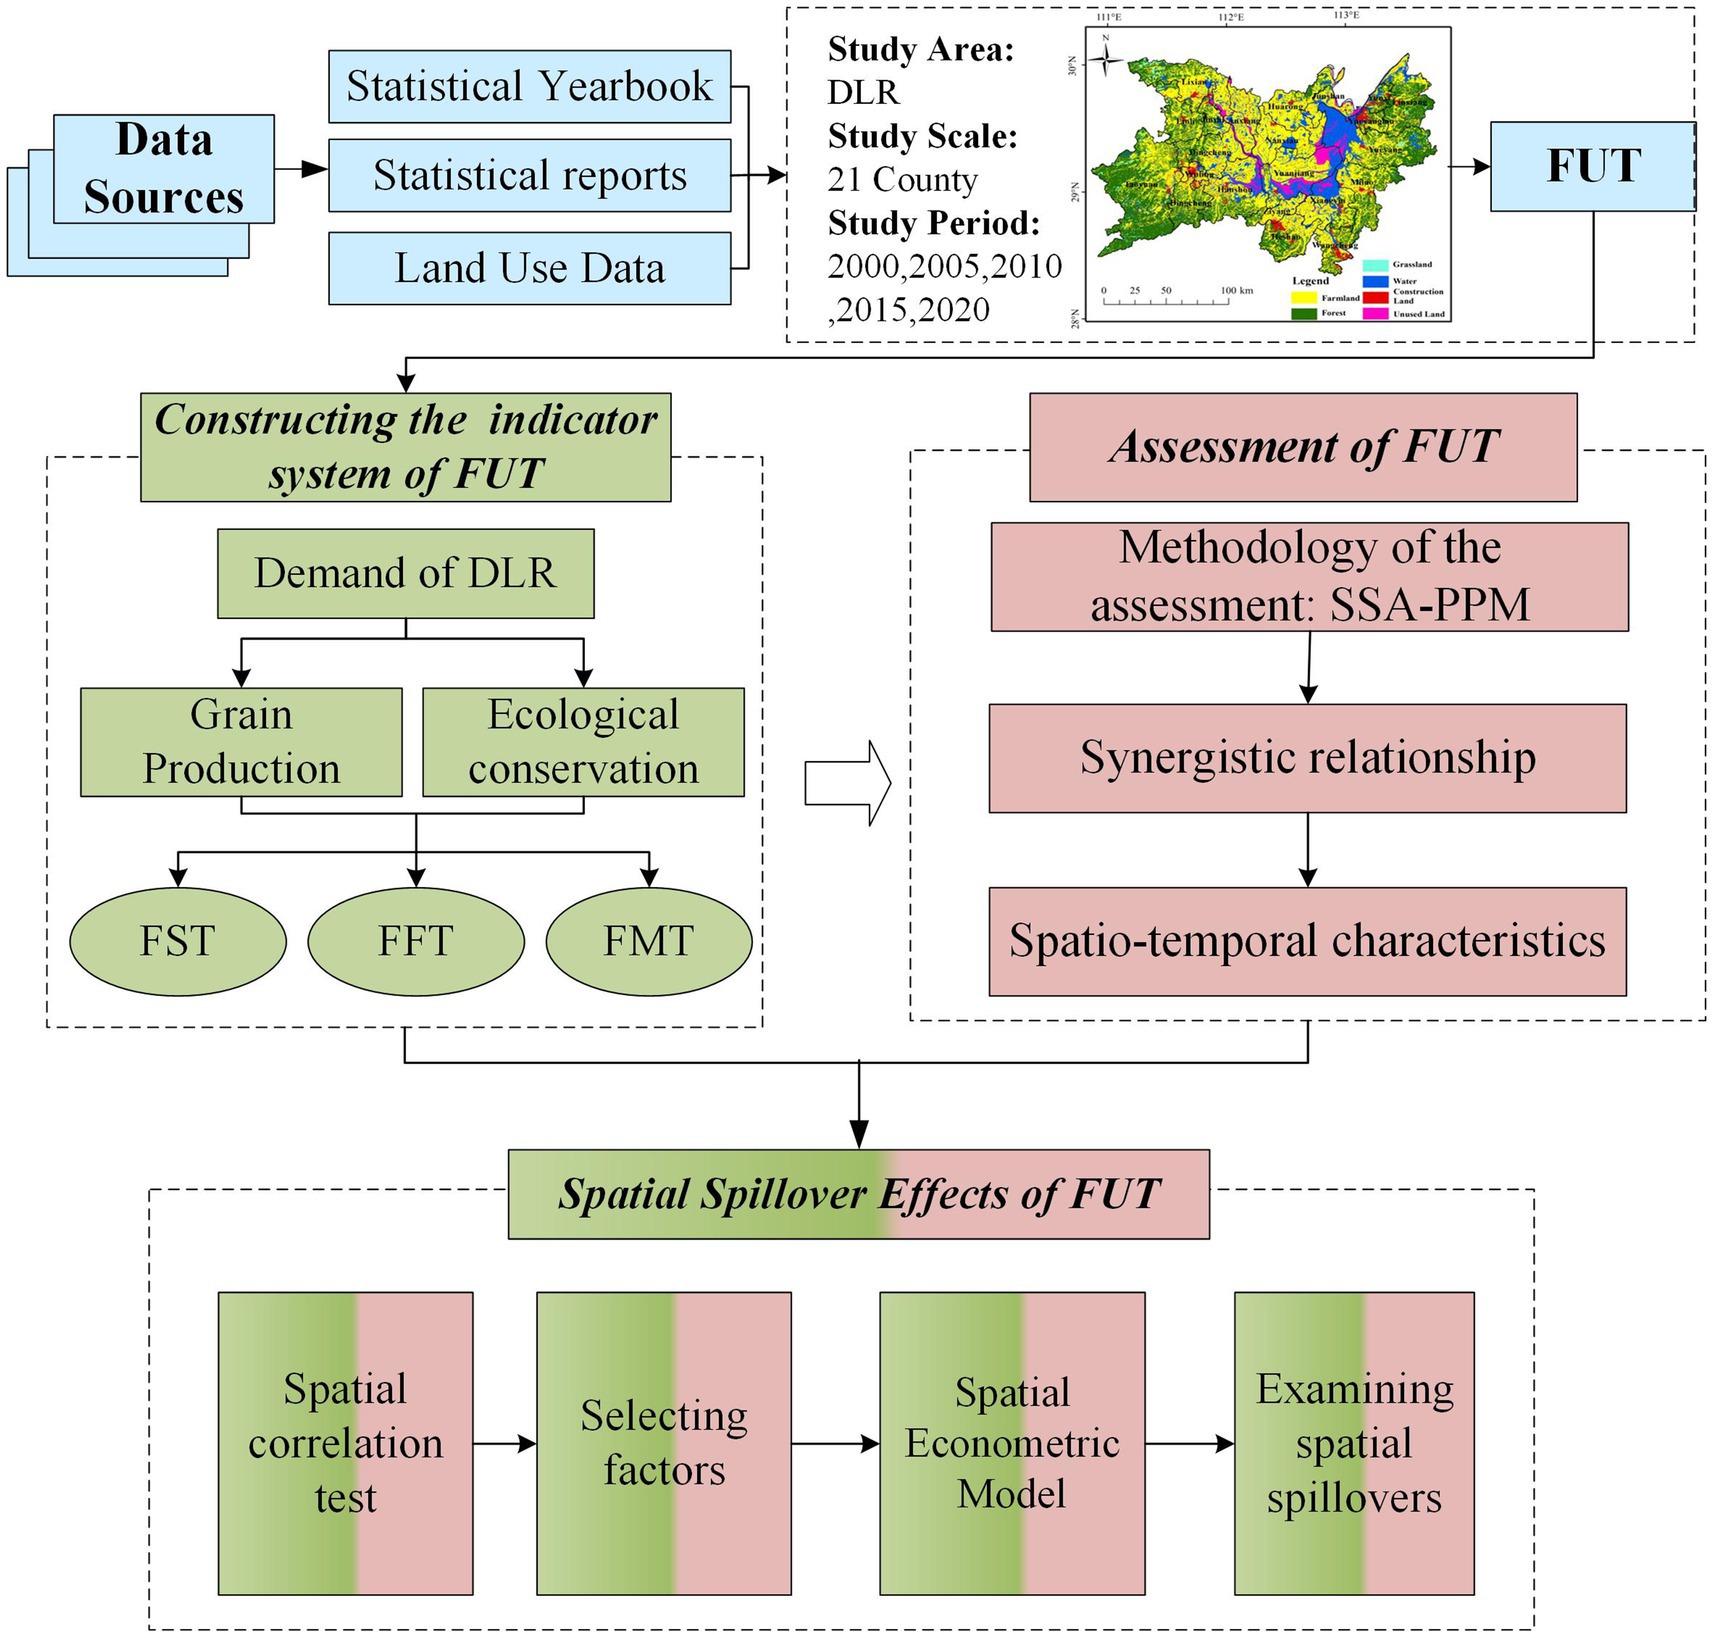
Figure 1. The technological route for the research.
2 Data and methods
2.1 Study area
Located in the northeast region of Hunan Province, China, DLR is composed of 21 county-level units (Figures 2a,b). By the end of 2020, the farmland area in the DLR was 14,280.81 square kilometers, with the ratio of farmland accounting for about 45.84%. The floods that occurred in 1998 prompted the Chinese Government to implement the policy of returning farmland to wetland, aiming to maintain the synergy between grain production and ecological conservation in the DLR. Meanwhile, with the expansion of farmland and the intensification of agriculture, the ecological environment of the DLR faces tremendous pressure. Land degradation, water pollution, loss of biodiversity caused by over-cultivation and the misuse of chemical fertilizers have created a pressing need for ecological restoration. Guided by the policy of returning farmland to wetland, FUT is reshaping the relationship between people and nature in the DLR. Therefore, this paper takes DLR as the study area.
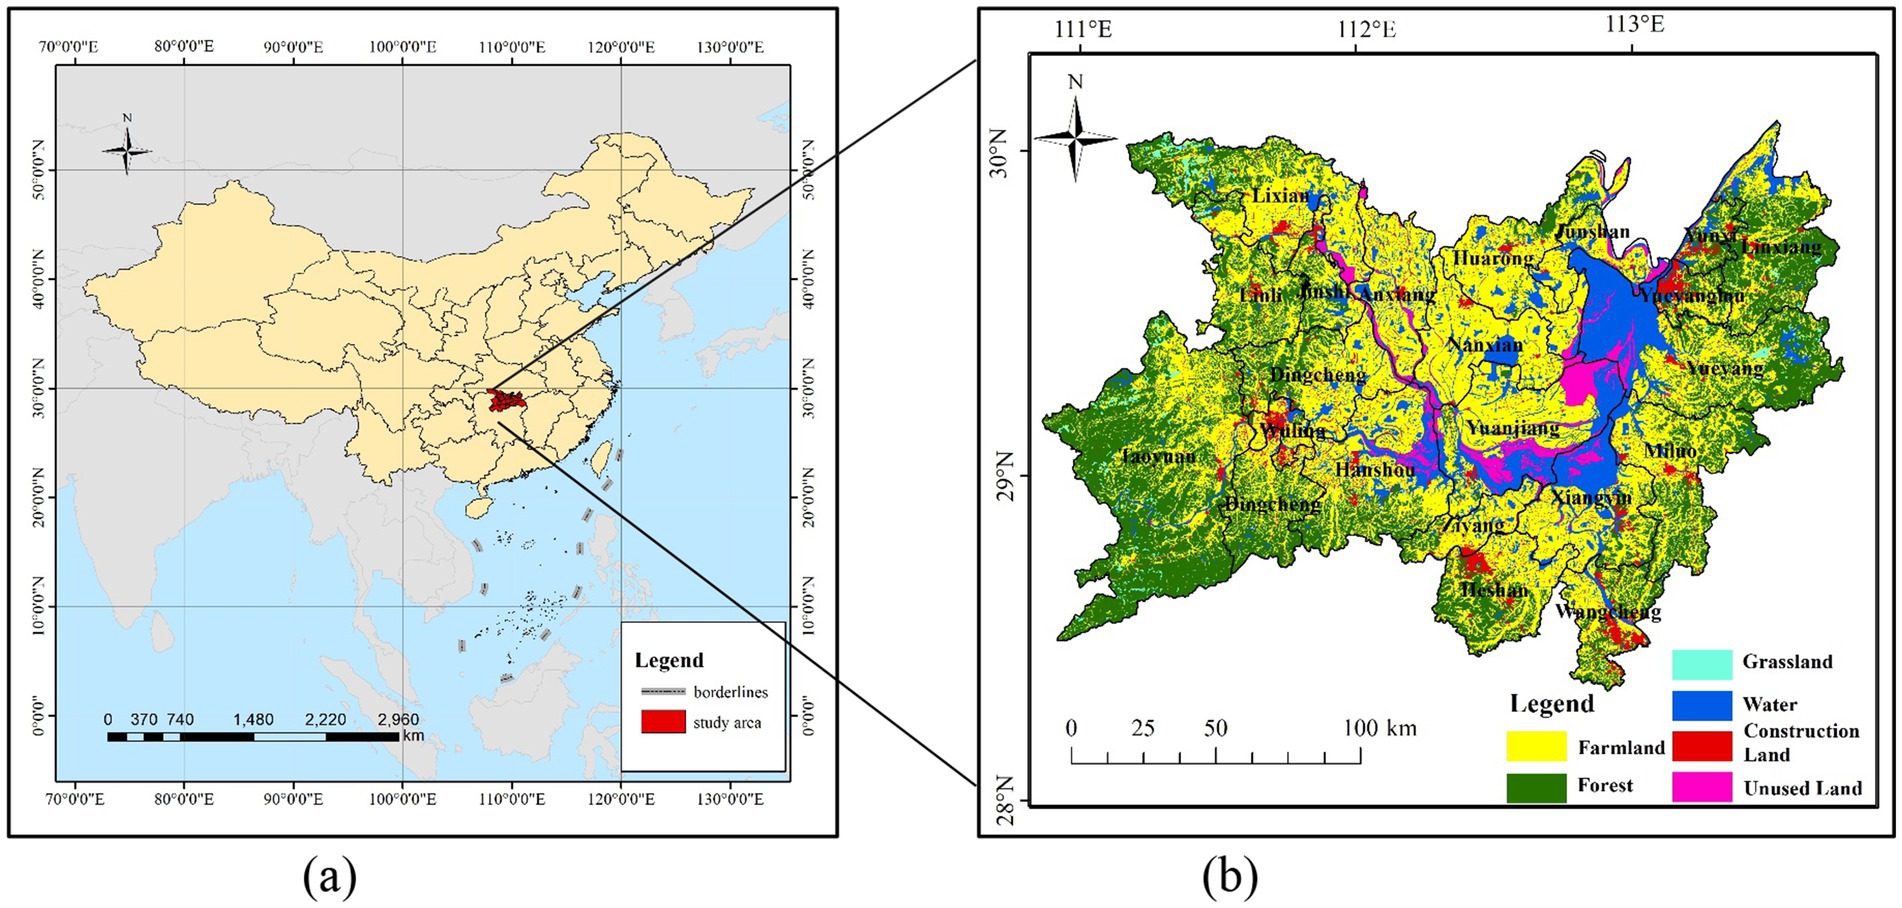
Figure 2. (a) Location of DLR. (b) Land use conditions of DLR.
2.2 Indicators of DLR’S FUT
2.2.1 Composition of FUT
Building upon existing research (Ma et al., 2020; Ke et al., 2021; Cui et al., 2024), this paper divides FUT into spatial transition, functional transition and model transition. Spatial transition refers to changes in the quantity and spatial patterns of land use, while recessive morphology transition encompasses transitions in property rights, inputs, outputs, functions, quality, and management practices. Given that the function of farmland is the most direct reflection of recessive morphology, this paper uses function to analyze recessive morphology transition, examining it from three aspects: production, living, and ecological functions (Liang et al., 2020; Wang et al., 2024b). Model transition is defined as the transition of land use modes within the agricultural sector, it plays a pivotal role in facilitating FUT. A core aspect of model transition in the DLR is the integration of three critical components: human-wetland harmony, advanced technologies, and efficient resource utilization. The concepts of spatial and functional transitions are well-established, the following section delves into the model transition.
(1) Human-wetland harmony. Human-wetland harmony is central to the model transition, as it ensures the ecological sustainability and agricultural productivity (Yang et al., 2020; Long et al., 2022). When the expansion of farmland substantially hinders the ecological functions of the wetland, the government intervenes by implementing the policy of returning farmland to wetland. To prevent flooding caused by seasonal changes in the water level of Dongting Lake, the construction of levee and other engineering safeguards is vital during the FUT process, ensuring both ecological and agricultural stability.
(2) Advanced technology. Advanced technology offers significant potential in addressing the growing challenges of agricultural labor and land scarcity, which are increasingly exacerbated by urbanization (Liu and Zhou, 2021). Technological innovation in agriculture aligns with broader paradigms of sustainable development and resource optimization. In this context, the relatively flat terrain of the DLR is crucial in mitigating the impact of topographical constraints, thereby facilitating the widespread adoption of technology across the region. The geographic advantage of DLR creates ideal environment for the widespread adoption of agricultural technologies, such as automated machinery, precision farming systems.
(3) Efficient resource utilization. Integrating advanced technology into farmland use is crucial for optimizing agricultural input management, including energy resources like diesel and electricity. These technologies help reduce waste and minimize the environmental impact of energy inefficiencies. Advanced technology improves operational efficiency while fostering more sustainable farming practices by minimizing resource consumption and promoting environmentally responsible use of energy. Consequently, the adoption of these technologies offers an economically viable solution to labor and land shortages, while also serving as a critical step toward creating a more sustainable and resource-efficient farmland use system. This transition is essential for ensuring the long-term resilience and sustainability of the farmland use.
The conceptual framework of FUT is shown in Figure 3.
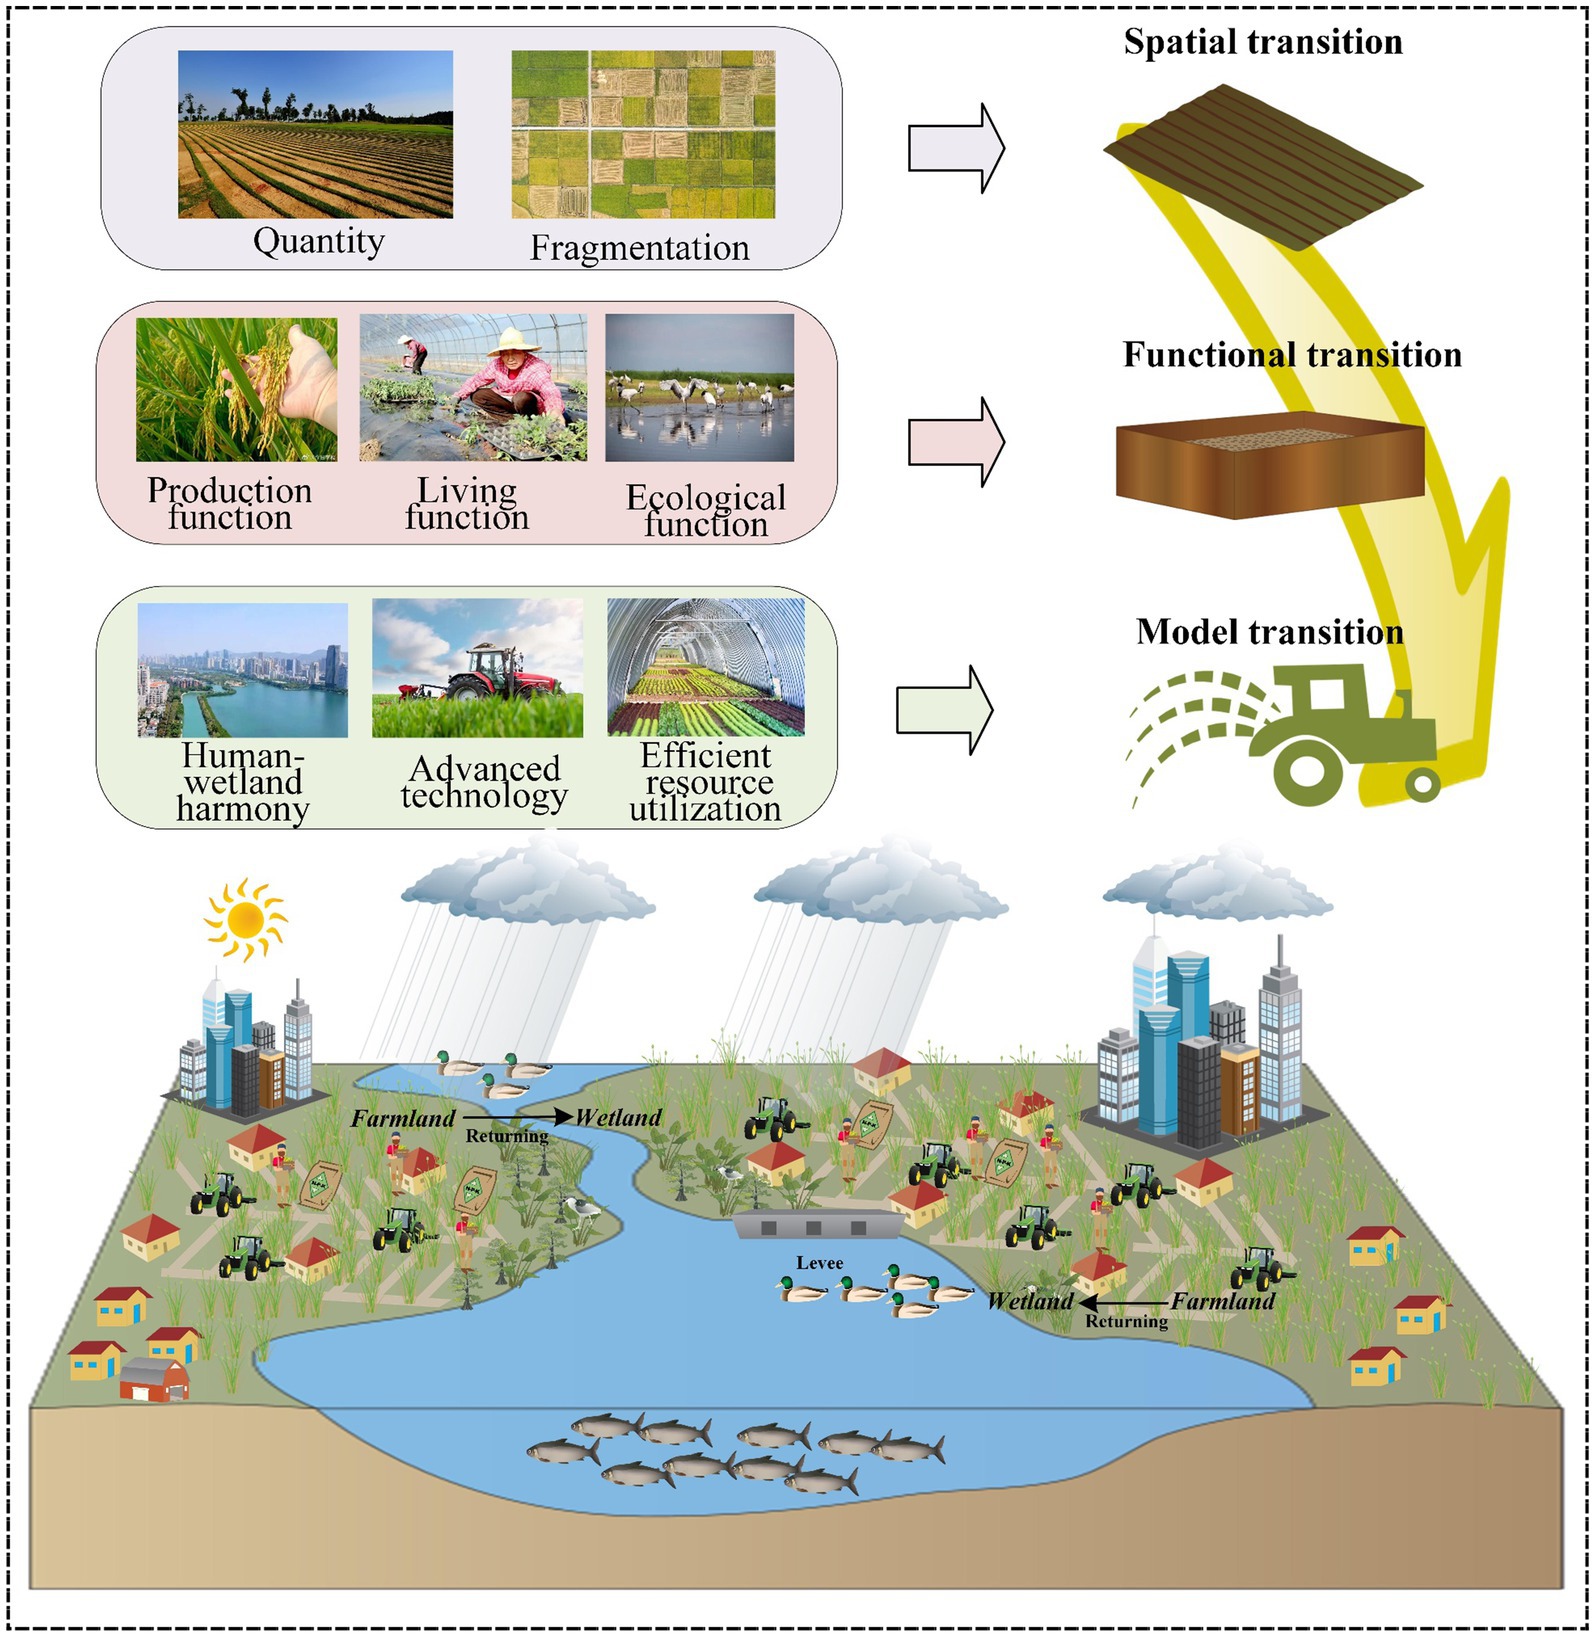
Figure 3. The conceptual framework of DLR’s FUT.
2.2.2 Indicators of FUT
This study decomposes FUT into three dimensions: spatial transition, functional transition, and model transition. The FUT evaluation indicators is presented in Table 1.
(1) The indicators of spatial transition.
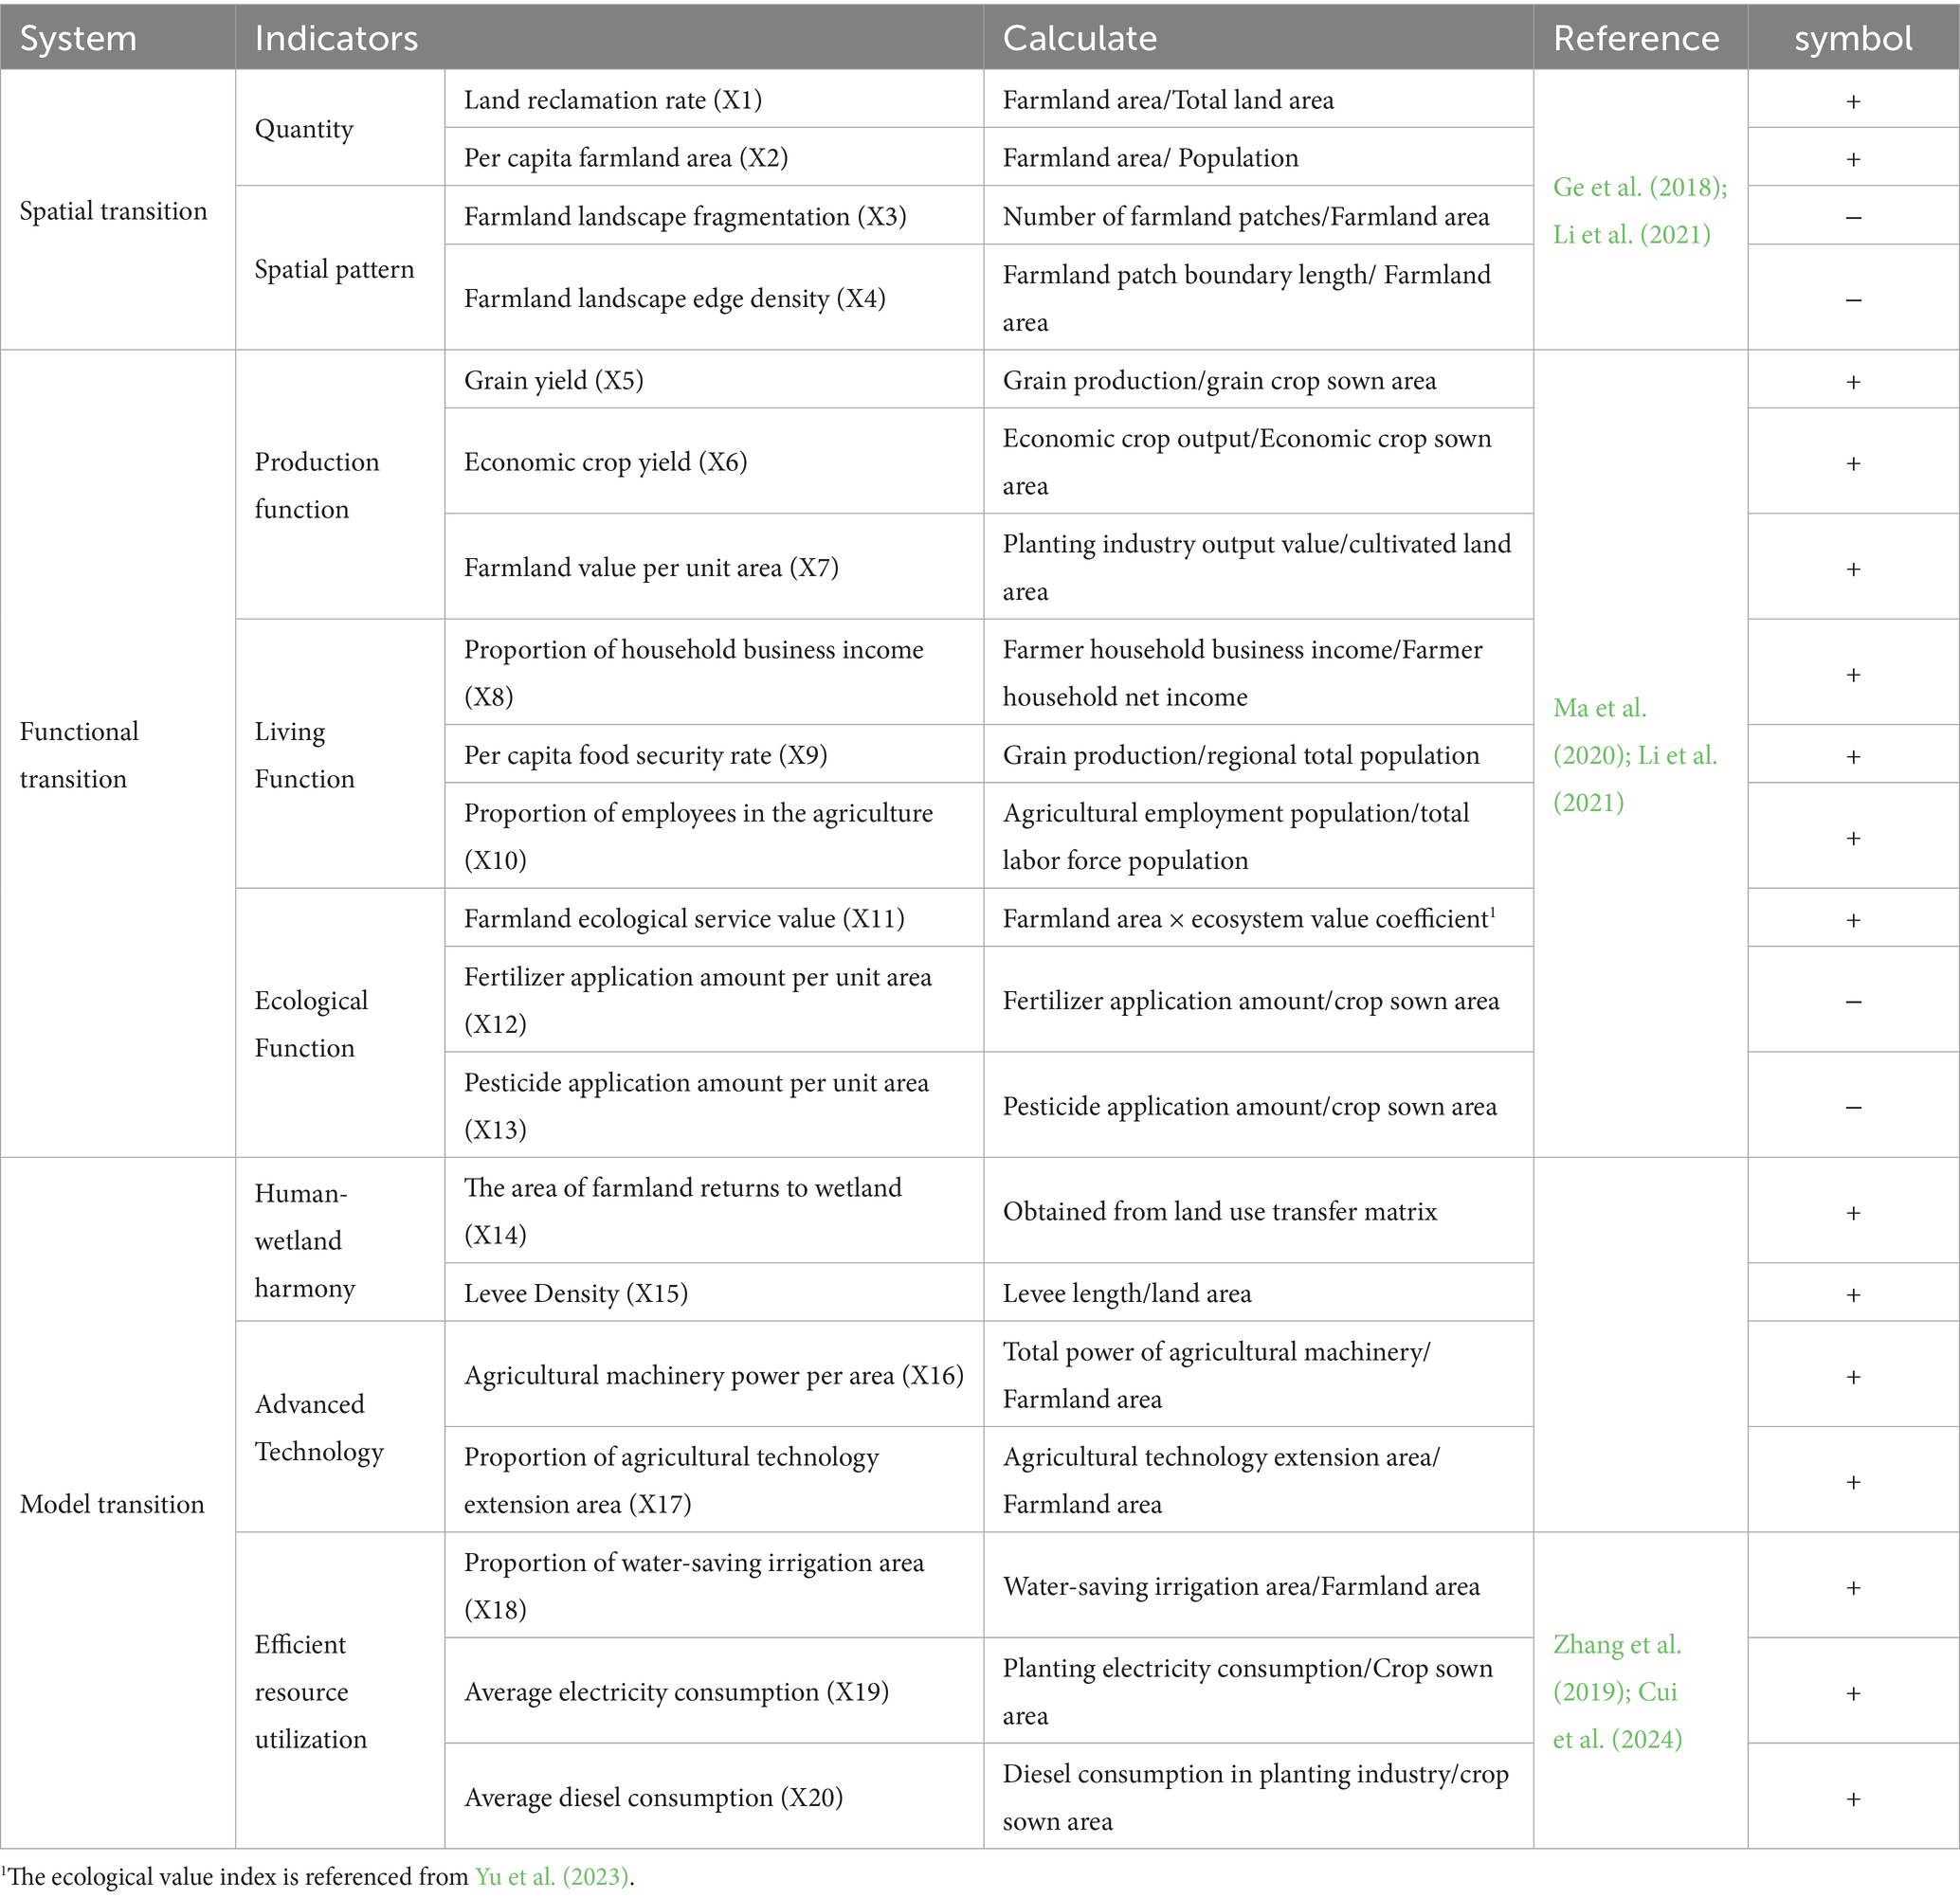
Table 1. The indicators of FUT.
Quantity transition. The area of farmland can reflect the farmland transition and indicate the status and trends. To enhance regional comparability, this paper adopts the land reclamation rate (X1) as a representative indicator. The per capita farmland area (X2) is used as an indicator of farmland quantity. Per capita farmland area reflects changes in farmland area while accounting for human factors. This indicator is crucial for revealing the evolution of regional human-environment interactions.
Spatial pattern transition. Diagnosing farmland spatial pattern transition involves monitoring the long-term changes in the landscape pattern of farmland. The landscape pattern of farmland serves as a reflection of the spatial ecological characteristics of farmland parcels. As socio-economic development progresses, the morphological pattern of farmland landscapes is expected to evolve from fragmented and dispersed states toward more concentrated, contiguous, and regular configurations. In this context, this paper employs farmland fragmentation (X3) and farmland landscape edge density (X4) to quantify and measure this aspect.
(2) The indicators of functional transition.
Production function reflects the quantity of products obtained by laborers through their production and management activities on farmland. This paper selects three indicators to measure this aspect: grain yield (X5), economic crop yield (X6), and farmland value per unit area (X7).
Living function reflects the capacity of farmland to ensure food security, generate household income, and provide employment. To characterize this aspect, this paper selects three indicators: the proportion of household business income (X8), per capita food security rate (X9), and the proportion of employees in agriculture (X10).
Ecological functions. Farmland provides new habitat for biodiversity, and forms unique biological population structures. Meanwhile, due to its capacity to maintain ecosystem resilience and support environmental purification, farmland can be considered as ecological land with significant ecological functions. This study employs three indicators to measure farmland ecological functions: farmland ecological service value (X11), fertilizer application per unit of farmland area (X12), and pesticide application per unit of farmland area (X13).
(3) The indicators of model transition.
Human-wetland harmony aims to mitigate the negative impact of farmland on ecosystems. It does so by limiting excessive encroachment into wetland areas and reducing the possibility of farmland being inundated during floods in the lake area. Levee infrastructure is an effective engineering measure for controlling floodwaters. Therefore, this study employs the area of farmland converted into lake wetlands (X14) and levee density (X15) to quantify the coexistence between human activities and wetland management known as Human-wetland harmony.
Advanced technology. Since the 21st century, Chinese farmers have adopted agricultural mechanization as a key strategy for promoting sustainable agricultural development. The successful implementation of agricultural machinery technology into tangible productivity depends on the widespread dissemination of advanced usage technology among agricultural operators. To measure advanced technology, this study employs two indicators: agricultural machinery power per area (X16) and the proportion of agricultural technology extension area (X17).
Efficient resource utilization. The primary resources involved in the process of farmland utilization include land, water, electricity and diesel. This study uses three indicators to measure efficient resource utilization: the proportion of water-saving irrigation area (X18), per capita electricity consumption (X19), and per capita diesel consumption (X20).
2.3 Methods
2.3.1 SSA-ppm
The PPM reduces data dimensionality while preserving the inherent stability of the original data (Kolkiewicz et al., 2021). SSA, a widely used population-based optimization method, offers significant advantages in terms of convergence speed, search precision, and stability. These qualities make it particularly effective in solving the optimal solution of the PPM (Xiang et al., 2022). In this study, SSA is applied to find the optimal projection direction by solving for the maximum objective function value Q(a) in the projection pursuit model. SSA-PPM is employed for FUT measurement, effectively eliminating the interference of subjective assignment methods and ensuring more reliable evaluation results of FUT. The basic steps of the PPM include standardizing the original data using the range method, constructing a projection objective function, optimizing the projection objective function (Q), and determining the projection values. The calculation formula can refer to the studies of Xiang et al. (2022) and Wang et al. (2024a).
2.3.2 Haken model
Farmland use system is influenced by socio-economic factors and natural elements of the land. This utilization gives rise to an organized system that exhibits self-organization, characterized by specific spatial and temporal structures and functions. The components of farmland use are intricately interconnected, forming synergistic relationships that facilitate dynamic movement between these elements (Meyfroidt et al., 2022). Therefore, it is necessary to discuss the synergistic relationship between spatial transition, functional transition and model transition. By distinguishing between fast and slow variables, Haken model can identify ordinal covariates and can represent the synergistic relationship between elements. Haken model can be referred to the study of Fang and Zhao, (2024). The ordinal covariates of Haken model are the slow variables in the development of the system, and the slow variables drive the fast variables and determine the direction of evolution of the whole system. Set q1 as the system slow variable and q2 as the system fast variable. The equation of motion for the synergistic development of q1, q2 is shown in Equations 1, 2.
The results of calculating the control parameters of the Haken model under the conditions of system openness can indicate that there are the following relations and mechanisms of action between the morphologies.
a and b are control variables. a reflects the synergistic effect of q1 and q2. When a is less than 0, q2 acts as a driver for q1, and the larger the absolute value, the greater the driver. When a is greater than 0, q2 acts as an inhibitor for q1, and the larger the absolute value, the greater the resistance. b reflects the synergistic effect of q1 on q2: When b is less than 0, q1 inhibits the growth of q2. When b is greater than 0, q1 facilitates the growth of q2. γ1 and γ2 are damping coefficients. When γ1 is less than 0, it means that the q1 has built up a positive feedback mechanism to make itself evolve in an orderly way, and the larger the absolute value, the higher the order; when γ1 is larger than 0, it means that is in a negative feedback mechanism to make itself evolve in an orderly way, and the larger the absolute value, the stronger the disorder. When γ2 is less than 0, q2 has established a positive feedback mechanism that enhances its own ordering; when γ2 is greater than 0, q2 has established a negative feedback mechanism that enhances its own ordering.
2.3.3 Spatial econometric model
(1) Global spatial autocorrelation test.
This study initiates by assessing the spatial correlation of variables through global spatial autocorrelation analysis. The null hypothesis of the global spatial autocorrelation test is that there is no spatial correlation in the model. When the null hypothesis is established, . Global spatial autocorrelation is measured using the Moran index, and the value range of the index is generally [−1, 1]. Less than 0 means negative spatial correlation, greater than 0 means positive spatial correlation, equal to 0 means no spatial correlation. The Moran index calculation formula is as follows in Equation 3.
is the average value; represents the regional observation value; n represents the number of regions; is the spatial weight matrix. This study uses a binary 0–1 adjacency space weight matrix, which is set according to whether the regional units have common adjacency boundaries in geographic space. When two provinces are geographically adjacent, the value is 1; when the two provinces are not geographically adjacent, the value is 0.
(2) Spatial econometric model setting.
The spatial econometric model is the main econometric tool for analyzing the direct effects and spatial spillover effect. The reasons for the spatial spillover effect of FUT can be attributed to the proximity of land locations and the mobility of various factors of production (Wang et al., 2024b; Wang et al., 2024a). Meanwhile, since the farmland use process is dynamic, we construct a dynamic spatial Durbin model containing time lag terms and spatial lag terms to conduct research. The dynamic spatial Durbin model of FUT is set as follows in Equation 4.
represents an n-dimensional spatial weight matrix. I and j denote regional variables. t represents the current period, while t-1 represents the previous period, with . FUTit represents the explained variable of farmland use transition. represents the explained variable of the first-order time lag of FUT, indicating the impact of previous-period FUT on the current period. represents the spatial lag term of the explained variable of farmland use transition. represents the spatial lag term of the time lag term of FUT. X denotes control variables. denotes the spatial lag term of the control variables.
By taking partial derivatives of the estimated coefficients of the dynamic spatial Durbin model, we can obtain the direct effects of explanatory variable changes on the local spatial unit’s explained variable, and the spatial spillover effect of explanatory variable changes on the surrounding units’ explained variables. At the same time, the dynamic spatial Durbin model considers the effects over time.
2.4 Control variables
This paper selects control variables from three dimensions: natural, policy, and socio-economic development.
(1) Natural factors. Higher precipitation levels typically are generally linked to increased farmland productivity (Liu et al., 2020). However, excessive rainfall can lead to flooding, which poses a significant threat to farmland security, particularly in flood-prone areas. Simultaneously, forests play a crucial role in conserving wetland resources and maintaining soil quality. To account for these influential factors, this paper incorporates precipitation and forest coverage rate as relevant control variables in the study.
(2) Policy factors. Land policy is central to national food security and social stability (Zhou et al., 2021). The proportion of local fiscal expenditure to GDP is a key indicator of local government policy influence. Village committee have been granted increased control and autonomy over rural land consolidation, which subsequently affects FUT (Shi et al., 2018). The number of village committees is used as a proxy for village policy influence.
(3) Socio-Economic development factors. Population growth and economic development frequently drive the expansion of both urban and rural construction land, which subsequently affects FUT. In this study, population density is used as an indicator of population size, while per capita GDP serves as a measure of economic development. The improvement in residents’ consumption capacity can change the consumption structure and guide the green and efficient transition of agricultural production processes (Yang and Zhang, 2020). To capture this, the per capita total consumer expenditure is employed as a proxy for residents’ consumption capacity.
2.5 Data sources
The land use data used in this study were obtained from the 30 m × 30 m remote sensing data for China’s land use, covering the years 2000, 2005, 2010, 2015, and 2020. This data was provided by the Data Center for Resources and Environmental Sciences of the Chinese Academy of Sciences.1 The dataset exhibits an accuracy rate of more than 93% for first-level land use categories and over 90% for second-level land use categories. Precipitation data is acquired from the China Meteorological Data Network.2 The Statistical Yearbook of Hunan Province and the Statistical Yearbook of Rural Areas in Hunan Province are the sources used to obtain other socioeconomic data for this study. Table 2 shows the descriptive statistics of the data.
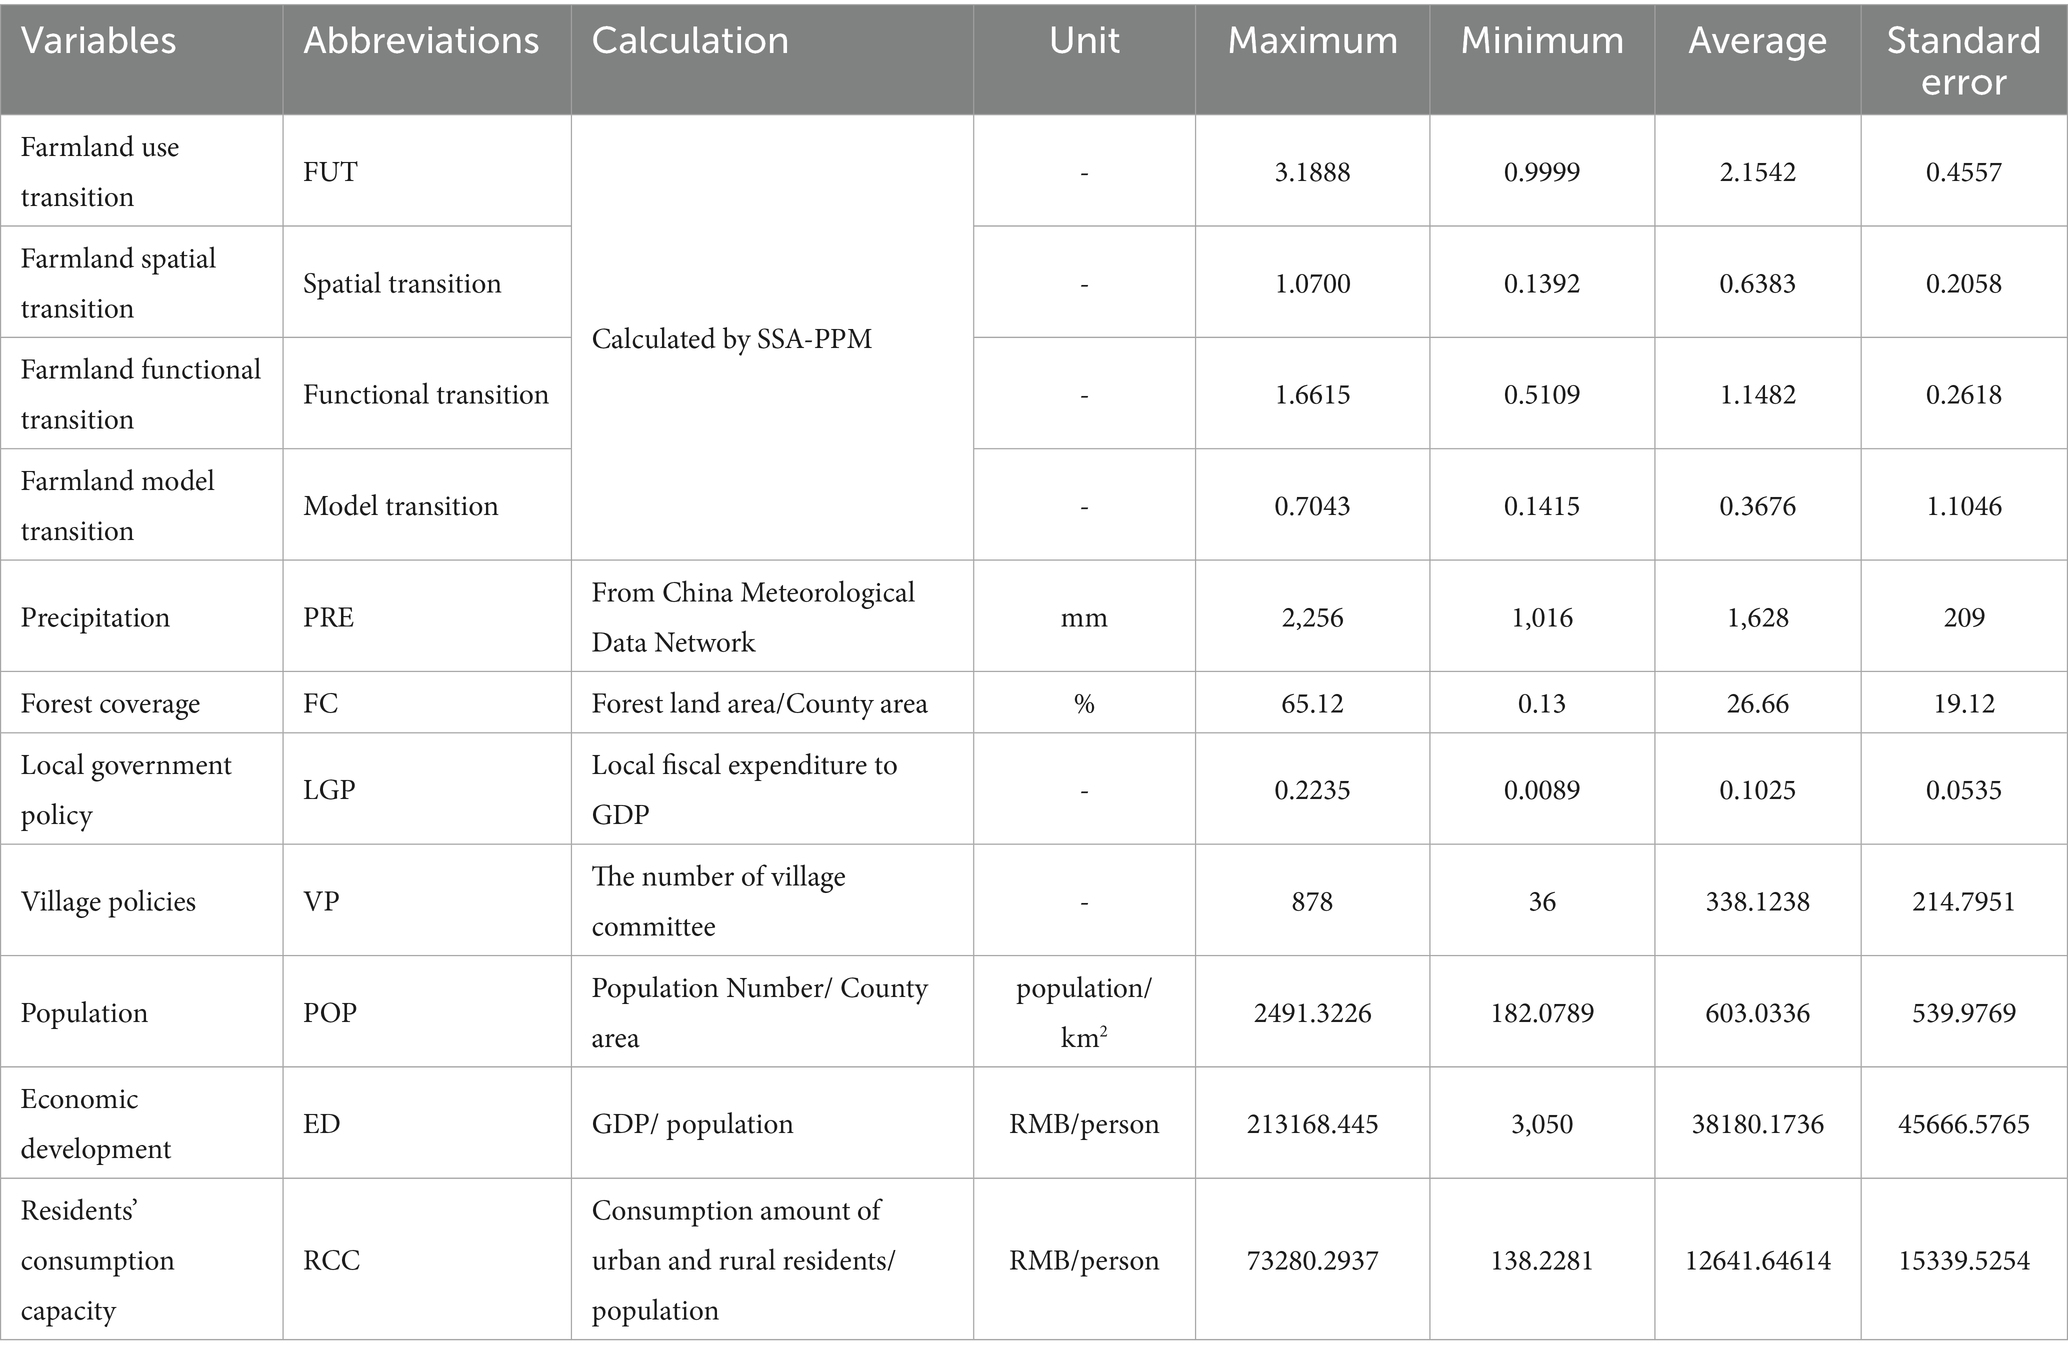
Table 2. Data descriptive statistics.
3 Results
3.1 The results of SSA-PPM
SSA-PPM is used to calculate the FUT levels. We also compare the results with those obtained using the RAGA (Real Coding Based Accelerating Genetic Algorithm). The optimal projection direction vectors are presented in Figure 4. Qmax calculated by SSA is 1.0504 and larger than those calculated by RAGA (1.0020). It demonstrates that the results computed by SSA are closer to the true optimal solution, as the objective function of PPM is to seek the maximum value. Thereby, consistent with existing research (Nguyen et al., 2022), SSA has greater accuracy and search capability than RAGA.
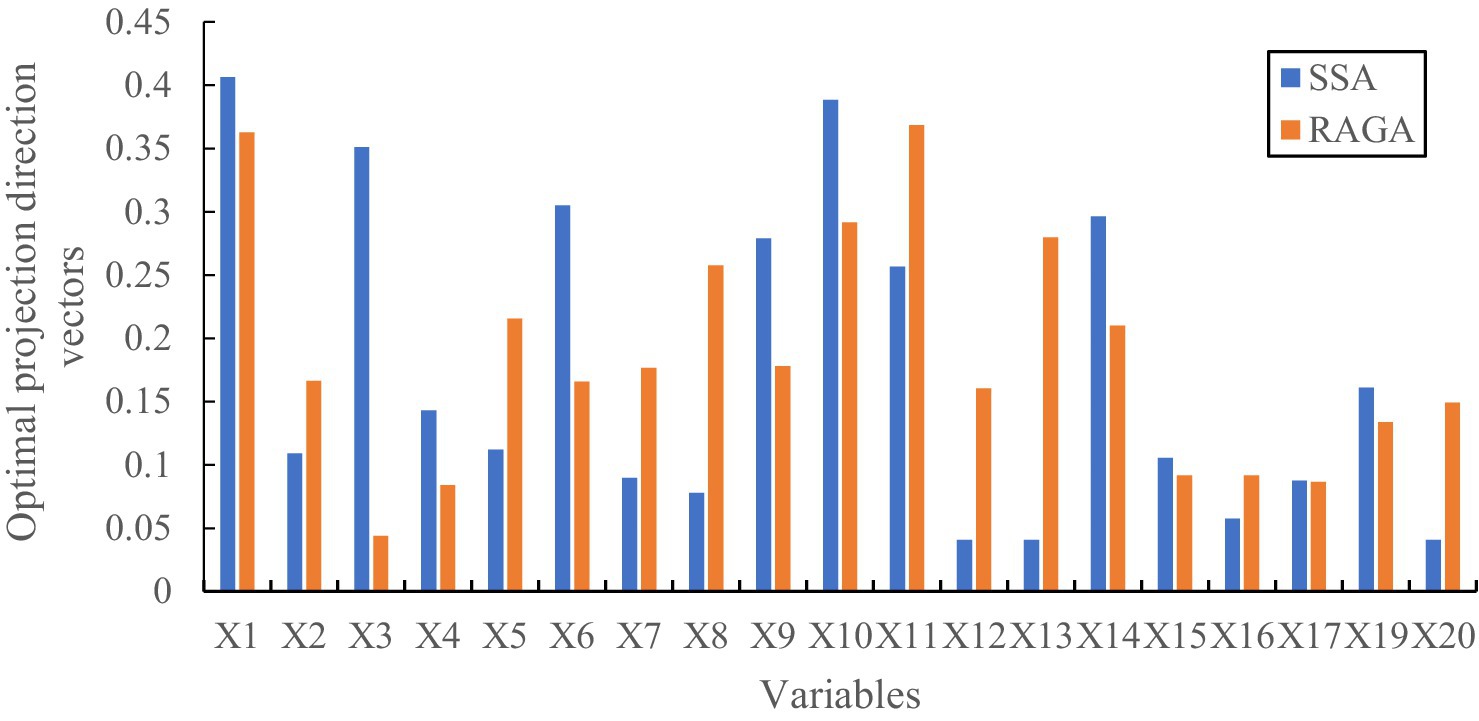
Figure 4. The optimal projection direction vectors.
SSA runs 5.7 times faster than RAGA, consistent with the findings of Xiang et al. (2022). The sum of the weights of the top 10 indicators calculated by SSA and RAGA are 2.9663 and 2.5890, respectively, with standard deviations of t 0.1285 (SSA), 0.0891 (RAGA). According to the research of Liu et al. (2021), it can be concluded that the indicator weight identification using SSA effectively retain the information differences between indicators and further differentiate important indicators. The sensitivity of indicator weight identification is proposed in response to the large sum of the top 10 indicators and the high standard deviation in the calculation results of SSA.
Therefore, the SSA method exhibits better stability, faster convergence, higher accuracy, and a superior ability to reflect indicators information than RAGA. The use of SSA-PPM to calculate FUT is scientifically sound.
3.2 The spatiotemporal pattern of FUT
FUT index is calculated using SSA-PPM, with the optimal projection vector derived from SSA-PPM serving as the multiplier. The sum of the standard values of the metrics is then used to derive spatial transition, functional transition, and model transition. Figure 5 presents the evaluation results of violin plot, and Figure 6 illustrates the spatial pattern of FUT.
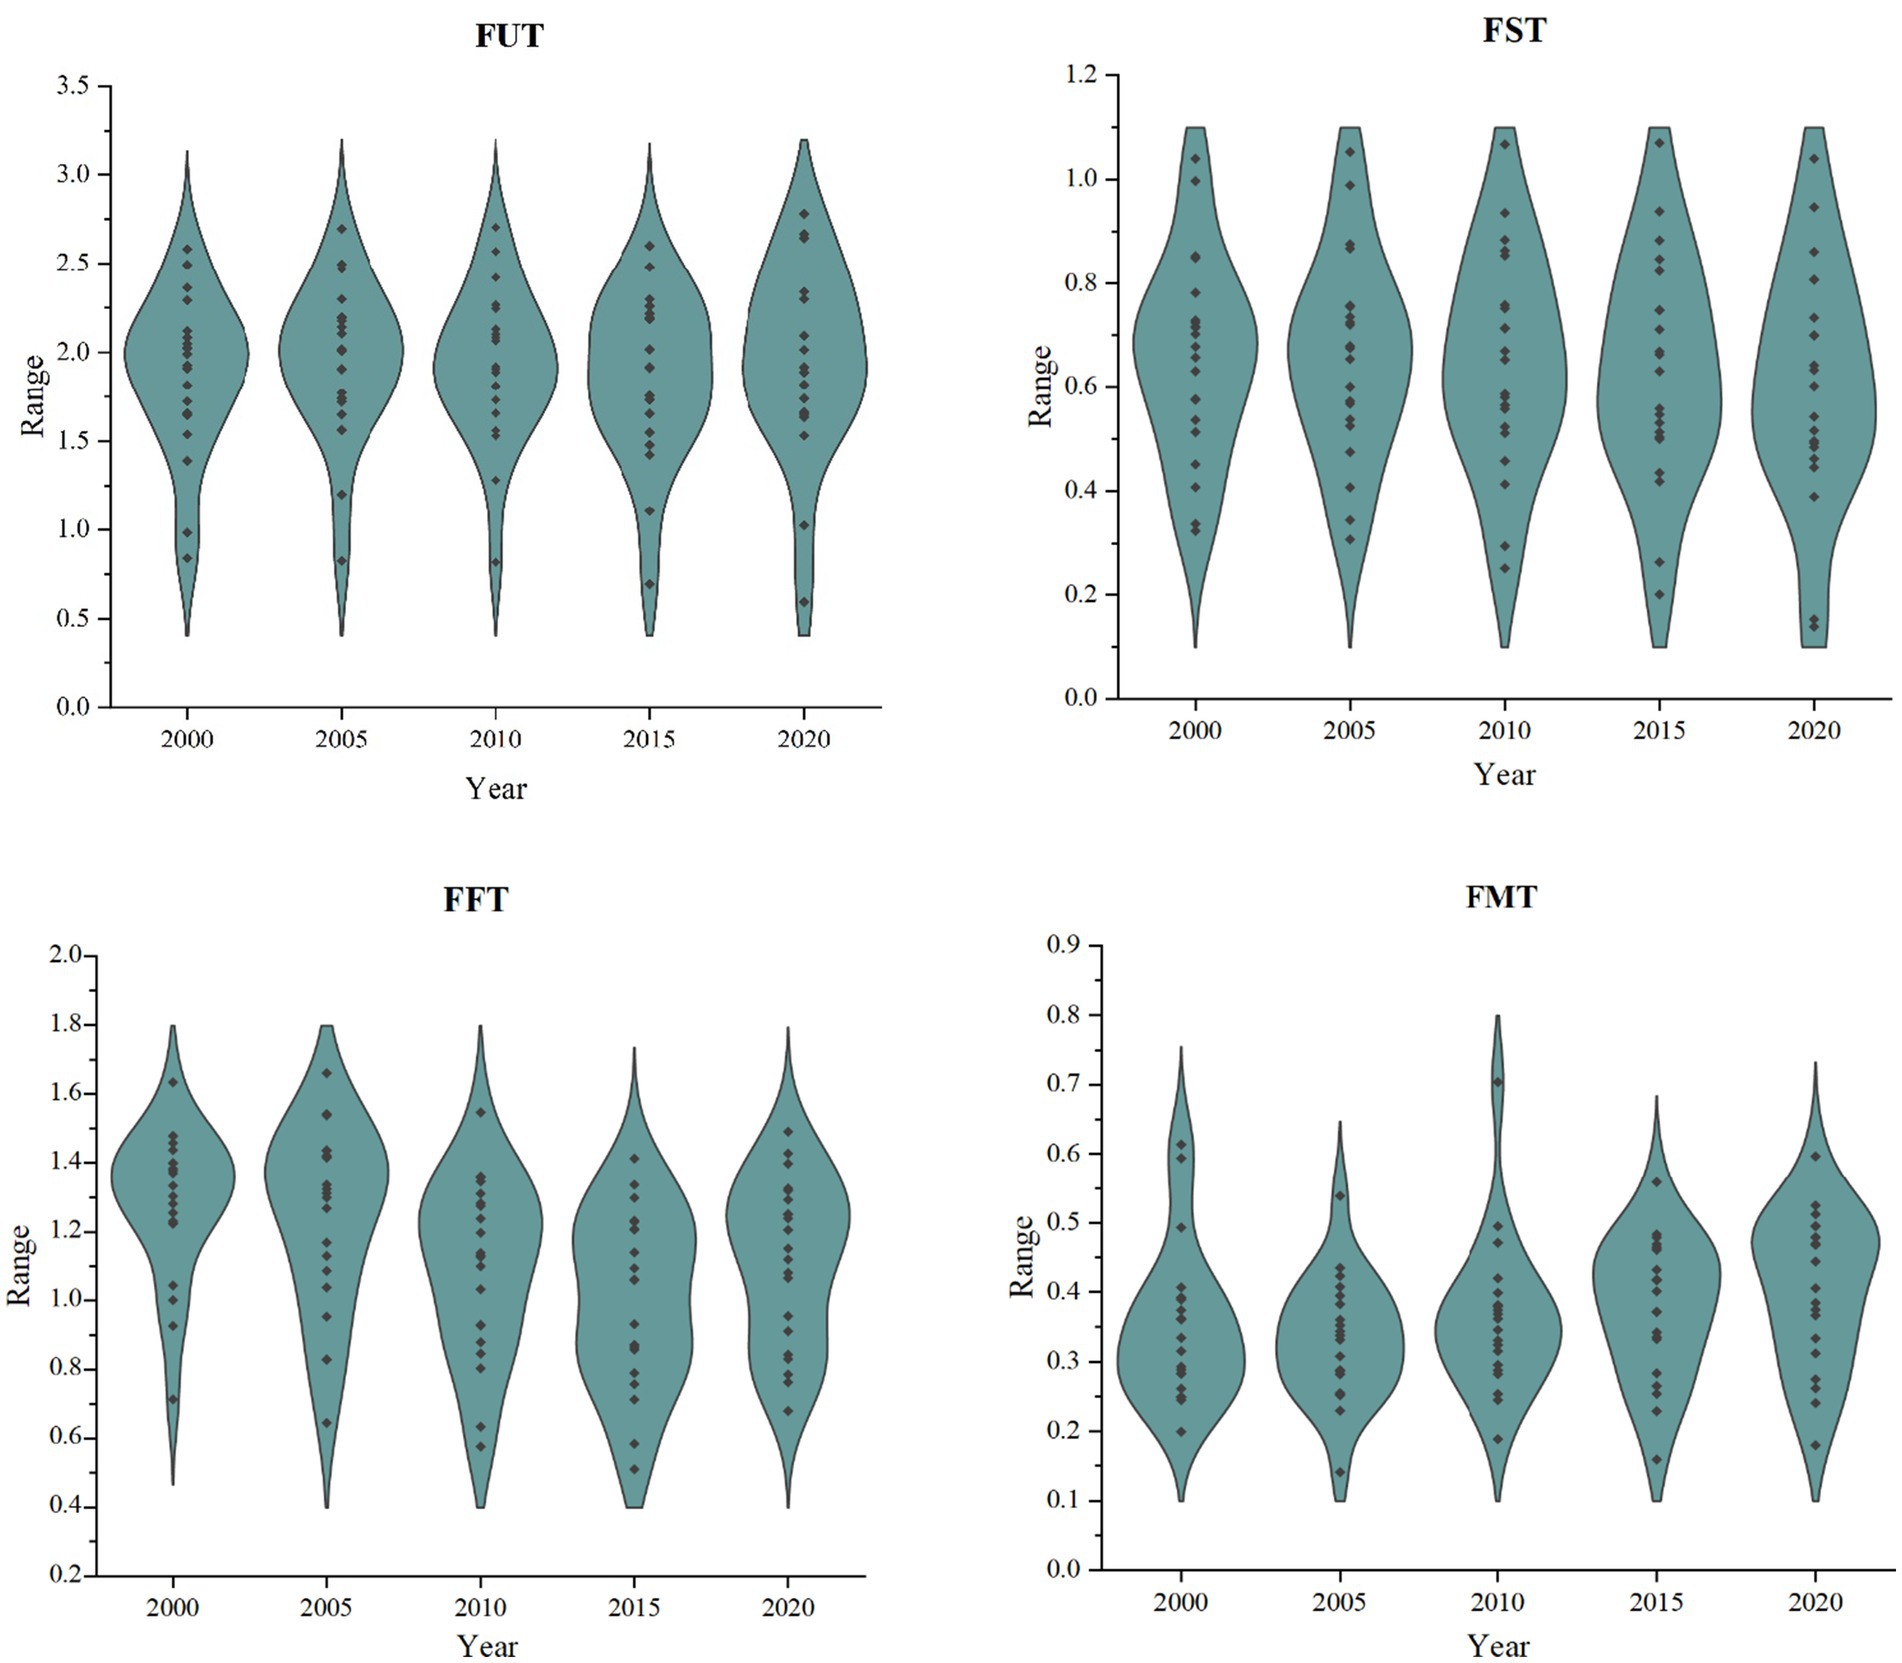
Figure 5. Evaluation results of violin plot.
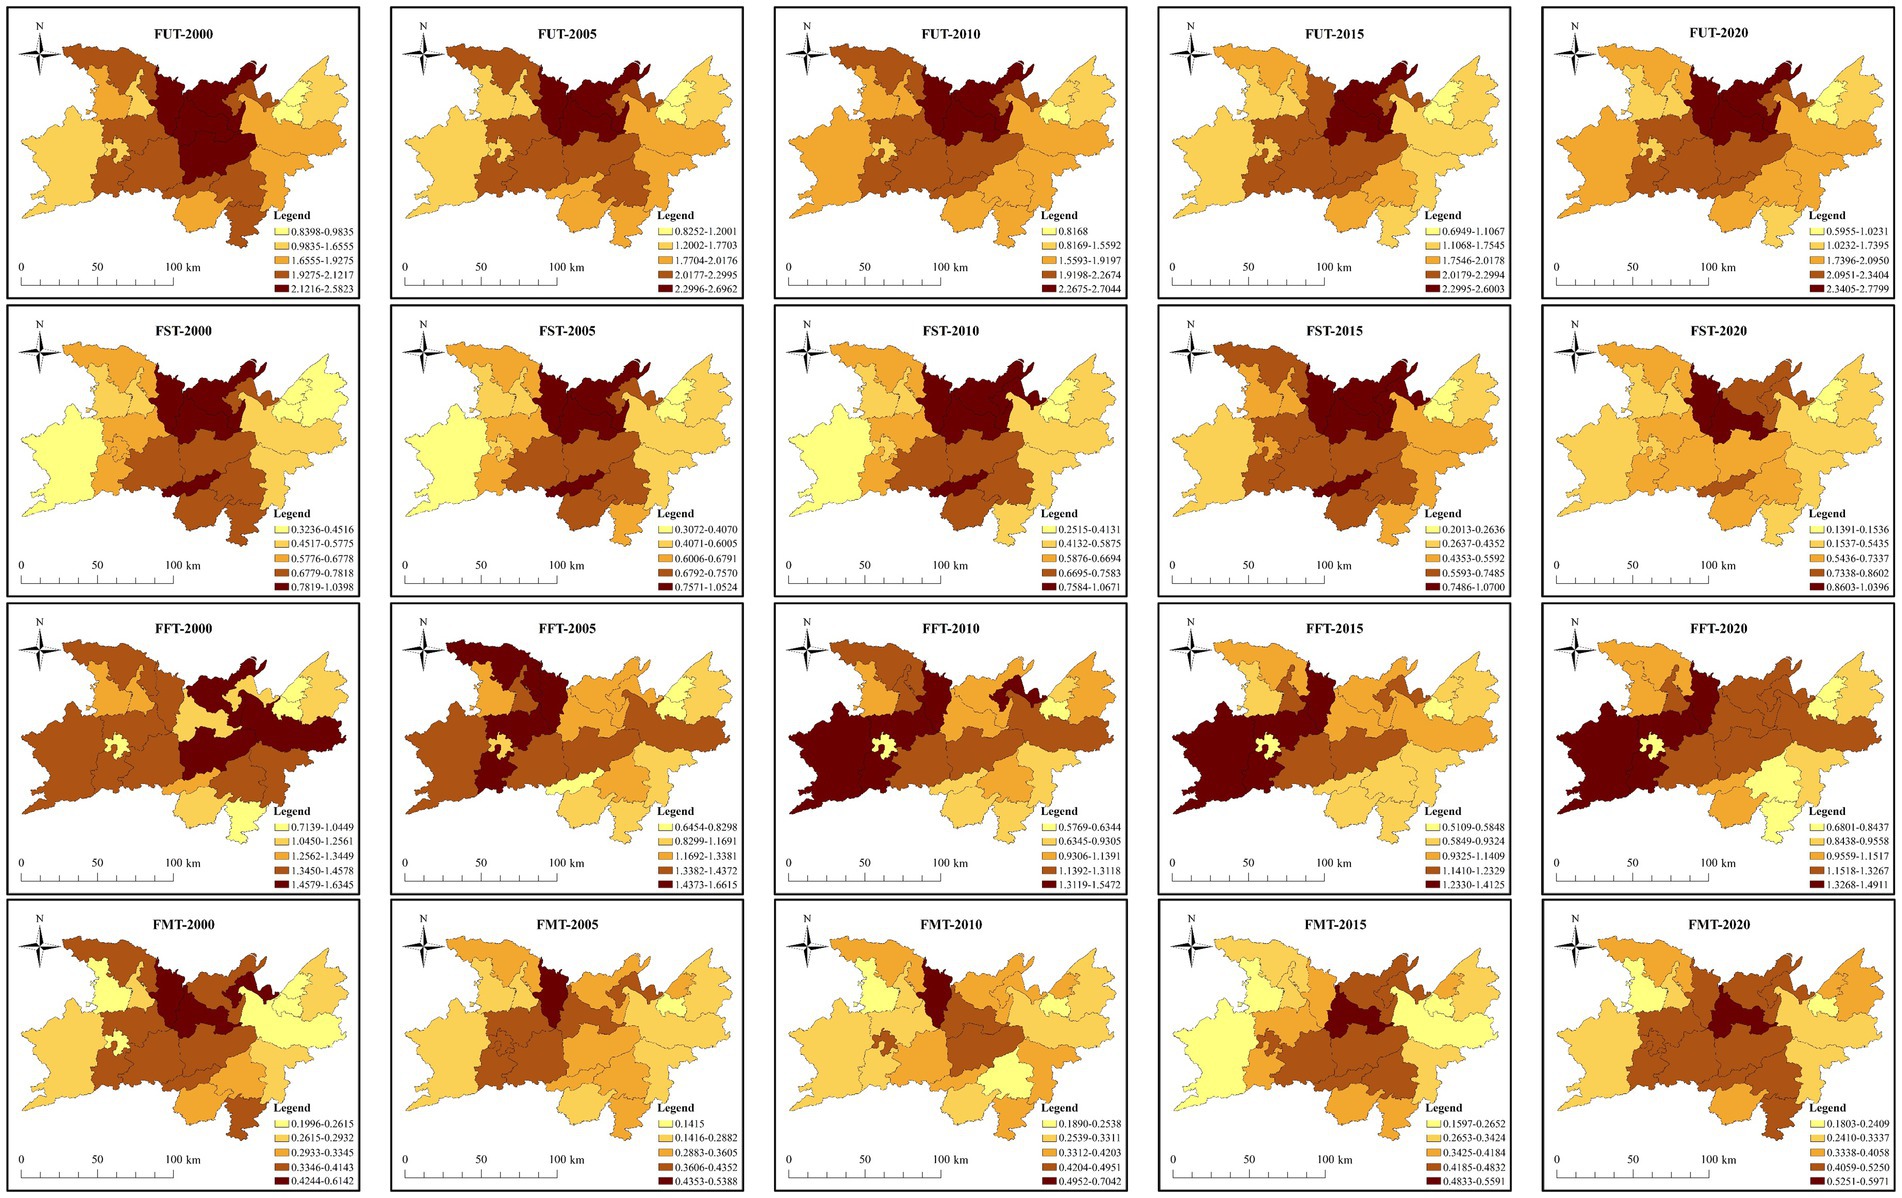
Figure 6. The spatial pattern of FUT.
3.2.1 Spatiotemporal patterns of total transition
Despite a slight decline observed between 2005 and 2015, the FUT index of DLR has demonstrated an overall fluctuating upward trend. Figure 5 illustrates that the FUT index values for the years 2000, 2005 and 2010 are concentrated within the range of 1.5 to 2.5. The range of data concentration areas exhibited an expansion in 2015 and 2020, with a more pronounced expansion observed in the range of violin heads in 2020. This suggests a further widening of regional differences.
As illustrated in Figure 6, the spatial pattern of FUT exhibits a high concentration in the central region and a low concentration in the peripheral areas. The mean values for each year are 1.8829, 1.9521, 1.9196, 1.8634 and 1.9565, respectively. The regions with the highest values in 2000 include Wangcheng, Junshan, Huarong, Xiangyin, Miluo, Dingcheng, Anxiang, Hanshou, Lixian, Ziyang, Heshan, Nanxian and Yuanjiang. The counties in Junshan, Huarong, Xiangyin, Dingcheng, Anxiang, Hanshou, Lixian, Ziyang, Nanxian and Yuanjiang are all above average in 2020. From 2000 to 2010, Wuling exhibited the greatest rate of change in transition (10.08%), while Heshan exhibited the lowest rate of change in transition (0.22%). From 2010 to 2020, Yueyanglou exhibited the greatest rate of change in transition (27.08%), while Lixian exhibited the lowest rate of change in transition (0.54%).
3.2.2 Spatiotemporal patterns of spatial transition
As shown in Figure 5, the concentration range of the spatial transition index decreases from 0.6–0.8 to 0.4–0.6 between 2000 and 2020. There is an overall decreasing trend in the spatial transition index. Meanwhile, the width of the tail of the violin gradually increased, and the range increased from 0.7162 to 0.9005. It means that the overall widening regional disparities in spatial transition became more pronounced. From 2000 to 2010, high spatial transition values are concentrated in the central region, while low values are in the eastern and western regions, as shown in Figure 6. Anxiang, Huarong, Nanxian and Ziyang are identified as high value areas of spatial transition. Higher rates of change are observed in Yunxi (0.2536) and Junshan (0.2037), while Ziyang and Heshan exhibit more gradual changes. From 2010 to 2020, the high value area shrinks and shifts to the north-central part of the DLR, with the highest rates of change occurring in Yueyanglou (0.5269) and Yunxi (0.3894).
3.2.3 Spatiotemporal patterns of functional transition
Functional transition is characterized by a decrease followed by an increase. As shown in Figure 5, the concentration range of the functional transition index values gradually expand from 2000 to 2020, with the range of the violin tails significantly expands. However, the value of the ranges decreases from 0.9205 to 0.8109, indicating a reduction in regional difference. Figure 6 shows that the high value area shifted from the east to the west from 2000 to 2010, with higher rates of change in Wuling (0.4478) and Huarong (0.3268), and more gradual changes in Jinshi and Yunxi. From 2010 to 2020, the range of high value areas decreases and then expands. Wuling (0.4478) and Ziyang (0.3729) exhibit the highest rates of change, while Yueyang and Linli show more stable changes.
3.2.4 Spatiotemporal patterns of model transition
Figure 5 illustrates the range of concentration of the model transition index, which increases from 0.2–0.3 to 0.4–0.5, indicating a rise in the level of model transition. The value of ranges increases from 0.4146 to 0.4167, suggesting that regional differences have widened, though not significantly. Figure 6 illustrates that from 2000 to 2010, the high value area for model transition is concentrated in the central region, while the surrounding counties are low value areas. The counties with the highest rate of change are Wuling (0.5285) and Yunxi (0.8022), while the changes in Ziyang and Heshan are relatively smooth changes. From 2010 to 2020, the high-value area expanded in all directions, with Nanxian serving as the central hub. In contrast, the low-value area notably contracted. The most pronounced changes are observed in Xiangyin and Dingcheng, Li County and Linli exhibits more gradual alterations.
3.3 The synergistic relationship of spatial transition, functional transition and model transition
As can be seen in Table 3, spatial transition is the ordinal covariate of model transition among the drivers of FUT. , , it indicates that spatial transition and model transition establish negative feedback mechanisms that facilitate their orderly evolution, and that the degree of order is decreasing. , , it leads to the conclusion that spatial transition is an inhibitor of model transition, whereas model transition is a stimulant of spatial transition. Meanwhile, neither the spatial transition and functional transition nor the functional transition and model transition exhibit co-evolutionary mechanisms, indicating a state of disorder.
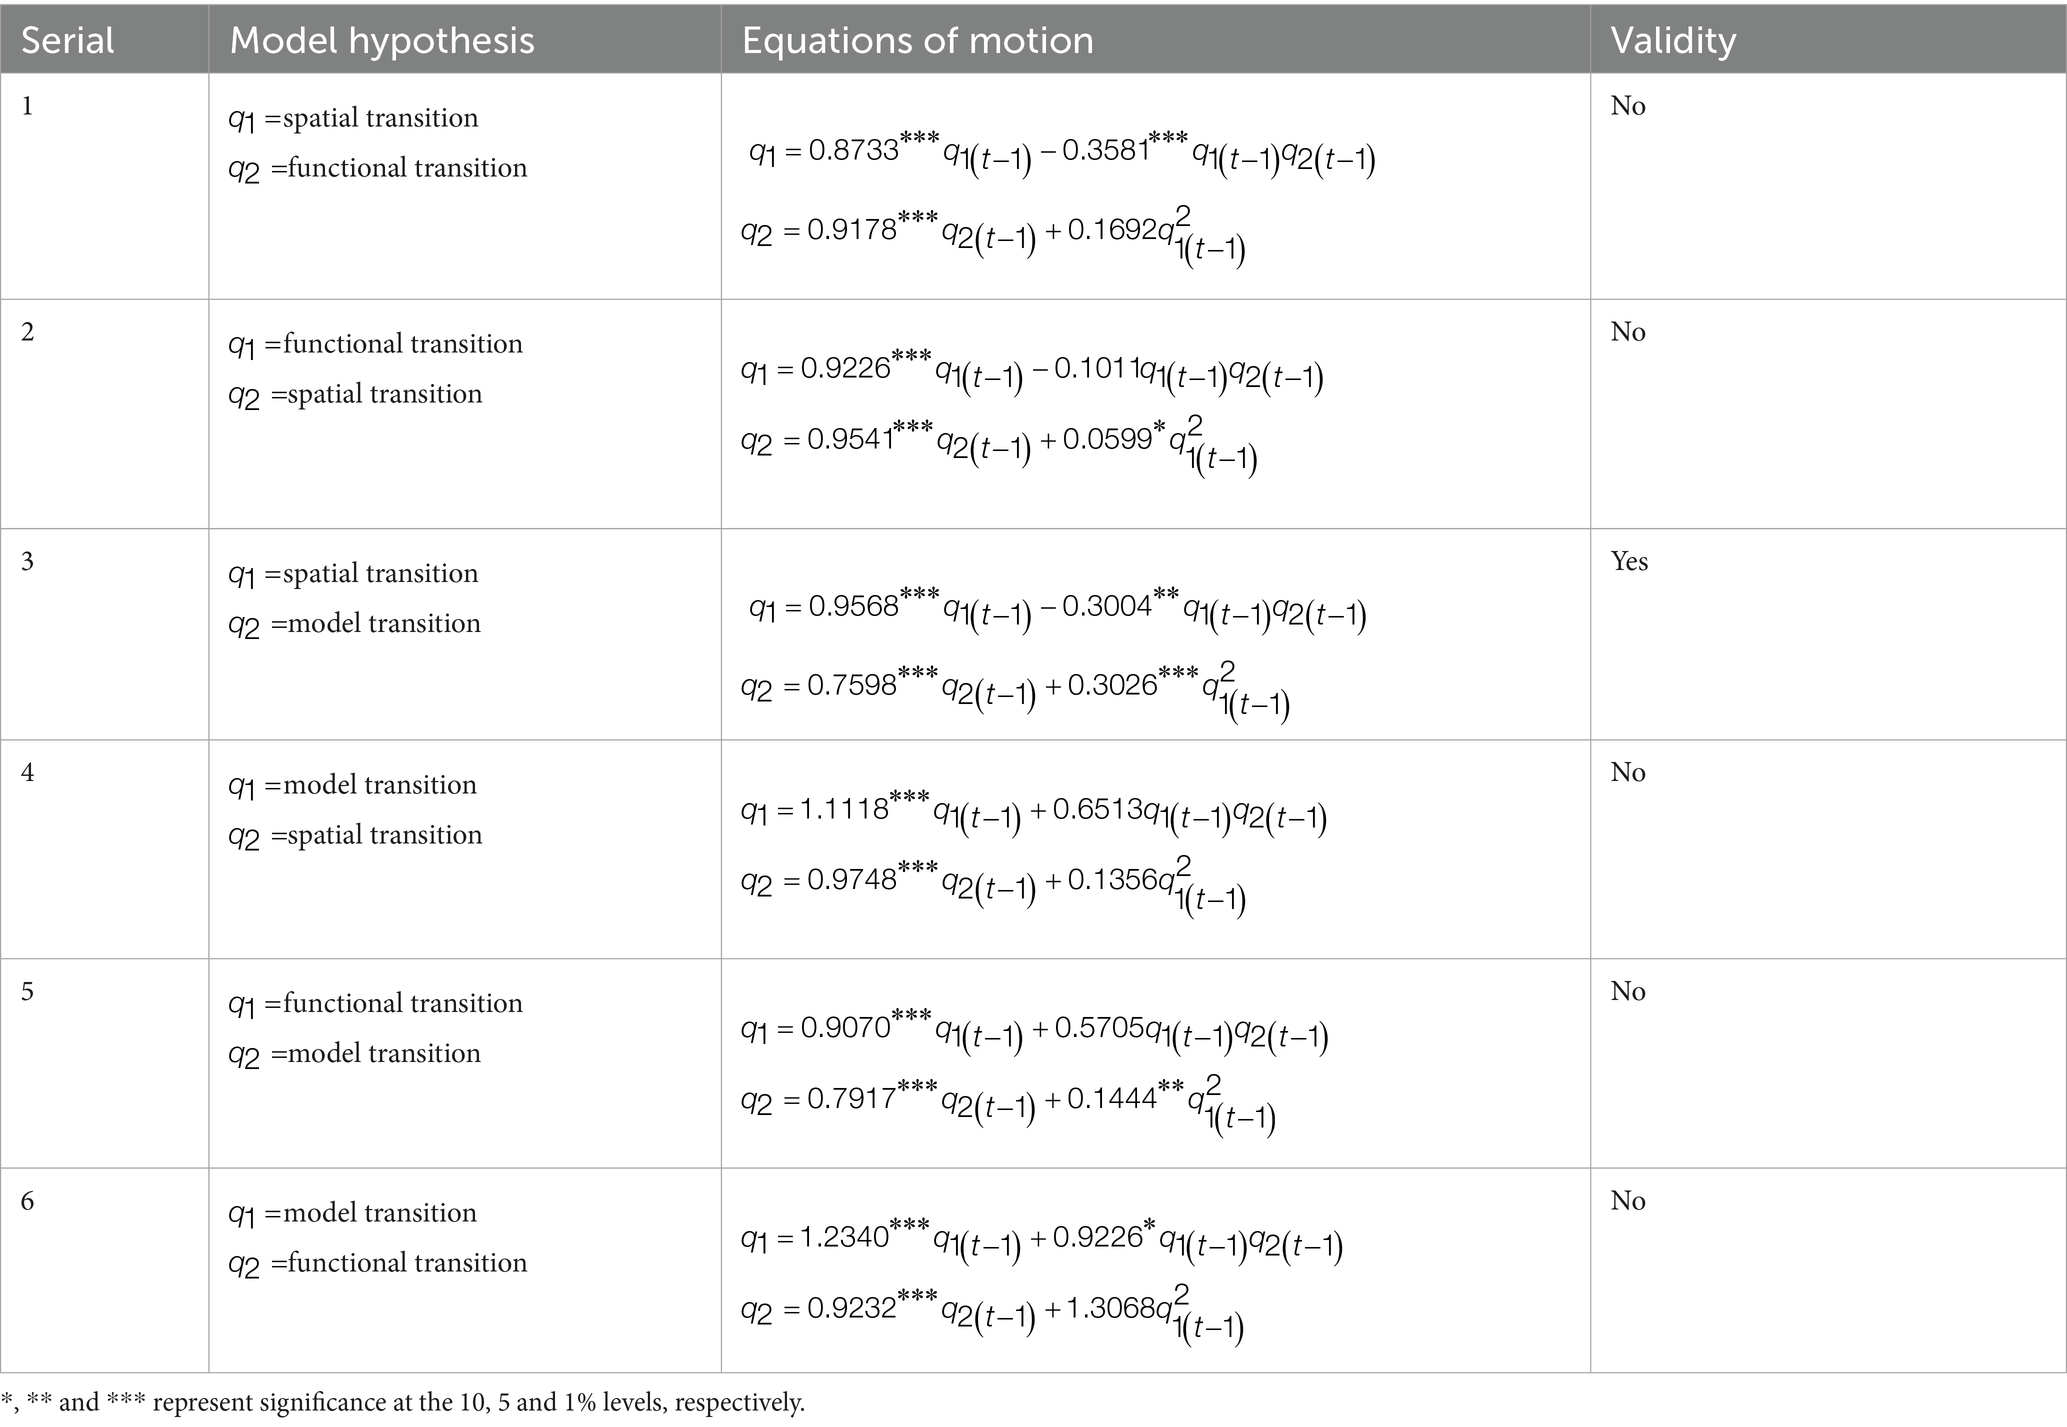
Table 3. The results of Haken model.
3.4 Spatial spillover effect of FUT
3.4.1 Spatial correlation analysis
As depicted in Figure 7, the Moran index for FUT in each year is significantly greater than 0, with values ranging from 0.3500 to 0.5000. Most county values are distributed in the first and third quadrants, indicating that high-value areas surrounded by high-value areas and low-value areas surrounded by low-value areas. This spatial distribution of FUT levels in the DLR is not entirely random but exhibits strong spatial clustering. Therefore, it is imperative for this study to use spatial factors to comprehensively understand the spatial interactions of FUT.
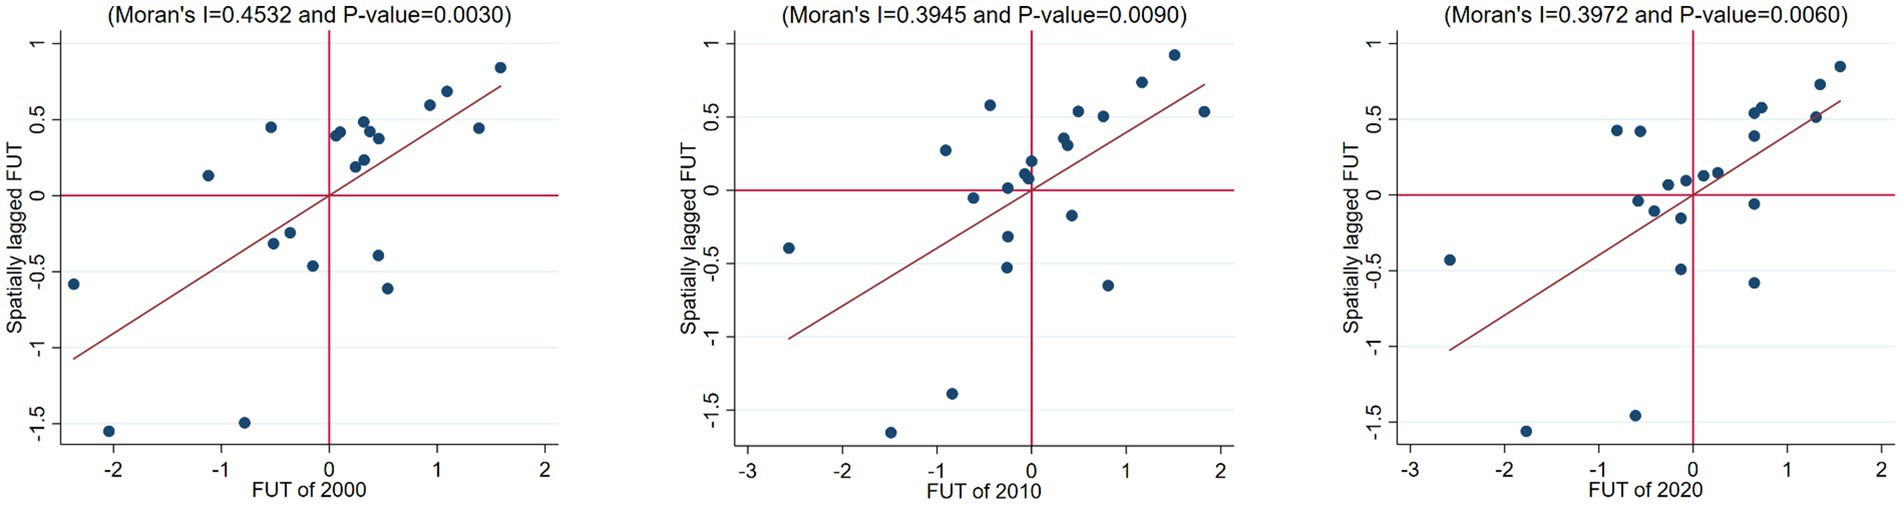
Figure 7. Moran scatterplot of FUT.
3.4.2 Spatial spillover effect of FUT
This study employes LM tests, Robust LM tests, and LR tests to determine the appropriate form of spatial econometric model (Results omitted). The results of the LM and Robust LM tests show that the Spatial Durbin model performs better than both the Spatial Error model and the Spatial Lag model. The LR test indicates that this study should adopt the spatial Durbin model with spatial fixed effects. The results in Table 4 show that the coefficient of the time lagged variable FUTt-1 is positive and statistically significant at the 5% confidence level, indicating a significant impact of previous social and economic development on current land use transition. The coefficient of the spatial lag term wij × FUT is positive and statistically significant at the 10% confidence level. An increase in FUT levels in neighboring areas also leads to higher FUT levels in the local area, consistent with the conclusions drawn from the global spatial autocorrelation analysis.
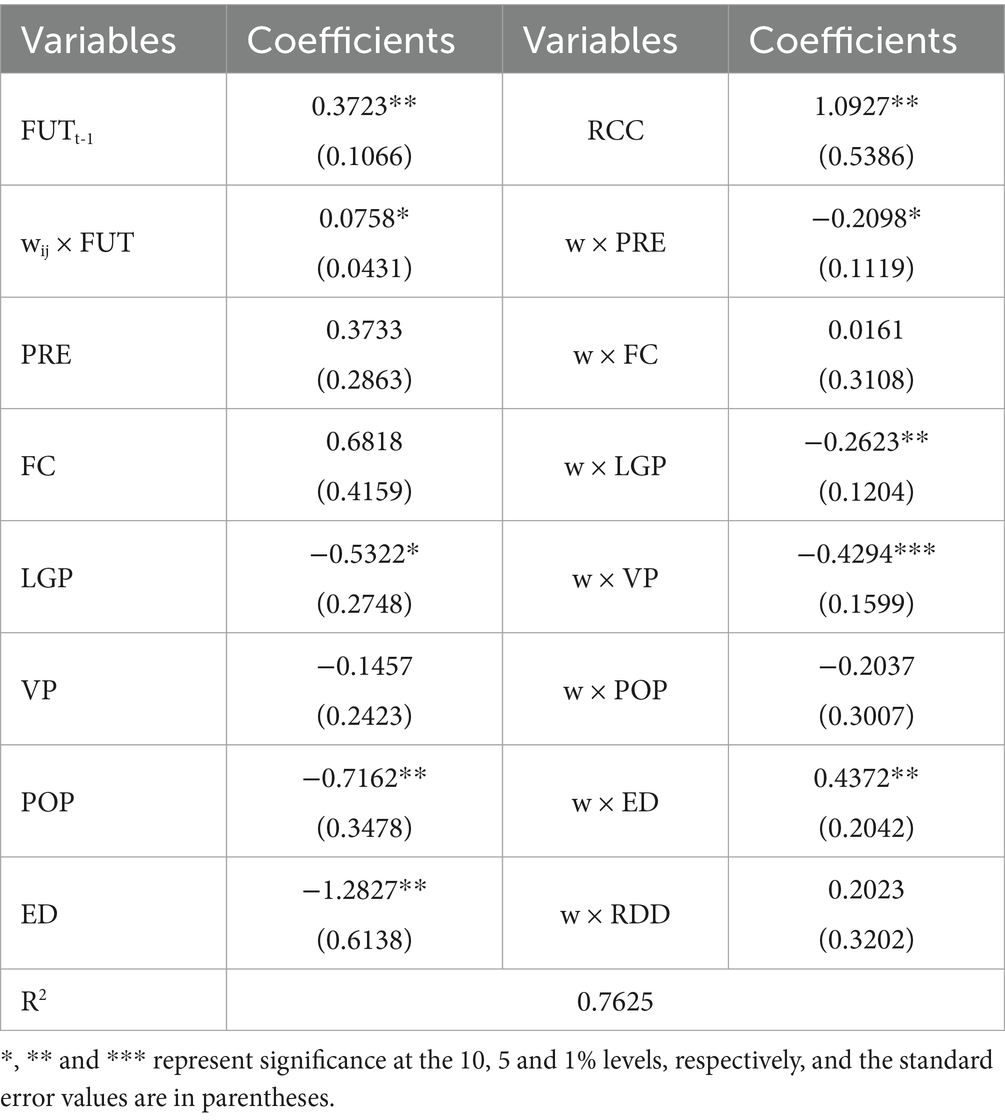
Table 4. The results of dynamic spatial Durbin model.
To accurately analyze the direct and spatial spillover effect of various variables on FUT, this study employs partial differential effects decomposition method. The results are shown in Figure 8. Among the natural factors, precipitation does not have a significant impact on FUT. Forest coverage has a significant positive short-term direct effect on FUT, while its short-term spatial spillover effect and long-term effects are not significant. Although forests create provide favorable natural conditions for FUT, the region’s forest coverage cannot expand infinitely.
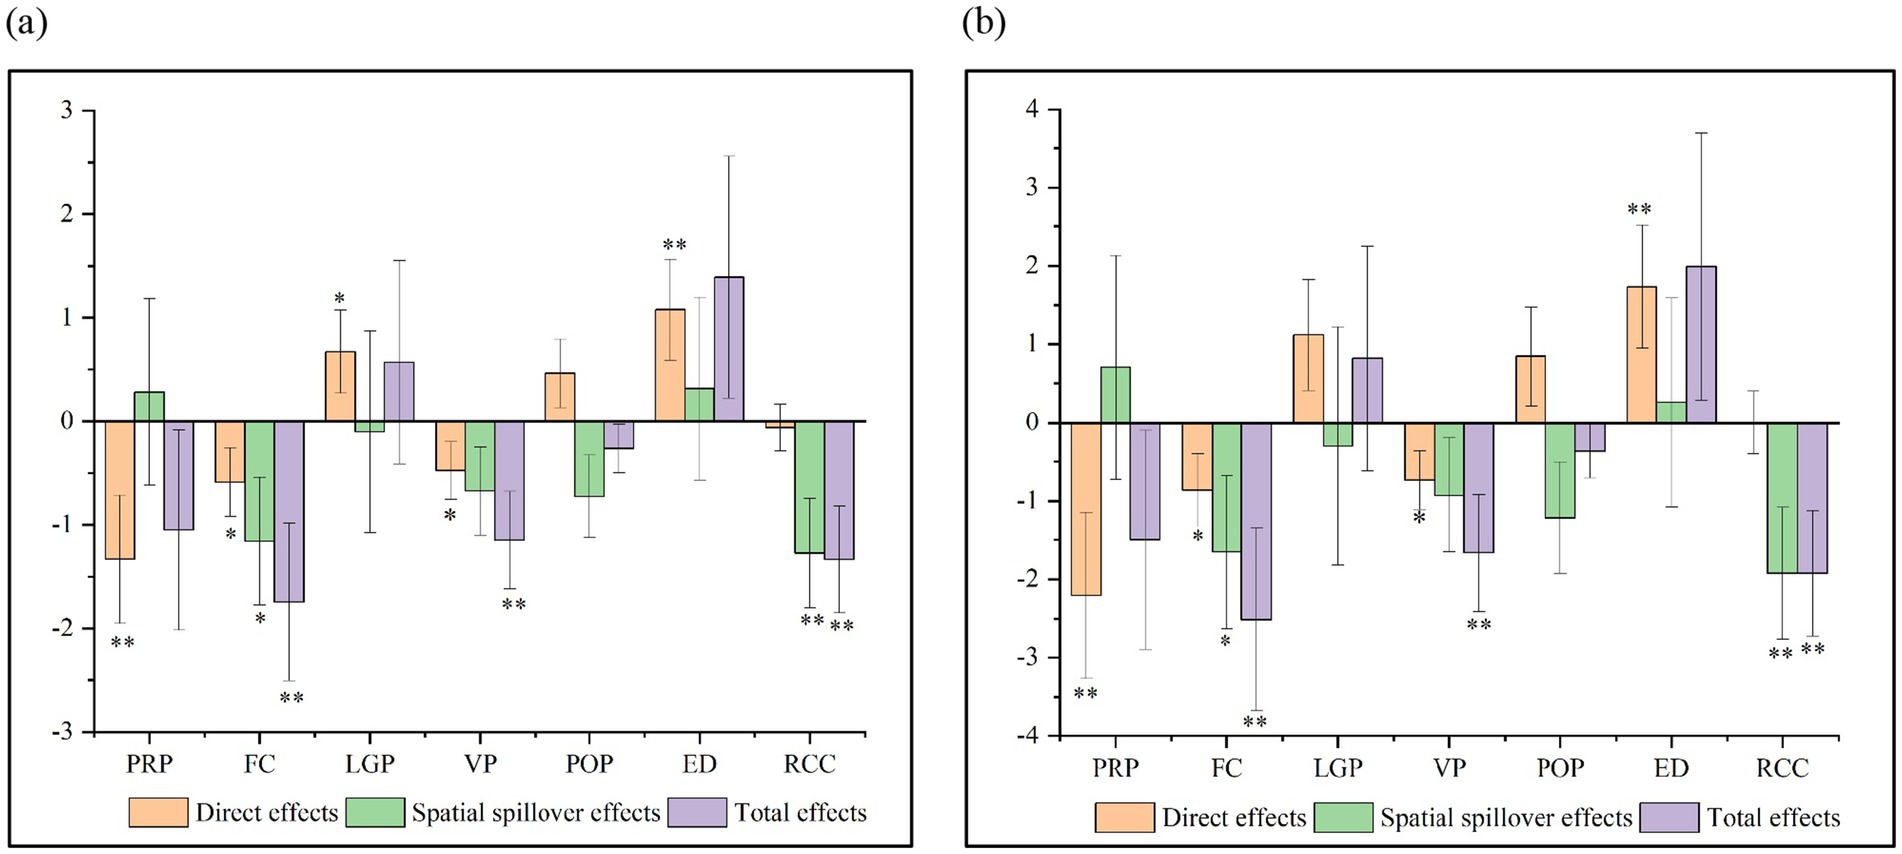
Figure 8. Results of the effect decomposition in the dynamic spatial Durbin model. *, ** and *** represent significance at the 10, 5 and 1% levels, respectively. (a) Short term, (b) long term.
Among policy factors, local government policies exert a negative direct effect on FUT in the short term, with no spatial spillover effect on FUT. This can be attributed to excessive market intervention and policy instability, which leave farmers’ land use decisions uninformed. Despite the Chinese government’s establishment of a redline for land protection, the lack of transparency in land approval and acquisition procedures has failed to effectively curb the decline in farmland quantity (Peng et al., 2020). These factors have prevented policies from producing favorable direct effects and spatial spillover influences on FUT. The policies of the village committee do not exhibit a significant positive direct or spatial spillover impact on FUT, aligning with the findings of Shi et al. (2018). The lack of attention from village committees toward farmers’ issues has led to a trust crisis between village committee and villagers.
Within the scope of socio-economic factors, economic development negatively impacts FUT. Both long-term and short-term direct consequences of population density on FUT are consistently adverse. Additionally, the spatial spillover effect of population density is negligible. The diminishing quantity of farmland and the loss of ecological diversity in farmland ecosystems can be attributed to the escalation in population growth and economic development, which subsequently has a negative impact on FUT.
The consumption capacity of residents have a direct positive effect on FUT, passing the significance test at a 5% level. Increasing residents’ consumption capacity can promote environmentally-friendly use of local farmland by altering demand structure. However, this effect does not extend significantly to neighboring areas due to the insufficient understanding of consumption upgrading directions by local governments.
4 Discussion
Compared to other regions, the FUT of DLR is uniquely influenced by the ecological vulnerability of the lake system and the high-intensity socio-economic activities. To address these challenges, the Chinese government has implemented the policy of returning farmland to wetland. Unlike previous studies that focused on FUT from a “spatial-function” perspective, this study adopts the analytical framework for FUT developed by Ke et al. (2021) and Cui et al. (2024). It considers the transition of farmland use modes and incorporates the goal of human-wetland harmony, which is central to the policy of returning farmland to wetland, as an important aspect of model transition. The ecological effects of the FUT induced by the returning farmland to wetland policy, such as enhanced carbon storage, water purification, and improved habitat quality in the lake area, have been confirmed by scholars (Ma et al., 2021; Peng et al., 2023). Therefore, this paper incorporates the returning farmland to wetland policy into the evaluation framework, broadening the connotation of FUT in the lake region.
This paper investigates the synergistic relationship among different morphologies. The findings demonstrate that spatial transition, as an ordinal covariate of model transition, and the two processes together form a mechanism for synergistic evolution. The expansion and fragmentation of farmland reduce resource efficiency and increase the risk of natural disasters (Liu et al., 2018). In this context, model transition can serve as an effective engineering tool to address spatial transition. Existing literature supports the notion that the policy of returning farmland to wetlands has successfully mitigated issues such as land salinization, desertification, and infertility caused by over-cultivation and unsustainable land-use practices (Bartolucci et al., 2021; Liu et al., 2024; Zhang et al., 2024). Synergistic FUT enables a coordinated transformation of spatial, functional, and modal morphologies, effectively reducing land erosion and restores land quality.
These findings illustrate that an increase in FUT within a local unit influences FUT in nearby areas. However, the selected explanatory variables in this study did not yield significant positive spatial spillover effect. The primary reason for this absence is the weak economic connections within the middle reaches of the Yangtze River, where the DLR is located. Factors such as over-concentration of economic factors and population growth act as major constraints to positive spatial linkages in the region (Xiao et al., 2021; Lee et al., 2024). Research has shown that the region must enhance interregional exchanges and cooperation to foster positive spatial linkages for interregional socio-economic development (Lv et al., 2023; Song et al., 2024). There remains untapped potential to bolster the generation of positive spatial spillover effect concerning political and socio-economic factors.
This study deepens the understanding of FUT in DLR through an examination of its spatial, functional, and model transitions. By clarifying the concept of FUT, the study enhances the theoretical framework of land use transition theory, particularly in the context of developing countries. Meanwhile, it explores the spatial spillover effect of FUT, advancing the application of spatial econometrics in land use research. The findings provide practical insights for optimizing land management policies and promoting coordinated regional development, ultimately leading to more efficient farmland use and effective ecological restoration. However, the FUT evaluation index system presented in this paper requires further improvement due to limited data availability. Future research should focus on measuring the level of synergy between the spatial, functional, and model transition subsystems and investigating the impact of the digital economy on FUT. At the same time, it is also necessary to predict the future transformation trend of FUT.
5 Conclusion and policy implication
5.1 Conclusion
This study integrates the model transition dimension, particularly adapted for lake regions, into the theoretical framework, enriching the understanding of land use transformation in ecologically sensitive zones. Meantime, it bridges spatial and functional transitions within a synergistic evolution mechanism and highlights their biased symbiotic relationship. It incorporates spatial spillover effect as an intrinsic component of land use transformation processes, thereby extending the theory’s explanatory power to account for interregional interactions.
The following research conclusions were obtained in this paper. (1) SSA-PPM is more suitable for computing FUT because it has better stability, faster convergence and higher accuracy. (2) FUT have demonstrated a fluctuating upward trend during the period of 2000–2020, with regional disparities becoming more pronounced. (3) Spatial transition serves as an ordinal covariate of model transition, forming a mechanism for synergistic evolution that exhibits a biased symbiotic relationship between the two entities. However, this mechanism is not observed in the case of functional transition. (4) The augmentation of FUT in neighboring areas contributes to the enhancement of FUT in the local region. However, there is a need to refine the positive spatial spillover effect of political and socio-economic factors on FUT.
5.2 Policy implication
The government should implement demand-driven land use policies and establish clear guidelines on the extent of farmland reclamation near lakes, ensuring that ecological preservation is prioritized alongside food security objectives. Coordinated development of cultivated land use and wetland conservation should be promoted through government-led land consolidation and other engineering interventions. In addition, it is vital for the government to implement policies that promote the adoption of advanced agricultural technologies, enabling a transition to more sustainable and efficient farming practices.
Enhancement of transportation infrastructure is a pivotal factor in the formation of constructive spatial connections between the political, economic, and social elements that shape land use patterns. The phenomenon of spatial spillover effect is evident in the evolution of land use dynamics. This study highlights a positive spatial correlation in land use within the DLR. However, the spillover effects of various influencing factors on land use patterns require further exploration. Given that a large portion of the DLR is covered by water bodies, the development of transportation infrastructure is constrained. To address this, each county in the DLR should allocate sufficient funding and employ advanced techniques in infrastructure development to improve regional connectivity, thereby enhancing the effectiveness of policies and fostering stronger socio-economic ties across the area.
Data availability statement
The raw data supporting the conclusions of this article will be made available by the authors, without undue reservation.
Ethics statement
Written informed consent was obtained from the individual(s) for the publication of any potentially identifiable images or data included in this article.
Author contributions
YT: Conceptualization, Methodology, Funding acquisition, Writing – original draft. ZT: Writing – review & editing, Data curation, Formal analysis. YJ: Writing – review & editing, Investigation, Resources. SO: Writing – review & editing, Validation, Visualization. WS: Writing – review & editing, Software, Data curation. XL: Writing – review & editing, Supervision, Project administration. HW: Writing – review & editing, Funding acquisition.
Funding
The author(s) declare that financial support was received for the research and/or publication of this article. This study was supported by Scientific Research Project of Hunan Provincial Department of Education (23B0202), Hunan Provincial Natural Science Foundation Project (2025JJ80010).
Conflict of interest
The authors declare that the research was conducted in the absence of any commercial or financial relationships that could be construed as a potential conflict of interest.
Generative AI statement
The author(s) declare that no Gen AI was used in the creation of this manuscript.
Any alternative text (alt text) provided alongside figures in this article has been generated by Frontiers with the support of artificial intelligence and reasonable efforts have been made to ensure accuracy, including review by the authors wherever possible. If you identify any issues, please contact us.
Publisher’s note
All claims expressed in this article are solely those of the authors and do not necessarily represent those of their affiliated organizations, or those of the publisher, the editors and the reviewers. Any product that may be evaluated in this article, or claim that may be made by its manufacturer, is not guaranteed or endorsed by the publisher.
Abbreviations
FUT, Farmland use transition; SSA, Sparrow search algorithm; PPM, Projection pursuit model; DLR, Dongting Lake Region.
Footnotes
References
Asare, A., Thodsen, H., Antwi, M., Opuni-Frimpong, E., and Sanful, P. O. (2021). Land use and land cover changes in Lake Bosumtwi watershed, Ghana (West Africa). Remote Sensing Applications: Society Environ. 23:100536. doi: 10.1016/j.rsase.2021.100536
Awadallah, M. A., Al-Betar, M. A., Doush, I. A., Makhadmeh, S. N., and Al-Naymat, G. (2023). Recent versions and applications of sparrow search algorithm. Archives Computational Methods Eng. 30, 2831–2858. doi: 10.1007/s11831-023-09887-z
Bartolucci, N. N., Anderson, T. R., and Ballantine, K. A. (2021). Restoration of retired agricultural land to wetland mitigates greenhouse gas emissions. Restor. Ecol. 29:e13314. doi: 10.1111/rec.13314
Boillat, S., Ceddia, M. G., and Bottazzi, P. (2022). The role of protected areas and land tenure regimes on forest loss in Bolivia: accounting for spatial spillovers. Glob. Environ. Chang. 76:102571. doi: 10.1016/j.gloenvcha.2022.102571
Chen, K., Wang, Y., Li, N., Xu, Y., Zheng, Y., Zhan, X., et al. (2023). The impact of farmland use transition on rural livelihood transformation in China. Habitat Int. 135:102784. doi: 10.1016/j.habitatint.2023.102784
Cui, H., Ke, S., and Lu, X. (2024). An empirical study on the impact of green transition of farmland use on agricultural economic growth: a case of Hubei Province of China. Habitat Int. 148:103090. doi: 10.1016/j.habitatint.2024.103090
Desta, H., and Fetene, A. (2020). Land-use and land-cover change in Lake Ziway watershed of the Ethiopian central Rift Valley region and its environmental impacts. Land Use Policy 96:104682. doi: 10.1016/j.landusepol.2020.104682
Dong, L., Wan, R., Li, B., Tan, Z., Yang, S., and Zhang, T. (2022). Spatiotemporal dynamics of lake wetland in the Wanjiang plain of the Yangtze River basin, China during the recent century. Ecol. Indic. 142:109295. doi: 10.1016/j.ecolind.2022.109295
Fang, J., and Zhao, L. (2024). Synergistic evolution mechanisms for improving open government data ecosystems using the Haken model. Libr. Inf. Sci. Res. 46:101284. doi: 10.1016/j.lisr.2024.101284
Ge, D., Long, H., Zhang, Y., Ma, L., and Li, T. (2018). Farmland transition and its influences on grain production in China. Land Use Policy 70, 94–105. doi: 10.1016/j.landusepol.2017.10.010
Ge, D., Zhou, G., Qiao, W., and Yang, M. (2020). Land use transition and rural spatial governance: mechanism, framework and perspectives. J. Geogr. Sci. 30, 1325–1340. doi: 10.1007/s11442-020-1784-x
Geels, F. W., Kern, F., and Clark, W. C. (2023). System transitions research and sustainable development: challenges, progress, and prospects. Proc. Natl. Acad. Sci. 120:e2206230120. doi: 10.1073/pnas.2206230120
Kassouri, Y. (2021). Monitoring the spatial spillover effect of urbanization on water, built-up land and ecological footprints in sub-Saharan Africa. J. Environ. Manag. 300:113690. doi: 10.1016/j.jenvman.2021.113690
Ke, S., Cui, H., Lu, X., Hou, J., and Wu, Y. (2021). Research on the spatial-temporal pattern and mechanisms of green transition of farmland use: a case of Hubei Province. China Land Sci. 35, 64–74. doi: 10.11994/zgtdkx.20211115.141330
Kolkiewicz, A., Rice, G., and Xie, Y. (2021). Projection pursuit based tests of normality with functional data. J. Stat. Plann. Inference 211, 326–339. doi: 10.1016/j.jspi.2020.07.001
Lee, C., Yan, J., and Li, T. (2024). Ecological resilience of city clusters in the middle reaches of Yangtze River. J. Clean. Prod. 443:141082. doi: 10.1016/j.jclepro.2024.141082
Li, L., Wang, L., and Qi, Z. (2021). The spatiotemporal variation of farmland use transition and its critical influential factors in coordinated urban-rural regions: a case of Chongqing in western China. Sustain. Cities Soc. 70:102921. doi: 10.1016/j.scs.2021.102921
Liang, X., Jin, X., Ren, J., Gu, Z., and Zhou, Y. (2020). A research framework of land use transition in Suzhou City coupled with land use structure and landscape multifunctionality. Sci. Total Environ. 737:139932. doi: 10.1016/j.scitotenv.2020.139932
Liao, L., Long, H., and Ma, E. (2023). Factors influencing the recessive morphology of farmland use under labor changes based on production input willingness and behavior of farmers. J. Geogr. Sci. 33, 2467–2488. doi: 10.1007/s11442-023-2185-8
Liu, R., Dong, J., Jiang, L., Ge, Y., Fan, C., Yang, T., et al. (2024). Agricultural flood resistance enhanced after returning farmlands to lakes. Proc. Natl. Acad. Sci. 121:e1884000175. doi: 10.1073/pnas.2410967121
Liu, X., Liu, Z., Zhong, H., Jian, Y., and Shi, L. (2021). Multi-dimension evaluation of rural development degree and its uncertainties: a comparison analysis based on three different weighting assignment methods. Ecol. Indic. 130:108096. doi: 10.1016/j.ecolind.2021.108096
Liu, J., Wilson, M., Hu, G., Liu, J., Wu, J., and Yu, M. (2018). How does habitat fragmentation affect the biodiversity and ecosystem functioning relationship? Landsc. Ecol. 33, 341–352. doi: 10.1007/s10980-018-0620-5
Liu, Y., and Zhou, Y. (2021). Reflections on China's food security and land use policy under rapid urbanization. Land Use Policy 109:105699. doi: 10.1016/j.landusepol.2021.105699
Liu, Y., Zou, L., and Wang, Y. (2020). Spatial-temporal characteristics and influencing factors of agricultural eco-efficiency in China in recent 40 years. Land Use Policy 97:104794. doi: 10.1016/j.landusepol.2020.104794
Long, X., Lin, H., An, X., Chen, S., Qi, S., and Zhang, M. (2022). Evaluation and analysis of ecosystem service value based on land use/cover change in Dongting Lake wetland. Ecol. Indic. 136:108619. doi: 10.1016/j.ecolind.2022.108619
Long, H., Qu, Y., Tu, S., Zhang, Y., and Jiang, Y. (2020). Development of land use transitions research in China. J. Geogr. Sci. 30, 1195–1214. doi: 10.1007/s11442-020-1777-9
Lv, T., Fu, S., Zhang, X., Hu, H., and Zhang, Y. (2023). Spatiotemporal evolution and convergence of agricultural eco-efficiency in the middle reaches of the Yangtze River. Physics Chem. Earth, Parts A/B/C 131:103438. doi: 10.1016/j.pce.2023.103438
Ma, L., Long, H., Tu, S., Zhang, Y., and Zheng, Y. (2020). Farmland transition in China and its policy implications. Land Use Policy 92:104470. doi: 10.1016/j.landusepol.2020.104470
Ma, S., Qiao, Y., Jiang, J., Wang, L., and Zhang, J. (2021). Incorporating the implementation intensity of returning farmland to lakes into policymaking and ecosystem management: a case study of the Jianghuai ecological economic zone, China. J. Clean. Prod. 306:127284. doi: 10.1016/j.jclepro.2021.127284
Meyfroidt, P., Ryan, C. M., Archer, E., and Aspinall, R. (2022). Ten facts about land systems for sustainability. Proc. Natl. Acad. Sci. USA 119:e2109217118. doi: 10.1073/pnas.2109217118
Meyfroidt, P., Roy Chowdhury, R., de Bremond, A., Ellis, E. C., Erb, K. H., Filatova, T., et al. (2018). Middle-range theories of land system change. Glob. Environ. Chang. 53, 52–67. doi: 10.1016/j.gloenvcha.2018.08.006
Min, M., Miao, C., Duan, X., and Yan, W. (2022). Formation mechanisms and general characteristics of cultivated land use patterns in the Chaohu Lake Basin, China. Land Use Policy 117:106093. doi: 10.1016/j.landusepol.2022.106093
Nguyen, T., Ngo, T., Dao, T., and Nguyen, T. (2022). Microgrid operations planning based on improving the flying sparrow search algorithm. Symmetry 14:168. doi: 10.3390/sym14010168
Peng, J., Wen, L., Fu, L., and Yi, M. (2020). Total factor productivity of cultivated land use in China under environmental constraints: temporal and spatial variations and their influencing factors. Environ. Sci. Pollut. Res. 27, 18443–18462. doi: 10.1007/s11356-020-08264-8
Peng, H., Xia, H., Shi, Q., Tang, Z., and Chen, H. (2023). Monitoring of wetland cover changes in protected areas to trade-offs between ecological conservation and food security: a case study from the Dongting Lake, China. Ecol. Inform. 78:102338. doi: 10.1016/j.ecoinf.2023.102338
Shi, X., Chen, S., Ma, X., and Lan, J. (2018). Heterogeneity in interventions in village committee and farmland circulation: intermediary versus regulatory effects. Land Use Policy 74, 291–300. doi: 10.1016/j.landusepol.2018.02.030
Song, J., Yuan, M., and Zhang, L. (2024). Spatial effects of new-type urbanization affecting regional high-quality development: a case study of urban agglomerations in the middle reaches of the Yangtze River. Econ. Geogr. 44, 43–51. doi: 10.15957/j.cnki.jjdl.2024.11.005
Wang, M., and Huang, X. (2024). Inhibit or promote: spatial impacts of multifunctional farmland use transition on grain production from the perspective of major function-oriented zoning. Habitat Int. 152:103172. doi: 10.1016/j.habitatint.2024.103172
Wang, M., Huang, X., Chen, Y., and Tang, Y. (2024a). Multifunctional farmland use transition and its impact on synergistic governance efficiency for pollution reduction, carbon mitigation, and production increase: a perspective of major function-oriented zoning. Habitat Int. 153:103207. doi: 10.1016/j.habitatint.2024.103207
Wang, M., Lin, N., Dong, Y., Huang, X., Ma, Y., Tang, Y., et al. (2023). The impact of farmland use transition on CO2 emissions and its spatial spillover effect from the perspective of major function-oriented zoning: the case of Huang-Huai-Hai plain. Environ. Impact Assess. Rev. 103:107254. doi: 10.1016/j.eiar.2023.107254
Wang, M., Lin, N., Huang, X., and Tang, Y. (2024b). Mitigating farmland use carbon emissions: the dynamic role of farmland use transition. J. Clean. Prod. 450:141866. doi: 10.1016/j.jclepro.2024.141866
Xiang, J., Tan, S., Tan, X., Long, J., Xiao, T., and Wang, W. (2022). Spatiotemporal assessment of water security in the Dongting Lake region: insights from projection pursuit method and sparrow search algorithm. J. Clean. Prod. 378:134447. doi: 10.1016/j.jclepro.2022.134447
Xiao, J., Watanabe, T., Lu, X., Chand, M. B., Umarhadi, D. A., Chen, X., et al. (2022). Integrating land use/land cover change with change in functional zones’ boundary of the east Dongting Lake National Nature Reserve, China. Physics Chem. Earth, Parts A/B/C 126:103041. doi: 10.1016/j.pce.2021.103041
Xiao, Z., Zhong, Y., Feng, X., and Mao, W. (2021). Spatial structure evolution and effect analysis of urban agglomeration in middle reaches of Yangtze River. Resour. Environ. Yangtze Basin. 30, 2607–2617. doi: 10.11870/cjlyzyyhj202111004
Xue, J., and Shen, B. (2020). A novel swarm intelligence optimization approach: sparrow search algorithm. Syst. Sci. Control Eng. 8, 22–34. doi: 10.1080/21642583.2019.1708830
Yang, L., Wang, L., Yu, D., Yao, R., Li, C., He, Q., et al. (2020). Four decades of wetland changes in Dongting Lake using Landsat observations during 1978–2018. J. Hydrol. 587:124954. doi: 10.1016/j.jhydrol.2020.124954
Yang, X., and Zhang, L. (2020). Diagnose barriers to sustainable development: a study on “desensitization” in urban residents' green purchasing behavior. Sustain. Dev. 28, 143–154. doi: 10.1002/sd.1978
Yin, G., Lin, Z., Jiang, X., Yan, H., and Wang, X. (2019). Spatiotemporal differentiations of arable land use intensity—a comparative study of two typical grain producing regions in northern and southern China. J. Clean. Prod. 208, 1159–1170. doi: 10.1016/j.jclepro.2018.10.143
Yu, J., Yi, L., Xie, B., Li, X., Li, J., Xiao, J., et al. (2023). Matching and coupling coordination between the supply and demand for ecosystem services in Hunan Province, China. Ecol. Indic. 157:111303. doi: 10.1016/j.ecolind.2023.111303
Zhang, J., Chen, Y., Li, Z., Song, J., Fang, G., Li, Y., et al. (2019). Study on the utilization efficiency of land and water resources in the Aral Sea basin, Central Asia. Sustain. Cities Soc. 51:101693. doi: 10.1016/j.scs.2019.101693
Zhang, Y., Huang, D., Jin, X., Li, L., Wang, C., Wang, Y., et al. (2024). Long-term wetland biomonitoring highlights the differential impact of land use on macroinvertebrate diversity in Dongting Lake in China. Commun. Earth Environ. 5:32. doi: 10.1038/s43247-024-01203-2
Zhang, M., Tan, S., Pan, Z., Hao, D., Zhang, X., and Chen, Z. (2022). The spatial spillover effect and nonlinear relationship analysis between land resource misallocation and environmental pollution: evidence from China. J. Environ. Manag. 321:115873. doi: 10.1016/j.jenvman.2022.115873
Zhou, Y., Li, X., and Liu, Y. (2021). Cultivated land protection and rational use in China. Land Use Policy 106:105454. doi: 10.1016/j.landusepol.2021.105454
Keywords: farmland use transition, Dongting Lake region, spatial spillover effect, ecological restoration, sustainable land use policy
Citation: Tang Y, Tan Z, Jiang Y, Ouyang S, Sun W, Lu X and Wang H (2025) Farmland use transition and its spatial spillover effect in the Dongting Lake region. Front. Sustain. Food Syst. 9:1656397. doi: 10.3389/fsufs.2025.1656397
Edited by:
Weiwei Zheng, Northwest A&F University, ChinaReviewed by:
Zhen Xie, Fujian Agriculture and Forestry University, ChinaLong Cheng, Shandong University, China
Zhengzhou Ji, Henan Agricultural University, China
Copyright © 2025 Tang, Tan, Jiang, Ouyang, Sun, Lu and Wang. This is an open-access article distributed under the terms of the Creative Commons Attribution License (CC BY). The use, distribution or reproduction in other forums is permitted, provided the original author(s) and the copyright owner(s) are credited and that the original publication in this journal is cited, in accordance with accepted academic practice. No use, distribution or reproduction is permitted which does not comply with these terms.
*Correspondence: Hongzheng Wang, d2FuZ2hvbmd6aGVuZ2xhQDE2My5jb20=