 V. Ratna Reddy
 Dil Bahadur Rahut
- 1Livelihoods and Natural Resources Management Institute, Hyderabad, India
- 2Asian Development Bank Institute, Tokyo, Japan
Achieving the global policy objective of doubling farm productivity and incomes of smallholder farms squarely depends on the viability and sustenance of the farm sector in general and smallholder farms in particular. In South Asia, smallholder farms account for more than 70% of the total farms and cultivate about 50% of the cropped area. This paper assesses the trends in the status, potential, and future of smallholder farms across five countries of South Asia, namely India, Pakistan, Bangladesh, Sri Lanka, and Bhutan. It is argued that neglecting agriculture and smallholder farms amounts to putting the future self-sufficiency and food security objectives of South Asian nations in jeopardy and has global ramifications. This is more so in the fast-changing global geo-political scenario. Given the precarious nature of food security and the importance of agriculture in terms of its contribution to food self-sufficiency and employment, policies need to be farmer-centric, especially smallholder-centric. Experience among the countries (like low productivity, high price risk, climate vulnerability, etc.) indicates that economic viability and profit margins are the crux of the problem. Addressing these problems is a policy priority across the developing world. In all the countries, smallholders suffer from low access to all four capitals, especially natural capital.
1 Introduction
The last decade has given rise to an important debate on the role and importance of smallholder farms in global agriculture, food, and nutrition security. The debate started with the Food and Agriculture Organisation (FAO) reporting that small farm holders (<2 ha) account for 84% of the total farms (>608 million), 12% of crop land worldwide (Lowder et al., 2021; FAO, 2014). But these figures vary across regions and countries. Asia and Sub-Saharan Africa (SSA) account for the majority of the smallholder farms, with a 30–40% share of the agricultural area. In Latin America, they account for only 25% of the total holdings and hold a tiny share of farm area (Lowder et al., 2016). At the global level, the contribution of smallholder farms (<2 ha.) to farm production ranges between 18 and 58%. The wide variations in the estimates are due to the differences in methodologies and the number of countries and crops covered, as some estimates are based on modeling (Herrero et al., 2017) and some are based on mean agriculture area (Samberg et al., 2016).
On the other hand, estimates based on direct measurement indicate that smallholders contribute 30–34% of the global food production, while accounting for 24% of farms and 29% of the crops (Ricciardi et al., 2018a, 2018b). These estimates seem to be more realistic, though they are based on only 55 countries and 154 crops. Besides, food grown on farms often meets between 25 and 40% of that farm’s own requirements (Gillman, 2019). While these estimates capture the inter-crop variations, they may not reflect the wide variations among the countries. Given their sheer numbers (about 500 million), smallholder farms support most of the agriculture-dependent population (30–60%) in low- and middle-income countries. As per FAO estimates, smallholder farms provide livelihoods for 2 billion people (FAO, 2015). Hence, the performance of smallholder farms is critical for alleviating global poverty and malnutrition. The concentration of smallholder farms is the highest among Asian countries, especially South Asian. The number of smallholder farms are increasing across countries over the years, and their farm size has been declining in most countries (Lipton, 2009).
In South Asia, smallholder farms account for more than 70% of the total farms and cultivate about 50% of the cropped area. If informal tenancy in these countries is considered, smallholders operate more land than reported, and hence their contribution to agriculture production is substantially more than it is actually reported (Murthy and Reddy, 2017; Reddy and Murthy, 2021). Smallholder farmers’ contribution to food security is also high as they allocate more area to cereal crops. Though the contribution of agriculture to GDP is declining fast, its contribution to food security is quite high. Neglect or mismanagement of the agriculture sector comes at our peril. And smallholder farms are the major contributors in this regard. Continuation of these farmers in agriculture is a necessary condition for ensuring self-sufficiency and food security in South Asia.
2 Purpose, objectives, and approach
2.1 Purpose
South Asia houses the largest number (and share) of smallholder farms in the world. Smallholders in South Asia also account for a larger share of agriculture area when compared to other developing countries. This is the only region where most countries are reporting a sharp decline in average farm size, and the average farm size varies among the countries. Most of the countries in the region adopt very intensive farm practices (crop intensity, input intensity, etc.) and are trying to move toward sustainable intensification. They face the greatest resource stress, especially water and land degradation. The use of groundwater for irrigation has grown at a phenomenal rate in this region. All the countries in this region are expected to or even experiencing severe climate change impacts on agriculture. A comparative study of these countries could provide very useful policy lessons for other developing countries.
Despite significant economic progress, most of the South Asian countries are struggling to tackle the problems of food and nutrition security. The recent pandemic and the Ukraine conflict have brought these issues to the forefront, especially in countries like Sri Lanka and Pakistan. One of the main reasons for this is the declining importance of the agriculture sector at the policy level (reforms and investments). Besides, increasing climate risks are further depleting the viability of the sector. Experience of these countries clearly shows that economic transition of shifting the population from agriculture to industry or services is not a feasible option in the short to medium runs. As a result, most countries face the policy challenge of dealing with swelling smallholder farms and declining farm size. Any policy lax in this regard could push the countries out of their self-sufficiency comfort zone into food insecurity, hunger, and poverty in a very short span.
2.2 Objectives
Achieving the global policy objective of doubling farm productivity and incomes of smallholder farms squarely depends on designing appropriate and effective policies that would improve the viability and sustain the agriculture sector in general and smallholder farms in particular. However, these initiatives need to be backed by scientific evidence coupled with ground-level realities in these countries to develop feasible and effective country-specific policies. This paper addresses this gap by adopting an integrated nature-based framework and approach. The main purpose of this paper is to assess the status, potential, and prospects of smallholder agriculture in South Asia. Specific objectives include:
a. Assess the magnitude and status of smallholder farms in selected South Asian countries.
b. Identify the real constraints for increasing the status of smallholders.
c. Suggest policy options.
2.3 Approach
Smallholders are defined as farmers operating or cultivating up to 2 ha. of land without any adjustment for quality of land or access to water/irrigation. This paper assesses the status of smallholder farms across five countries of South Asia, namely India, Pakistan, Bangladesh, Sri Lanka, and Bhutan. The selection of these five countries has been purposive. The selected countries are at different stages of food security. While India is the largest country with a high proportion of smallholder farms, Pakistan provides a different picture with the highest average farm size in the region. Pakistan, along with Sri Lanka, has faced food security issues in recent years. Sri Lanka is one of the first countries in South Asia to initiate reforms in agriculture. Bangladesh not only has the very low average farm size but also has the highest farm intensification in South Asia. Though Bhutan is a small nation, it is the only nation in Asia that practices sustainable agriculture. These five countries represent varying agro-climatic conditions, demographics, macro-economic structures, access to land and water resources, among other factors. More importantly, these countries differ in terms of achieving food security and resilience in dealing with uncertainties associated with international and national shocks or exigencies. The assessment is based on the data gathered at the regional and national level by the world agriculture census and other country-level published sources. This paper covers the new millennium period, i.e., the year 2000 to the latest year for which data are available, as the availability of agricultural census data is not consistent across the countries. For instance, very detailed data across farm size classes is available for India, while size-class-wise data are not collected in Bhutan. Besides, smallholders are defined differently in some countries. Based on the availability, data analysis is carried out across time periods and regions of each country, as well as between smallholders (<2 hectares) and medium and large farms (>2 hectares). The assessment is carried out using the sustainable livelihoods framework, which provides a more comprehensive understanding of the status of the smallholder farms.
Here, four capitals, namely, natural, physical, human, and financial, are assessed. Though the number of indicators represents each capital, some important indicators are considered due to the data constraints. Natural capital is represented by climate, land, and water, including average rainfall, average size of holding, number of parcels, type of ownership (own or leased), land use, extent of irrigation (% area irrigated), and kind of irrigation (surface and groundwater). Physical capital covered livestock ownership, livestock composition (milch cattle and draught power), and farm machinery (tractors, irrigation pumps, and farm implements like sprayers, etc.). The average age and education status of the household represent human capital. Financial capital is represented by income, source of income, expenditure, access to credit, sources of credit, and indebtedness. However, the use of these indicators varies across the five countries depending on the availability of data. Social capital is excluded as indicators are not available at the country level.
Research on smallholders was initially focused on their relative production efficiency (Sen, 1964). With the weakening of the relationship between farm size and productivity after the 1990s due to the changing economic conditions (Hazell et al., 2010), the research focus in recent years has been on the number of smallholders and their contribution to food security (Lowder et al., 2016; Ricciardi et al., 2018a, 2018b). In this regard, the present study is the first of its kind to undertake a comprehensive view of the smallholder farms in South Asia, especially after the 1990s. The novelty of this research is that it not only assesses the number of smallholders and their contribution to food production but also their status in terms of multi-dimensional aspects, viz., natural, physical, human, and financial capitals, and their capabilities. Apart from being novel in the approach, the livelihoods framework facilitates comparability and generalizability as each capital is critical for the household’s wellbeing, irrespective of their location. These capitals are represented by the number of indicators and used extensively in assessing household wellbeing in various regions, such as Asia and Africa. The strengths and weaknesses of each capital across countries highlight the position of smallholders in relation to each capital at the country level as well as the South Asia level.
2.4 Limitations of the study
Given the broader canvas of the study and the need for temporal data across the countries, available data differ in terms of data generated and their composition. The study mainly draws from the world agricultural census carried out by the FAO at regular intervals. While the agricultural census is a rich source of information, it has the following limitations.
i. The definition of smallholder farms is not uniform across countries. In most countries, <2 ha is used, but in Pakistan, <5 ha is used to define smallholders. In some countries, size-holding-wise information is not provided for all the years the census was conducted.
ii. Agriculture census were conducted for different periods, but not covering the same years uniformly across the countries. Data is not available for the same years in all the countries.
iii. Data formats also differ across the countries.
Though these inconsistencies impact the comparative assessment across the countries, they provide good insights into the trends over the years that help draw comparisons across the countries. And the differences in smallholder definitions are often based on the country-specific agrarian structure, and hence, the comparisons between smallholders and largeholders remain valid. In each country, the disadvantages of smallholders remain the same irrespective of their holding size. Similarly, though data formats differ in terms of indicators from country to country, they do cover country-specific areas.
The analysis has been carried out keeping these limitations in mind. Conclusions are drawn using the changes over time and the relative performance of smallholder farms in each country. Nevertheless, data consistency in terms of common indicators and timelines would undoubtedly enhance the validity of the comparisons across the countries. It is critical to consider these aspects while carrying out the future agricultural census. Common formats covering all the important aspects and indicators need to be used across the countries. The formats should capture at least the standard definition of smallholders by covering more categories of size holdings. And common timelines need to be maintained across the countries, with a minimum time difference.
3 Typology of smallholder farms
Smallholder farmers are a diverse group with wide variations in access to different capitals and household capabilities. Accordingly, smallholder farmers can be put under three typologies (Figure 1). These typologies are: (i) move-up; (ii) stay-in; and (iii) move-out. Move-up is defined as those farmers who prosper in agriculture and move up the income ladder. Stay-in are those who make enough to continue in farming (no incentive to shift out of agriculture). Move-out are those who are not able to survive in agriculture and hence move out. While the DFID framework (Department for International Development, 2015) for agriculture provides three similar typologies, Fan and Rue (2020) discuss two typologies, namely moving-up and moving-out. However, the third group (“stay-in”) is the worst affected, as they can neither “move-out” nor “move-up.” That is, for them, neither farming is profitable nor are alternative livelihoods attractive enough. These farmers are characterized by low access to resources and poor capabilities in terms of human and financial capital. These farmers tend to mix subsistence and commercial crops with low marketable surpluses. Their main constraints include low market access and failing to get remunerative prices for their limited marketable surplus. They face scale disadvantages in input as well as output markets, viz., low bargaining power. Their dependency on traders for input purchases as well as output sales makes them victims of exploitation. Coupled with the absence of extension services, they tend to apply excessive and imbalanced inputs, resulting in resource degradation.
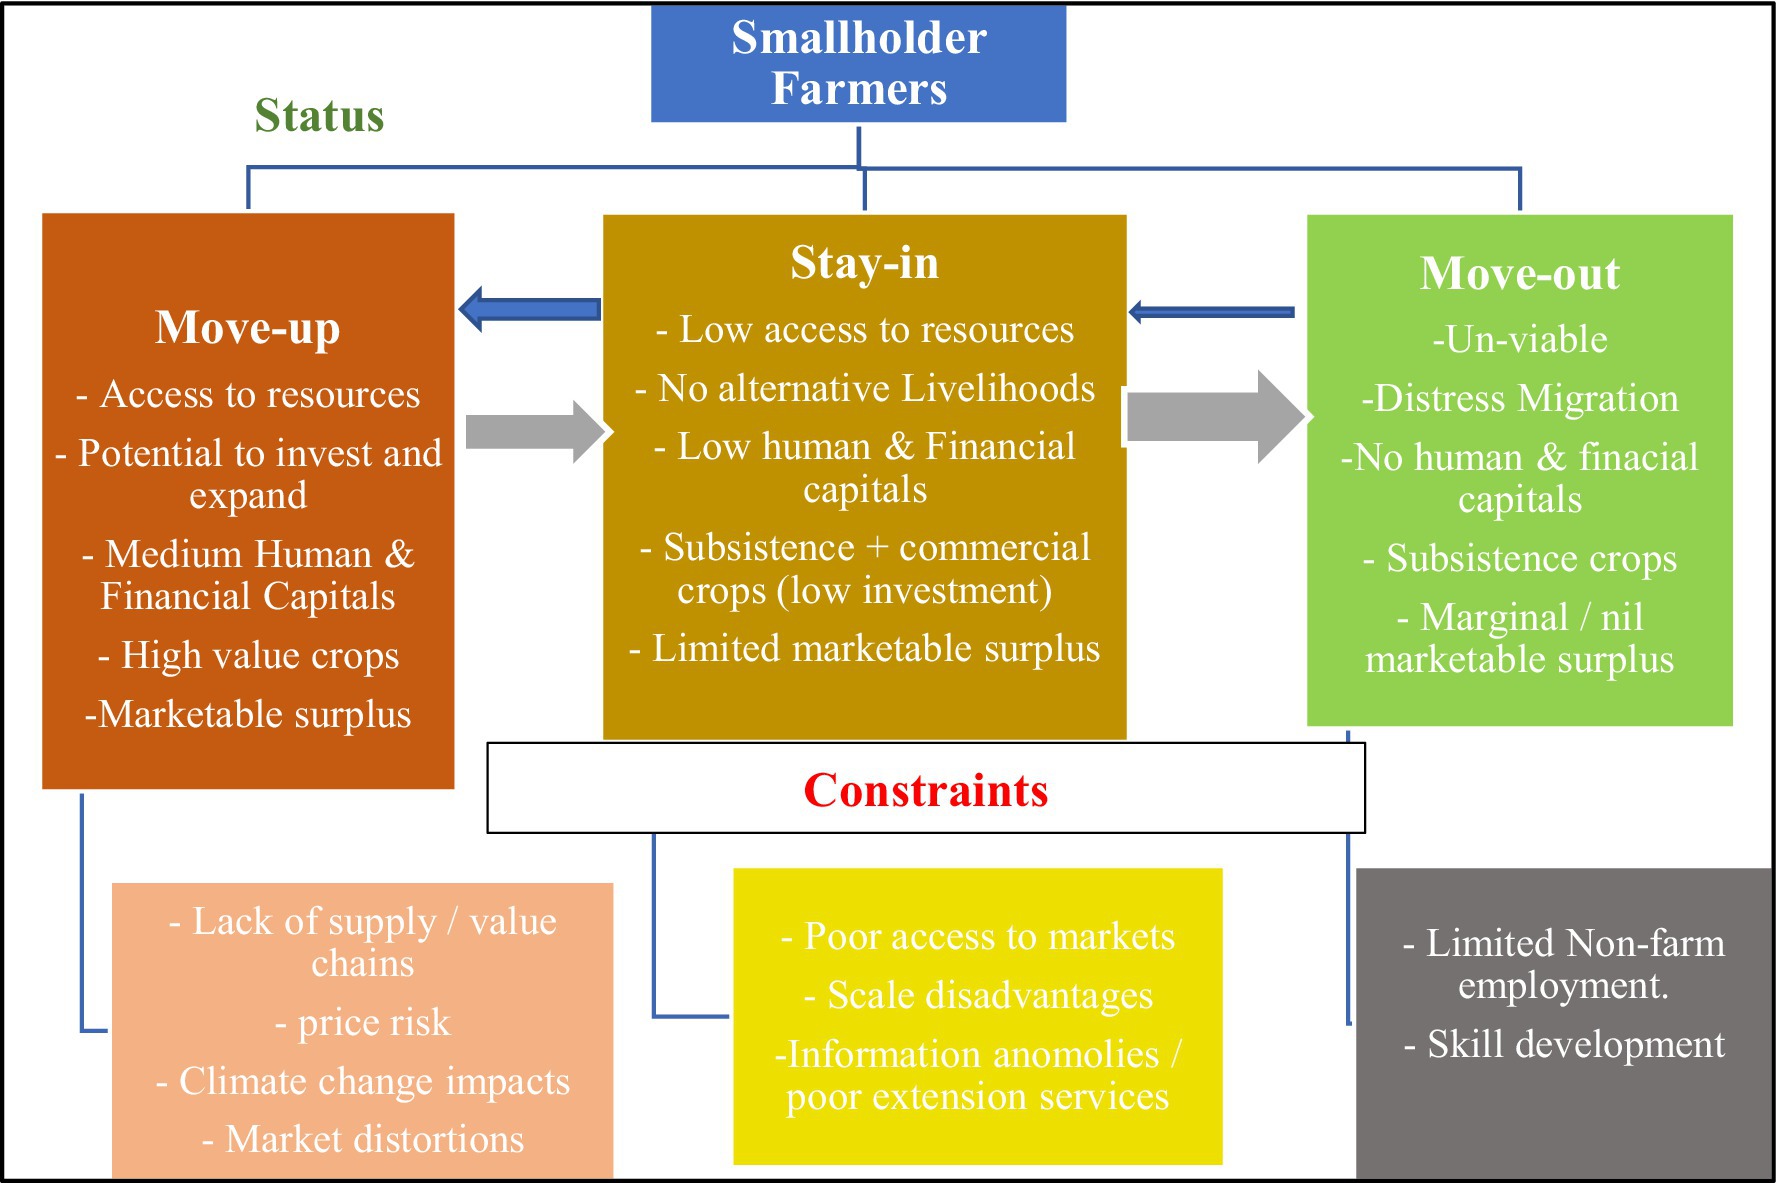
Figure 1. Typology of smallholder farmers: a macro view. Source: developed based on the discussion provided in Department for International Development (2015) and Fan and Rue (2020). Thickness of arrows indicates the extent of movement.
The status of “move-out” is that they are on the edge of viability due to their scale and capabilities. They grow mainly subsistence crops and often sell their output immediately after the harvest to meet their cash needs, only to buy the grains at higher prices later. For this, they depend on wage labor in farm or non-farm, and also seasonally migration to urban or even rural areas. Most of these farmers are in the process of quitting agriculture and joining the urban labor force. These farmers are constrained by a lack of appropriate job avenues, given the slow transformation of the economies. They are also constrained by skill development opportunities due to their poor education or literacy levels. As a result, these farmers either settle for the low-paying unskilled jobs or shuttle between farming and urban labor. The only indicator to assess the “move-out” category of farmers, i.e., the percentage of farmers who are keen to continue in agriculture.
Smallholders in the “move-up” category are relatively in a comfortable position due to their access to capital and capabilities. They can allocate land, invest in high-value crops, and generate marketable surplus. In the absence of systematic supply/value chains, they cannot benefit from the actual price benefit. Market distortions favor middlemen and traders rather than smallholders. As a result, their margins often fail to meet expectations. These farmers also bear the climate change impacts more due to high-value crops, where crop losses are more (pre- as well as post-harvest). This typology of smallholder farmers faces severe market and climate risks and hence is equally vulnerable. As indicated by the arrows in Figure 1, there could be movement of farmers from one typology to another. The shifts take place in both directions, and the thickness of the arrows indicates the extent (number of farmers) of movement, i.e., the thicker the arrow, the higher the extent of movement in that direction.
4 Status and importance of smallholders in the selected South Asian countries
In all the selected South Asian countries, except Pakistan, smallholder farms account for about 90% of the holdings and about 50% of the agriculture area (Table 1). Pakistan and Bangladesh provide a contrasting picture in this regard, viz., smallholders have the highest share in number and area in Bangladesh, while Pakistan has the lowest share. Except for Bangladesh, all other countries recorded a decline in average farm size between 2000 and 2020 (Table 1).
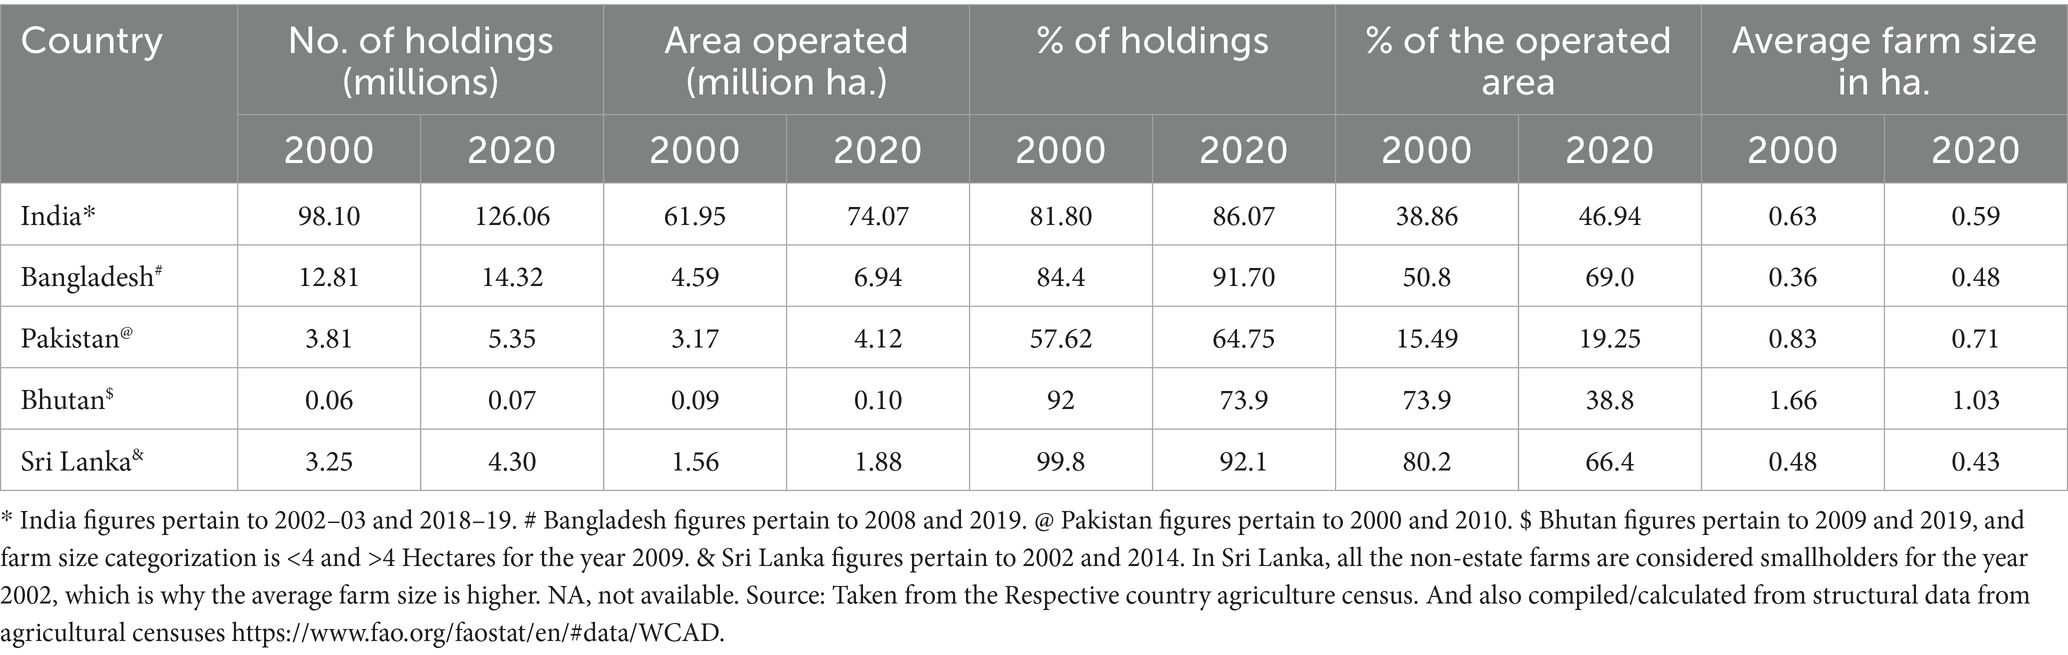
Table 1. Trends in smallholder farms (<2 ha.) in the selected South Asian countries.
4.1 Country experiences
This section assesses the status and trends in smallholder farms among the selected five South Asian countries. Though the detailed time series data is not presented here due to space constraints, the analysis draws from the data available for different countries and for different time periods, as discussed earlier.
4.1.1 India
Smallholder farms in India are not only growing in numbers but also in the area they operate. In terms of access to resources, smallholders are in a highly disadvantageous position regarding basic land resources (Table 2). Not only has the average farm size declined over the years, but also the number of parcels operated has increased (Figure 2). These farmers operate on sub-optimal-sized land, which is declining over the years. In the case of access to irrigation, they no longer have better access to irrigation when compared to earlier (Table 2). Besides, their increasing dependence on groundwater increases their vulnerability and the cost of irrigation. Groundwater is the single largest source of irrigation in India (Bhaduri et al., 2012). Smallholders have some advantage in the case of livestock per unit of land, while large holders are doing better in mechanization adoption rates. In the case of human capital, smallholders are younger compared to large holders, while large holders are much better in literacy and education due to their economic position. Given the poor access to land and water, smallholders not only have low net household incomes but also depend more on wage incomes, which is their single largest source of income. They are able to generate meager surplus household income only in recent years. As a result, the majority of these households are highly indebted (Table 2). And they depend more on moneylenders rather than institutional credit. This pushes them into a debt trap. Regarding farm practices, smallholders no longer cultivate their lands more intensively, as their access to irrigation is no better. A lower proportion of smallholders adopt improved or hybrid cultivars when compared to large holders. This could be due to the higher cost of seeds and low awareness. Smallholders devote more of their limited land toward food grains, especially staple cereals, and hence contribute to food security. At the same time, their contribution toward nutrition is less when compared to large holders, as smallholders devote less area toward nutri-cereals and pulses. Smallholders apply more chemical fertilizer than large holders. They also tend to use excessive nitrogen, which is not good for soils. The low ratio of NPK and FYM also does not help the sustainability of agriculture. Besides, excessive use of chemical fertilizers increases costs and reduces the viability of farming. Overall, smallholder farms in India are in a precarious situation in terms of access to resources and farm practices.
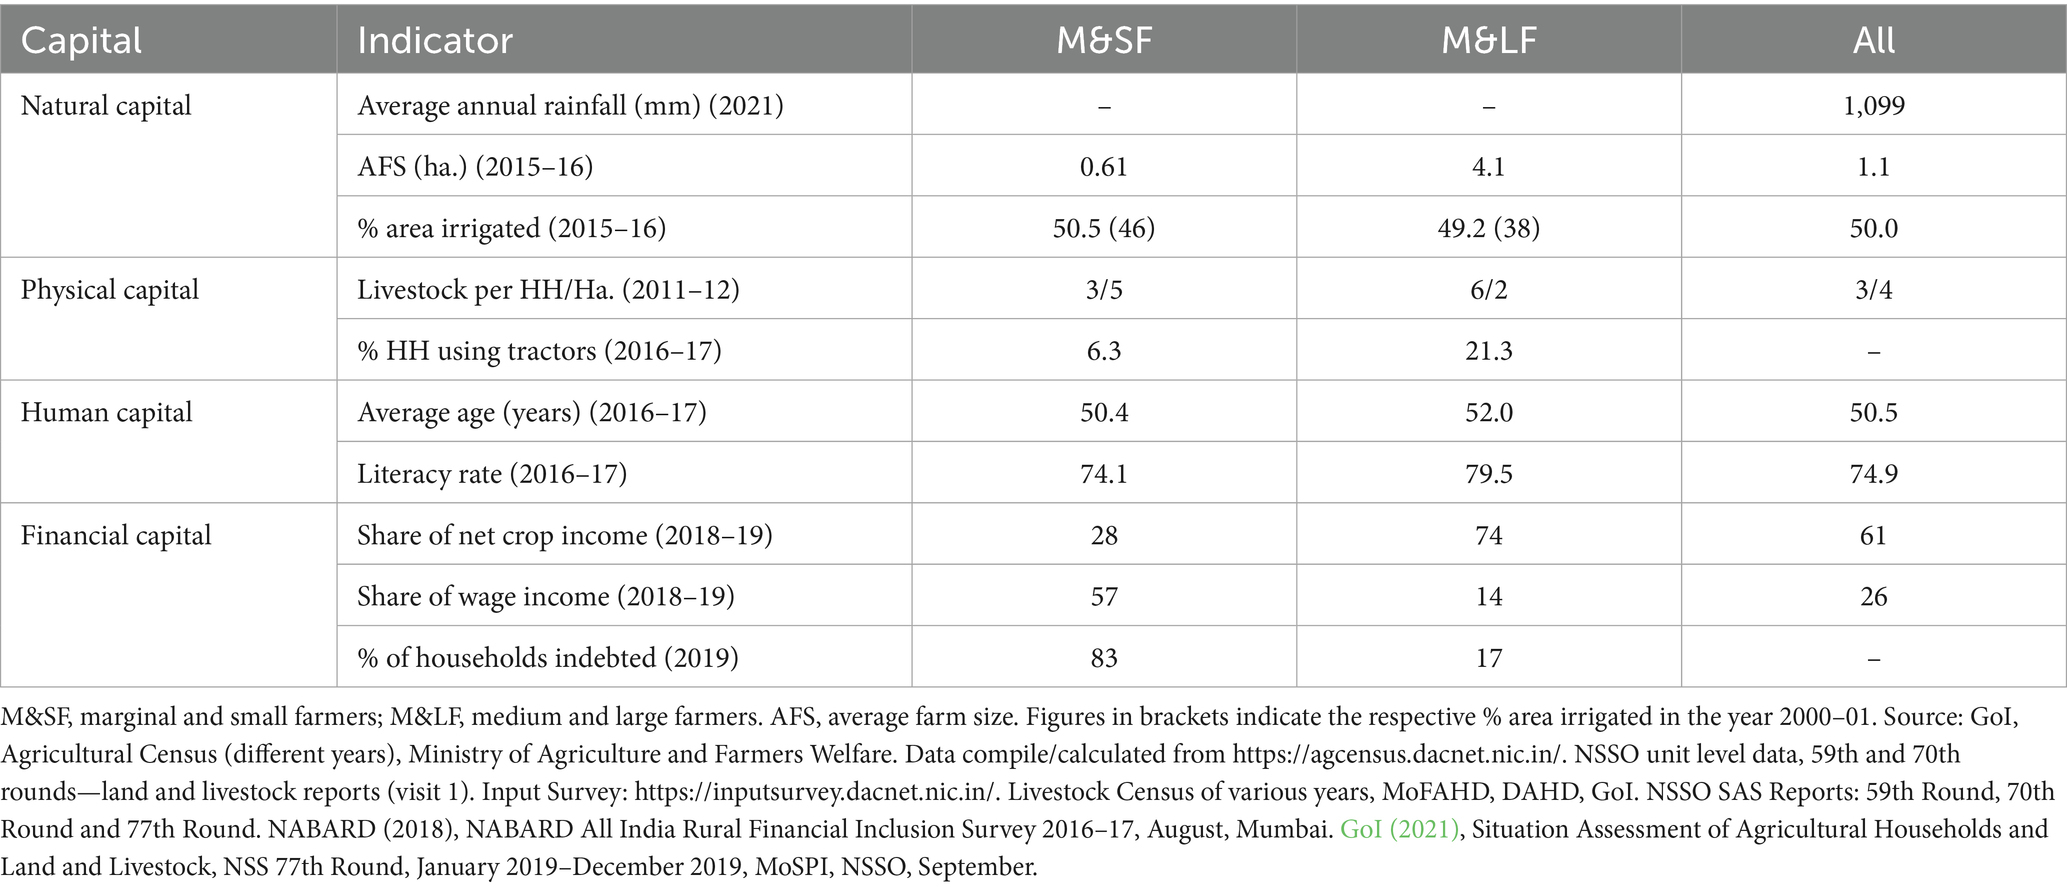
Table 2. Access to different indicators of capitals by smallholders and largeholders in India.

Figure 2. Trends size of holdings along with the number of parcels operated per farming household in India. AFS, average farm size in hectares; M&SFS, marginal and small farmers farm size; PPH, number of parcels per holding. Source: GoI (2021).
4.1.2 Pakistan
Pakistan is unique among South Asian countries, as it is relatively better endowed with land and water resources (Table 3). Smallholders account for 65% of the total farms cultivating 22% of the cultivated land, which is far below the South Asian average. In fact, Pakistan considers farmers with less than 5 hectares of land as smallholders, as against the standard 2 hectares. Though the average farm size in Pakistan has declined between the years 2000 and 2010 (Figure 3), it is higher compared to other South Asian countries for all farm households and smallholders. Greater land endowments have resulted in under-utilization of land to the extent of 20% at the country level. But Pakistan is also endowed with better irrigation access, as 80% of its cultivated area is irrigated, resulting in a higher cropping intensity of above 150% at the country level.
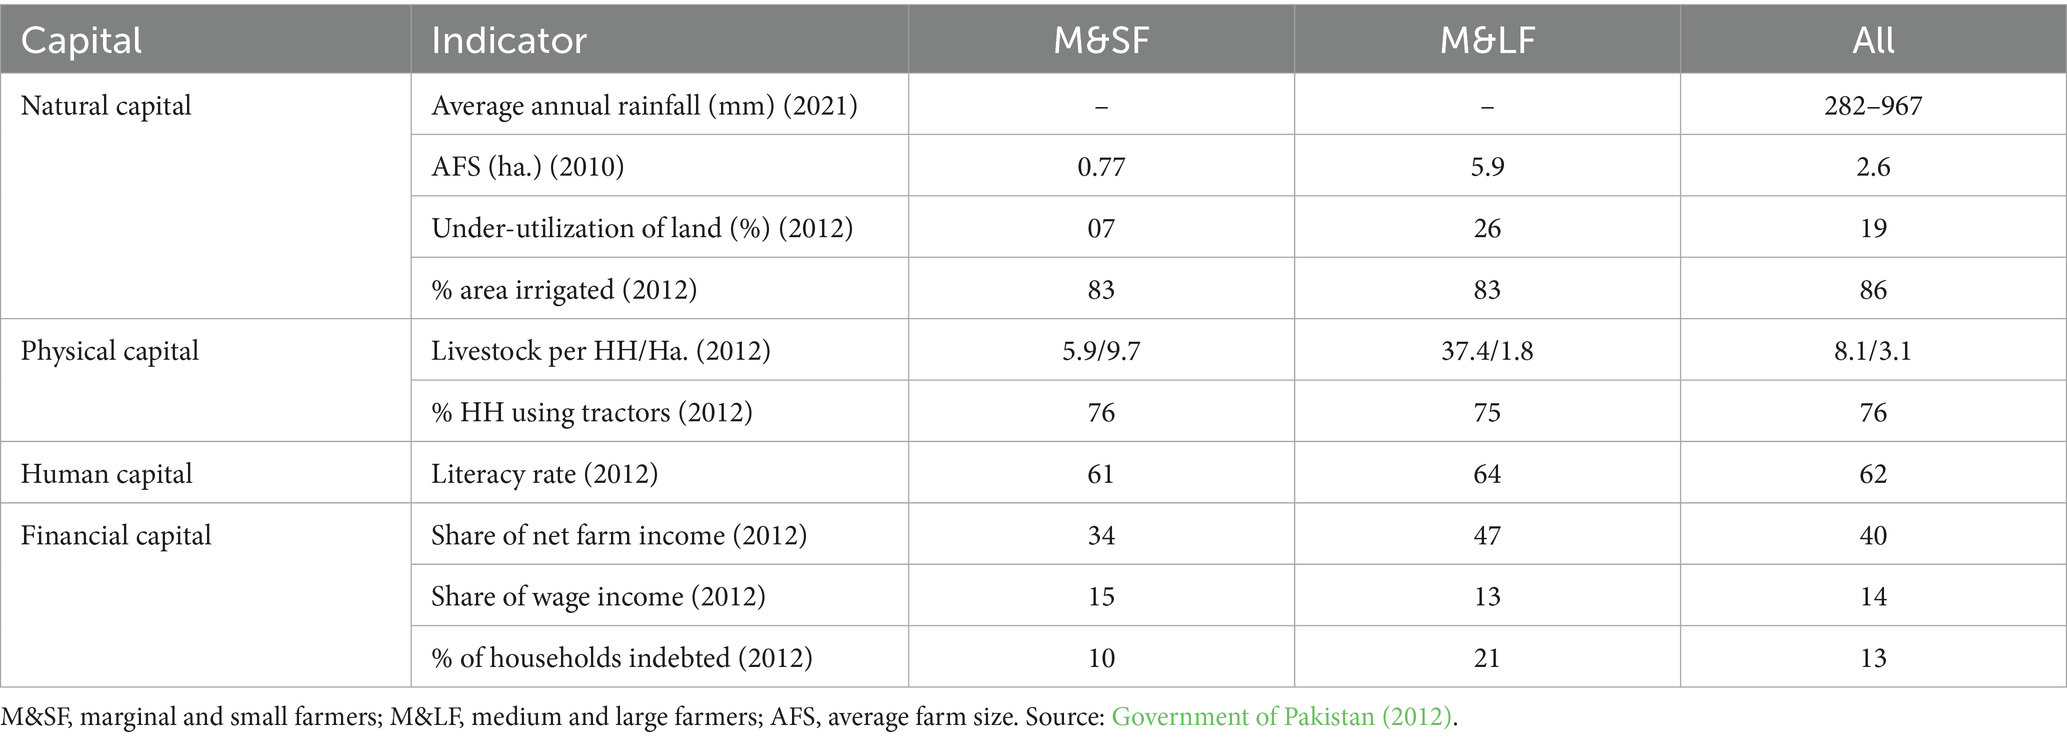
Table 3. Access to different indicators of capitals by smallholders and large holders in Pakistan.

Figure 3. Changes in average farm size (Farm Area) between 2000 and 2010 across regions of Pakistan. Source: Sandhu (n.d.) and Government of Pakistan (2012).
In terms of natural capital, smallholders are at a disadvantage position in terms of access to land, as their farm size is relatively small (Table 3). Farms in Pakistan, including smallholder farms, have greater access to irrigation. Access to physical capital in terms of livestock and machinery indicates high per household and low per hectare endowments. Medium and large holders have an advantage with better access to livestock per household. The percentage of households using tractors is relatively high, and there is no difference between small and large holders. The status of human capital is low, as 38% of farm household members are illiterate, constraining the adoption of farm technologies and practices, though smallholders are marginally better off. In terms of financial capital, farm income continues to be the single largest source of income. The share of farm income is higher for medium and large holders due to their size advantage. And access to credit is very low, more so for smallholders, which is reflected in their low indebtedness. Only 13% of the farm households are in debt, mainly due to poor access to institutional credit at the national level (Table 3). While friends and relatives are the main source of credit, the agricultural development bank is the main source for the medium and large farm households (Government of Pakistan, 2012).
Farm households devote about 70% of the cultivated land toward food grain crops. While this is good as far as addressing the food security concerns, it may adversely impact the farm viability, especially for smallholders. More than 70% of farms use chemical fertilizer with a high concentration of nitrogen, which is likely to impact the soil quality. Low adoption of improved seed varieties is the main constraint hindering agriculture growth in Pakistan. Studies have clearly shown that improved seeds are in short supply for all the crops, except paddy (Saeed, 2023; Hussain et al., 2022). Together with poor farm practices, there is a huge yield gap for most crops. Current yield rates of important crops like wheat, cotton, rice, maize, and sugarcane are 2.26, 1.87, 2.88, 1.77, and 48.06 tons per hectare. These are not only lower than the yields in South Asian countries like India, but the yield gaps are 67, 57, 45, 81, and 84% when compared with potential yields within Pakistan (IFAD, 2022). Climate change is further affecting the yield rates adversely due to shifting seasons, frequent floods, and droughts.
4.1.3 Bangladesh
Bangladesh agriculture is smallholder (2 ha.) dominated, with close to 100%. Bangladesh has successfully transformed itself to meet its increasing food demands, especially rice production. This has been possible through the widespread adoption of green revolution technologies coupled with favorable rainfall conditions. The large majority of smallholders are not only supported by agriculture and allied activities but are also keen to continue in agriculture (Anderson et al., 2016). This is despite the fact that the majority of them eke out enough income to survive. This could be due to the absence of alternative livelihood avenues, though the industrial sector is doing fairly well in generating employment.
The average farm size of smallholder farms increased between 2008 and 2009 (Table 4). The increase in farm size is observed across all the regions and also among smallholders as well as medium and large farmers (Figure 4). Extent of irrigation is about 58%, which has increased marginally between 2008 and 2019. Smallholders have better access to irrigation when compared to medium and larger holdings, though the difference is marginal. In the case of physical capital, on average, farm households own 2.11 ruminants as per the 2019 agricultural census. Between 2008 and 2019, the number of livestock holdings declined, though the decline is marginal. Between the size classes, medium and large holders own a substantially greater number of livestock when compared to smallholders. The number of ruminants per household declined for large holders between 2008 and 2019. Farm machinery is most extensively used in Bangladesh. There is a substantial increase in the use of tractors between 2008 and 2019. This explains the absence of draught cattle in Bangladesh. Between the size classes, it is the medium and large holders who own more machinery. Medium and large holders own five times more tractors than smallholders. Thus, the ownership of machinery, which is highly capital-intensive, differentiates smallholders from medium and large holders in Bangladesh.
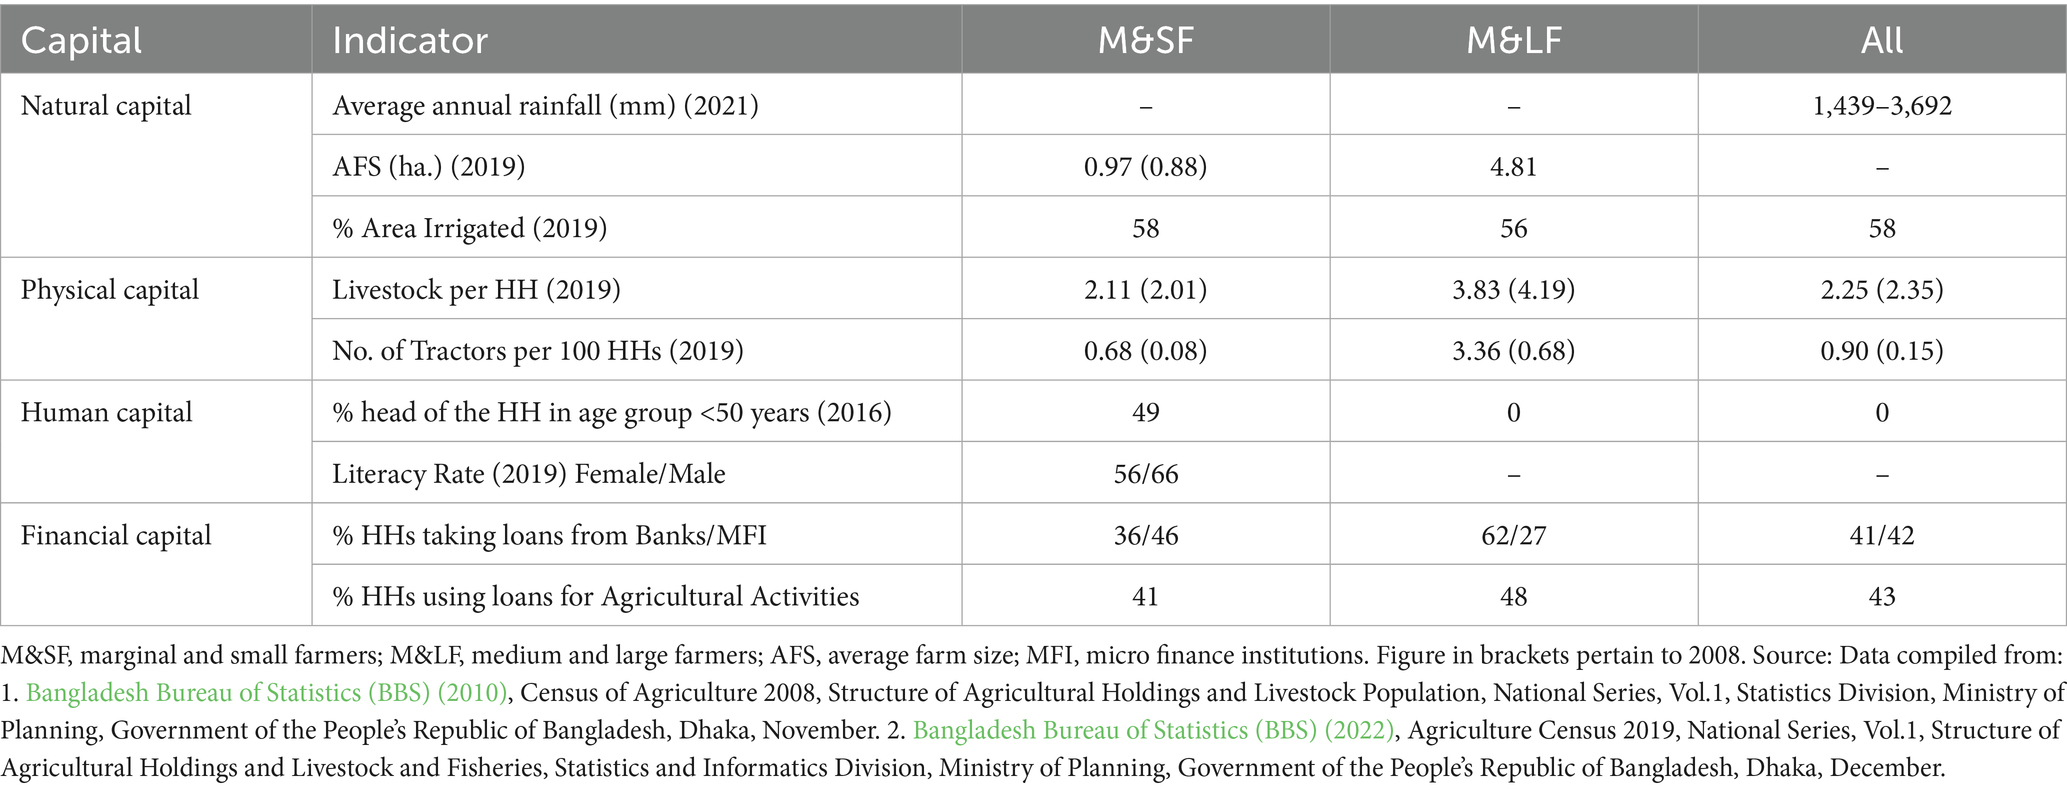
Table 4. Access to different indicators of capital by smallholders and largeholders in Bangladesh.

Figure 4. Average farm size by size classes and across the regions of Bangladesh. Regions Mymensingh and Rangpur came into existence only after 2008. Source: 1. Bangladesh Bureau of Statistics (BBS) (2010), Census of Agriculture 2008, Structure of Agricultural Holdings and Livestock Population, National Series, Vol.1, Statistics Division, Ministry of Planning, Government of the People’s Republic of Bangladesh, Dhaka, December. 2. Bangladesh Bureau of Statistics (BBS) (2022), Agriculture Sample Census 2020, Crops Report, National Series, Vol. 2, Statistics and Informatics Division, Ministry of Planning, Government of the People’s Republic of Bangladesh, Dhaka, December.
In the case of human capital, 49% of the smallholder heads of the households are in the age group of 30–49 years, and 40% of the heads of smallholder farms are above 50 years of age (Table 4). About 70% of the smallholder households have more than 10 years of experience, while only 2% have less than 2 years of experience. The education status of the smallholder farm heads is also low. One-third of them are illiterate, while 38% of them completed primary education. And 21% of them have completed secondary. This situation is much worse in the case of female-headed households, as 46% of them are illiterate.
In the case of financial capital, 27% of the smallholders are in extreme poverty while 23% are above poverty (Anderson et al., 2016). The remaining 50% are on the margins. About 38% of the smallholders can be considered as well-off, as they are able to save and buy some consumer goods or luxuries (Anderson et al., 2016). Rural microfinance originated in Bangladesh as early as 1976 (Mia et al., 2019). Due to the spread of micro finance institutions across the country, the dependency on micro finance institutions (MFIs) more than 40% of the farm households depend on micro finance credit, and an equal proportion on banks (Table 4). Between size classes, 36% of the smallholders depend on banks as against 62% of medium and large holders, while 46% of the smallholders depend on MFIs as against 27% of the medium and large holders. While banks charge about 5%, MFIs charge up to 24% as interest. In the process, smallholders end up paying substantially higher interest rates. While smallholders have good access to high-cost credit, medium and large holders benefit from low-cost bank credit.
4.1.4 Sri Lanka
Agrarian structure in Sri Lanka is highly skewed with less than 5% of medium and large holders and estate holders are operating more than 45% of the operational area. Though constrained by a lower share of cultivable land due to the terrain, forests, and water bodies, Sri Lanka has favorable climatic conditions with an annual average rainfall of above 1,500 mm. The presence of the estate sector, accounting for a substantial share of the cultivated area (18%), further reduces the land available for seasonal crops like food grains, resulting in food insecurity. This is despite the fact that the advent of agricultural technologies (seed varieties) and allocation of 80% of the crop area toward food crops, i.e., mainly paddy. Smallholders (<5 ha.) contribute substantially to paddy production and hence their role is significant in food security and self-sufficiency. It is argued that poor or inadequate performance of agriculture (low productivity) in Sri Lanka has led to heavy dependence on imports of food as well as agriculture inputs (fertilizers and pesticides). These reforms, along with fertilizer subsidies, did not help boost crop productivity. Instead, it led to excessive use of agrochemicals and increased costs.
Access to various capitals is weak, especially in the case of natural and physical capitals (Table 5). Size class-wise data are not available for Sri Lanka, as the farmers are categorized as farm holders and estate holders. One estimate pertaining to 2014 assessed that smallholders (<2.5 ha) account for 92% of the total landholders and operate 66% of the area (Government of Sri Lanka, 2019). Farmholders account for 99.8% of the total farm households and cultivate 82.3% of the total crop area. Land available for agriculture is only one-third of the total land and varies widely between the regions, though it has increased between the years 2002 and 2014 (Figure 5). Less than 50% of the area of farm households has access to irrigation. They have very poor access to physical capital, i.e., livestock and tractors. Farmholders in Sri Lanka are well equipped with human resources like education (Government of Sri Lanka, 2019), but their health status is deteriorating fast (Hettithanthri et al., 2021).
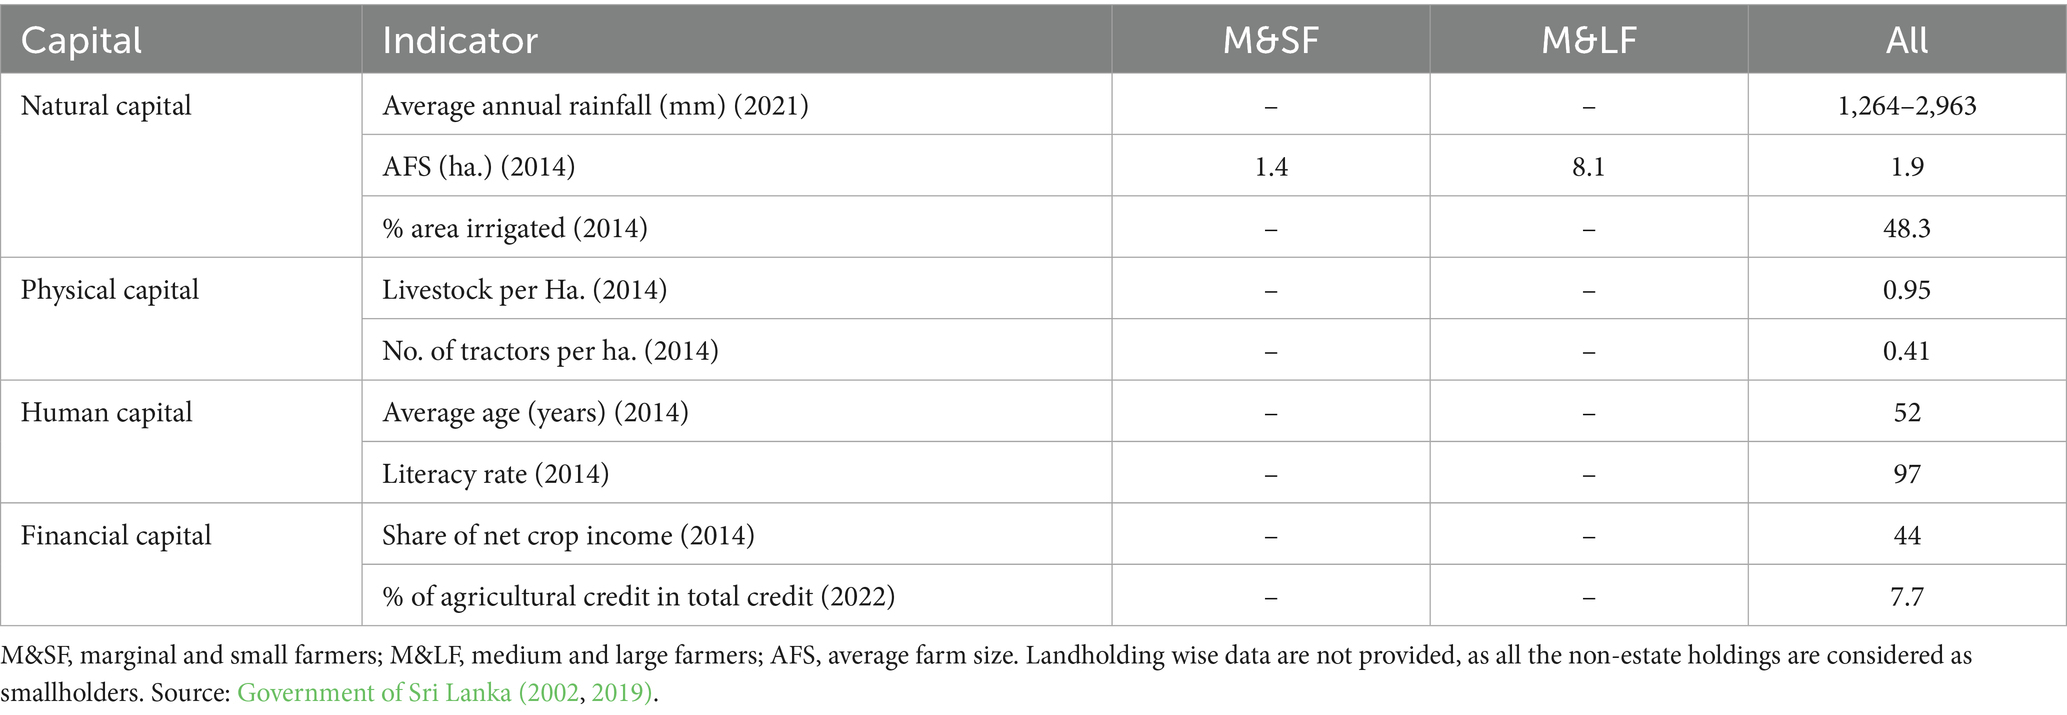
Table 5. Access to different indicators of capitals by smallholders and largeholders in Sri Lanka.

Figure 5. Percentage of agriculture land to total land in Sri Lanka (2002–2014). Sources: Government of Sri Lanka (2002, 2019).
4.1.5 Bhutan
Smallholders account for more than 70% of the farming households but cultivate 38% of the area. The average farm size of smallholders is about 1 hectare (Table 6), which is better than some of the south Asian countries. This is mainly due to its limited population and population density, which is the lowest in Asia (20 people per square km). This is one of the reasons for the absence of a food security crisis, although Bhutan is not self-sufficient in food production. Unlike Sri Lanka and Pakistan, Bhutan is able to manage its food security despite importing 40% of its food from outside.
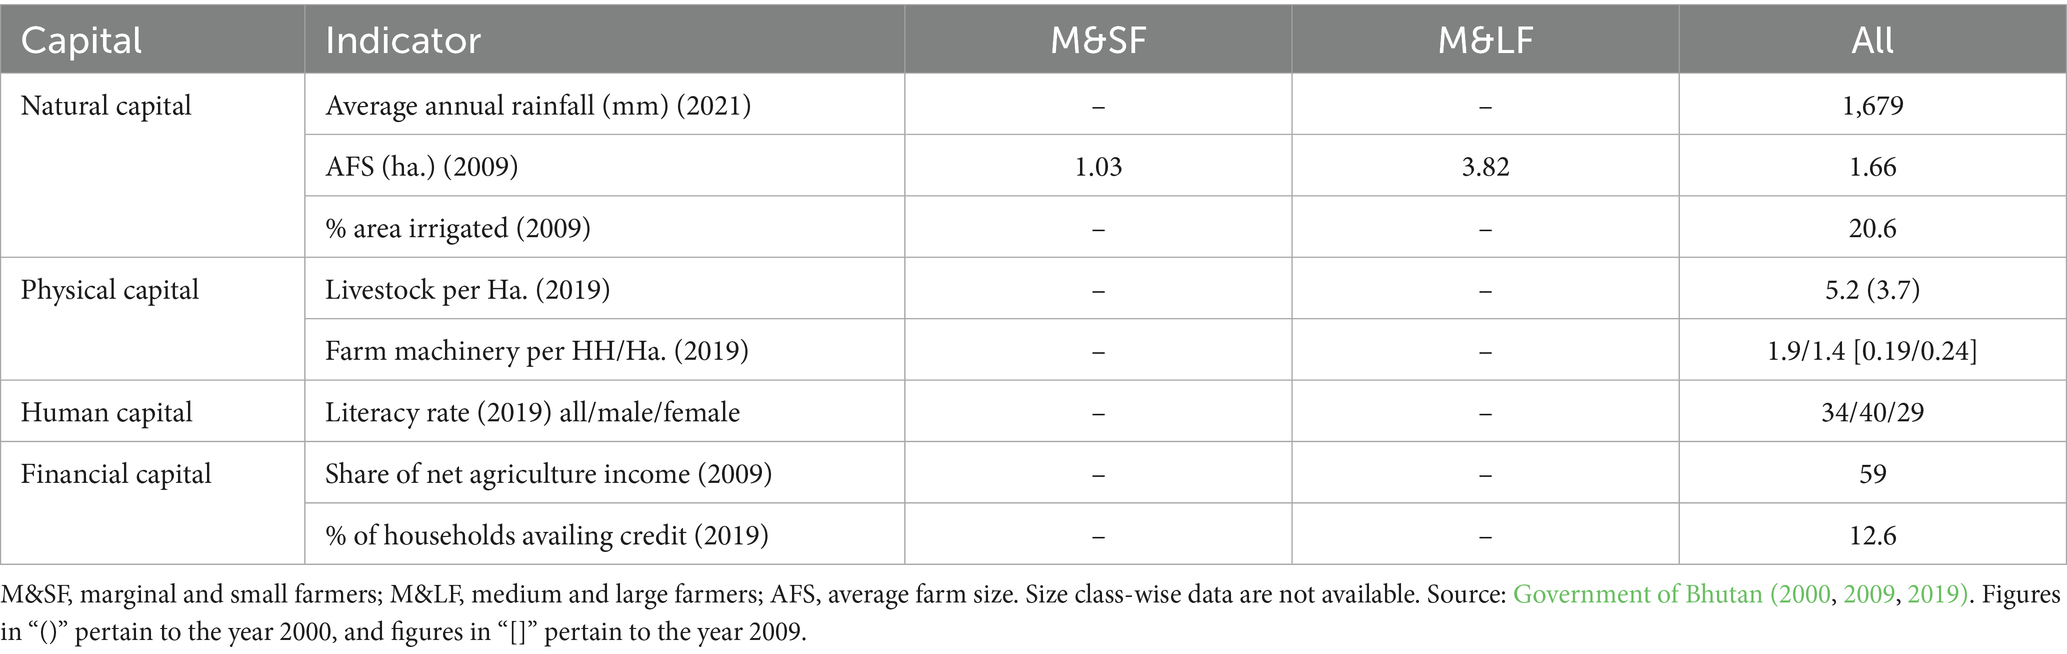
Table 6. Access to different indicators of capitals by smallholders and largeholders in Bhutan.
In the case of natural capital, apart from the shortage of land, access to water is the major constraint, as only 20% of the farm area has access to irrigation (Government of Bhutan, 2009). Physical capital, livestock, and machinery are not a severe constraint. Due to the rugged terrain coupled with wildlife issues, young and educated individuals are not keen to take up or continue in farming. As a consequence, the majority of farmers have to spend substantial time traveling to their farms, and the time taken varies widely across the regions (Figure 6). Moreover, literacy among farmers is very low (34%), though the majority of the farmers are in the age group of 15–60 years. Women, who play an equal role in farming, have a much lower literacy rate, i.e., 29% (Government of Bhutan, 2019). Despite these constraints, farming appears to be the major source of income, i.e., contributing 59% of the household net income. Income from agriculture and allied activities generates a surplus after covering the food expenditure of the household. Importantly, farmers’ dependence on external credit is very limited, suggesting that farming is a viable proposition in Bhutan.

Figure 6. Average walking time to the farms across regions of Bhutan (2000). Source: Government of Bhutan (2000).
Given the subsistence nature of farming, about 76% of the operational area is under cereals. Though there appears to be a shift toward non-cereal crops during 2009, it has not sustained itself fully, as the shift was reversed to the extent of 50% in 2019. This could be due to the importance of food self-sufficiency coupled with other constraints like water, labor, pests, and diseases etc. Though no detailed data on size-wise holding are available, smallholders grow more subsistence or food crops (cereals) than large holders. Hence, the contribution of smallholders to food self-sufficiency and food security is substantial.
5 A comparative macro picture
Based on the assessment in the individual countries, a broad status of agriculture in general and smallholder farms in particular is presented in Table 7. The only commonality among the five countries is the declining share of agriculture in their respective GDPs. In terms of employment, the share of agriculture employment is declining slowly in most countries. Only in India, agriculture has a higher share in total employment, while other countries have slipped to low (Sri Lanka) to moderate (Bhutan, Bangladesh, and Pakistan) levels. They are at different rungs of food security. While Sri Lanka and Pakistan are facing serious food shortages, Bangladesh and India are in a comfortable position, as they are self-sufficient in their staple food grains (rice and wheat). Bhutan, despite its heavy dependence on food imports, is able to manage its food security decently due to its small population. In all the countries, the agrarian structure is becoming increasingly marginalized with an increasing number of smallholders and declining farm size, coupled with an increasing number of parcels of land. Only Bangladesh has experienced some improvement in farm size in recent years. Most of the smallholders operate on sub-optimal-sized farmland.
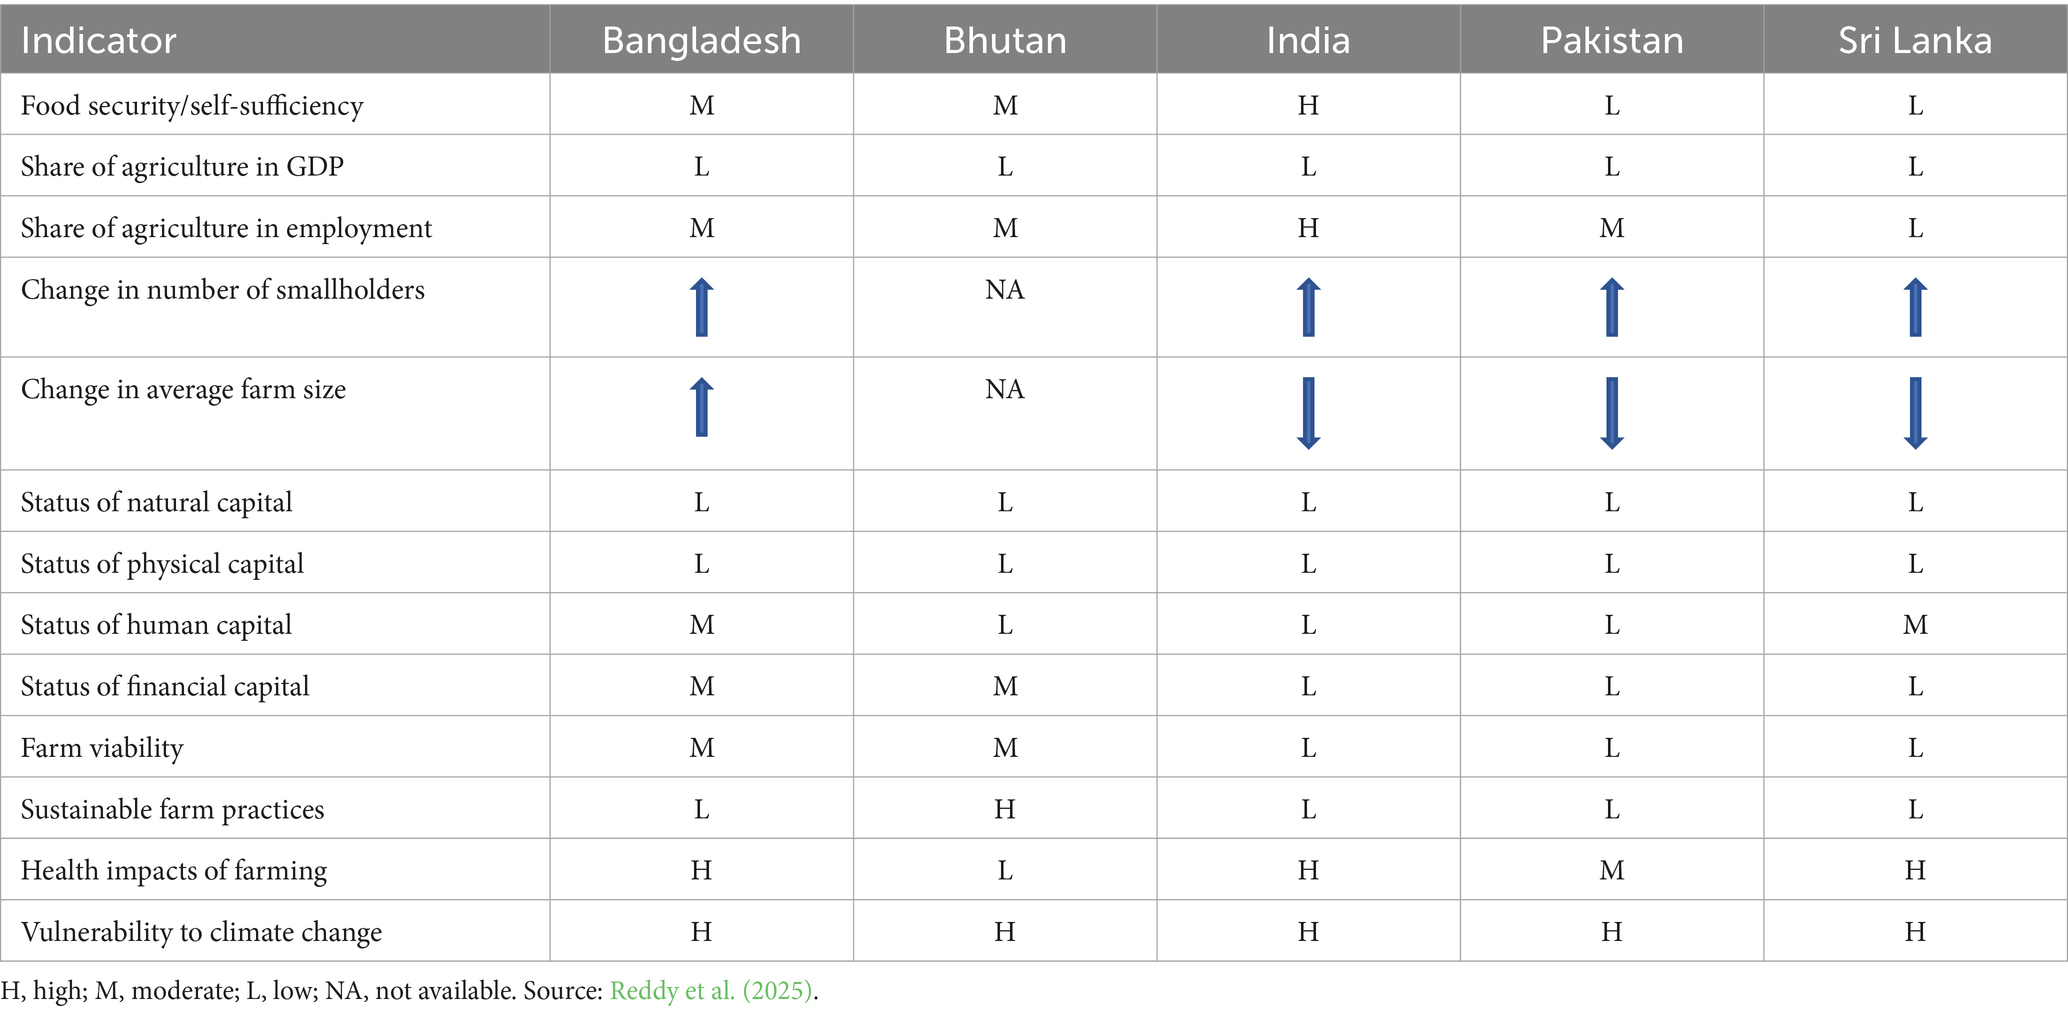
Table 7. Broad status of farms and smallholder farms in South Asia.
In all the countries, smallholders suffer from low access to all four capitals, especially natural capital. Bangladesh has a moderate level of human capital because the majority of the farmers (>80%) are keen to continue in agriculture, while Sri Lanka has more literate or educated farmers. In the case of financial capital, Bangladesh smallholders have the advantage of access to microfinance, but at a higher cost. In Bhutan, very few households seem to have opted for credit, though it is not clear whether this is due to a lack of access or low requirement. In the case of India, farm viability is low. Though other countries do not have systematic economic data to assess farm viability, the experience of Pakistan and Sri Lanka indicates that the farm sector is not doing well. In the case of Bhutan, there is some evidence of surplus being generated. Farmers’ willingness to continue farming is taken as a proxy for farm viability in Bangladesh. Except for Bhutan, none of the countries adopt sustainable farm practices like excessive and imbalanced use of agrochemicals, resulting in severe soil, water, and human health problems that are spreading beyond farmers and farmworkers. More importantly, smallholders are most impacted due to their poor access to all the capital when compared to large holders.
At the aggregate level, land productivity has doubled in three of the five south Asian countries between 1990 and 2014 (Table 8). Land productivity has gone up nominally in Bhutan and Sri Lanka. Bangladesh has the highest land productivity, while Bhutan has the lowest. Land productivity in Bangladesh is 77% higher than that of India, which is due to the high cropping intensity (>200%) in Bangladesh. Labor productivity has not increased as much as land productivity in all the countries. Of the five countries, only Bangladesh has doubled its labor productivity, while India, Pakistan, and Sri Lanka have recorded moderate gains in labor productivity. Labor productivity has declined in Bhutan between 1990 and 2014, which is due to the modest gains in land productivity. Pakistan has the highest labor productivity despite relatively low land.
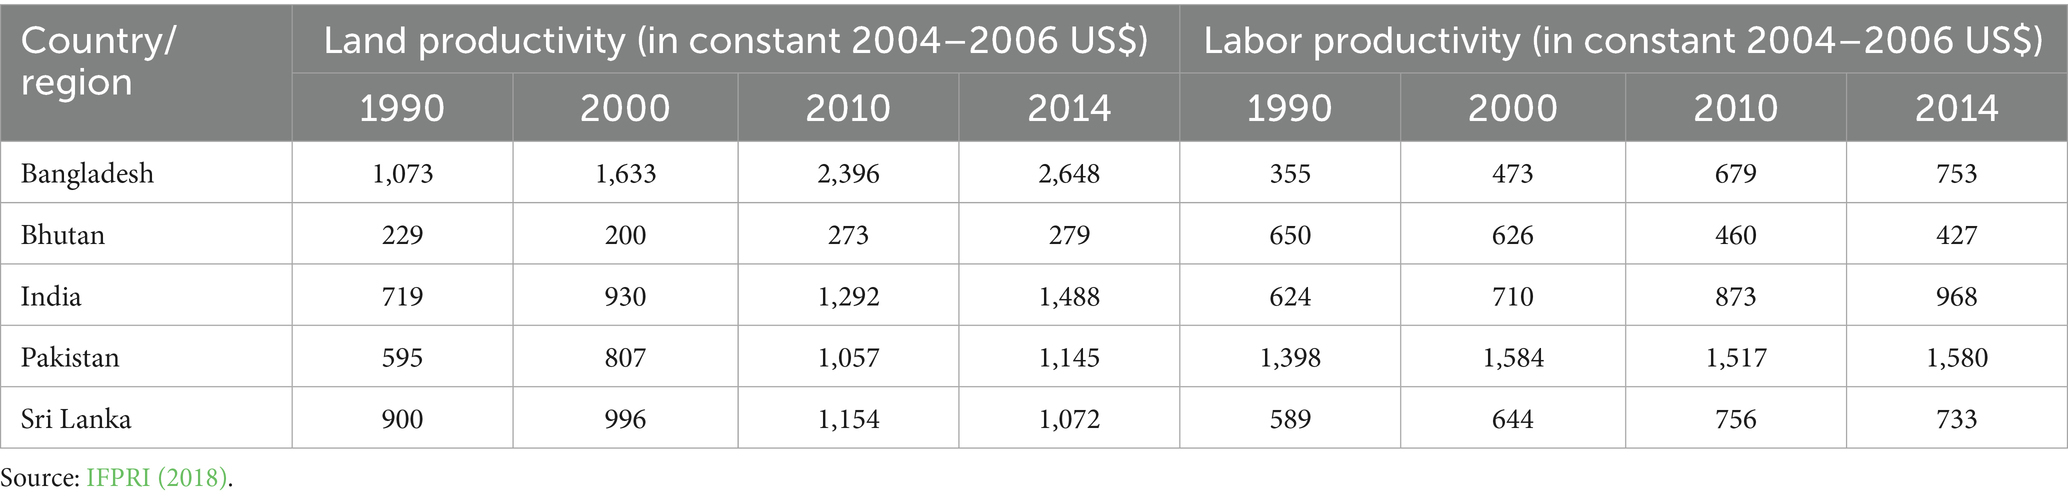
Table 8. Trends in land and labor productivity in Asia and other global regions.
In terms of output growth, Sri Lanka has recorded negative growth between 2010 and 2014 (Table 9). Output growth has declined between the periods 2000–10 and 2010–14 in Bangladesh, Bhutan, and Sri Lanka. India has recorded the highest output growth of 3.5%, followed by Pakistan (2.7%), during the latest period, 2010–14. More worrying is the decline in total factor productivity (TFP) growth in all the countries except India. While Sri Lanka and Bhutan have reported negative TFP growth, Pakistan and Bangladesh have <1 TFP growth during 2010–14. Only India has reported high (2.7%) factor productivity growth during the latest period. TPF reflects the input use efficiency and is often influenced by technological change rather than price factors (Desai and Namboodiri, 1997). Technological change is linked to public expenditure on research and development, investments in irrigation, road and market infrastructure, as well as rural literacy, tenancy reforms, etc. Thus, TFP is a necessary condition for assessing the farm sector performance in terms of technical efficiency, but not sufficient to assess the farm viability. Moreover, often TFP estimates are constrained by the crops considered and the regions covered, and hence are not comprehensive enough to reflect the micro realities. The poor performance of agriculture at the macro level needs to be understood in the context of the macro policy environment in the respective countries. Three indicators, namely, national budget allocations toward agriculture, share of agriculture credit to total credit, and agriculture orientation index, are considered for this purpose. Bhutan has the highest level of budget allocations to agriculture, i.e., about 9% of the total budget allocations. These high allocations have been maintained over the last two decades (Figure 7). Pakistan has the lowest budgetary allocations at about 1% over the past decade or so. Sri Lanka, India, and Bangladesh have about 5–6% of the budget allocations, which are consistent over the years. Most countries had higher allocations around 2010, but were not sustained in the later years. In the case of credit provision for agriculture, India has the highest provision at 12% of the total credit, which increased from 10% during 2000 (Figure 8). Sri Lanka is the second highest with 8%, and the remaining 3 countries have about 4–5%.
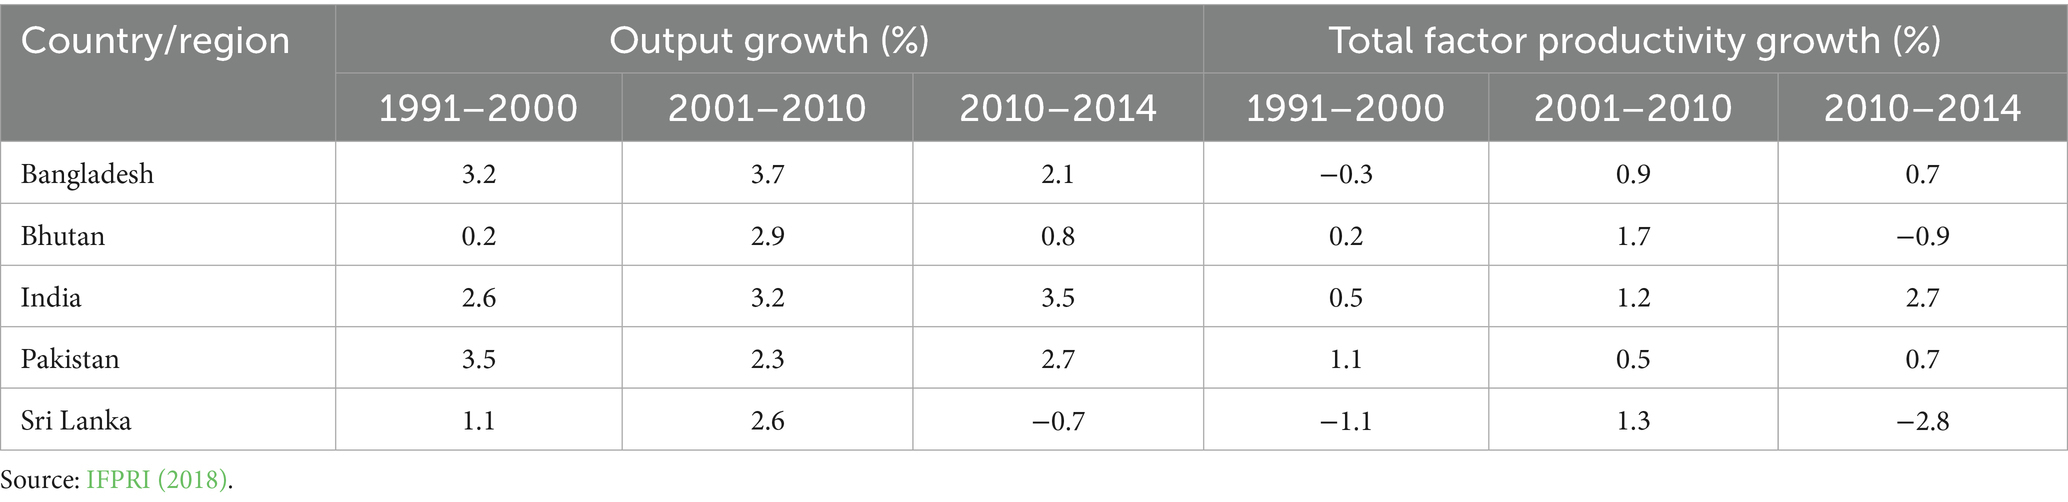
Table 9. Trends in output and total factor productivity growth in Asia and other global regions.

Figure 7. National budget allocations to agriculture and allied activities: 2001–2022 (% Share) articular years. Source: UN, Food and Agricultural Organisation, FAOSTAT (https://www.fao.org/faostat/en/#data/IG).

Figure 8. Share of credit to agriculture and allied activities: 2000–2022 (%). “0” indicates non-availability of data for the particular years. Source: UN, Food and Agricultural Organisation, Credit to Agriculture, FAOSTAT (https://www.fao.org/faostat/en/#data/IC).
The Agriculture Orientation Index (AOI) is defined as the ratio between the share of agriculture and allied activities in government expenditure and their share in the gross domestic product (GDP). AOI < 1 indicates that agriculture is receiving less than its fair share and vice versa. None of the five countries has more than 1 AOI (Figure 9). Sri Lanka has the highest AOI of 0.9 for the year 2022. Sri Lanka is the only country that has reported more than one AOI for an extended period between 2008 and 2019. All other countries have <1 AOI over the past two decades. Only India has shown some improvement over the period, while Pakistan has recorded a substantial decline. Bangladesh and Bhutan are more stable at 0.4 and 0.2, respectively.

Figure 9. Agriculture orientation index 2000–2022. “0” indicates non-availability of data for the particular years. Source: UN, Food and Agricultural Organisation, Credit to Agriculture, FAOSTAT (https://www.fao.org/faostat/en/#data/IC).
The low AOIs explain that not enough investments are going into agriculture and allied activities. The poor performance of agriculture in some, if not all, countries despite substantial budgetary allocations could be because the investments are below threshold levels or poor efficiency of these allocations. Moreover, the investments are not going into the deserving sub-sectors or components. This becomes clear if we look at the AOI and budgetary allocations along with TFP growth for each country. This indicates that agriculture performance is associated more with TFP, as factors like R and D investments (budgetary allocations) influence TFP growth. Though budgetary allocations influence AOI, if they are not in the right direction, TFP growth may not improve. The cases of Bhutan and Sri Lanka demonstrate this point. While high budget allocations in Bhutan could not improve AOI, higher AOI in Sri Lanka is not reflected in its agriculture performance. But both countries have reported negative TFP growth, which may explain their poor performance. In the case of India, the better TFP growth is neither reflected in its AOI nor in farm viability or performance at the micro level.
6 Policy implications
Given the precarious nature of food security and the importance of agriculture in terms of its contribution to food self-sufficiency, policies need to be farmer-centric, especially for smallholders. Going by the experience of the countries in the region, neglecting agriculture could have devastating impacts not only on food security but also on the overall economy. The most widely discussed aspect of smallholder farms is that of ‘farm-size and productivity’ initiated by Amartya Sen during the 1960s (Sen, 1964). The relative efficiency of small farms was attributed to their family labor, which facilitates the adoption of intensive and efficient farm practices, coupled with high-quality supervision or managerial abilities (human capital). This has helped small farms to overcome their disadvantage of low farm size (natural capital). The importance of human capital has declined with the advent of the green revolution, which pushed the use of market inputs (financial capital) like fertilizers, machinery, etc. Given that large holders have better access to financial capital, they could invest in infrastructure (irrigation), market inputs, and machinery, gaining an upper hand in terms of profit margins. On the other hand, smallholders could not take advantage of markets due to their scale disadvantages and also due to low education levels, i.e., they lost their human capital advantage. The following policy implications indicate why smallholders need the support of public policy in terms of each capital in generic as well as country-specific terms.
The fast-changing global geo-political scenario further aggravates the poor performance and viability of smallholder farms. Global events like COVID-19 impacted farming in many ways, and smallholder farmers, along with other vulnerable sections (urban wage workers), are the first and most affected. For instance, in some countries like Sri Lanka, which are dependent on input imports (fertilizer), experienced input shortages and increased cost of cultivation, resulting in declining viability. And countries like India and Bangladesh have suffered from declining demand (low domestic output prices), and reduced trade and export movement of farm produce. This again resulted in declining profits and the viability of agriculture. Smallholders with high vulnerability suffered the most. Similarly, in the case of the war in Ukraine, food imports were adversely impacted in countries like Sri Lanka and Pakistan, leading to food inflation and shortages. In this case, also smallholders, who sell their produce immediately after the harvest and depend on markets later in order to meet their food needs, are the worst affected. Following such events, food self-sufficiency has returned to the fore on the policy agenda of all the countries. Based on the close uniformity regarding agricultural performance along with access to capital and capabilities across the five selected countries in South Asia, the following generic and country-specific policy implications could be drawn.
6.1 Generic
i. All the countries are facing serious natural resource degradation, especially land and water. Such degradation is resulting in declining land productivity, increasing costs, and declining farm viability. This is more so in the case of water resources, as smallholder farms not only have low access but also suffer most in the event of degradation, especially groundwater. Strengthening the natural resource base should be addressed as a priority to ensure the revival of farming. This would check the move-out and support stay-in category of farmers.
ii. Improving soil quality with the help of nature-based solutions that ensure sustainable (higher) yields. These could be in the form of adopting appropriate soil management practices, like addressing micronutrient deficiencies and improving soil carbon content. Crop diversification is a proven soil management system, which is being replaced by mono-crop input-intensive crop systems in all countries. In the case of water resources, especially groundwater, a shift toward low-water-intensive, high-value crops could help sustain smallholder farms. Policy interventions should aim at supporting smallholders to move away from mono-cropping and move toward diversified and balanced cropping patterns. This would reduce the numbers in the move-out category.
iii. Hitherto to adopted agriculture policies have focused on intensive farm practices or extensive farming rather than promoting technical change. The intensive farm practices have proved unsustainable, as farm intensification led to resource degradation and increasing costs. On the other hand, technical change increases production at lower costs, benefiting smallholder farms the most. There is no technological breakthrough after the green revolution. Though it is difficult to achieve technical change, increased investments in research and extension. In fact, these investments explain 86/87% of the variation in TFP growth and have a marginal return of 20% on investment (Desai and Namboodiri, 1997). This would improve the overall viability of smallholder farms across the countries.
iv. In all the countries, policy reforms have systematically bypassed the agriculture sector. This has, in a way, resulted in the neglect of the sector, as evidenced by the decline or stagnant budget allocations to agriculture. Even the increased allocations in some countries are not good enough to make the sector viable. There is a need for a substantial increase in investments in the right direction. The agriculture orientation index would be a starting point in this regard. There is a substantial investment gap in the areas of improving natural resource base (improved soil health through monitoring, promotion of nutrient supplies, etc.), research and development, extension, road infrastructure, market infrastructure (market yards, storage, etc.), supply chain infrastructure (cold storage, etc.) in all the countries.
v. The policy reforms and investments ought to be farmer-centric, especially for smallholders. The focus should be on making farming viable and increasing the profit margins. In the absence of decent profits, it is naïve to expect farmers to continue farming. Making agriculture vibrant is the only way to make countries food self-sufficient and resilient to face adverse global events.
vi. The efforts to promote sustainable farm practices (conservation agriculture, organic farming, etc.) without considering farm profitability have met with low adaptation rates and severe food shortages. There is a need to look at more balanced options like precision farming and new technologies. For this, quality human capital (education) is a necessary condition. This is a necessary condition for supporting the stay-in category of farmers.
vii. Shifting to high-value crops is often argued to be the key to enhancing farm income and profits. There is a need for understanding the trade-offs between food crops and high-value crops in terms of investment requirements, market risks, and climate risks. While medium and large farmers are capable of taking such risks, smallholders lack such capabilities.
viii. All the countries are facing human capital constraints, both in terms of quantity and quality. In most countries more and more people are keen to quit farming. Only illiterate and aged people are continuing in farming, as young and educated are pursuing alternative livelihoods. This has implications for technology adaptation and TFP growth.
ix. South Asian agriculture is highly vulnerable to climate risks. The impacts are already evident in some of the regions. While adaptation to climate variations is a continuous process at the farmer level, public efforts and investments need to focus on long-term mitigation apart from supporting the farmers in their adaptation efforts.
6.2 Country specific
i. In the case of India, (a) Farm policies are neither comprehensive nor integrated. While water conservation and productivity are policy objectives, water-intensive crops like paddy are encouraged through the enforcement of support prices. Similarly, power subsidies/free power policies at the state level encourage overexploitation of groundwater. (b) Farmer producer organizations (FPOs) are being promoted on a large scale in order to facilitate better input and output market access for smallholders. But, the functioning of FPOs is constrained by fund allocations and suffers from the usual problems of farm cooperatives despite their potential to enhance the viability of smallholder farms.
ii. In the case of Pakistan, (a) the seed sector needs immediate policy attention. Promoting domestic seed production rather than importing seeds is more sustainable. Besides, seed production enhances farm income. Identifying appropriate soils and regions for promoting seed production is the first priority. (b) Institutional credit systems are not serving the needs of smallholders at present. Given that access to credit is the lifeline for smallholders at the formal and informal levels, some lessons can be drawn from India, where formal commercial banks and informal self-help groups are actively involved in providing credit to smallholders.
iii. In the case of Bangladesh, (a) high intensity of chemical inputs is pushing the costs up and degrading the soils and water. Need to identify new technologies that would enhance production and reduce costs. (b) High cost of credit, in the absence of access to formal institutional credit and dependence on micro finance at higher interest rates, is impacting the viability of smallholder farms. Need to promote institutional credit and check the high interest rates in order to reduce the cost of capital for smallholders.
iv. In case Sri Lanka: (a) promoting complementary livelihood systems like crop-livestock/crop-fisheries, etc., would improve the viability of farming. (b) Gradual move toward precision farming rather than organic farming, which compromises on productivity, could help reduce externalities and improve land productivity.
v. In case of Bhutan: (a) appropriate policies and investments to reduce under-utilization of land are needed, i.e., reducing the area under fallows from the present 25% could enhance production automatically. (b) Improving access to farms through infrastructure development, like roads, could address the twin problems of reducing the walking time to farms, i.e., improving the productive time of workers and farmers, and reducing wildlife attacks as well.
Data availability statement
The original contributions presented in the study are included in the article/supplementary material, further inquiries can be directed to the corresponding author.
Author contributions
RV: Conceptualization, Writing – original draft, Writing – review & editing, Methodology, Formal analysis. DR: Validation, Project administration, Writing – review & editing, Conceptualization, Funding acquisition, Resources.
Funding
The author(s) declare that financial support was received for the research and/or publication of this article. This work was supported by the Asian Development Bank Institute, Tokyo, Japan.
Conflict of interest
The authors declare that the research was conducted in the absence of any commercial or financial relationships that could be construed as a potential conflict of interest.
Generative AI statement
The authors declare that no Gen AI was used in the creation of this manuscript.
Any alternative text (alt text) provided alongside figures in this article has been generated by Frontiers with the support of artificial intelligence and reasonable efforts have been made to ensure accuracy, including review by the authors wherever possible. If you identify any issues, please contact us.
Publisher’s note
All claims expressed in this article are solely those of the authors and do not necessarily represent those of their affiliated organizations, or those of the publisher, the editors and the reviewers. Any product that may be evaluated in this article, or claim that may be made by its manufacturer, is not guaranteed or endorsed by the publisher.
References
Anderson, J., Moler, A., and Kretchun, N. (2016). National survey and segmentation of smallholder households in bangladesh understanding their demand for financial, agricultural, and digital solutions, CGAP Working Paper.
Bangladesh Bureau of Statistics (BBS). (2010). Census of agriculture 2008, structure of agricultural holdings & livestock population, national series, Vol. 1. Statistics Division, Ministry of Planning, Government of Bangladesh, December.
Bangladesh Bureau of Statistics (BBS). (2022). Agriculture sample census 2020, crops report, national series, Vol. 2. Statistics and Informatics Division, Ministry of Planning, Government of Bangladesh, December.
Bhaduri, A., Amarasinghe, U. A., and Shah, T. N. (2012). An analysis of groundwater irrigation expansion in India. Int. J. Environ. Waste Manag. 9:372. doi: 10.1504/IJEWM.2012.046399
Department for International Development (2015). DFID’s conceptual framework on agriculture. London, UK: DFID.
Desai, B. M., and Namboodiri, N. V. (1997). Determinants of total factor productivity in Indian agriculture. Econ. Polit. Wkly. 32, A165–A171.
Fan, S., and Rue, C. (2020). “The role of smallholder farms in a changing world” in The role of smallholder farms in food and nutrition security. eds. S. Gomezy Paloma, et al., 13–28.
FAO (2015) The state of food insecurity in the world 2015: meeting the 2015 international hunger targets. Taking Stock of Uneven Progress FAO. Available online at: http://www.fao.org/policy-support/resources/resources-details/en/c/469455/
Gillman, S. Small farms produce more food than statistics show. Horizon, TX: The EU Research & Innovation Magazine (2019). Available online at: https://ec.europa.eu/research-and-innovation/en/horizon-magazine/small-farms-produce-more-food-statistics-show.
GoI. (2021). Situation assessment of agricultural households and land and livestock. National sample survey 77th round. Ministry of statistics and programme implementation, National Sample Survey Office.
Government of Bhutan (2000). Renewable natural resources statistics 2000 (volume I). Thimphu, Bhutan: Ministry of Agriculture.
Government of Bhutan (2009). rnr census of bhutan 2009. Thimphu, Bhutan: Renewable Natural Resource Statistics Division, Directorate Services, Ministry of Agriculture and Forestry, Policy and Planning Division.
Government of Bhutan (2019). RNR census of bhutan 2019. Thimphu, Bhutan: Renewable Natural Resource Statistics Division, Directorate Services, Royal Government of Bhutan, Ministry of Agriculture and Forestry.
Government of Pakistan (2012) Pakistan agriculture census, 2010. Islamabad, Pakistan: Pakistan Bureau of Statistics.
Government of Sri Lanka (2002) Agriculture census 2002, agricultural activities Sri Lanka Department of Census and Statistics Available online at: https://www.statistics.gov.lk/Agriculture/StaticalInformation/AgriculturalCensus2002/SmallHolding_LessQuarter#gsc.tab=0
Government of Sri Lanka (2019). General report economic census 2013–14, agricultural activities Sri Lanka. Colombo, Sri Lanka: Department of Census and Statistics, Ministry of National Policies and Economic Affairs, Bathtaramulla, June.
Hazell, P., Poulto, C., Wiggins, S., and Dorward, A. (2010). The future of small farms: trajectories and policy priorities. World Dev. 38, 1349–1361. doi: 10.1016/j.worlddev.2009.06.012
Herrero, M., Thornton, P. K., Power, B., Bogard, J. R., Remans, R., Fritz, S., et al. (2017). Farming and the geography of nutrient production for human use: a transdisciplinary analysis. Lancet Planet. Health 1, e33–e42. doi: 10.1016/S2542-5196(17)30007-4
Hettithanthri, O., Sandanayake, S., Magana-Arachchi, D., Wanigatunge, R., Rajapaksha, A. U., Zeng, X., et al. (2021). Risk factors for endemic chronic kidney disease of unknown etiology in Sri Lanka: retrospect of water security in the dry zone. Sci. Total Environ. 795:148839. doi: 10.1016/j.scitotenv.2021.148839
Hussain, A., Akhtar, W., and Jabbar, A. (2022). Risk management for small farmers in Pakistan: a review. Pak. J. Agric. Sci. 59, 247–259. doi: 10.21162/PAKJAS/22.334
IFAD (2022). Bhutan: building resilient commercial smallholder agriculture. GAFSP project design report. Rome, Italy: IFAD Asia and the Pacific Division Programme Management Department.
IFPRI (2018) Agricultural total factor productivity (TFP), 1991–2014: 2018 global food policy report annex table 5. Available online at: https://www.ifpri.org/publication/agricultural-total-factor- productivity-tfp-1991-2014-2018-global-food-policy-report
Lowder, S. K., Sánchez, M. V., and Bertini, R. (2021). Which farms feed the world and has farmland become more concentrated? World Dev. 142:105455. doi: 10.1016/j.worlddev.2021.105455
Lowder, S. K., Skoet, J., and Raney, T. (2016). The number, size, and distribution of farms, smallholder farms, and family farms worldwide. World Dev. 87, 16–29. doi: 10.1016/j.worlddev.2015.10.041
Mia, M. A., Lee, H. A., Chandran, V. G. R., Rasiah, R., and Rahman, M. (2019). History of microfinance in Bangladesh: a life cycle theory approach. Bus. Hist. 61, 703–733. doi: 10.1080/00076791.2017.1413096
Murthy, C. S., and Reddy, M. S. (2017). AP land licensed cultivators act in retrospect and prospect. J. Land Rural Stud. 5, 1–11. doi: 10.1177/2321024916677597
Reddy, M. S., and Murthy, C. S. (2021). Land lease market under irrigated and rainfed conditions in Andhra Pradesh and Telangana. Indian J. Agric. Econ. 76, 261–277. doi: 10.63040/25827510.2021.02.004
Reddy, V. R., Raut, D. B., and Sonobe, T. (2025). Future of small holder farms in asia. Asian Development Bank Institute, Tokyo. Available online at: https://www.adb.org/sites/default/files/publication/1041036/future-smallholder-farming-asia.pdf.
Ricciardi, V., Ramankutty, N., Mehrabi, Z., Jarvis, L., and Chookolingo, B. (2018a). How much of the world’s food do smallholders produce? Glob. Food Secur. 17, 64–72. doi: 10.1016/j.gfs.2018.05.002
Ricciardi, V., Ramankutty, N., Mehrabi, Z., Jarvis, L., and Chookolingo, B. (2018b). An Open-access Dataset of Crop Production by Farm Size from Agricultural Censuses and Surveys. Data Brief 19, 1970–1988. doi: 10.1016/j.dib.2018.06.057
Saeed, K. (2023). Pakistan’s agriculture 2023: setting agriculture onthe path of growth. pakistan agriculture coalition and pakistan business council, march. Available online at: https://www.pbc.org.pk/wp-content/uploads/The-State-of-Pakistans-Agriculture.pdf.
Samberg, L. H., Gerber, J. S., Ramankutty, N., Herrero, M., and West, P. C. (2016). Subnational distribution of average farm size and smallholder contributions to global food production. Environ. Res. Lett. 11:124010. doi: 10.1088/1748-9326/11/12/124010
Sandhu, A. J. (n.d.). Contributions and achievements of agricultural census organisation. Presentation, Agricultural Census Organization. Statistics Division, Islamabad: Government of Pakistan.
Keywords: smallholder farms, food security, economic viability, profitability, natural, physical, human, financial
Citation: Reddy VR and Rahut DB (2025) Smallholder viability and food security in South Asia: constraints and policy options. Front. Sustain. Food Syst. 9:1657409. doi: 10.3389/fsufs.2025.1657409
Edited by:
Xin Wang, Longyan University, Longyan, ChinaReviewed by:
Wajid Hasan, Bihar Agricultural University, IndiaShivam Kumar Sharma, Jawaharlal Nehru University, India
Muhamad Nurdin Yusuf, Universitas Galuh, Indonesia
Inna Sokhan (Lozynska), Sumy National Agrarian University, Ukraine
Copyright © 2025 Reddy and Rahut. This is an open-access article distributed under the terms of the Creative Commons Attribution License (CC BY). The use, distribution or reproduction in other forums is permitted, provided the original author(s) and the copyright owner(s) are credited and that the original publication in this journal is cited, in accordance with accepted academic practice. No use, distribution or reproduction is permitted which does not comply with these terms.
*Correspondence: V. Ratna Reddy, cHJvZnZyYXRuYXJlZGR5QGdtYWlsLmNvbQ==