 Beihe Wu1†
 Jiangtao Gao
 Liguo Wang
 Haoxiang Zhao
- 1College of Economics and Management, Jiangxi Agricultural University, Nanchang, China
- 2School of Economics and Trade, Jiangxi University of Finance and Economics, Nanchang, China
- 3Agricultural and Rural Development Research Institute, Jiangxi Academy of Social Sciences, Nanchang, China
- 4College of Land Resources and Environment, Jiangxi Agricultural University, Nanchang, China
Introduction: Agricultural productive services (APS), as a vital component of modern agricultural industrial systems, play a critical role in advancing green agricultural transformation and sustainable development.
Methods: This study investigates the spatiotemporal evolution, regional disparities, and influencing factors of the coupling coordination degree (CCD) between APS and the carbon efficiency in rice production (RCE) in Jiangxi Province, China. The spatiotemporal patterns, dynamic trends, and driving mechanisms were analysed using kernel density estimation, Dagum Gini coefficient decomposition, and the geographically and temporally weighted regression (GTWR) model.
Results: The results indicate that the CCD between APS and RCE demonstrates a weakly multipolar dynamic evolution pattern, exhibits an upward trend but remains suboptimal, with significant regional disparities driven by interregional hypervariable density (49.18% contribution). Influencing factors displayed notable spatiotemporal heterogeneity, with contributions ranked as follows: rural population-land scale > financial support for agriculture > planting structure > urban–rural income gap > multiple cropping index > urbanization level.
Discussion: Our findings offer insights applicable to Global South countries facing similar challenges in balancing productivity and decarbonization, and we propose actionable strategies to enhance APS systems, establish cross-regional coordination mechanisms, and optimize resource allocation for low-carbon agricultural transitions.
1 Introduction
As one of China’s three primary staple crops, rice is pivotal in ensuring national food security. Fluctuations in its production efficiency directly influence the stability of grain supply, serving as a critical indicator for assessing food security conditions (Lin et al., 2022; Liu and Zhou, 2021). Historically, productivity gains in Chinese rice cultivation have predominantly relied on intensive inputs of water resources, land, and agrochemicals. While this approach has partial ly safeguarded stable yields and supply, it has concurrently imposed substantial environmental costs, particularly regarding sustainability (Xu et al., 2013; Yong et al., 2022). Empirical evidence reveals that rice paddies contribute approximately 48% of total agricultural greenhouse gas emissions in China, with methane (CH4) accounting for 94% of these emissions (Bao et al., 2024; Lu et al., 2024). Such emissions significantly exacerbate the risks of greenhouse effect and climate change, underscoring the urgency of addressing this dual challenge. Consequently, the central paradox confronting China’s rice production system has evolved from a dualistic “resource-development coordination” to a tripartite dilemma balancing “resource utilization, environmental preservation, and developmental imperatives” (Yan et al., 2025). Against the backdrop of China’s ongoing agricultural green transition, reconciling food security objectives with the imperative to mitigate greenhouse gas emissions during agricultural processes has emerged as a critical pathway toward sustainable agricultural development.
Under mounting pressures from tightening resource constraints, escalating non-point source pollution risks, and structural imbalances in ecosystems, traditional agricultural production models characterized by high inputs, high pollution, and low efficiency have become increasingly unsustainable and necessitate urgent improvements in carbon efficiency within agricultural systems—defined as achieving desired output growth while reducing redundant carbon emissions under given factor inputs (Bai et al., 2019; Zhu and Huo, 2022). As a critical metric for evaluating low-carbon agricultural performance, carbon efficiency holistically reflects the input–output relationship between agricultural resource utilization and carbon mitigation effects (Bajan and Mrówczyńska-Kamińska, 2020). While existing studies have measured and analyzed carbon efficiency in broad or narrow agriculture (Han et al., 2024; Liu and Yang, 2021; Yang et al., 2021) systematic assessments focusing on single staple crops—particularly their carbon efficiency dynamics—remain underexplored and warrant deeper investigation. In addition, rice cultivation is a major contributor to China’s agricultural carbon emissions (Shen et al., 2025; Song et al., 2023). Despite generating substantial emissions during production, rice ecosystems harbor significant carbon sequestration potential through plant biomass and soil organic carbon accumulation (Chen et al., 2021; Chen et al., 2022a, 2022b). Prevailing methodologies for constructing carbon efficiency evaluation systems, however, predominantly emphasize carbon sources within agricultural ecosystems while neglecting the quantifiable value of carbon sinks, resulting in fragmented and incomplete assessment frameworks. This study advances traditional carbon efficiency evaluation by integrating a “carbon reduction and sink enhancement” perspective to address this gap. Specifically, we distinguish rice carbon sinks as desirable outputs and carbon emissions as undesirable outputs, thereby establishing a more scientific and precise composite carbon efficiency index for rice production systems.
The development of agricultural productive services (APS) is a critical component of agricultural modernization. It offers innovative pathways to transform conventional farming practices and accelerate green transitions in agriculture (Geng et al., 2024; Shi et al., 2024). Its strategic implementation is significant for optimizing rice production systems—transitioning cultivation paradigms, and enhancing productivity (Li and Li, 2020; Wu et al., 2024). Functionally, APS is a pivotal mechanism to reform extensive agricultural management models and advance low-carbon transitions. Addressing inefficiencies inherent in fragmented smallholder operations—such as suboptimal factor allocation and low productivity—systematically resolves structural bottlenecks in traditional farming systems (He et al., 2023; Huan et al., 2022) Furthermore, APS permeates entire agricultural value chains, with outsourcing service providers incentivized to adopt low-carbon practices across production stages. This characteristic enables APS to simultaneously mitigate ecosystem imbalances, improve resource-use efficiency, and reduce environmental costs (Xu et al., 2024; Yang et al., 2024). Consequently, the evolution of APS and the restructuring of agricultural production systems are inextricably linked during green transformation processes, necessitating integrated policy design that synchronizes both dimensions (Qiu et al., 2022). Given this context, establishing a synergistic development framework that harmonizes APS with the carbon efficiency of rice production (RCE) becomes imperative. Such integration safeguards national food security and creates dual-win scenarios for sustainable agricultural development, bearing substantial theoretical and practical relevance.
Extensive studies have corroborated the socioeconomic and ecological benefits of APS, demonstrating their capacity to enhance smallholder welfare (Mi et al., 2020; Xu et al., 2022a, 2022b) elevate rural incomes (Benin, 2015; Lyne et al., 2018) facilitate land transfer (Cai et al., 2021; Liu et al., 2022), restructure production models (He et al., 2023), and improve agricultural productivity (Chen et al., 2022a, 2022b; Xu et al., 2022a, 2022b). Additionally, APS has proven instrumental in incentivizing farmland conservation practices (Chen et al., 2022a, 2022b; Emmanuel et al., 2016) and reducing agrochemical inputs (Chen and Liu, 2023; Huan and Zhan, 2022; Shi et al., 2023). Nevertheless, there remains room for further research on the topic of APS and RCE, and few studies have systematically examined their coupling coordination relationship within a unified analytical framework, leaving this nexus underexplored despite its relevance to sustainable agriculture.
This study addresses this research void by constructing a comprehensive analytical framework to unravel the intrinsic linkages between APS and RCE. Leveraging panel data from 85 counties in Jiangxi Province, China (2012–2022), we employ a modified coupling coordination degree model to quantify their synergistic interactions. Kernel density estimation and Dagum Gini coefficient decomposition are applied to dissect temporal–spatial evolution patterns and regional disparities. At the same time, the geographically and temporally weighted regression (GTWR) model reveals the spatiotemporal heterogeneity of influencing factors. The findings aim to inform evidence-based policymaking for agricultural green transformation, offering theoretical and practical insights into reconciling productivity enhancement with low-carbon development.
The possible marginal contribution of this study may be as follows. First, our study transcends the conventional unidirectional perspective that predominantly examines APS as drivers of agricultural carbon efficiency. We systematically investigate the coupling coordination relationship between APS and RCE by constructing an integrated analytical framework. This approach addresses a critical gap in existing research, which largely overlooks bidirectional synergies and systemic interactions between these two dimensions. Secondly, this study utilizes panel data from 85 counties in Jiangxi Province spanning an 11-year period, with the analytical focus situated at the county level. This approach offers a robust and granular foundation for formulating targeted and region-specific agricultural environmental policies. The findings not only support the low-carbon transformation of agriculture in alignment with China’s “dual carbon” objectives but also provide a replicable Chinese model with practical insights for global food security and climate governance. Finally, This study also used the GTWR model to reveal the spatiotemporal heterogeneity of factors affecting the coupling coordination degree (CCD), which is of great significance for understanding the complexity of the coupling coordination relationship between APS and RCE under different time and space backgrounds. Overall, the above contributions partially compensate for the theoretical and practical shortcomings in agricultural green transition strategies. This research provides scientifically grounded, policy-adaptive guidance for major grain-producing regions in China and offers transferable lessons for Global South countries confronting similar sustainability challenges in intensive cropping systems.
2 Theoretical analysis of the CCD between APS and RCE
The coupling coordination degree (CCD) constitutes a pivotal metric for quantifying the interdependence intensity and synergistic development level between interconnected systems, providing a quantifiable reflection of their interactive dynamics (Yang et al., 2020). Within this framework, coupling denotes bidirectional interactions and mutual influences among systems, while coordination characterizes attaining a benign synergistic state through such interactions. Building upon this conceptual foundation, the CCD model in this study systematically examines the reciprocal influences, dependency relationships, and harmonization levels between APS and RCE. Existing studies identify three pivotal drivers of system interactions: factor mobility and allocation, industrial restructuring and upgrading, and technological innovation diffusion (Dong et al., 2023; Sun et al., 2025). By extension, these mechanisms—manifested through optimized factor allocation, industrial transformation, and innovation spillovers—similarly govern the interactive pathways between APS advancement and carbon efficiency enhancement in rice cultivation systems.
On the one hand, APS exerts a catalytic role in advancing RCE. During the pre-production phase, agricultural operation guidance services provide technical and managerial support for rice producers, enabling the formulation of low-carbon cultivation plans and the adoption of green production methods (Chen et al., 2022a, 2022b). This facilitates systemic transformation toward low-carbon farming practices. Concurrently, agricultural input supply services optimize factor allocation based on soil diagnostics and crop requirements, achieving source reduction of agrochemical-derived emissions (Emmanuel et al., 2016). In the production phase, precision agricultural machinery implements targeted field management to mitigate emissions from excessive chemical applications (Qing et al., 2023). Furthermore, optimized irrigation-drainage systems enhance nutrient uptake efficiency while improving soil aeration, achieving dual effects of “carbon mitigation and sink enhancement” (Choudhary and Meena, 2024). During the post-production phase, agricultural product processing and marketing services ensure rapid market access for rice products, reducing energy consumption and carbon emissions in intermediate links. Furthermore, integrated APS supply chains promote the development of circular economy models in the rice industry, delivering dual benefits of “quality improvement and efficiency enhancement” (Lu et al., 2023).
On the other hand, RCE exerts feedback effects that drive APS advancement. From the demand perspective, enhanced RCE signifies innovations in low-carbon production technologies and management systems within contexts of green agricultural transition. This progression inherently elevates functional requirements for APS, providing foundational impetus for service sector upgrading (He et al., 2021). On the supply side, RCE improvement manifests through either increased desirable outputs or reduced undesirable outputs under equivalent factor inputs. Achieving these dual objectives necessitates enhanced specialization and coordination among APS entities, amplifying service demand. Furthermore, given defined output targets, APS entities need fewer production factors and lower production costs to improve carbon efficiency. This enables them to generate higher benefits in the production services process, thereby effectively enhancing the comprehensive benefits (Yu et al., 2024).
In conclusion, he advancement of APS and the enhancement of RCE are mutually reinforcing. Within their respective domains, they establish a synergistic mechanism through industrial structure upgrading, optimization of factor allocation, and the diffusion of technological innovation. These interrelated dynamics collectively form the theoretical foundation for the coupled and coordinated development of APS and RCE. The overall theoretical framework is illustrated in Figure 1.
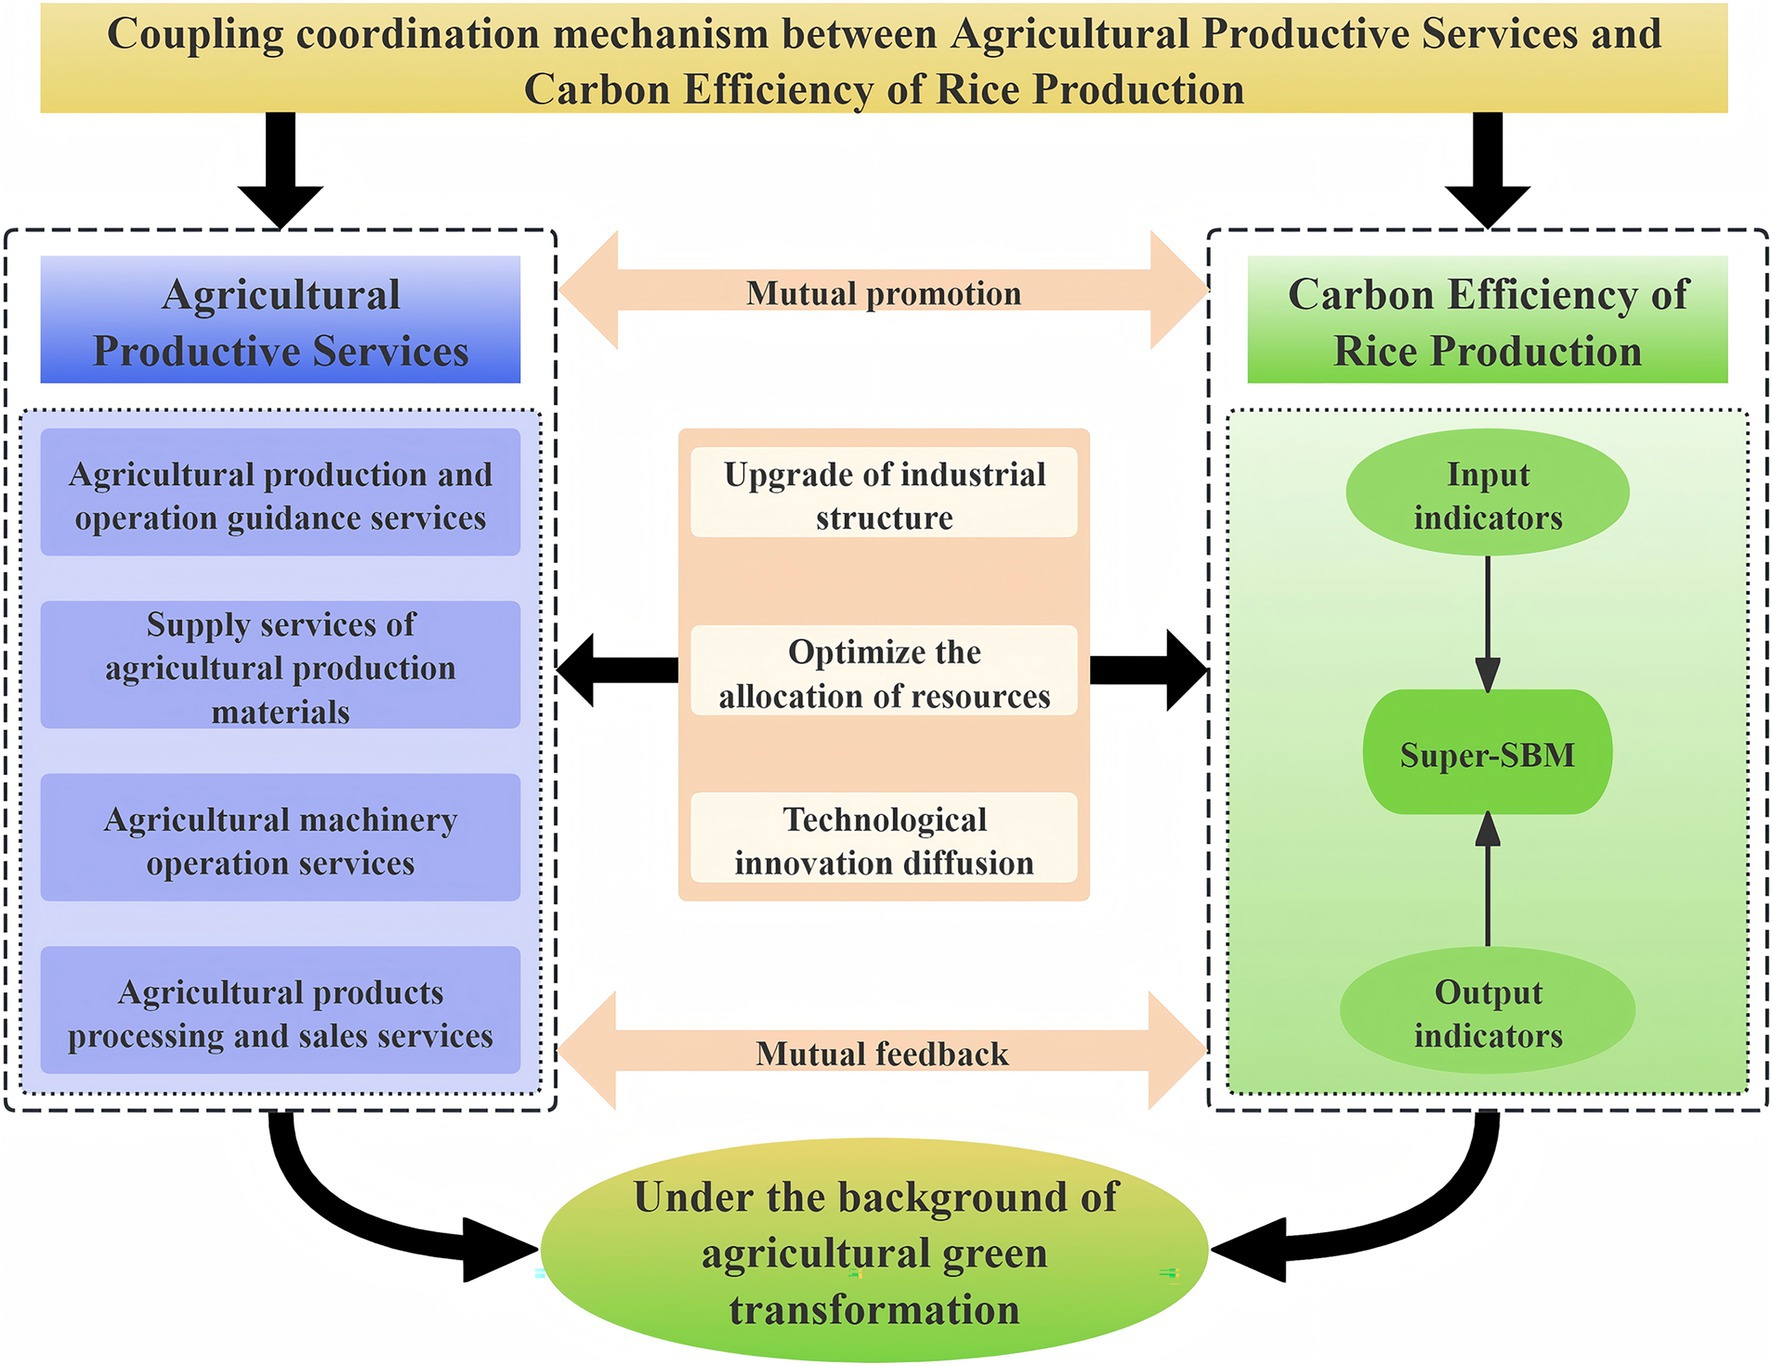
Figure 1. Theoretical analysis framework of the coupling and coordination between APS and RCE.
3 Research design
3.1 Research area and data
Jiangxi Province, situated in southeastern China (24°29′14″–30°04′43″N, 113°34′18″–118°28′56″E), occupies the southern bank of the middle-lower Yangtze River (Figure 2A). Its topography is predominantly characterized by mountainous (36%) and hilly (42%) terrains, forming a north-opening basin surrounded by eastern, southern, and western peripheral ranges with alluvial plains in the central-northern region (Figure 2B). It should be noted that the elevation data presented in Figure 2B was obtained from the China Geospatial Data Cloud Platform. Negative elevation values are referenced to mean sea level, with their absolute magnitudes indicating the vertical distance between ground surface points and the reference datum. Under a subtropical monsoon climate regime, the province hosts four primary grain production zones: Poyang Lake Plain, Ganfu Plain, Jitai Basin, and western Jiangxi region (Figure 2C). As one of China’s 13 major grain-producing provinces, Jiangxi holds a national high typical and representative nationwide in rice cultivation, consistently ranking third in paddy output and playing a pivotal role in safeguarding national food security (Liang et al., 2024). Notably, Jiangxi was among the first provinces to implement nationwide pilot programs for comprehensive agricultural socialized services in 2013. Multiple counties have since been designated as national APS demonstration zones, establishing institutional foundations for green agricultural transition and unlocking transformative potential in sustainable farming practices.
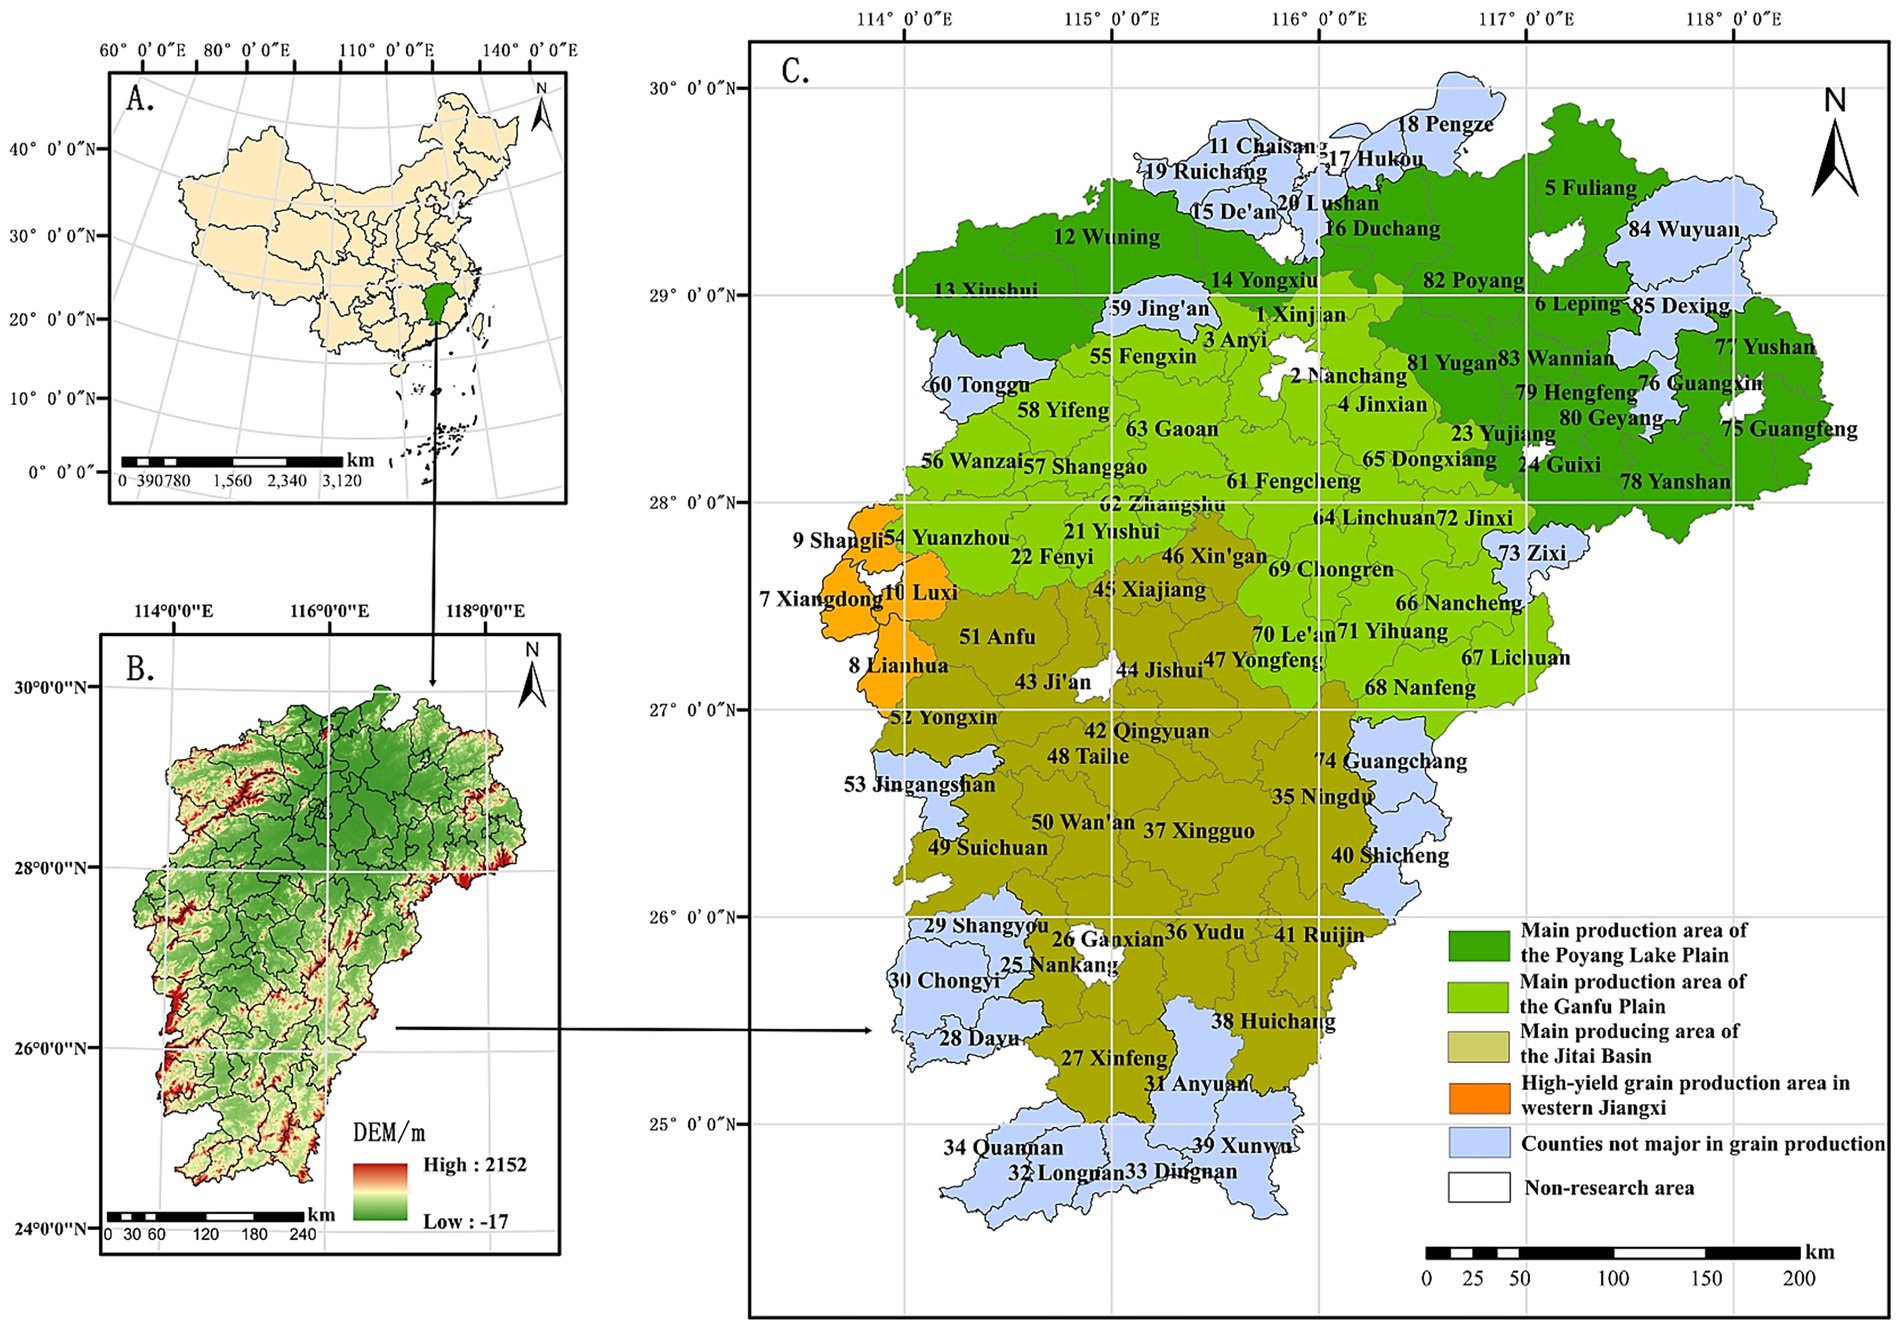
Figure 2. Geographical distribution of the study area.
This study focuses on county-level rice production systems in Jiangxi Province. The analysis employs panel data from 85 counties spanning 2012–2022, selected based on data accessibility and consistency in statistical reporting standards. This temporal scope aligns with Jiangxi’s pioneering role as one of China’sfirst provinces to initiate APS pilot initiatives in 2013, ensuring policy relevance across the study period. Primary data were sourced from the Jiangxi Statistical Yearbook (2013–2023), Prefectural Statistical Yearbooks of Jiangxi (2013–2023), and official county statistical bulletins. For the extremely small number of missing values in the original data, linear interpolation or other appropriate data processing methods were used to fill and handle them.
3.2 Research methodology
3.2.1 Measuring RCE with super-SBM model
The super-efficiency Slacks-Based Measure (SBM) model demonstrates methodological advantages over conventional DEA approaches by explicitly accounting for input–output slack variables. This framework enables precise differentiation among decision-making units (DMUs) with efficiency scores ≥1 while ensuring robust efficiency quantification (Fukuyama and Weber, 2009). The model is presented as follows:
In Equations 1–2, ρ represents the RCE of counties in Jiangxi Province, values ≥1 indicate optimal frontier performance, and n denotes the number of DMUs, corresponding to 85 county-level units in Jiangxi. Each DMU incorporates m inputs, r1 desirable outputs, and r2 undesirable outputs. The slack variables , , and represent input, desirable, and undesirable output, respectively. , , and denote the optimized input i, desirable output s, and undesirable output q for DMU j after slack adjustment. denotes the weight coefficient.
3.2.2 The modified coupling coordination model
Conventional coupling coordination degree (CCD) models often yield overly concentrated result distributions, exhibiting limited discriminative validity (Yin et al., 2023). We adopt a modified coupling coordination model (Zhang et al., 2024) to address this methodological constraint to quantify the interactive coordination between APS and RCE. This enhanced framework provides a more nuanced differentiation of coordination levels while maintaining measurement fidelity. The model structure is expressed as:
In Equation 3, n = 2, Ui and Uj are APS and RCE, respectively. Assuming is U2, Equation 1 can be simplified as:
In Equation 4, C is the coupling degree between APS and RCE, with a value range of [0, 1]. The coupling degree can only reflect the interaction and impact between the level of APS and RCE, and it cannot reflect the coordination relationship between the two. Further CCD models need to be introduced as follows:
In Equations 5–6, T is the comprehensive coordination index of APS and RCE, α and β are undetermined coefficients, which are assigned to 0.5. D is the CCD of APS and RCE, and the value range is [0, 1]. Referring to the existing literature (Sun et al., 2024), the actual measured CCD is divided into 10 grades by an equal interval division method (Table 1).
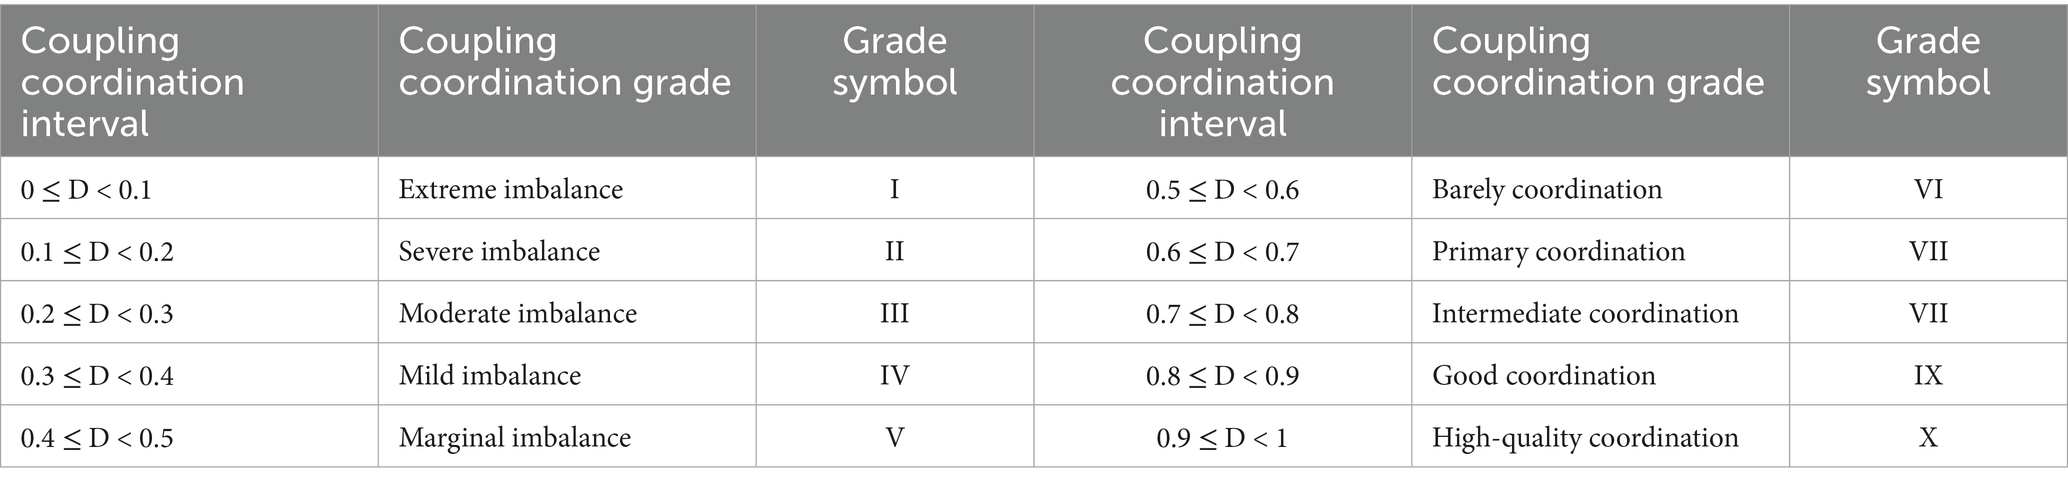
Table 1. Division of coupling coordination grade between APS and RCE.
3.2.3 Kernel density estimate
In this paper, Kernel density estimation is used to analyze the dynamic evolution trend of the CCD between APS and RCE in all counties and grain functional areas of Jiangxi Province. The specific formula is as follows:
In Equation 7, Di is the CCD between the APS and the RCE in i county, is the mean value of the CCD of all counties, n is the number of counties, h is the bandwidth, k(•) is a kernel function, which is defined as a Gaussian kernel function in this study.
3.2.4 Dagum Gini coefficient decomposition
Based on the existing literature (Li et al., 2024), this study used the Dagum Gini coefficient decomposition method to analyze the spatial difference and source of the CCD between APS and RCE. The calculation and decomposition process of the Dagum Gini coefficient is as follows:
In Equation 8, G is the overall Gini coefficient, is the mean value of the CCD, n is the number of counties, k is the number of regions, ( ) is the CCD of any county in the j (h) region, ( ) is the number of counties in the j (h) region.
Based on the above formula, the Gini coefficient in each region and the Gini coefficient between regions are calculated. The specific formula is as follows:
In Equations 9–10, and are the mean values of the CCD in the region, which is defined as > . The global overall Gini coefficient is further decomposed into intra-regional Gini coefficient contribution and inter-regional Gini coefficient contribution . The specific decomposition is as follows:
In Equations 11–13, = /n and = /n are the proportion of the number of counties in the region and the proportion of the CCD value, respectively. The product of the two represents the weight of the regional Gini coefficient.
Because of the cross term in the contribution of the inter-regional Gini coefficient, the net value of the contribution of the inter-regional Gini coefficient needs to be calculated:
In Equations 14–16, is the relative gap between the CCD between the two regions of j and h, is the difference between the CCD between the two regions of j and h, and is the super variable first moment. Based on this, the inter-regional Gini coefficient contribution is decomposed into the inter-regional Gini coefficient net contribution and the super-variable density contribution . The specific formula is as follows:
The overall Gini coefficient G can be decomposed into:
3.2.5 GTWR model
The GTWR model can consider the non-stationarity of time and space and can analyze the different characteristics of influencing factors in time and space (He and Huang, 2018). This study employs the GTWR model to conduct a spatiotemporal heterogeneity analysis of the factors influencing the CCD between APS and RCE. The specific model is as follows:
In Equation 20, represents the dependent variable of the i th county, which refers to the CCD in this paper; represents the value of the k th influencing factor in the i th county; denotes the intercept, where are the longitude, latitude and time of the i county, respectively. represents the regression coefficient; β > 0 indicates a positive correlation between the influencing factors and the CCD, and vice versa; is a random disturbance term.
3.3 Variable selection
3.3.1 Construction of the index system for RCE
This study constructs an input index system from the three dimensions of the labor force, land, and agricultural materials based on the actual situation of rice production. It takes rice yield and carbon sink as desirable output and rice carbon emissions as undesirable output. The specific indicators and explanations are shown in Table 2.
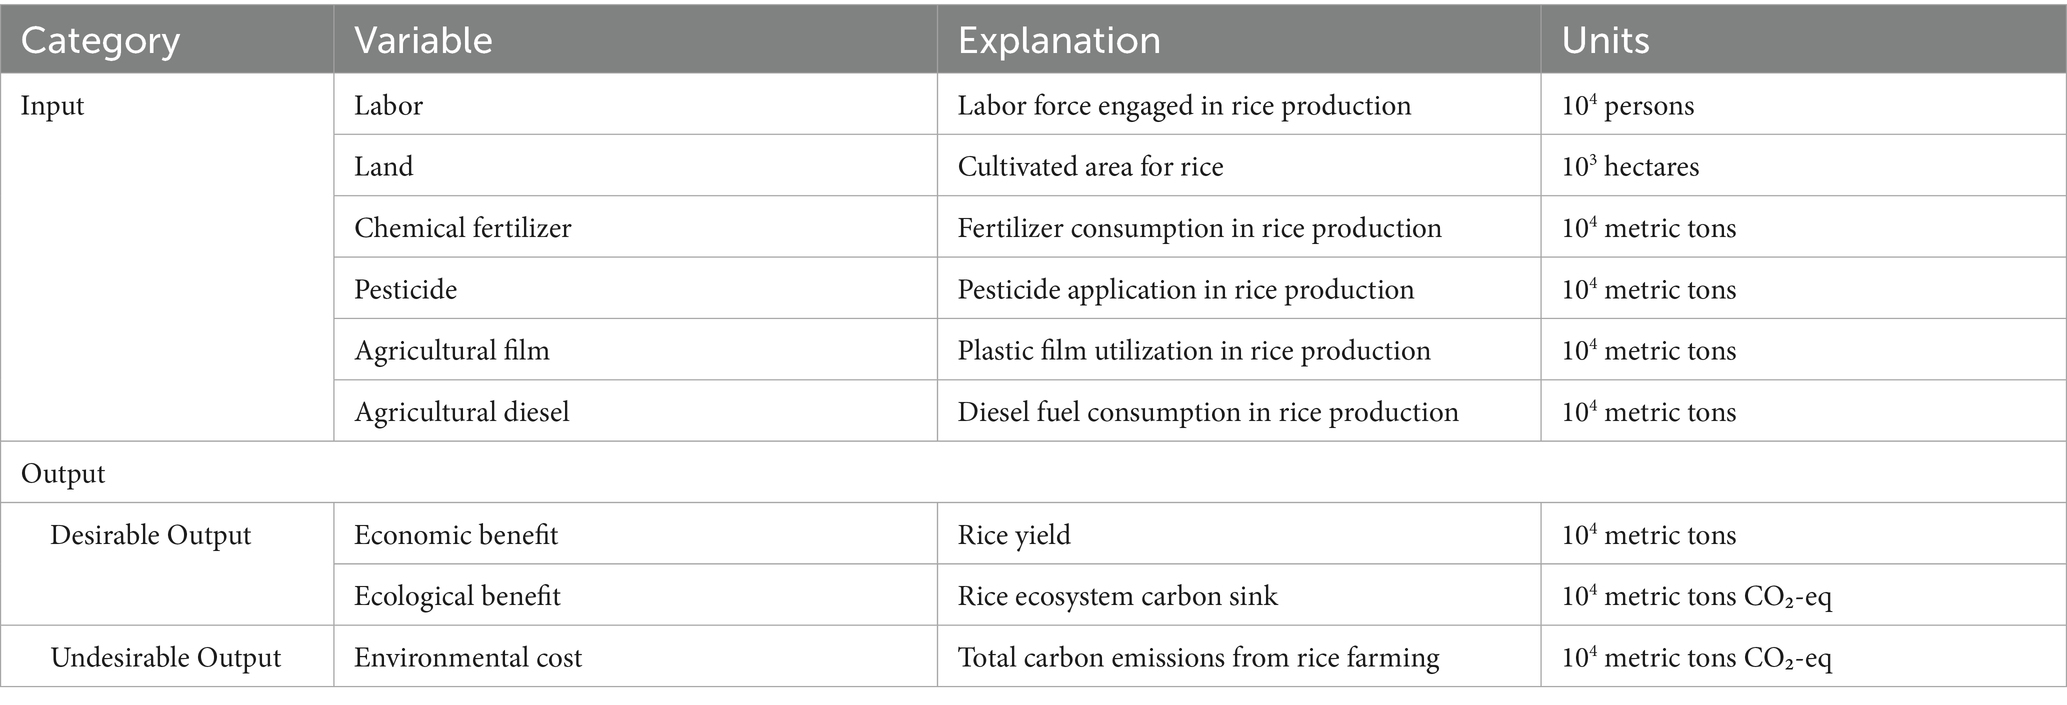
Table 2. Input–output indicator system for RCE assessment.
3.3.1.1 Input indicators
To ensure consistency between input indicators and rice output metrics, this study employs a weighting coefficient method to disaggregate production factors (Lu et al., 2024). Two coefficients are defined: A = (Agricultural Output Value / Total Output Value of Agriculture, Forestry, Animal Husbandry, and Fishery) × (Rice Sown Area / Total Sown Area of Crops); B = Rice Sown Area / Total Sown Area of Crops. Land input retains the rice sown area metric. Labor input is calculated as Coefficient A × Agricultural, forestry, animal husbandry, and fishery industry employees, and all other input indicators are multiplied by Coefficient B. It should be noted that the original data pertaining to input indicators, including chemical fertilizers, pesticides, agricultural mulch films, and agricultural diesel, were sourced from the “Jiangxi Statistical Yearbook (2013–2023),” the “Statistical Yearbooks of Jiangxi’s Prefecture-level Cities (2013–2023),” and the official county-level statistical bulletins issued annually.
3.3.1.2 Output indicators
1 Carbon sink estimation. Rice carbon sinks are quantified following the methodology proposed by Chen et al. (2022a, 2022b).
In Equation 21, Cs denotes the total carbon sink of rice cultivation, Cr represents the photosynthetic carbon assimilation rate of rice, Yr is the economic yield of rice crops, Wr is the moisture content of the economic product, Rr is the root-to-shoot ratio coefficient, and Hr is the harvest index (economic coefficient). The rice crops’ carbon absorption rate, water content, economic coefficient, and root-shoot ratio were set to 0.41, 0.12, 0.45 and 0.60, respectively.
2 Calculation of carbon emissions from rice cultivation. Total carbon emissions from rice production systems encompass direct and indirect carbon emission equivalents generated throughout the entire cultivation cycle, from field tillage to harvest. Drawing on established methodologies (Chen et al., 2022a, 2022b; Li et al., 2023; Wu et al., 2024), this study quantifies carbon emissions using the emission factor approach, addressing two primary sources: agricultural input utilization and rice growth processes. To account for data limitations in tillage area quantification, the actual sown area of rice is adopted as a proxy for tillage area. All other agricultural inputs are multiplied by coefficient B. The proposed model is formulated as follows:
In Equation 22, Ce denotes the total carbon emissions from the rice production system (kg CO₂-eq), where k represents emission source categories (k = 1,2,3,…), encompassing agricultural inputs and rice growth processes. The ek quantifies emissions from each source, with δ and ω corresponding to the emission factor and actual input quantity of the source, respectively. For analytical consistency, methane (CH₄) emissions are converted to carbon equivalents using the standardized conversion: 1 t CH₄ = 6.82 t CO₂-eq. Emission factors for all sources and their referenced literature are detailed in Table 3.
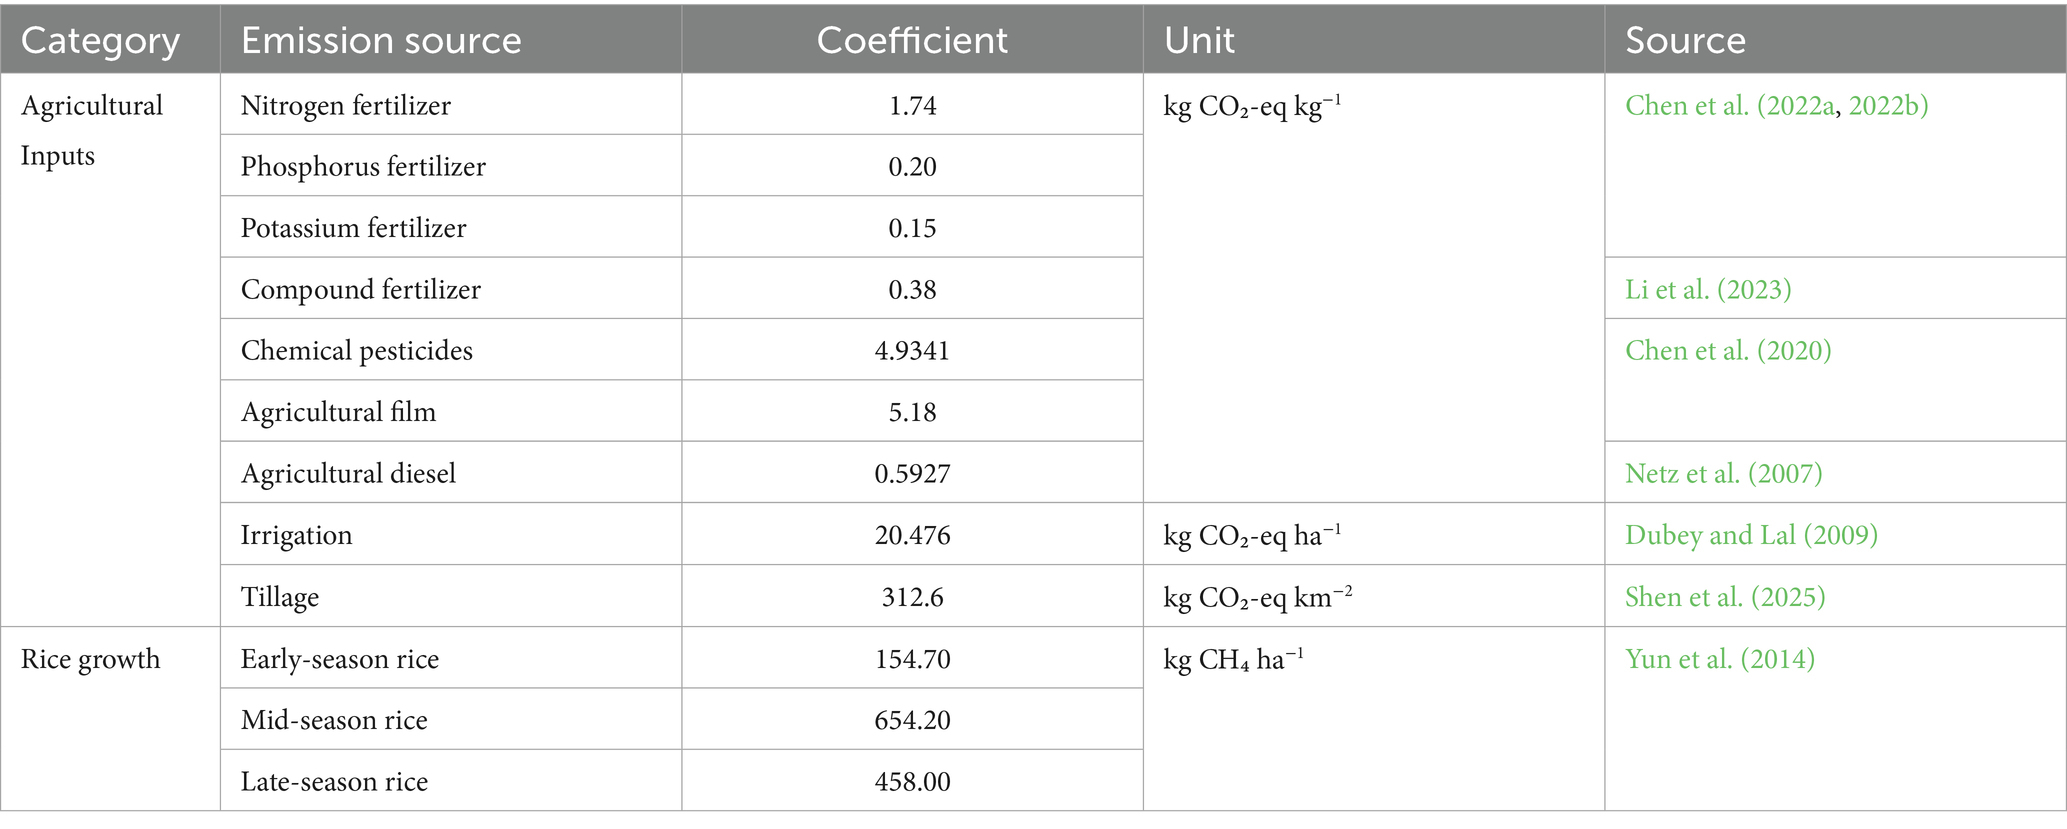
Table 3. Carbon-emission sources and coefficients.
3.3.2 Selection of indicators for APS
According to the classification by China’s National Bureau of Statistics, the agriculture, forestry, animal husbandry, and fishery services sector constitutes a component of the gross output value of agriculture, forestry, animal husbandry, and fishery. The development of APS is an important indicator of the deepening of the agricultural division of labor and the upgrading of industrial structure. Its development level is a comprehensive concept that can directly reflect the proportion of the service industry in the entire agricultural industry chain. This metric must align with statistical logic and modern agricultural development objectives. On the basis of the existing research (Shi et al., 2024; Wu et al., 2024; Xu et al., 2022a, 2022b) this study intends to use the ratio of the output value of agriculture, forestry, animal husbandry, fishery and service industry to the total output value of agriculture, forestry, animal husbandry and fishery as a quantitative index to evaluate the development level of APS.
3.3.3 Selection and explanation of influencing factors index of CCD
Current scholarship remains limited on factors influencing the interactive coordination mechanisms between APS and RCE. According to the mechanism analysis of coupling coordination and other correlation studies in the previous text, we operationalize the IPAT theoretical (York et al., 2003) framework to construct a multidimensional indicator system spanning economic, social, and policy dimensions. At the economic level, the main factors include the scale of rural population-land (SRPL), multiple cropping index (MCI), and planting structure (PS). The social level includes the urbanization level (URB) and the urban–rural income gap (URIG). The policy level is the financial support for agriculture (FSA). Therefore, the index system of CCD influencing factors was finally constructed based on six factors at three levels (Table 4).
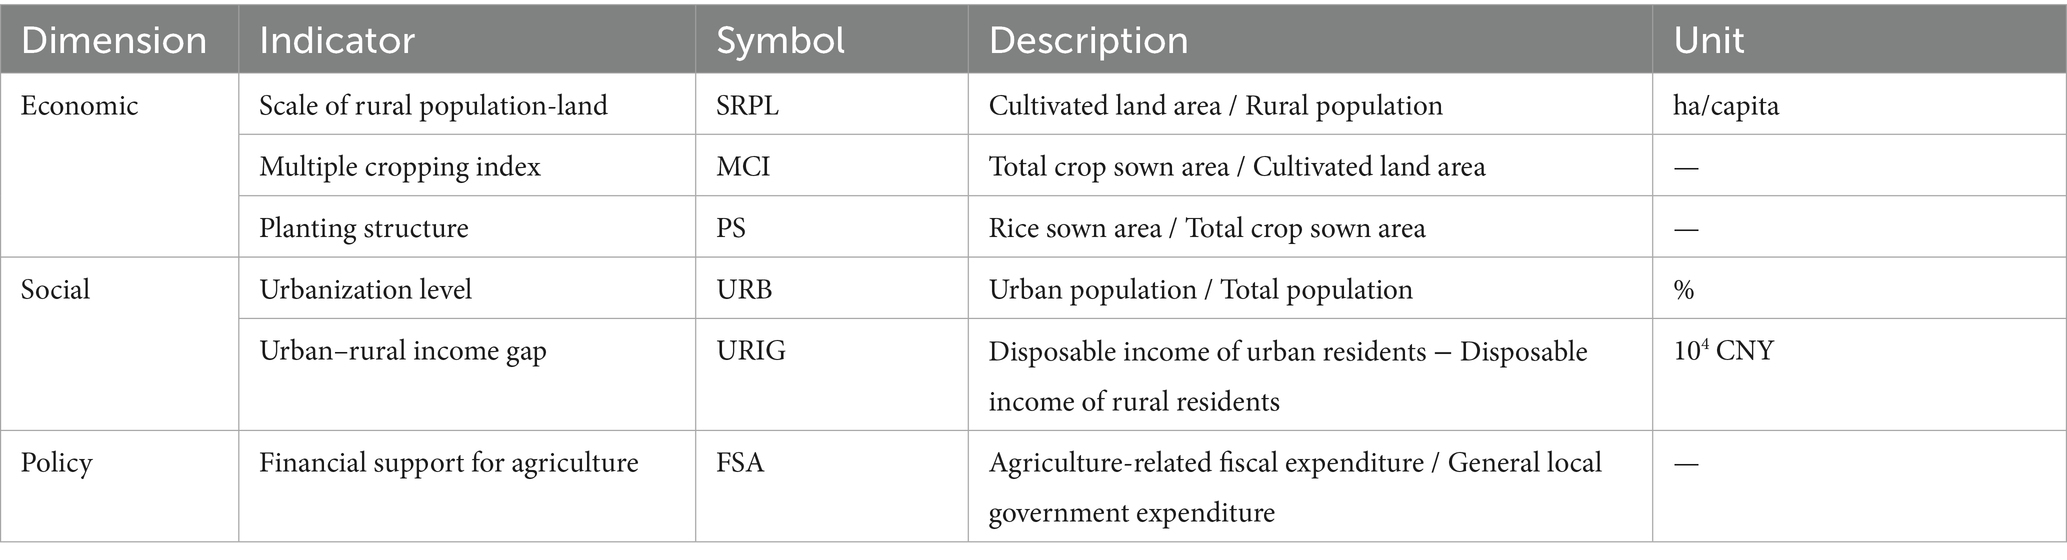
Table 4. Indicator system of influencing factors for CCD.
4 Results
4.1 Spatiotemporal evolution of APS and RCE
To investigate the spatiotemporal patterns and evolutionary trajectories of APS and RCE across Jiangxi’s counties, we conducted quartile-based classification using the natural breaks method in ArcGIS 10.8. The county-level APS and RCE metrics for 2012, 2015, 2018, and 2022 were systematically categorized into four tiers, as visualized in Figure 3. For cartographic clarity and space optimization, county identifiers in the maps are represented numerically, with corresponding geographical labels cross-referenced to Figure 2 This standardized visualization protocol ensures consistent spatial referencing throughout the analysis.
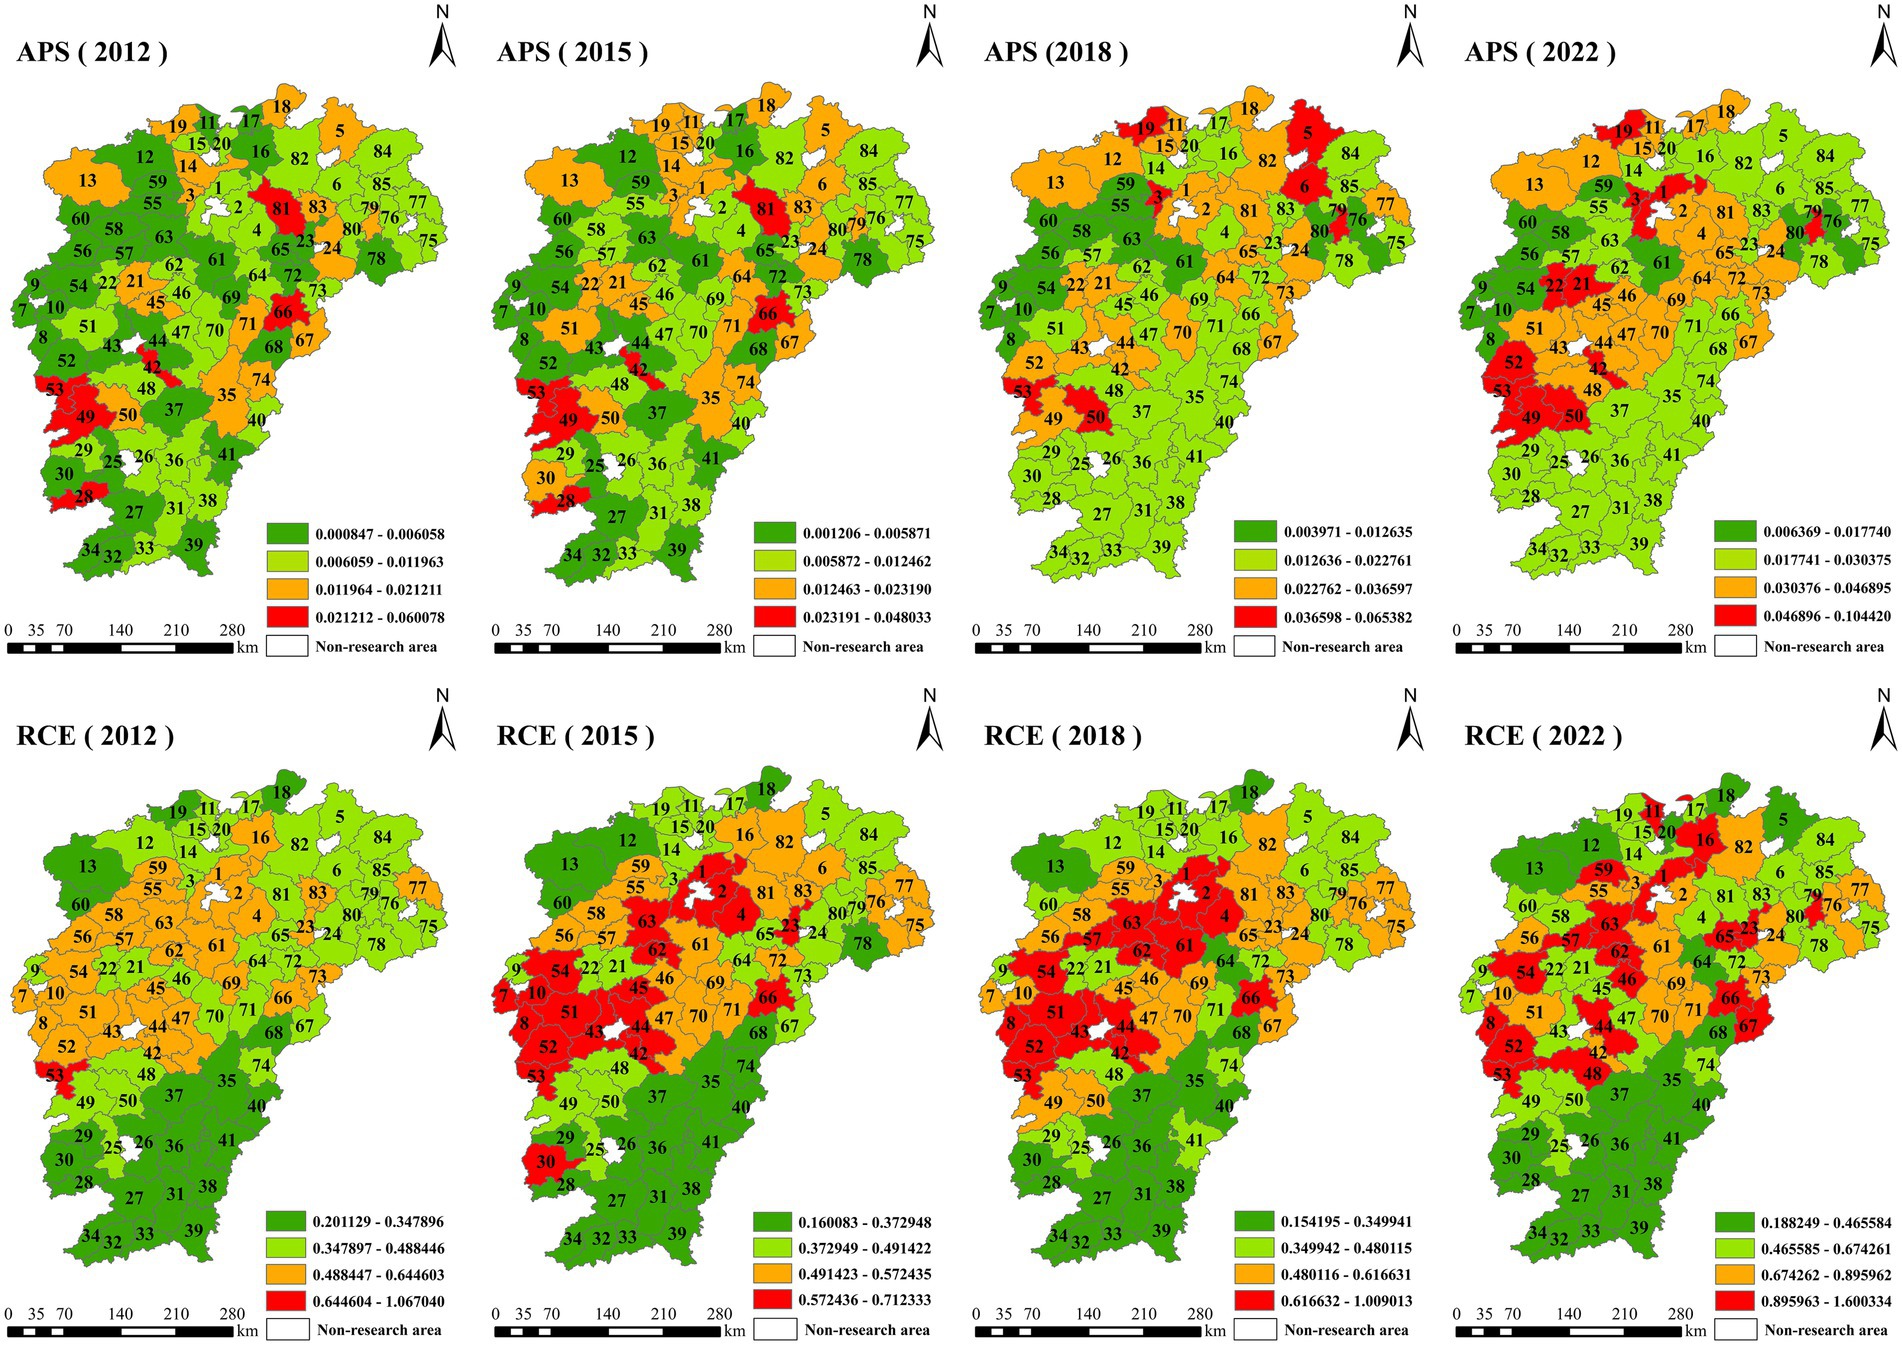
Figure 3. Spatiotemporal evolution characteristics of APS and RCE.
4.1.1 Spatiotemporal evolution of APS
From 2012 to 2022, APS in Jiangxi Province experienced significant growth. The average APS index increased from 0.0108 in 2012 to 0.0308 in 2022, representing nearly a threefold rise. Spatially, the number of counties with high-level APS expanded from five isolated regions in 2012—such as Dayu, Qingyuan, and Suichuan—to eleven clustered areas in 2022, including Xinjian, Anyi, and Ruichang. Meanwhile, the number of counties with medium-to-high-level APS rose from 19 to 24, indicating an enhanced spatial agglomeration effect. This transformation is closely associated with Jiangxi Province’s policy initiatives aimed at advancing agricultural modernization and optimizing regional development strategies.
From the perspective of grain production functional zones, significant regional disparities persist. The core production zone of the Poyang Lake Plain has consistently maintained the highest average APS level (0.019), attributable to its flat topography, dense hydrological network, well-developed agricultural infrastructure, and comprehensive agricultural service system, all of which facilitate large-scale and efficient farming operations. In contrast, the western high-yield areas exhibit a relatively low APS level (average 0.007), likely constrained by hilly and mountainous terrain, inadequate agricultural investment, fragmented land management, and incomplete extension of agricultural services. The ranking of APS development levels across regions is as follows: Poyang Lake Plain > Ji-Tai Basin > Ganfu Plain > Non-Primary Production Counties > Western High-Yield Areas, highlighting the substantial impact of natural endowments and foundational agricultural conditions on the spatial differentiation of agricultural production systems.
4.1.2 Spatiotemporal dynamics of RCE
From 2012 to 2022, RCE in the counties of Jiangxi Province exhibited a consistent upward trend, characterized by a spatial distribution pattern of “high in the central regions and low in the peripheral areas.” The average RCE increased gradually from 0.4459 in 2012 to 0.6676 in 2022, with a particularly notable acceleration observed after 2018, suggesting that agricultural green transformation policies began to yield substantial results during the latter part of the decade. Areas with high RCE were predominantly concentrated in key production zones such as the Ganfu Plain and the Poyang Lake Plain, where land resources are relatively concentrated and the level of agricultural mechanization is high—conditions that facilitate the adoption of water-saving, fertilizer-efficient, and environmentally sustainable production technologies. In contrast, regions with low RCE were primarily located in non-core production counties within the southern Jitai Basin and the hilly terrains of southern Jiangxi, where complex topography and high degrees of land fragmentation present significant barriers to enhancing carbon efficiency.
The regional carbon efficiency pattern has remained largely stable, with the following ranking: Ganfu Plain > Western High-Production Area > Poyang Lake Plain > Jitai Basin > Non-Primary Production Counties. Notably, high-efficiency areas have transitioned from isolated pockets in 2012 to contiguous clusters by 2022, forming a radiation-like spatial structure centered on the Ganfu Plain and exhibiting a gradient decline outward toward peripheral regions. Although carbon efficiency in each county has generally improved, regional disparities have not been substantially reduced, indicating that natural endowments, economic foundations, and technological diffusion capacities continue to exert significant influence on the equitable enhancement of carbon efficiency. Moving forward, targeted policy support and tailored technology transfer for underperforming regions should be strengthened.
4.2 Evolution characteristics of CCD
4.2.1 Temporal evolution characteristics of CCD
Using the previously established CCD model, we calculated the CCD between APS and RCE across 85 counties in Jiangxi Province from 2012 to 2022. The coupling coordination levels were classified according to the criteria in Table 1. Due to space constraints, only the annual mean values are presented (Table 5); detailed temporal data are available upon request.
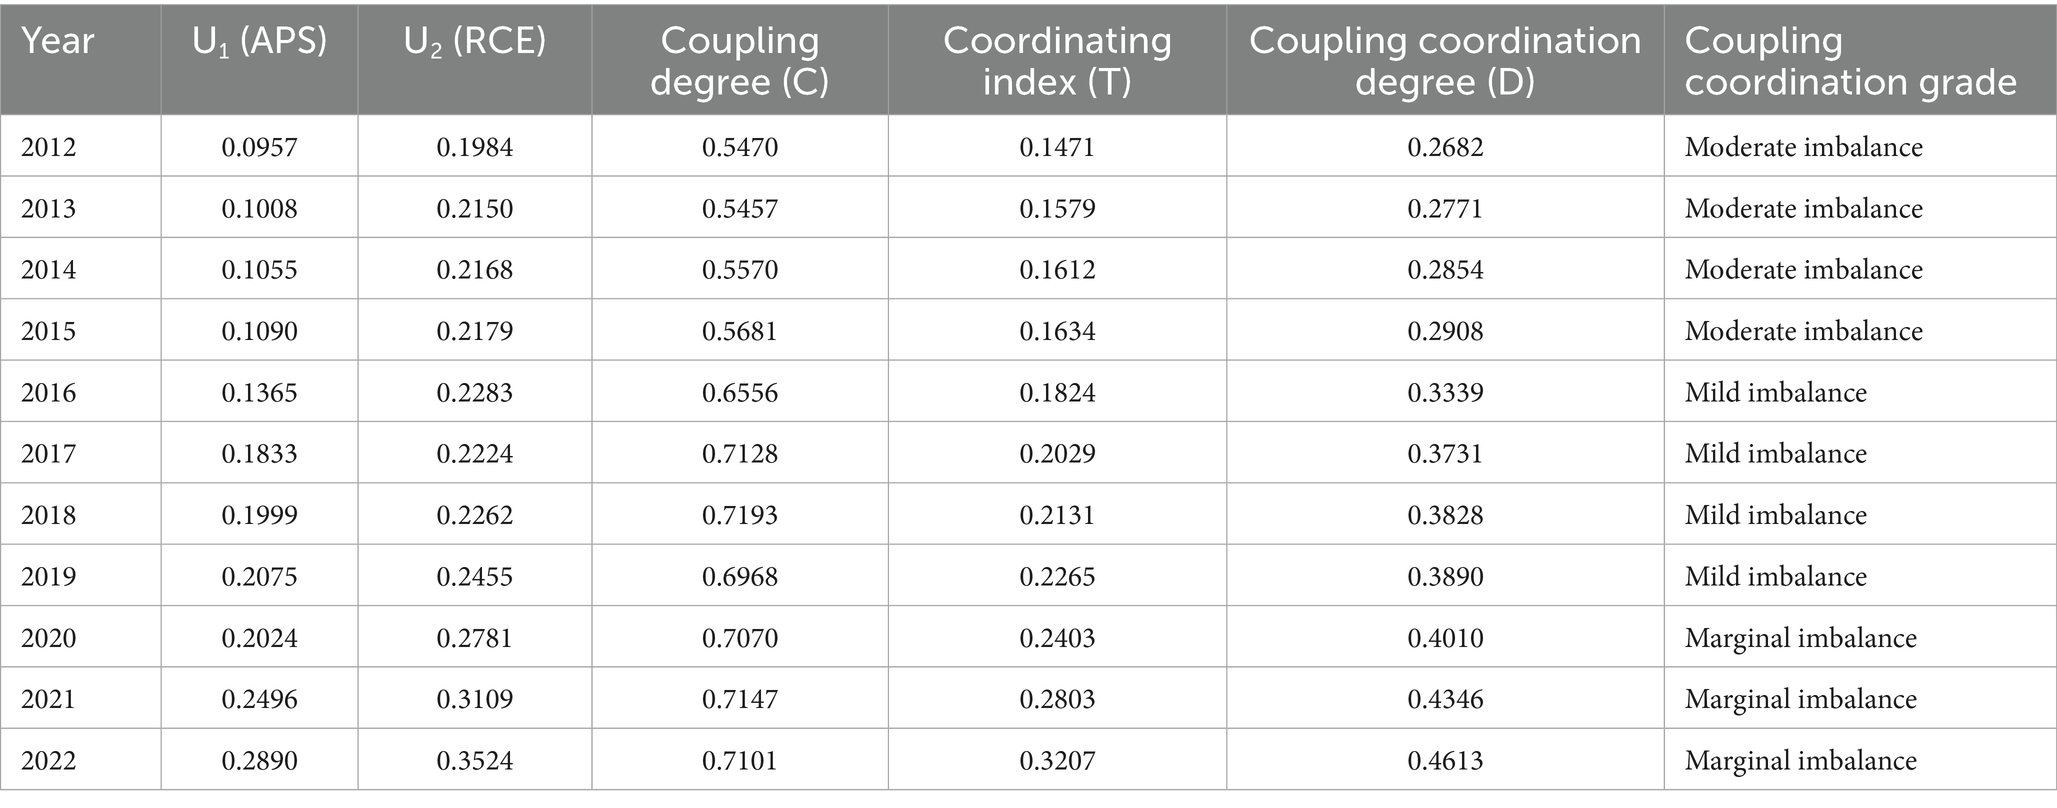
Table 5. CCD between APS and RCE at county level in Jiangxi province during 2012–2022.
Firstly, from the development level of the two systems (U1 and U2), while APS consistently lagged behind RCE in absolute development levels, both systems demonstrated sustained upward trends. Secondly, in terms of coupling degree (C), the coupling degree exhibited a fluctuating upward trajectory, increasing from 0.5470 (2012) to 0.7101 (2022). These values remained within the high-coupling regime (C ≥ 0.7 after 2017), confirming strong bidirectional interactions between APS and RCE systems. Finally, from the perspective of CCD (D), the CCD progressed steadily from 0.2682 (2012) to 0.4613 (2022), transitioning through three distinct phases: moderate imbalance (2012–2015), mild imbalance (2016–2019), and marginal imbalance (2020–2022). Notably, although the development level of the CCD between the two systems shows an overall upward trend, the level is relatively low, indicating substantial untapped potential for APS-RCE synergy enhancement.
4.2.2 Spatial evolution characteristics of CCD
To visualize the spatial evolution of APS-RCE coupling coordination across Jiangxi’s counties, we conducted spatial mapping using ArcGIS 10.8 (Figure 4) based on coordination degree values from 2012, 2015, 2018, and 2022.
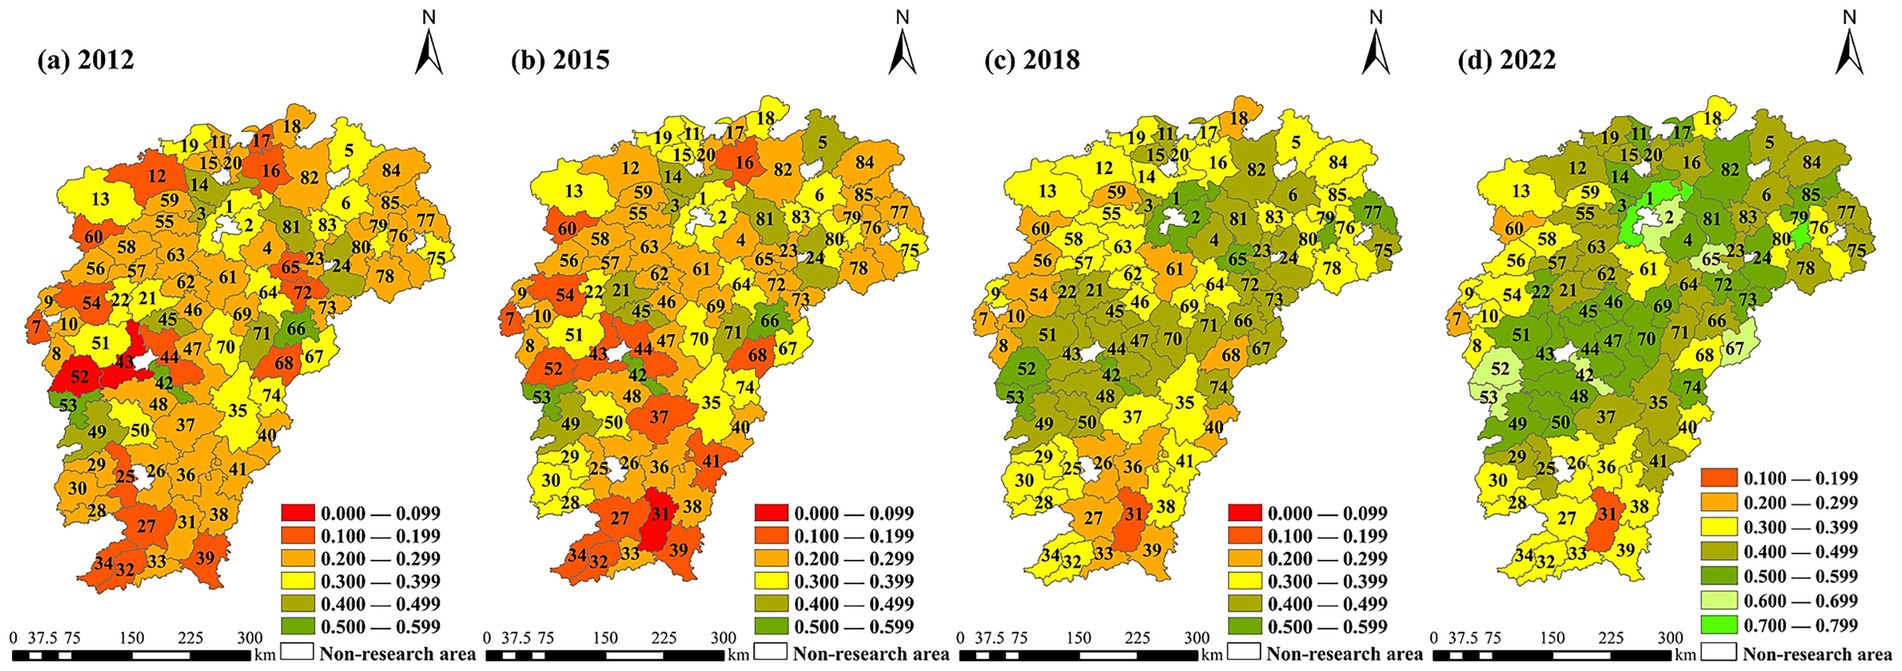
Figure 4. Spatial evolution characteristics of CCD.
From the overall analysis, the coordination levels exhibited an upward trend with a persistent “central high, peripheral low” spatial configuration, particularly pronounced by 2022. From 2012 to 2018, the CCD of the whole province remained in a state of barely coordination, and the counties achieving this level increased from 3 (2012) to 8 (2018), while those in severe imbalance decreased from 17 to 1. In 2022, the CCD of most counties has reached a barely coordinated state or above. Xinjian and Hengfeng County emerged as leaders, followed by six counties (e.g., Nanchang, Qingyuan, Jinggangshan) attaining primary coordination. Notably, three counties—Anyuan, Xiangdong, and Tonggu—remained in moderate imbalance, and it is urgent to be vigilant that these counties become the “short board” that hinders the development of agricultural green transformation. Conversely, high-performing counties (e.g., Xinjian, Hengfeng, Nanchang) demonstrated the potential to act as developmental anchors for neighboring regions.
4.2.3 Dynamic evolution characteristics of CCD
To comparatively analyze the dynamic evolutionary trends of APS-RCE coupling coordination across Jiangxi Province and its major grain production areas, we employed Kernel Density Estimation – a nonparametric technique particularly effective for identifying distributional characteristics and convergence patterns. The derived density curves were visualized using Origin 2022, enabling systematic analysis of spatial polarization or convergence tendencies in coordination development (Figure 5).
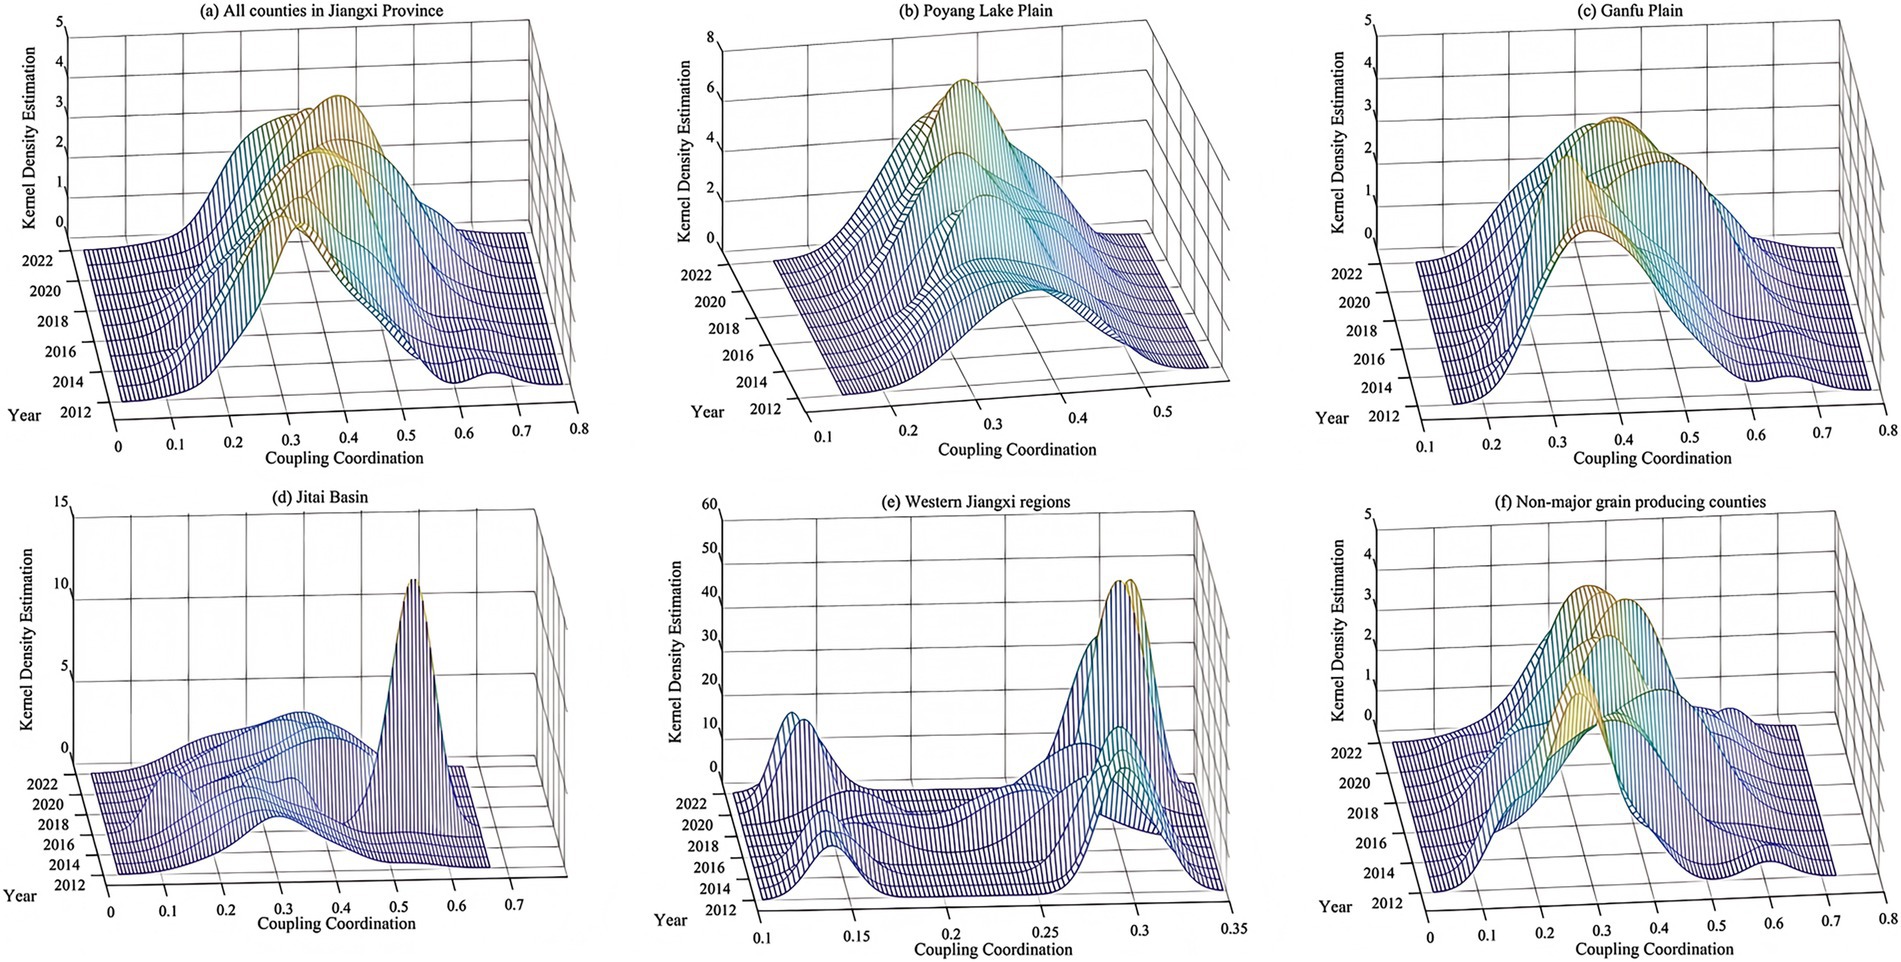
Figure 5. Dynamic evolution of CCD.
Firstly, the dynamic evolution trend of CCD across Jiangxi Province’s entire territory from 2012 to 2022 is analyzed in Figure 5a. The CCD curve demonstrates a consistent rightward shift throughout the study period, indicating continuous improvement in coordination levels that align with previous temporal analyses of CCD development patterns. Notably, the primary peak value exhibits alternating fluctuations, which indicates that the aggregation degree of CCD in Jiangxi counties also fluctuates. Furthermore, the CCD curve develops a pronounced right-skewed tail with slight expansion in its extension range, and the lateral peak value gradually increases. The emergence of this multimodal trend indicates that a limited number of counties exhibit CCD values exceeding the provincial average, which play a disproportionately significant role in elevating the overall coordination status through spatial spillover effects.
Second, Figures 5b–f analyses the dynamic evolution of CCD across Jiangxi’s major grain functional areas. As analyzed from Figure 5b, the CCD curve trajectory of Poyang Lake Plain shows sustained rightward migration from 2012 to 2022, indicating continuous improvement in coordination levels. Although the principal peak amplitude exhibits alternating fluctuations, annual peaks after 2016 consistently exceed 2012 levels (with only 2017 showing a slight decline), suggesting strengthened spatial agglomeration effects. Notably, the progressive disappearance of tailing and bandwidth expansion implies that the development of CCD is gradually balanced, with improving homogeneity in coordination development. According to Figure 5c, the CCD curve of Ganfu Plain maintains upward coordination trends, but the principal peak amplitude gradually declines from 2012 to 2022, indicating reduced spatial concentration. The concurrent emergence of distinct right-tailed distribution and bandwidth broadening reveals emerging multimodal patterns characteristic of polarization phenomena where high-performing counties disproportionately elevate regional averages through spatial spillover effects. According to the analysis of Figure 5d, the coordination trajectory of Ji-Tai Basin exhibits cyclical amplitude fluctuations, with 2016 representing an extreme change relative to other years. This temporal pattern corresponds to shifting spatial agglomeration dynamics. The progressive left-skewed tail development indicates that a few counties with low CCD lag the overall level of the region. According to Figure 5e, due to its limitation to four counties, it failed to adequately present the dynamic evolution trend of the Western Jiangxi high-yield area. The emergence of secondary peaks suggests nascent polarization tendencies despite overall homogenization trends. From the analysis of Figure 5f, despite maintaining rising coordination levels of non-core production counties, principal peak changes alternately indicate that the degree of aggregation fluctuates. Concurrent right-tailed expansion confirms that the CCD level of a few counties significantly pulls the region’s overall level.
4.3 Regional difference analysis of CCD
The study employed the Dagum decomposition method to quantify regional difference in CCD between APS and RCE across Jiangxi’s counties from 2012 to 2022, and the overall, intraregional and interregional Gini coefficients and contribution rates of CCD were measured by Matlab 2021 software (Figure 6).
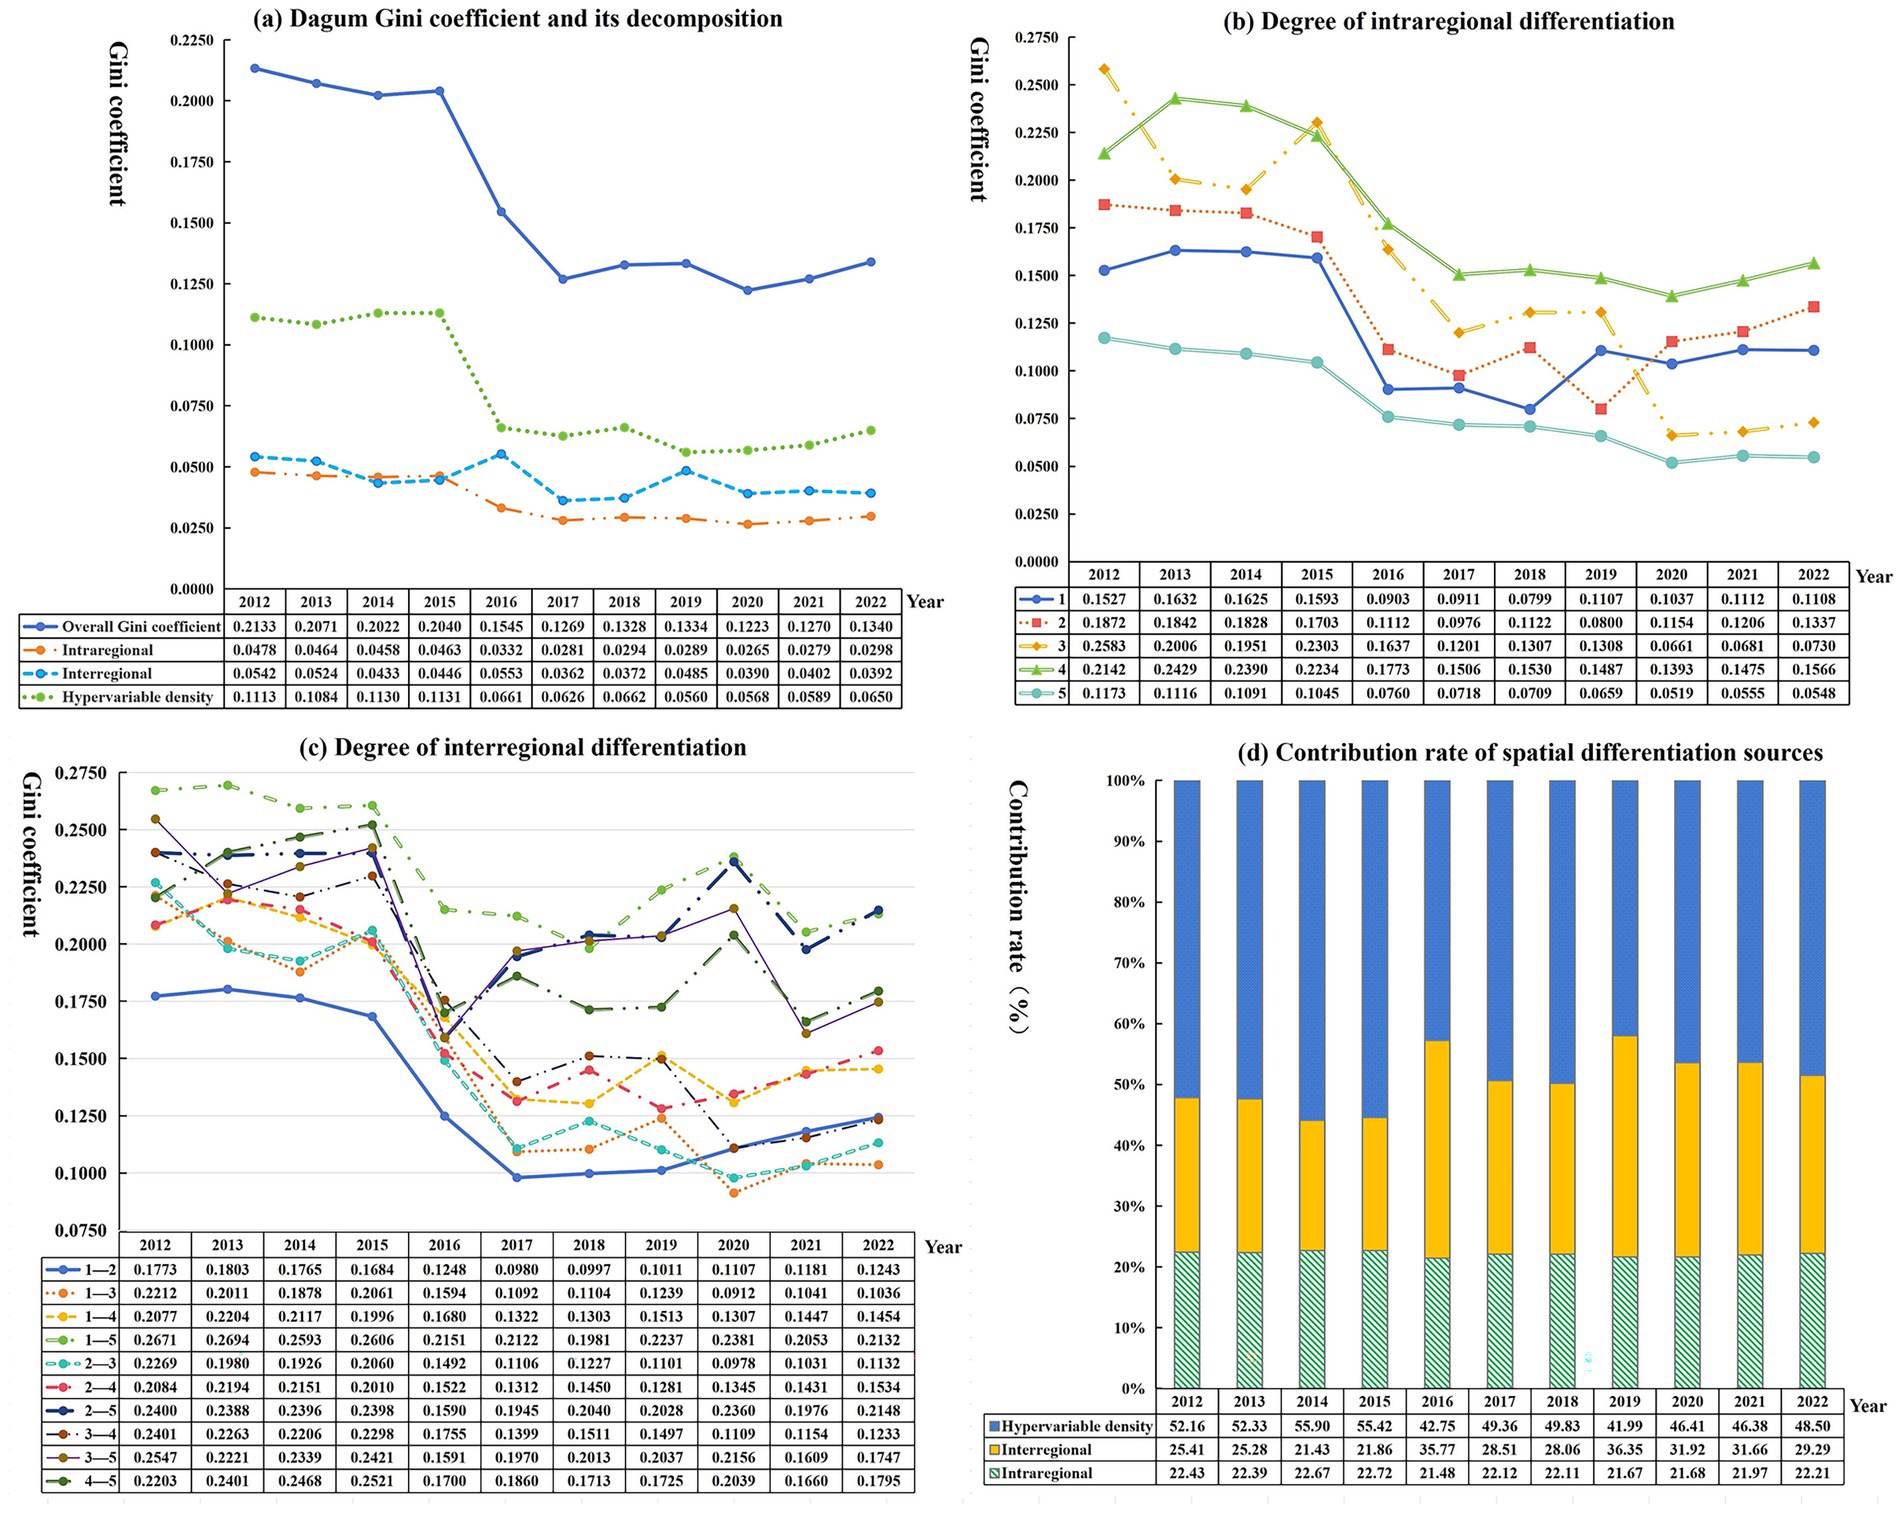
Figure 6. Change of Gini coefficient and its contribution rate of CCD.
4.3.1 Overall regional difference
Analysis of Figure 6a revealed fluctuating downward trends in the overall Gini coefficient of CCD, declining from 0.2133 in 2012 to 0.1340 in 2022, indicating a gradual reduction in regional difference across counties. This temporal pattern suggests progressive homogenization of CCD development at the provincial scale while also emphasizing the need for coordinated development strategies to prevent the potential widening of inter-county differences in future agriculture green transformation.
4.3.2 Intraregional difference
Analysis of Figure 6b revealed distinct spatiotemporal patterns in Intraregional Gini coefficients across Jiangxi’s major grain functional areas (Figure 6 legend: 1 = Poyang Lake Plain, 2 = Ganfu Plain, 3 = Jitai Basin, 4 = Western Jiangxi high-yield area, 5 = Non-core production counties) from 2012 to 2022. The average intraregional difference demonstrated the following ranking: Western Jiangxi high-yield area > Jitai Basin > Ganfu Plain > Poyang Lake Plain > Non-core production counties. All regions exhibited generally declining intraregional differences during the study period, indicating that the spatial differentiation degree in each region is gradually shrinking. From the perspective of the changing trends in different regions over various periods, during the 2012–2015 period, all study regions exhibited gradual decline rates in intraregional differences. Notably, this downward trend accelerated significantly from 2015 to 2019, with differentiation levels decreasing at nearly triple the previous rate. This accelerated convergence coincided temporally with Jiangxi Province’s pioneering implementation of comprehensive agricultural socialization service reforms initiated in 2013, suggesting these policy interventions likely enhanced production standardization across regions. However, post-2020, the degree of differentiation within each region tends to increase, indicating that the differences within each region may intensify, which should be paid attention to.
4.3.3 Interregional difference
From the analysis of Figure 6c, the most substantial disparity in CCD was observed between the Poyang Lake Plain and Non-core production counties (1–5), with a mean value of 0.2329. Conversely, minimal variation occurred between the Poyang Lake Plain and Ganfu Plain (1–2), demonstrating a mean difference of 0.1345. These metrics suggest pronounced developmental gaps in coupled coordination systems between primary grain bases and non-core production regions while showing relative consistency between adjacent major production areas. Temporal analysis of coordination degree fluctuations reveals two distinct phases: From 2012 to 2015, interregional variations maintained relative stability, followed by intensified fluctuations during 2015–2022. Notably, the overall trend indicates a progressive convergence in coordination levels across regions, indicating that the differentiation degree of interregional coupling coordination development level is shrinking.
4.3.4 Sources of regional differences and their contribution rates
As revealed in Figure 6d, the regional difference in the CCD between APS and RCE predominantly originated from interregional super-variable density. Throughout the study period, its contribution rate remained relatively stable at approximately 50%, with an average contribution rate of 49.18%. Comparatively, the average contribution rates from intraregional and interregional differences were 22.13 and 28.68%, respectively. These findings suggest that mitigating regional disparities in the coupling coordination system should prioritize reducing cross-regional interaction intensity between different geographical zones, as the overlapping effects between regions emerge as the principal determinant of regional heterogeneity.
4.4 Spatiotemporal heterogeneity analysis of the influencing factors on the CCD between APS and RCE
4.4.1 Selection of GTWR model
Before model implementation, we conducted variance inflation factor (VIF) tests to assess potential multicollinearity among independent variables that might compromise estimation reliability. Diagnostic results (Table 6) revealed acceptable collinearity levels, with all variance inflation factors (VIF) below 10 and tolerance values exceeding 0.1 - within established statistical significance thresholds. These diagnostic results confirm the absence of severe multicollinearity issues that could substantially distort the GTWR model parameter estimates.
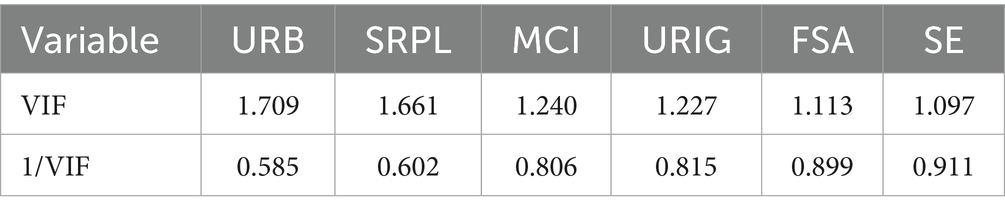
Table 6. Results of multicollinearity test.
Furthermore, the geographically and temporally weighted regression (GTWR) analysis was performed using the GTWR plugin integrated into ArcGIS 10.8 software. The bandwidth was automatically determined through an optimization process, with the spatiotemporal distance parameter ratio maintained at 1 to ensure balanced temporal and spatial weighting. A comprehensive model comparison was conducted among GTWR, geographically weighted regression (GWR), temporally weighted regression (TWR), and ordinary least squares (OLS) approaches (Table 7). The Akaike Information Criterion corrected (AICc), and goodness of fit statistic (R2) were adopted as statistical metrics for model evaluation and selection, following established methodologies (Fernandez et al., 2001). The comparative analysis demonstrated the superior performance of the GTWR model. Notably, the GTWR model achieved the lowest AICc value (−2450.80) and the highest R2 value (0.7696) compared to the GWR, TWR, and OLS models. These results statistically confirm that the GTWR framework outperforms conventional spatial or temporal regression approaches in explaining the spatiotemporal heterogeneity of influencing factors on the CCD between APS and RCE.
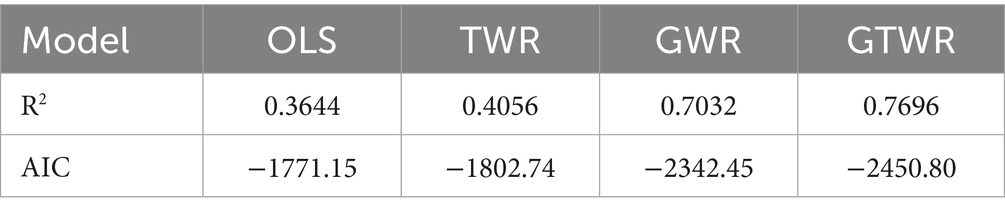
Table 7. Comparison of model evaluation indexes.
4.4.2 Temporal variation of influencing factors
The spatiotemporal regression analysis employing the GTWR model revealed the temporal variations in regression coefficients of influencing factors affecting the CCD between APS and RCE across county-level regions in Jiangxi Province. These results demonstrate the differential spatial–temporal impacts of various determinants on the coordinated development system. The temporal dynamics of these influencing factors were subsequently visualized through boxplot diagrams (Figure 7) generated using Origin 2022, which effectively illustrate the evolving patterns and fluctuation ranges of each factor’s contribution over different temporal periods.
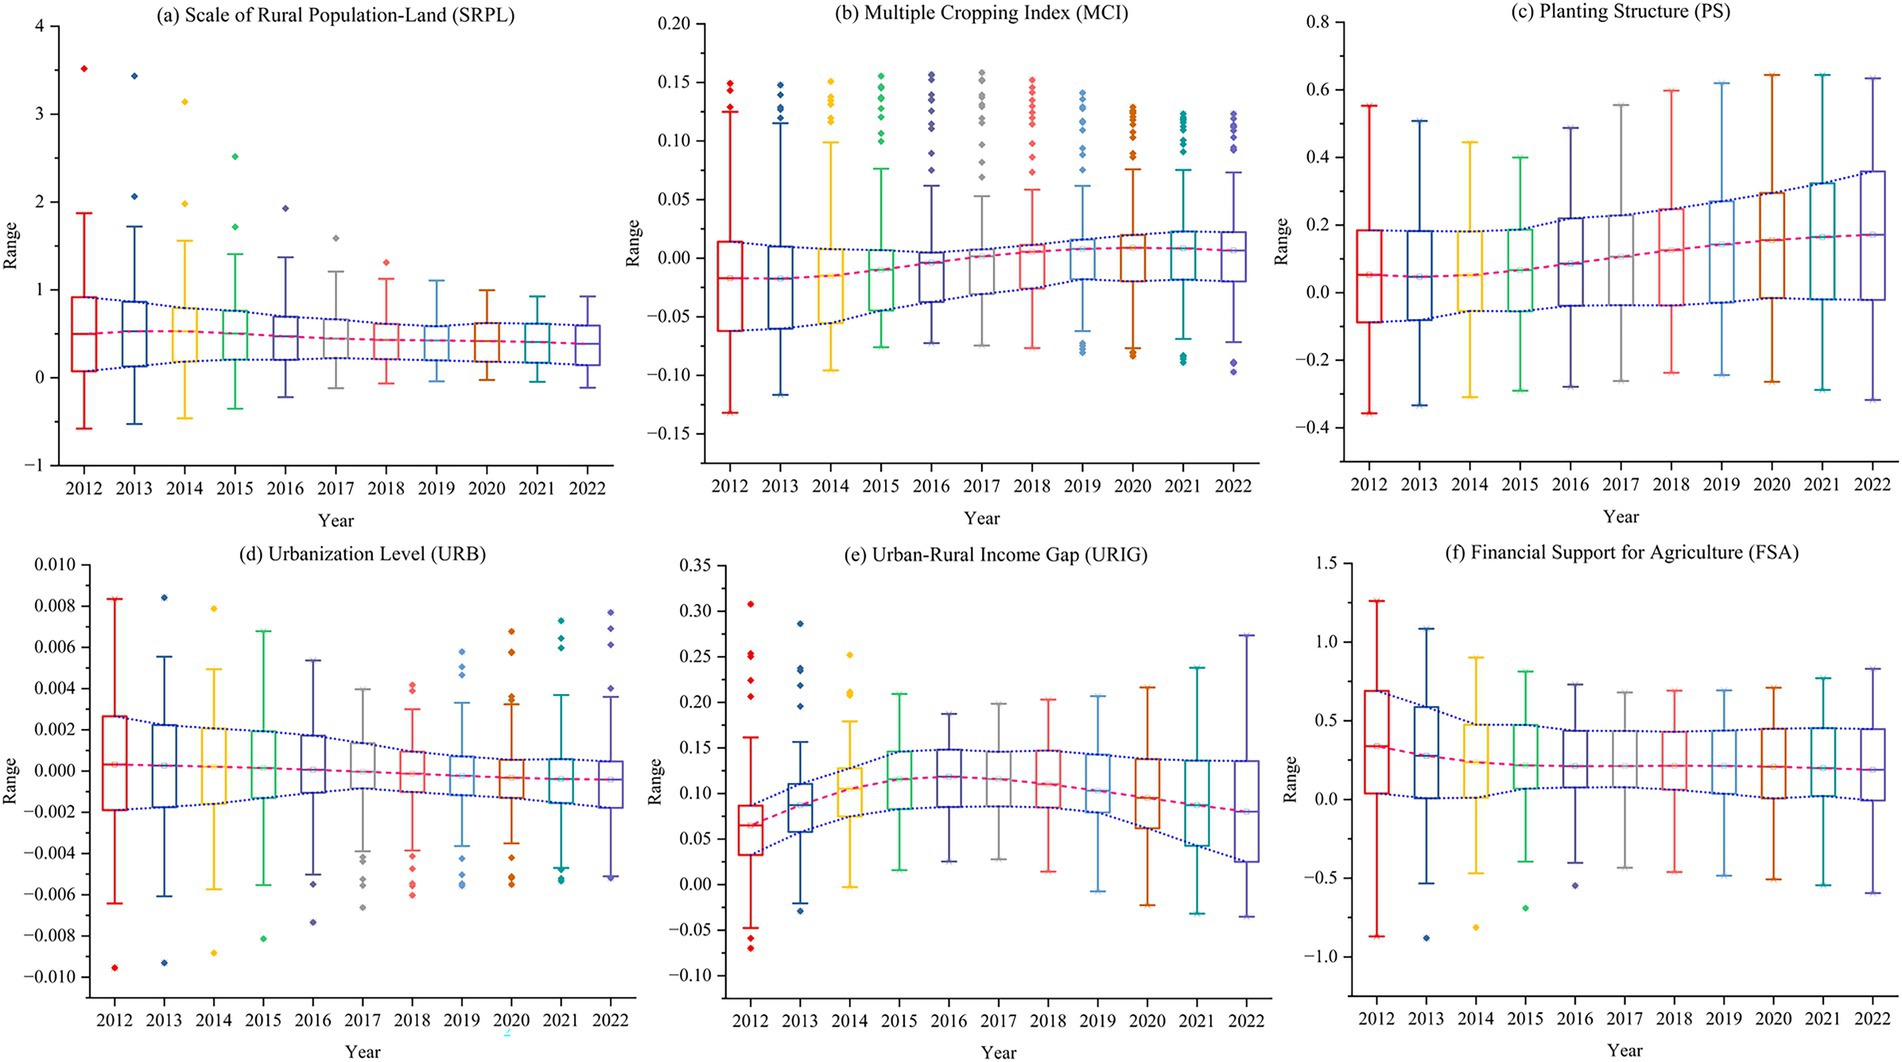
Figure 7. Time series variation trend of GTWR regression coefficients.
The analysis of economic drivers revealed distinct temporal heterogeneity in factors influencing CCD. The scale of rural population-land (Figure 7a) emerged as the most significant positive contributor, with its average regression coefficient reaching 0.4584. Notably, the dispersion of coefficients gradually narrowed, and outliers disappeared over time, suggesting a strengthening consensus on its beneficial role across counties. This phenomenon could be attributed to expanded per capita arable land enhancing demand for APS through economies of scale and optimized land use patterns, improving carbon sequestration capacity. These dual effects collectively elevate both APS and RCE, thereby promoting CCD. Multiple cropping index (Figure 7b) demonstrated a negative association with CCD, with its average regression coefficient reaching −0.0022, though its effect magnitude remained relatively limited. The narrowing dispersion pattern indicates increasing consistency in its inhibitory effects across time. Mechanistically, intensified cropping frequency increases absolute carbon emissions while reducing marginal carbon efficiency, creating a double burden constraining coordinated development. The planting structure (Figure 7c) exhibited moderate positive impacts (mean coefficient: 0.1064), and the dispersion gradually expanded. This temporal variability likely stems from differential capacities to leverage expanded rice cultivation areas. Where implemented effectively, spatial concentration of rice planting enables specialized agricultural service systems through industrial clustering effects and optimized resource allocation efficiency via intensive management practices.
The regression coefficients of urbanization level (Figure 7d) on coupling coordination development exhibited mixed positive and negative values. A positive mean coefficient was observed during 2012–2016, while a negative mean emerged in 2017–2022. Notably, the average coefficients across all study periods approached zero, suggesting negligible overall impacts on coupling coordination development. Concurrently, the increasing frequency of outliers in urbanization coefficients indicates growing inter-county heterogeneity in spatial effects. In contrast, the urban–rural income gap (Figure 7e) demonstrated a consistent positive influence, with a mean regression coefficient of 0.0984. The progressive expansion of coefficient dispersion throughout the study period reveals the persistent positive associations between income disparity and coupling coordination development and intensifying regional differentiation in these relationships across counties. This divergence might be explained through a dual-channel mechanism: Elevated income disparities exacerbate rural economic stagnation and suppress farmers’ income growth, reducing capacity and incentives for APS investments. Such underinvestment disrupts the potential synergistic relationship between agricultural service and rice production systems, ultimately impeding improvements in coupling coordination.
The regression analysis revealed a statistically significant positive association between financial support for agriculture (Figure 7f) and coupling coordination development, with an average coefficient of 0.2286. Notably, the dispersion of regression coefficients gradually narrowed, accompanied by a reduction in outliers, suggesting diminishing regional disparities in the intensity of this relationship across counties. These findings imply that enhanced agricultural fiscal investments consistently strengthen the coupling coordination mechanism. A plausible explanation lies in the synergistic effects of fiscal agricultural support on structural optimization. Increased funding facilitates land transfer and promotes large-scale agricultural operations, thereby advancing the development of specialized agricultural services. Concurrently, such investments optimize the allocation of agricultural production factors, improving production efficiency and resource utilization rates. These systemic enhancements further reduce energy consumption and carbon emissions per unit output, fostering tighter integration between agricultural service systems and low-carbon rice production practices.
4.4.3 Spatial variation of influencing factors
To better visualize the spatial variations of influencing factors across the study period, we spatially visualized the average regression coefficients derived from the GTWR model using the Natural Breaks classification method in ArcGIS 10.8 software (Figure 8). This analytical approach effectively reveals the spatial heterogeneity patterns of different driving factors while maintaining their intrinsic statistical distribution characteristics.
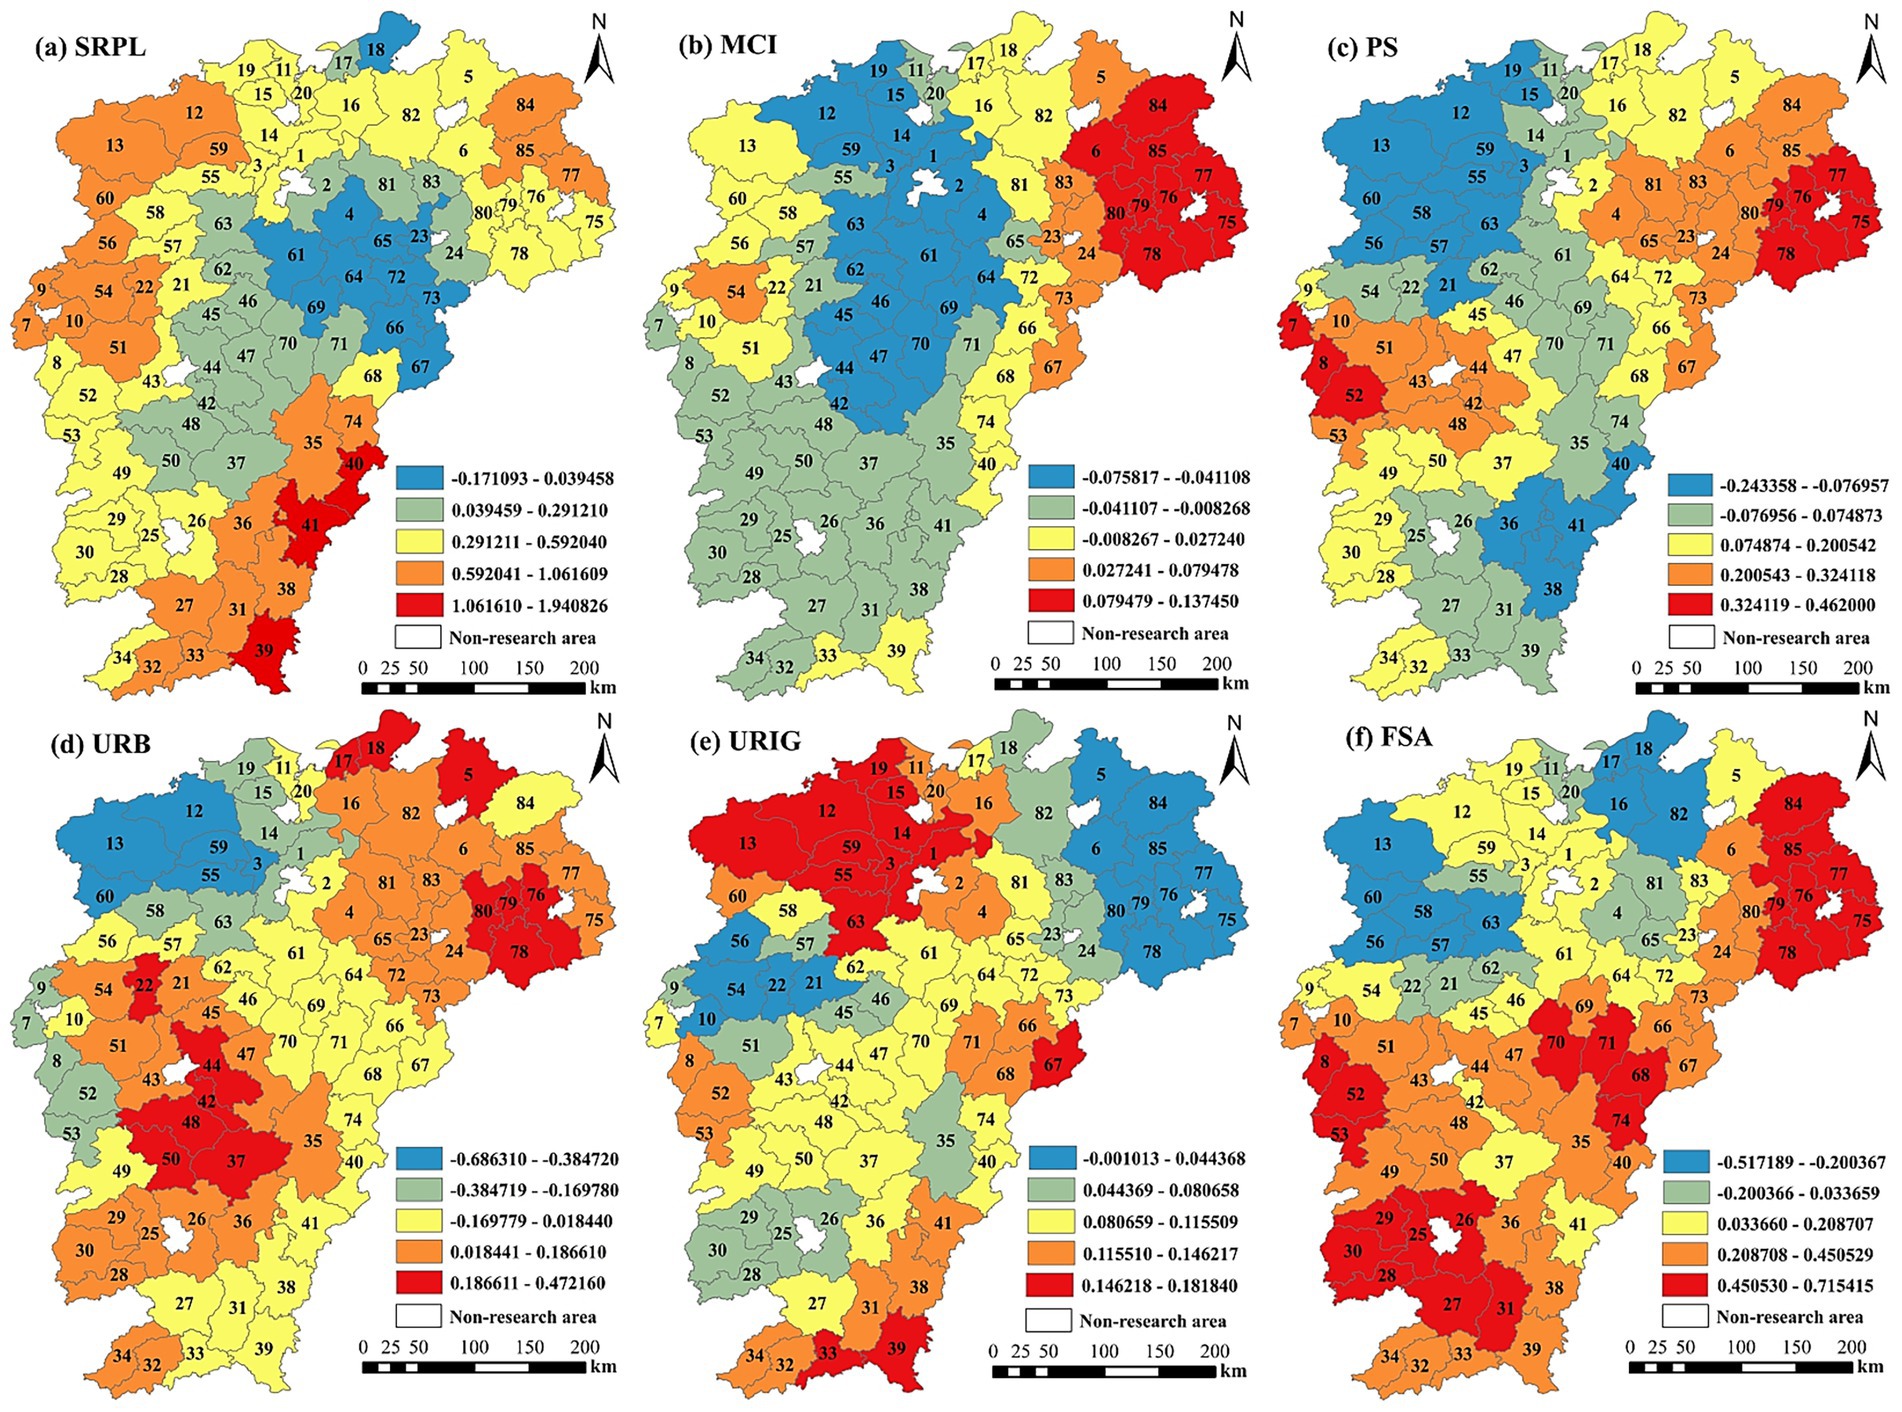
Figure 8. Spatial evolution of GTWR regression coefficients.
The scale of rural population-land (Figure 8a) exhibited a spatially heterogeneous impact on the CCD, characterized by a “high in northern and southern regions, low in central areas” pattern. High-impact zones are clustered predominantly in the major grain-producing areas of western Jiangxi and non-core production counties of southern Jiangxi (e.g., Shicheng County: 1.9408). In contrast, low-impact zones are concentrated in the eastern Ganfu Plain (e.g., Jinxi County: −0.1711). This spatial disparity may arise from the dual effects of population-land scale optimization: moderate scales enhance synergy between APS and RCE, whereas excessive scales may decouple APS from practical agricultural demands, impeding low-carbon technology adoption, while undersized scales restrict APS development and limit carbon efficiency improvements. The multiple cropping index (Figure 8b) demonstrated non-uniform spatial effects on CCD, with high-impact zones concentrated in the eastern Poyang Lake Plain (e.g., Yushan County: 0.1375) and low-impact zones in the central Ganfu Plain (e.g., Anyi County: −0.0758). A plausible explanation lies in its dual role: moderate increases optimize resource allocation between APS and RCE, whereas excessive indices may overcentralize short-term service demands, compromising low-carbon service quality and destabilizing their synergistic interactions. The planting structure (Figure 8c) spatially influenced CCD with an “east–west high, north–south low” configuration. High-impact areas dominated the eastern Poyang Lake Plain and western Jitai Basin (e.g., Guangfeng District: 0.4620), while low-impact zones prevailed in the western Poyang Lake Plain and southern Jitai Basin (e.g., Wuning County: −0.2433). Mechanistically, concentrated rice monoculture improves agricultural input efficiency and carbon performance, whereas fragmented terrains elevate service costs, constraining APS development and disrupting CCD equilibrium.
The urbanization level (Figure 8d) showed marked spatial heterogeneity in CCD impacts. High-value clusters emerged in the eastern Poyang Lake Plain and central Jitai Basin (e.g., Pengze County: 0.4722), contrasting with low-value areas in the western Poyang Lake Plain (e.g., Xiushui County: −0.6863). This duality reflects urbanization’s competing effects: while capital and technology inflows strengthen APS-RCE coordination, rural labor migration and agricultural regression may undermine synergistic momentum. The urban–rural income gap (Figure 8e) predominantly enhanced CCD across Jiangxi. Enlarged income disparities accelerated rural-to-urban labor transfer, fostering land consolidation that promoted scaled farming and APS specialization. Concurrently, APS advancements facilitated low-carbon technology diffusion, synergistically improving RCE.
The financial support for agriculture (Figure 8f) spatially influenced CCD with a “south-high/north-low, east-high/west-low” gradient, showing pronounced positive effects in southern Jiangxi. Enhanced fiscal investments likely improved rural infrastructure, reducing APS operational costs and enhancing service accessibility. Furthermore, upgraded infrastructure supported agricultural intensification and carbon-efficient practices, reinforcing APS-RCE coordination.
5 Discussion
The coordinated development between APS and RCE constitutes a complex and dynamic process. Through an empirical analysis at the county level in Jiangxi Province, a central rice-producing region of China, this study elucidates the spatiotemporal evolution patterns and driving mechanisms of their coupling coordination, providing theoretical and empirical foundations for advancing agricultural green transition and sustainable development.
First, the suboptimal coupling coordination level (showing an upward trend yet remaining at relatively low grades) between APS and RCE reveals systemic barriers in aligning service-driven productivity gains with carbon efficiency improvements. While prior studies have emphasized the role of APS in enhancing technical efficiency (Cai et al., 2024; Lin et al., 2023), our coupling coordination analysis demonstrates that their interaction remains constrained by structural mismatches. For instance, the reliance on high-input mechanized services during pre-production stages may inadvertently increase fossil fuel consumption, offsetting carbon sequestration benefits achieved through optimized irrigation and soil management in production stages. This paradox aligns with critiques of “greenwashing” in agricultural service markets, where short-term yield stability often overshadows long-term carbon neutrality goals (Mendes et al., 2024; Qiu et al., 2021). These findings underscore the necessity of prioritizing structural optimization and quality enhancement of service provision over mere quantitative expansion during the agricultural green transition. Furthermore, the untapped potential of APS in improving carbon efficiency may stem from demand–supply mismatches or inadequate contextual adaptation during service implementation.
Second, the spatial heterogeneity dominated by interregional hypervariable density (average contribution rate: 49.18%) challenges the effectiveness of homogeneous policy frameworks. Diverging from previous assessments focusing on intraregional disparities (Zhang et al., 2023), our Dagum Gini coefficient decomposition identifies hypervariable density between developed (e.g., Poyang Lake Plain) and lagging regions (e.g., non-core production counties) as the primary source of spatial inequality. Advanced regions likely benefit from mature APS and infrastructure, whereas lagging areas suffer from service accessibility gaps and insufficient incentives for low-carbon practices. This finding revises conventional wisdom attributing spatial imbalances solely to resource endowment differences (Zhang et al., 2022). Practically, policymakers should prioritize cross-regional knowledge diffusion and technology transfer mechanisms, particularly in areas with pronounced spatial heterogeneity. Concurrently, fostering diversified agricultural development models tailored to regional socioeconomic and ecological conditions becomes imperative (Jin et al., 2024). Future research could explore policy innovations to enhance interregional collaboration for balanced agricultural sustainability.
Finally, the spatiotemporal heterogeneity analysis of influencing factors reveals that the scale of rural population-land (SRPL) and financial support for agriculture (FSA) emerge as key drivers, consistent with induced institutional innovation theory. Expanded land consolidation and fiscal incentives facilitate service adoption and resource optimization (Wu et al., 2024). The negative effect of the multiple cropping index (MCI) corroborates existing evidence that agricultural intensification without decarbonization measures exacerbates greenhouse gas emissions (Janus and Ertunç, 2023; Sroufe and Watts, 2022). The spatially divergent effects of planting structure (PS) reflect context-dependent synergies between monoculture efficiency and biodiversity conservation. These results resonate with the “just transition” framework, emphasizing the balance between productivity enhancement and equitable access to ecologically resilient services (Ullman and Kittner, 2024). Notably, the paradoxical positive correlation between the urban–rural income gap (URIG) and coordination levels in certain regions suggests that labor transfer-induced farmland intensification may boost short-term scale efficiency while neglecting long-term ecological consequences. This evidence reinforces the urgency of formulating policies harmonizing economic equity with environmental integrity.
While this study provides novel perspectives and methodologies for examining the relationship between APS and RCE, several potential limitations should be acknowledged. First, climate variability factors (e.g., precipitation, temperature) directly influence rice yields and greenhouse gas emissions. Due to data availability constraints, climate-related variables were not incorporated into the indicator system of influencing factors, which may partially limit the comprehensive interpretation of the coupling coordination mechanisms between APS and RCE. Second, the reliance on county-level data restricts insights into farmers’ micro-level decision-making processes, particularly their trade-offs between service costs and carbon reduction benefits. Future studies should prioritize household-level investigations to elucidate the micro-level drivers of this coupled system. Third, the exclusive focus on a single major grain-producing province may constrain the generalizability of findings across diverse agroecological contexts. Expanding the sampling framework to include comparative analyses of key agricultural ecological zones (e.g., the Yellow River Basin and Yangtze River Basin) is recommended to enhance the universality and robustness of conclusions.
6 Conclusions and recommendations
6.1 Conclusion
Based on panel data from 85 county-level administrative units in Jiangxi Province (2012–2022), this study assessed the coupling coordination level between APS and RCE using a modified coupling coordination model, kernel density estimation, Dagum Gini coefficient decomposition, and geographically and temporally weighted regression (GTWR). The spatiotemporal evolution patterns, dynamic trends, spatial disparities, and spatiotemporal heterogeneity of influencing factors were systematically investigated. Key findings are summarized as follows:
1. Temporal trends: The overall coupling coordination level in Jiangxi’s counties was upward but remained relatively low. By 2022, only Xinjian District and Hengfeng County achieved intermediate coordination, while most regions remained in marginal imbalance or barely coordinated states, indicating substantial potential for improvement.
2. Dynamic evolution: A weakly multipolar dynamic trend was observed. The Poyang Lake Plain demonstrated balanced development with minimal divergence, whereas the Ganfu Plain, Jitai Basin, and non-core grain-producing areas displayed pronounced multipolar characteristics. Peak kernel density values showed an upward trend across regions, reflecting increased agglomeration intensity.
3. Spatial disparities: Regional differences in coupling coordination were predominantly driven by interregional hypervariable density (average contribution: 49.18%), followed by interregional (28.68%) and intraregional (22.13%) disparities.
4. Spatiotemporal heterogeneity of influencing factors: Drivers exhibited significant spatiotemporal heterogeneity, ranked by impact magnitude: the scale of rural population-land > financial support for agriculture > planting structure > urban–rural income gap > multiple cropping index > urbanization levels. The urban–rural income gap positively affected most counties, while other factors showed spatially divergent impacts (both positive and negative).
6.2 Recommendations
To enhance the CCD between APS and RCE across Jiangxi’s counties, we propose the following evidence-based recommendations informed by our research findings:
First, government departments should prioritize enhancing APS systems through multi-dimensional interventions. Given the critical constraints of regional imbalance and service quality deficiency identified in our analysis, strategic measures should include (1) establishing dedicated fiscal mechanisms to strengthen financial support for service infrastructure development, (2) formulating standardized quality evaluation protocols coupled with rigorous monitoring frameworks to ensure service standardization, and (3) creating provincial-level technology innovation platforms to foster green agricultural technologies. These coordinated efforts would facilitate synergistic development between service system optimization and low-carbon agricultural transitions.
Second, a regional collaborative mechanism should be established to address spatial disparities in coupling coordination. Our decomposition analysis reveals that hypervariable density between regions constitutes the primary contributor to overall coordination disparities. We recommend implementing cross-regional knowledge dissemination and technology exchange programs, particularly between core rice-producing zones (Poyang Lake Plain and Ganfu Plain). This should be complemented by developing joint green production standards and establishing demonstration zones for coordinated low-carbon practices, thereby reducing inter-regional development overlaps and enhancing spatial synergies.
Third, government agencies should exercise strategic leadership in spatial differentiation management. Based on regional resource endowment characteristics revealed by our GTWR analysis, customized strategies should be formulated to (1) optimize cropping intensity (multiple cropping index) through agronomic suitability assessments, (2) restructure planting systems using carbon efficiency metrics, (3) implement targeted mitigation measures for location-specific negative influencing factors. This place-based governance approach would effectively balance agricultural productivity with carbon reduction objectives while maintaining regional ecological carrying capacities.
Data availability statement
The raw data supporting the conclusions of this article will be made available by the authors, without undue reservation.
Author contributions
BW: Writing – original draft. JG: Writing – review & editing, Writing – original draft. YG: Writing – original draft. LW: Writing – review & editing, Writing – original draft. HZ: Writing – review & editing.
Funding
The author(s) declare that financial support was received for the research and/or publication of this article. This research was funded by the National Social Science Foundation of China, the Jiangxi Academy of Social Sciences (Grant nos. 19BGL276, 23ZXYB10, and 23GJPY13) and also received support from the National Natural Science Foundation of China (Grant nos. 42261038, 72163014, and 72164017).
Acknowledgments
The authors are very thankful for the editors and reviewers comments.
Conflict of interest
The authors declare that the research was conducted in the absence of any commercial or financial relationships that could be construed as a potential conflict of interest.
Generative AI statement
The authors declare that no Gen AI was used in the creation of this manuscript.
Any alternative text (alt text) provided alongside figures in this article has been generated by Frontiers with the support of artificial intelligence and reasonable efforts have been made to ensure accuracy, including review by the authors wherever possible. If you identify any issues, please contact us.
Publisher’s note
All claims expressed in this article are solely those of the authors and do not necessarily represent those of their affiliated organizations, or those of the publisher, the editors and the reviewers. Any product that may be evaluated in this article, or claim that may be made by its manufacturer, is not guaranteed or endorsed by the publisher.
References
Bai, Y., Deng, X., Jiang, S., Zhao, Z., and Miao, Y. (2019). Relationship between climate change and low-carbon agricultural production: a case study in Hebei Province, China. Ecol. Indic. 105, 438–447. doi: 10.1016/j.ecolind.2018.04.003
Bajan, B., and Mrówczyńska-Kamińska, A. (2020). Carbon footprint and environmental performance of agribusiness production in selected countries around the world. J. Clean. Prod. 276:123389. doi: 10.1016/j.jclepro.2020.123389
Bao, T., Wang, L., Huang, Y., Li, H., Qiu, L., Liu, J., et al. (2024). Elevated [CO2] reduces CH4 emissions from rice paddies under in situ straw incorporation. Agric. Ecosyst. Environ. 370:109055. doi: 10.1016/j.agee.2024.109055
Benin, S. (2015). Impact of Ghana's agricultural mechanization services center program. Agric. Econ. 46, 103–117. doi: 10.1111/agec.12201
Cai, B., Shi, F., Huang, Y., and Abatechanie, M. (2021). The impact of agricultural socialized services to promote the farmland scale management behavior of smallholder farmers: empirical evidence from the rice-growing region of southern China. Sustainability 14:316. doi: 10.3390/su14010316
Cai, B., Shi, F., Meseretchanie, A., Betelhemabraham, G., and Zeng, R. (2024). Agricultural socialized services empowering smallholder rice producers to achieve high technical efficiency: empirical evidence from southern China. Front. Sustain. Food Syst. 8:1329872. doi: 10.3389/fsufs.2024.1329872
Chen, Z.-d., Li, F.-b., Xu, C.-c., Ji, L., Feng, J.-f., and Fang, F.-p. (2022b). Spatial and temporal changes of paddy rice ecosystem services in China during the period 1980–2014. J. Integr. Agric. 21, 3082–3093. doi: 10.1016/j.jia.2022.07.049
Chen, X., and Liu, T. (2023). Can agricultural socialized services promote the reduction in chemical fertilizer? Analysis based on the moderating effect of farm size. Int. J. Environ. Res. Public Health 20:2323. doi: 10.3390/ijerph20032323
Chen, X., Ma, C., Zhou, H., Liu, Y., Huang, X., Wang, M., et al. (2021). Identifying the main crops and key factors determining the carbon footprint of crop production in China, 2001–2018. Resour. Conserv. Recycling 172:105661. doi: 10.1016/j.resconrec.2021.105661
Chen, T., Rizwan, M., and Abbas, A. (2022a). Exploring the role of agricultural services in production efficiency in Chinese agriculture: a case of the socialized agricultural service system. Land 11:347. doi: 10.3390/land11030347
Chen, X., Shuai, C., Wu, Y., and Zhang, Y. (2020). Analysis on the carbon emission peaks of China's industrial, building, transport, and agricultural sectors. Sci. Total Environ. 709:135768. doi: 10.1016/j.scitotenv.2019.135768
Choudhary, V., and Meena, R. S. (2024). Advanced technological adaptations can improve the energy-cum-carbon-efficiency of diverse rice production systems. Heliyon 10:e27691. doi: 10.1016/j.heliyon.2024.e27691
Dong, Q., Zhong, K., Liao, Y., Xiong, R., Wang, F., and Pang, M. (2023). Coupling coordination degree of environment, energy, and economic growth in resource-based provinces of China. Resour. Policy 81:103308. doi: 10.1016/j.resourpol.2023.103308
Dubey, A., and Lal, R. (2009). Carbon footprint and sustainability of agricultural production systems in Punjab, India, and Ohio, USA. J. Crop Improv. 23, 332–350. doi: 10.1080/15427520902969906
Emmanuel, D., Owusu-Sekyere, E., Owusu, V., and Jordaan, H. (2016). Impact of agricultural extension service on adoption of chemical fertilizer: implications for rice productivity and development in Ghana. NJAS 79, 41–49. doi: 10.1016/j.njas.2016.10.002
Fernandez, C., Ley, E., and Steel, M. F. (2001). Benchmark priors for Bayesian model averaging. J. Econom. 100, 381–427. doi: 10.1016/S0304-4076(00)00076-2
Fukuyama, H., and Weber, W. L. (2009). Output slacks-adjusted cost efficiency and value-based technical efficiency in dea models (operations research for performance evaluation). J. Oper. Res. Soc. Jpn. 52, 86–104. doi: 10.15807/jorsj.52.86
Geng, N., Zheng, X., Han, X., and Li, X. (2024). Towards sustainable development: the impact of agricultural productive services on China’s low-carbon agricultural transformation. Agriculture 14:1033. doi: 10.3390/agriculture14071033
Han, G., Xu, J., Zhang, X., and Pan, X. (2024). Efficiency and driving factors of agricultural carbon emissions: a study in Chinese state farms. Agriculture 14:1454. doi: 10.3390/agriculture14091454
He, Y., Fu, D., Zhang, H., and Wang, X. (2023). Can agricultural production services influence smallholders’ willingness to adjust their agriculture production modes? Evidence from Rural China. Agriculture 13:564. doi: 10.3390/agriculture13030564
He, Q., and Huang, B. (2018). Satellite-based mapping of daily high-resolution ground PM2. 5 in China via space-time regression modeling. Remote Sens. Environ. 206, 72–83. doi: 10.1016/j.rse.2017.12.018
He, P., Zhang, J., and Li, W. (2021). The role of agricultural green production technologies in improving low-carbon efficiency in China: necessary but not effective. J. Environ. Manag. 293:112837. doi: 10.1016/j.jenvman.2021.112837
Huan, M., Li, Y., Chi, L., and Zhan, S. (2022). The effects of agricultural socialized services on sustainable agricultural practice adoption among smallholder farmers in China. Agronomy 12:2198. doi: 10.3390/agronomy12092198
Huan, M., and Zhan, S. (2022). Agricultural production services, farm size and chemical fertilizer use in China’s maize production. Land 11:1931. doi: 10.3390/land11111931
Janus, J., and Ertunç, E. (2023). Impact of land consolidation on agricultural decarbonization: estimation of changes in carbon dioxide emissions due to farm transport. Sci. Total Environ. 873:162391. doi: 10.1016/j.scitotenv.2023.162391
Jin, B., Cui, C., Wen, L., Shi, R., and Zhao, M. (2024). Regional differences and convergence of agricultural carbon efficiency in China: embodying carbon sink effect. Ecol. Indic. 169:112929. doi: 10.1016/j.ecolind.2024.112929
Li, Q., and Li, K. (2020). Rice farmers’ demands for productive services: evidence from Chinese farmers. Int. Food Agribus. Manage. Rev. 23, 339–354. doi: 10.22004/ag.econ.307211
Li, M., Liu, X., and Yang, M. (2024). Analyzing the regional inequality of renewable energy consumption and its driving factors: evidence from China. Renew. Energy 223:120043. doi: 10.1016/j.renene.2024.120043
Li, Y., Yi, F., and Yuan, C. (2023). Influences of large-scale farming on carbon emissions from cropping: evidence from China. J. Integr. Agric. 22, 3209–3219. doi: 10.1016/j.jia.2023.08.006
Liang, Y., Liang, Y., and Tu, X. (2024). Identification and spatial pattern analysis of abandoned farmland in Jiangxi Province of China based on GF-1 satellite image and object-oriented technology. Front. Environ. Sci. 12:1423868. doi: 10.3389/fenvs.2024.1423868
Lin, Y., Hu, R., Zhang, C., and Chen, K. (2022). The role of public agricultural extension services in driving fertilizer use in rice production in China. Ecol. Econ. 200:107513. doi: 10.1016/j.ecolecon.2022.107513
Lin, J., Jin, S., and Guo, H. (2023). Do outsourcing services provided by agricultural cooperatives affect technical efficiency? Insights from tobacco farmers in China. Ann. Public Coop. Econ. 94, 781–804. doi: 10.1111/apce.12435
Liu, Y., Heerink, N., Li, F., and Shi, X. (2022). Do agricultural machinery services promote village farmland rental markets? Theory and evidence from a case study in the North China plain. Land Use Policy 122:106388. doi: 10.1016/j.landusepol.2022.106388
Liu, M., and Yang, L. (2021). Spatial pattern of China’s agricultural carbon emission performance. Ecol. Indic. 133:108345. doi: 10.1016/j.ecolind.2021.108345
Liu, Y., and Zhou, Y. (2021). Reflections on China's food security and land use policy under rapid urbanization. Land Use Policy 109:105699. doi: 10.1016/j.landusepol.2021.105699
Lu, H., Chen, Y., and Luo, J. (2024). Development of green and low-carbon agriculture through grain production agglomeration and agricultural environmental efficiency improvement in China. J. Clean. Prod. 442:141128. doi: 10.1016/j.jclepro.2024.141128
Lu, H., Duan, N., and Chen, Q. (2023). Impact of agricultural production outsourcing services on carbon emissions in China. Environ. Sci. Pollut. Res. 30, 35985–35995. doi: 10.1007/s11356-022-24771-2
Lyne, M. C., Jonas, N., and Ortmann, G. F. (2018). A quantitative assessment of an outsourced agricultural extension service in the Umzimkhulu district of KwaZulu-Natal, South Africa. J. Agric. Educ. Ext. 24, 51–64. doi: 10.1080/1389224X.2017.1387159
Mendes, J. A. J., Oliveira, A. Y., Santos, L. S., Gerolamo, M. C., and Zeidler, V. G. Z. (2024). A theoretical framework to support green agripreneurship avoiding greenwashing. Environ. Dev. Sustain. 27, 21779–21835. doi: 10.1007/s10668-024-04965-z
Mi, Q., Li, X., and Gao, J. (2020). How to improve the welfare of smallholders through agricultural production outsourcing: evidence from cotton farmers in Xinjiang, Northwest China. J. Clean. Prod. 256:120636. doi: 10.1016/j.jclepro.2020.120636
Netz, B., Davidson, O. R., Bosch, P. R., Dave, R., and Meyer, L. A. (2007). Climate change 2007: Mitigation. Contribution of Working Group III to the Fourth Assessment Report of the Intergovernmental Panel on Climate Change. Summary for Policymakers. Bangkok, Thailand: Paris: IPCC.
Qing, C., Zhou, W., Song, J., Deng, X., and Xu, D. (2023). Impact of outsourced machinery services on farmers' green production behavior: evidence from Chinese rice farmers. J. Environ. Manag. 327:116843. doi: 10.1016/j.jenvman.2022.116843
Qiu, T., Choy, S. B., and Luo, B. (2022). Is small beautiful? Links between agricultural mechanization services and the productivity of different-sized farms. Appl. Econ. 54, 430–442. doi: 10.1080/00036846.2021.1963411
Qiu, T., Shi, X., He, Q., and Luo, B. (2021). The paradox of developing agricultural mechanization services in China: supporting or kicking out smallholder farmers? China Econ. Rev. 69:101680. doi: 10.1016/j.chieco.2021.101680
Shen, X., Yan, R., and Jiang, M. (2025). How does planting structure change affect the agricultural net carbon sink? Evidence from the Jiangsu coastal economic belt. Ecol. Indic. 170:112949. doi: 10.1016/j.ecolind.2024.112949
Shi, F., Cai, B., Meseretchanie, A., Geremew, B., and Huang, Y. (2023). Agricultural socialized services to stimulate the green production behavior of smallholder farmers: the case of fertilization of rice production in South China. Front. Environ. Sci. 11:1169753. doi: 10.3389/fenvs.2023.1169753
Shi, R., Shen, Y., Du, R., Yao, L., and Zhao, M. (2024). The impact of agricultural productive service on agricultural carbon efficiency—from urbanization development heterogeneity. Sci. Total Environ. 906:167604. doi: 10.1016/j.scitotenv.2023.167604
Song, S., Zhao, S., Zhang, Y., and Ma, Y. (2023). Carbon emissions from agricultural inputs in China over the past three decades. Agriculture 13:919. doi: 10.3390/agriculture13050919
Sroufe, R., and Watts, A. (2022). Pathways to agricultural decarbonization: climate change obstacles and opportunities in the US. Resour. Conserv. Recycl. 182:106276. doi: 10.1016/j.resconrec.2022.106276
Sun, X., Tao, J., and Kuang, X. (2025). A study of industrial structure, government attention, and coupling coordination of digital-green economy in China. J. Environ. Plan. Manag. 68, 1009–1036. doi: 10.1080/09640568.2023.2276681
Sun, C., Xia, E., Huang, J., and Tong, H. (2024). Coupling and coordination of food security and agricultural carbon emission efficiency: changing trends, influencing factors, and different government priority scenarios. J. Environ. Manag. 370:122533. doi: 10.1016/J.JENVMAN.2024.122533
Ullman, A. N., and Kittner, N. (2024). Are global efforts coordinated for a just transition? A review of civil society, financial, government, and academic just transition frameworks. Energy Res. Soc. Sci. 108:103371. doi: 10.1016/j.erss.2023.103371
Wu, B., Guo, Y., Chen, Z., and Wang, L. (2024). Do agricultural productive services impact the carbon emissions of the planting industry in China: promotion or inhibition? Sustainability 16:6850. doi: 10.3390/su16166850
Xu, B., Baležentis, T., Štreimikienė, D., and Shen, Z. (2024). Enhancing agricultural environmental performance: exploring the interplay of agricultural productive services, resource allocation, and marketization factors. J. Clean. Prod. 439:140843. doi: 10.1016/j.jclepro.2024.140843
Xu, Y., Lyu, J., Xue, Y., and Liu, H. (2022b). Does the agricultural productive service embedded affect farmers’ family economic welfare enhancement? An empirical analysis in black soil region in China. Agriculture 12:1880. doi: 10.3390/agriculture12111880
Xu, X., Zhang, B., Liu, Y., Xue, Y., and Di, B. (2013). Carbon footprints of rice production in five typical rice districts in China. Acta Ecol. Sin. 33, 227–232. doi: 10.1016/j.chnaes.2013.05.010
Xu, Q., Zhu, P., and Tang, L. (2022a). Agricultural services: another way of farmland utilization and its effect on agricultural green total factor productivity in China. Land 11:1170. doi: 10.3390/land11081170
Yan, F., Chen, M., Huang, Q., Yan, Z., Liu, Y., and Zhang, F. (2025). Social networks and farmers' low-carbon rice farming intention and behavioral discrepancies under the social embedding perspective. J. Clean. Prod. 491:144814. doi: 10.1016/j.jclepro.2025.144814
Yang, Y., Lian, D., Zhang, Y., Wang, D., and Wang, J. (2024). Analysis of the impact of resource misallocation and socialized services on low-carbon agricultural production with DML based on random forest. Int. Rev. Econ. Finance 95:103452. doi: 10.1016/j.iref.2024.103452
Yang, B., Wang, Z., Zou, L., Zou, L., and Zhang, H. (2021). Exploring the eco-efficiency of cultivated land utilization and its influencing factors in China's Yangtze River Economic Belt, 2001–2018. J. Environ. Manag. 294:112939. doi: 10.1016/J.JENVMAN.2021.112939
Yang, C., Zeng, W., and Yang, X. (2020). Coupling coordination evaluation and sustainable development pattern of geo-ecological environment and urbanization in Chongqing municipality, China. Sustain. Cities Soc. 61:102271. doi: 10.1016/j.scs.2020.102271
Yin, Z., Tang, Y., Liu, H., and Dai, L. (2023). Coupling coordination relationship between tourism economy-social welfare-ecological environment: empirical analysis of Western area, China. Ecol. Indic. 155:110938. doi: 10.1016/j.ecolind.2023.110938
Yong, Z., Xiao-yuan, Y., Song-ling, G., Cheng-wei, L., Rong, Z., Bo, Z., et al. (2022). Changes in paddy cropping system enhanced economic profit and ecological sustainability in Central China. J. Integr. Agric. 21, 566–577. doi: 10.1016/S2095-3119(21)63841-8
York, R., Rosa, E. A., and Dietz, T. (2003). STIRPAT, IPAT and ImPACT: analytic tools for unpacking the driving forces of environmental impacts. Ecol. Econ. 46, 351–365. doi: 10.1016/S0921-8009(03)00188-5
Yu, Y., Chi, Z., Yu, Y., Zhao, J., and Peng, L. (2024). Boosting agricultural green development: does socialized service matter? PLoS One 19:e0306055. doi: 10.1371/journal.pone.0306055
Yun, T., Zhang, J., and He, Y. (2014). Research on spatial-temporal characteristics and driving factor of agricultural carbon emissions in China. J. Integr. Agric. 13, 1393–1403. doi: 10.1016/S2095-3119(13)60624-3
Zhang, Q., Cao, Z., Wang, Y., and Huang, Y. (2024). Carrying capacity and coupling coordination of water and land resources systems in arid and semi-arid areas: a case study of Yulin city, China. Chin. Geogr. Sci. 34, 931–950. doi: 10.1007/s11769-024-1460-7
Zhang, X., Liao, K., and Zhou, X. (2022). Analysis of regional differences and dynamic mechanisms of agricultural carbon emission efficiency in China's seven agricultural regions. Environ. Sci. Pollut. Res. 29, 38258–38284. doi: 10.1007/s11356-021-16661-w
Zhang, X., Zhou, X., and Liao, K. (2023). Regional differences and dynamic evolution of China’s agricultural carbon emission efficiency. Int. J. Environ. Sci. Technol. 20, 4307–4324. doi: 10.1007/s13762-022-04196-7
Keywords: agricultural productive services, carbon efficiency in rice production, coupling coordination degree, geographically and temporally weighted regression model, sustainable development of agriculture
Citation: Wu B, Gao J, Guo Y, Wang L and Zhao H (2025) Spatiotemporal heterogeneity and drivers of coupling coordination between agricultural productive services and rice production carbon efficiency: evidence from county-level data in Jiangxi province, China. Front. Sustain. Food Syst. 9:1658655. doi: 10.3389/fsufs.2025.1658655
Edited by:
Patricia Abrantes, University of Lisbon, PortugalReviewed by:
Qiao Chen, Hubei University of Economics, ChinaWenhao Xia, Zhejiang Agriculture and Forestry University, China
Copyright © 2025 Wu, Gao, Guo, Wang and Zhao. This is an open-access article distributed under the terms of the Creative Commons Attribution License (CC BY). The use, distribution or reproduction in other forums is permitted, provided the original author(s) and the copyright owner(s) are credited and that the original publication in this journal is cited, in accordance with accepted academic practice. No use, distribution or reproduction is permitted which does not comply with these terms.
*Correspondence: Jiangtao Gao, MjIwMjMxMDA4OUBzdHUuanh1ZmUuZWR1LmNu
†These authors have contributed equally to this work