 Chaitanya Prasad Nath1*
 Asik Dutta1*
 Kali Krishna Hazra1
 Narendra Kumar1*
 C. S. Praharaj2Mukesh Kumar1
 Mohammad Hashim1G. P. Dixit1
- 1Division of Crop Production, ICAR- Indian Institute of Pulses Research, Kanpur, India
- 2ICAR- Indian Institute of Groundnut Research, Junagadh, Gujarat, India
Sustaining levels of soil potassium (K) pools in soils across agro-ecologies are crucial for optimizing nutrient use, prevent K depletion, and ensure long-term soil health. This study explores the underlying mechanisms and interconnections among various K pools under contrasting upland (maize-based) and lowland (rice-based) ecologies from a 14 years long-term field experiment conducted on Fluvisols encompassing four cropping systems (main plots) and three nutrient management strategies (sub-plots). The maize–wheat–maize–chickpea system recorded the highest water-soluble (15.6 kg ha−1) and exchangeable K (162.7 kg ha−1), while pigeonpea–wheat had the highest non-exchangeable K (1826.2 kg ha−1), over maize–wheat (p < 0.05). In the 0–15 cm, INM significantly improved soil K fractions over RDF, with water-soluble, exchangeable, non-exchangeable, and total K increasing by 37.6, 17.9, 12.2, and 10.1%, respectively. In lowland ecology, the rice–wheat system contains 50 and 30% higher water-soluble K than rice–wheat–rice–chickpea and rice–wheat–mungbean at 0–15 cm. While, exchangeable and non-exchangeable K increased by 3.4–13% in the same over other systems. At 15–30 cm, rice–wheat–rice–chickpea recorded 9–10% higher water-soluble K and exchangeable K than other systems. Ecology-wise, a notable finding was that lowland soils exhibited 3–4 times higher water-soluble K, 52% more exchangeable K, and 5–10% higher non-exchangeable K than upland soils (p < 0.05). Wheat yields correlated significantly with total, exchangeable, and water-soluble K in upland. Rice yields in lowland significantly correlated with total, non-exchangeable, and water-soluble K, indicating the importance of soil K reserves in crop productivity. Systems like pigeonpea–wheat, maize–wheat–maize–chickpea, and rice–wheat–rice–chickpea were most effective in replenishing K reserves, offering a scalable strategy to support soil K levels against intensive cereal based systems underlining the ecological benefits of legume inclusion and integrated nutrient management in sustaining soil K dynamics across diverse production systems.
1 Introduction
Potassium (K) is a crucial nutrient for plants, playing a multifaceted role in photosynthesis, water balance, and overall plant health (Wang et al., 2013). Due to its significant impact on grain size, shape, colour, shelf life, and the production of more protein and oil in field crops, K is considered a quality-dependent element (Rawat et al., 2022). Potassium deficiency is widespread affecting soil fertility and crop productivity worldwide with estimation that approximately 50% of the world’s arable soils are K deficient including Indian soils (FAO, 2017). Specifically, global regional studies indicated a K deficiency in soils comprising 60% in Asia, 55% in Africa, 45% in Latin America, 30% in Europe, and 25% in North America (Randive et al., 2021). Twenty-five per cent of the soils in European nations are ‘very low’ and/or ‘low’ in readily available K (Dey et al., 2017). Imbalanced K-fertilization has led to an exhaustion of soil’s native K stock, resulting in yield losses and increased economic risks to the farmers (Kinekar, 2011). A nutrient balance analysis by Gami et al. (2001) across China, Indonesia, Malaysia, Philippines, Thailand, and Vietnam revealed an annual K-deficit of approximately 11 million tonnes, which is 250% higher than existing K fertilizer consumption. Moreover, China and Indonesia faced a K-deficit of 8 million tonnes (62 kg ha−1), and 1.2 million tonnes (41 kg ha−1) respectively, with severe consequences on soil health and food security. Looking further ahead, globally projected demand for K-fertilizers likely to touch 32.8 million MT by 2030 and for India with annual 7% growth rate for K2O, the import will likely to jump exponentially (Drescher et al., 2011; IBM, 2020; Singh and Sapkota, 2025). Previous studies highlighted that soil available K alone may misguide K fertilizer recommendations due to the dynamic nature of K pools (Sanyal et al., 2014). Hence, understanding K dynamics is crucial to optimize use, reduce dependence, and ensure long-term nutrient security (Randive et al., 2021). Studying various K pools such as, available, exchangeable, and non-exchangeable—are essential for improving K management, sustaining soil fertility, and developing site-specific strategies (Tewatia et al., 2017). However, long-term data on this is limited.
There are different scenarios of fertilizer usage methods across globes such as chemical fertilization, integrated nutrient management (INM), and no fertilization (Das et al., 2022). Fundamentally, K mining from soil and its dynamics varied with external fertilizer management including chemical and integrated fertilization, crops/cropping system, and cropping system ecology (lowland and upland) (Buresh et al., 2010). Sole reliance on chemical fertilizers may enhance short-term yields but often leads to K imbalances, soil degradation, and declining microbial activity over time (Borase et al., 2020). In contrast, INM-combining chemical fertilizers with organic amendments and bio-fertilizers-ensure balanced nutrient supply, improve soil structure, and prevent K-leaching due to formation of clay-organic complex formation (Hazra et al., 2019). Besides, use of compost, manure, or crop residues can modify soil K dynamics by changing K availability/solubility and releasing K through mineralization of soil organic matter (Randive et al., 2021). Also, organic amendments revamp exchangeable K content via creating adsorption sites and hindering fixation of available K (Li et al., 2020).
Potassium dynamics in soil involve complex interactions between various processes and factors, affecting its availability, movement, and uptake by plants. The degree of interaction between K and solid phase determines whether it is found in the soil in soluble, exchangeable, non-exchangeable, or structural pools (Lalitha and Dhakshinamoorthy, 2014). Different plants have varying K requirements and uptake efficiencies; thus, crop rotation can optimize K uptake and minimize depletion (White et al., 2021). Thus, crop rotation can influence K dynamics in soil, impacting its availability, uptake, and utilization by subsequent crops (Wang and Wu, 2015). Over time cereal-based systems like rice–wheat and maize–wheat with chemical fertilization may deplete non-labile K pools despite, higher available K levels (Islam et al., 2023). Findings under different maize based systems revealed, water soluble K and exchangeable K was highest in maize-chickpea system as compared to cereal based system and the soil K balance was more sustained in the legume based system over continuous cereal based systems (Kumar et al., 2022). However, under long run systems more attention must be given towards non-exchangeable K status especially in diversified cropping system because of its contribution in plant available K pool in long-run (Buresh et al., 2010; Sarkar et al., 2014).
Holistic approaches including plant diversity, cover cropping, soil management, landscape position, and ecosystem resilience influence K dynamics. Cropping system ecology such as lowland and upland significantly influences K dynamics, impacting its availability, uptake, mineralization/immobilization, and utilization by crops (Wang et al., 2013). Particularly, in the water limited environment there was a complex interlink between aqua-porins and K-channel transporters as Wang et al. (2013) suggested under K-deficiency the activity of aqua-porins severely restricted, cynically impacting root hydraulic conductivity vis-à-vis K-uptake. Moreover, upland and lowland cropping system ecologies alter the K fractions because of difference in chemical properties, solubility, oxidation–reduction reactions, and cation exchange capacity (CEC). For instance, anaerobic soil condition in lowland ecology (in rice-based production system) results in progressive K supply throughout the growing period whereas; in dry season (under rice) K availability peaks in the reproductive phase (Mohapatra et al., 2025). In upland soils, which are typically well-drained, potassium is prone to leaching losses, especially in coarse-textured and soils with low CEC. Furthermore, due to minimal waterlogging in the later, K availability fluctuates with rainfall, soil moisture, and soil depths (Srivastava et al., 2014). In the Indian Indo-Gangetic Plains (IGP) regions, rice-wheat in lowland production ecologies and maize-wheat in upland production ecologies are dominant (Das et al., 2020; Nath et al., 2023b). But, for achieving environmentally sound farming practice inclusion of legume and practising integrated fertilisation methods is a must (Nath et al., 2023a; Nath et al., 2019). Despite the growing recognition of role of K in sustainable farming, there is a significant research gap in system and ecology-specific K pools assessments under Indian context (Dey et al., 2017). This particular study emphasizes three important aspects like production ecologies, legume inclusion (cropping system diversification) and importance of balanced fertilisation in a single frame as missed by most of the earlier long run studies from IGP focusing only about rice-wheat system. Therefore, in this specific study detailed information’s about the interactive impact of legume inclusion under variable cereal based production ecologies (upland and lowland) and nutrient management (chemical and integrated fertilization) on soil K pools have been generated.
The objectives were: (i) to quantify different K fractions (water-soluble, exchangeable, non-exchangeable, and mineral-bound) shaped by long run cropping systems (cereal-cereal and cereal-legume) and nutrient management practices, (ii) to assess long-term impact of cropping system ecology (lowland and upland) on K pools and their correlation with base crop yields, and (iii) to delineate the soil depth effects (0–15 cm and 15–30 cm) on K fractions under varied management and production ecologies. It was hypothesized that (a) long-term interactions between cropping system (cereal-cereal vs. cereal-legume), nutrient management strategies (chemical vs. integrated), and production ecologies (upland vs. lowland) significantly alter the availability and distribution of soil K fractions across soil depths, (b) inclusion of legume in cereal based under long run systems would considerably augment non-exchangeable soil K pools.
2 Materials and methods
2.1 Site characteristics
Current legume inclusive long–term experiments were located at the ICAR-Indian Institute of Pulses Research, Kanpur (26°27′N latitude and 80°14′E longitude), India and initiated in 2003. The trial sites consisted two different cropping ecologies such included upland ecology and lowland ecology at same studied location. Upland and lowland cropping ecologies differed primarily in land topography, water drainage, soil aeration capacity, and soil properties. Upland ecologies are typically well-drained, support crops like maize and sorghum during rainy seasons (Nath et al., 2023a). On contrary, lowland ecologies are often flood-prone with poor drainage, favored water-tolerant crops such as rice (Nath et al., 2019). Soil in lowlands is anaerobic during rainy season, while upland soils are well-aerated (Raj et al., 2017). In present study, upland and lowland ecological distinctions influenced crop selection, management practices, and yield potential of crops. Based on land topography, upland cropping ecology was typically situated on higher farmland with good surface runoff and minimal water retention. In contrast, lowland ecology located in flat areas where water naturally accumulates, leading to higher moisture retention and frequent inundation, making them suitable for water-loving crops like rice. Accordingly, diversified crop rotations were designed as per ecologies in present study and K pools were studied under various cropping systems and nutrient managements. In both ecologies, four diversified crop rotations suited to the production ecology were tested (cereal-cereal and cereal-legume). Subtropical climate, with an average annual air temperature and rainfall of 26 °C and 722 mm (ranging from a minimum of 510 mm in 2015 to a peak of 1,225 mm in 2013) was climatic attributes of the study site. The soil at the trial location is classified as Fluvisol (Typic Ustochrept). Both upland and lowland ecologies exhibited sandy-loam soil texture at the 0–15 cm depth. Initial soil characteristics in the upland and lowland ecologies were presented in Supplementary Table S1.
2.2 Treatment details and layout
2.2.1 Details of upland ecology
The study followed a split-plot design with three replications. The main plot treatments comprised four cropping systems: maize–wheat (M–W), maize–wheat–mungbean (M–W–Mb), maize–wheat–maize–chickpea (M–W–M–C; a legume introduced in alternate years), and pigeonpea–wheat (P–W) (Figure 1). Subplot treatments included three soil fertility management practices: no fertilizer input (CT), application of region-specific recommended doses of chemical fertilizers (RDF), and integrated nutrient management (INM), which consisted of 50% RDF, full incorporation of crop residues, farmyard manure at 5 t ha−1, and bio-fertilizers.
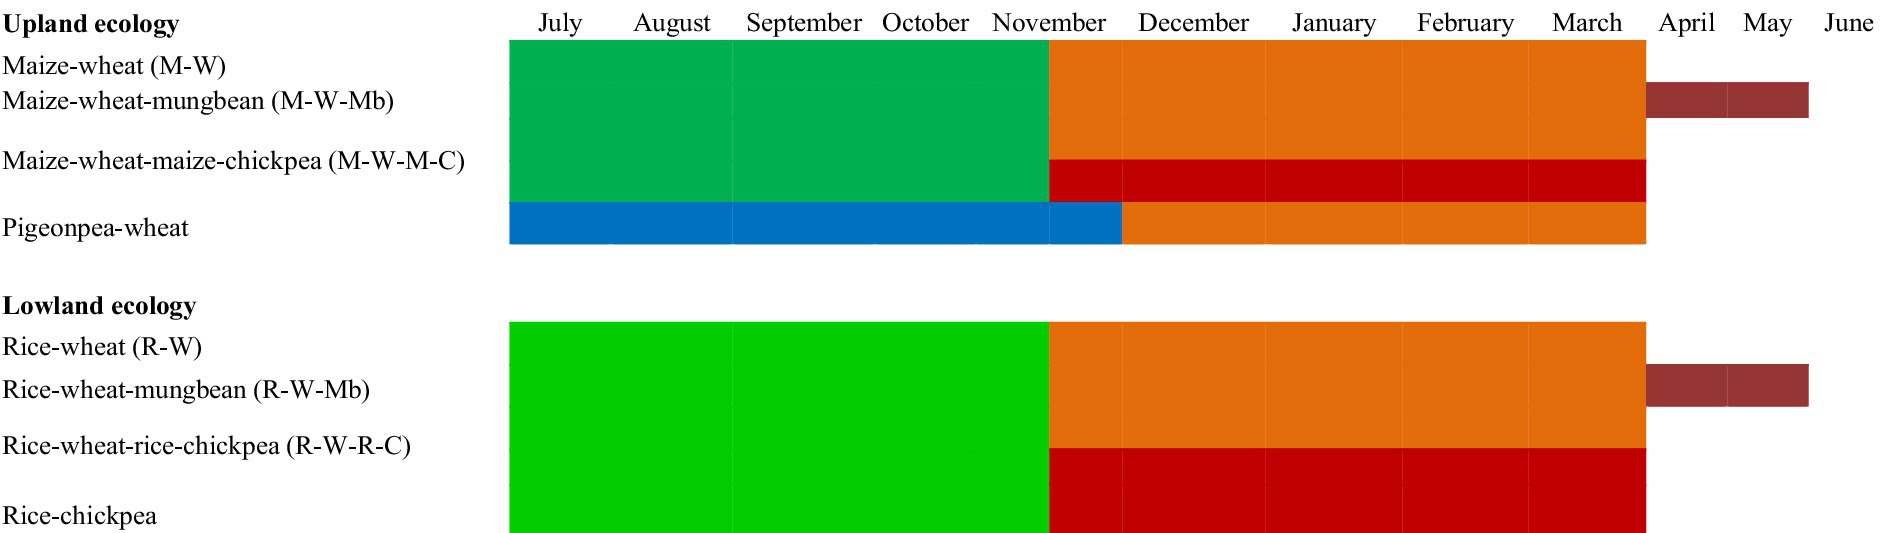
Figure 1. Crop calendar in each cropping system under upland ecology and lowland ecology in study.
2.2.2 Details of lowland ecology
The field trial was laid out in a split-plot design with three replications. The main plots included four cropping systems: rice–wheat (R–W), rice–wheat–mungbean (R–W–Mb), rice–wheat–rice–chickpea (R–W–R–C; a legume-based rotation in alternate years), and rice–chickpea (R–C) (Figure 1). Under subplot, nutrient management treatments were kept consistent across both ecologies. Each subplot measured 49 m2 (7 m × 7 m), resulting in a total of 36 plots per ecology (3 replications × 4 cropping systems × 3 fertilization treatments = 36).
2.3 Crop management
2.3.1 Details of cultivars, crop geometry and crop management in upland ecology
The cultivars and seed rate within parenthesis used in the study included ‘Azad Uttam’ for maize (20 kg ha−1), ‘UPAS 120’ for pigeonpea (15 kg ha−1), ‘PBW 343’ for wheat (100 kg ha−1), ‘DCP 92–3’ for chickpea (80 kg ha−1), and ‘Samrat’ for mungbean (12 kg ha−1). The crop calendar (Figure 1) will give the best overview about the growing season of kharif and rabi crops. Crop spacing was maintained at 45 cm × 15 cm for maize, 60 cm × 15 cm for pigeonpea, and 30 cm × 10 cm for both chickpea and mungbean, while wheat was sown with 20 cm row spacing. Water management was followed as per standard procedure (Nath et al., 2023a).
2.3.2 Details of cultivars, crop geometry and crop management in lowland ecology
The cultivars used in the lowland system included ‘Pant Dhan 12’ for rice (seed rate: 30 kg ha−1), ‘PBW 343’ for wheat (100 kg ha−1), ‘DCP 92–3’ for chickpea (80 kg ha−1), and ‘Samrat’ for mungbean (15 kg ha−1). The cropping seasons were structured as follows: the rainy season (July–November) was allocated for rice; winter (November–March) for wheat and chickpea; and summer (April–June) for mungbean (Figure 1). Rice was transplanted using 25-day-old seedlings under puddled conditions, which involved two dry tillage operations followed by wet tillage using a rotavator in standing water. Transplanting was done with two seedlings per hill, maintaining a row spacing of 20 cm and hill spacing of 10 cm. Crop geometry for wheat, chickpea, and mungbean was consistent with that used in the upland ecology. The number of irrigations varied by crop (rice: 10–12, wheat: 5, chickpea: 2, and mungbean: 4) and rainfall.
2.3.3 Nutrient and weed management in both ecologies
Nutrient management practices were consistent across both upland and lowland ecologies, with crop-specific nutrient applications remaining uniform. Under the control (CT) treatment, no fertilizers were applied throughout the study period. The recommended dose of fertilizers (RDF) for cereals (maize, rice, and wheat) and legumes (chickpea, pigeonpea, and mungbean) was: 120:60:40 kg ha−1 and 20:60:40 kg ha−1 of N: P2O5: K2O, respectively. In cereals, nitrogen (applied as urea) was split into three equal portions during sowing, 25 and 45 days after sowing (DAS), respectively. Both Phosphorus (from diammonium phosphate) and potassium (from muriate of potash) were applied as a basal dose in cereals and legumes. For the integrated nutrient management (INM) treatment, 5 t ha−1 of farmyard manure (FYM) was mixed evenly into the soil during land preparation, two weeks before the onset of the rainy season crop. Biofertilizers were applied through seed treatment: Azotobacter for cereals, Rhizobium for legumes, and Bacillus polymyxa (a phosphate-solubilizing bacterium) for both groups at 20 g Kg−1 of seed. The FYM used contained 0.56% N, 0.18% P, and 0.52% K. Herbicides like bispyribac sodium (20 g a.i. ha−1), atrazine (1 kg a.i. ha−1) and pendimethalin (750 g a.i. ha−1) was applied in rice, maize and pulse crops to control the weeds (Nath et al., 2022).
2.4 Procedure of soil sampling and processing
Soil sampling was conducted in both ecologies during April 2017, coinciding with the harvest of the base crops (wheat and rice) in the 14th crop cycle with no intermediate sampling. Samples were collected from each treatment plot across three replications at two soil depths: 0–15 cm and 15–30 cm. Using a post-hole auger equipped with a sharpened edge and a 15 cm core height, samples were taekn from six randomly selected sites per plot, arranged in a Z-pattern, excluding a 1-meter margin around each plot. For each depth, the six subsamples were thoroughly mixed to form one composite sample per treatment. The collected soils were first air-dried for 72 h, sieved through a 2 mm mesh, and then oven-dried at 60 °C for 72 h prior to K fraction analysis. A total of 36 composite samples were prepared, corresponding to the experimental design (4 cropping systems × 3 nutrient management practices × 3 replications), ensuring data accuracy and consistency.
2.5 Estimation of potassium pools and correlation with base crop yield
In this study, four potassium fractions namely; water-soluble K, exchangeable K, non-exchangeable K, and total K were determined. Fraction 1, i.e., Water-soluble K was determined by shaking soil with distilled water (1:10 ratio) for 1 h. Prior to centrifugation and filtration, and K-concentration was measured using a flame photometer (SYSTRONICS Model 1,027, India) (Jackson, 1973). Available K was extracted using 1 N ammonium acetate (pH 7.0) in a 1:5 soil-to-solution ratio, shaken for 5 min and assessed using flame photometer (Hanway and Heidel, 1952). Exchangeable K (Fraction 2) was deduced by subtracting water-soluble K from available K. 1 N HNO3-extractable K was determined by boiling 1:10 soil-to-acid ratio (25 mL of 1 N HNO3) for 10 min on a hot plate at 150–180 °C. After cooling, the mixture was filtered into a 100 mL volumetric flask and diluted to volume using 0.1 N HNO3. The K concentration in the filtrate was measured by flame photometry, following the procedure of Wood and DeTurk (1941). Non-exchangeable K (Fraction 3) was calculated by subtracting available K from the 1 N HNO3-extractable K. Total K (Fraction 4) was estimated by wet digestion using hydrofluoric acid (HF) and perchloric acid (HClO4) as described by Pratt (1965). For this, 0.1 g of finely ground soil was pre-dried at 100 °C for 2 h, placed in a 30 mL platinum crucible, and moistened with a few drops of distilled water. Then, 5 mL of 48% HF and 0.5 mL of 60% HClO4 were added. The crucible, mostly covered with a platinum lid, was heated on a sand bath at 200–225 °C until the acids evaporated. After cooling, 5 mL of distilled water and a few drops of HClO4 were added, and the mixture was re-boiled to dryness. Once cooled again, 5 mL of 6 M HCl was added and diluted to two-thirds of the crucible volume. The solution was gently boiled until all residues dissolved and after volume make-up to 100 mL, the K content was determined using flame photometer.
Grain yield data of all component crops within each cropping system and ecology were recorded annually throughout the study. For this analysis, the correlation between soil K fractions and the yield of the base crop was assessed to understand the long-term influence of K pools on crop productivity. In upland ecology, wheat served as the base crop across all rotations, while in lowland ecology, rice was the common crop across systems. Therefore, wheat yield (upland) and rice yield (lowland) from the 14th crop cycle were used for correlation analysis. Grain yield was measured by manually harvesting a 5 m × 5 m net plot area per treatment, and the yield was standardized to 14% grain moisture content and expressed in kg ha−1.
2.6 Statistical analysis
Experimental datasets were analysed following the analysis of variance (ANOVA) for split-plot design using OPSTAT program and Tukey’s Honest Significance test was used at p ≤ 0.05 for mean comparison. The correlation analysis and box plot presentation were undertaken by Microsoft Excel™ 2017. Heatmap representation was performed by online Heatmapper. Interaction effect has been assessed using t-test at 5% level of significance.
3 Results
3.1 Soil K pools in upland ecology
At 0–15 cm depth, maize-wheat-maize-chickpea had the highest water-soluble (15.6 kg ha−1) and exchangeable K (162.7 kg ha−1), while pigeonpea-wheat recorded the maximum non-exchangeable K (1826.2 kg ha−1) (Table 1). Among pulse-based systems, pigeonpea–wheat showed notable improvements in non-exchangeable K by 2.3% and water-soluble K by 3.4%, although exchangeable K decreased by 6.4% compared to the maize–wheat system (p < 0.05). At 15–30 cm depth, the respective increase of non-exchangeable K and total K was 3.4, and 4.7% (p < 0.05), while exchangeable K remained unchanged under pigeonpea-wheat and maize-wheat systems. Maize-wheat-maize-chickpea systems resulted in increased level of water-soluble K (by 9%) and non-exchangeable K (by 9.3%) than maize-wheat (p < 0.05). Integrated nutrient management (INM) recorded the highest values for all K fractions than CT and RDF across depths (p < 0.05) (Table 1). Compared to RDF, INM improved water-soluble K by 37.6%, exchangeable K by 17.9%, non-exchangeable K by 12.2%, and total K by 10.1% at 0–15 cm soil depth (p < 0.05). At 15–30 cm depth, INM again outperformed, enhancing water-soluble, exchangeable, and non-exchangeable K by 25.2, 11.0, and 10.3%, respectively, over RDF (p < 0.05). Total K increased by 4.2% under INM than that of RDF (p < 0.05).
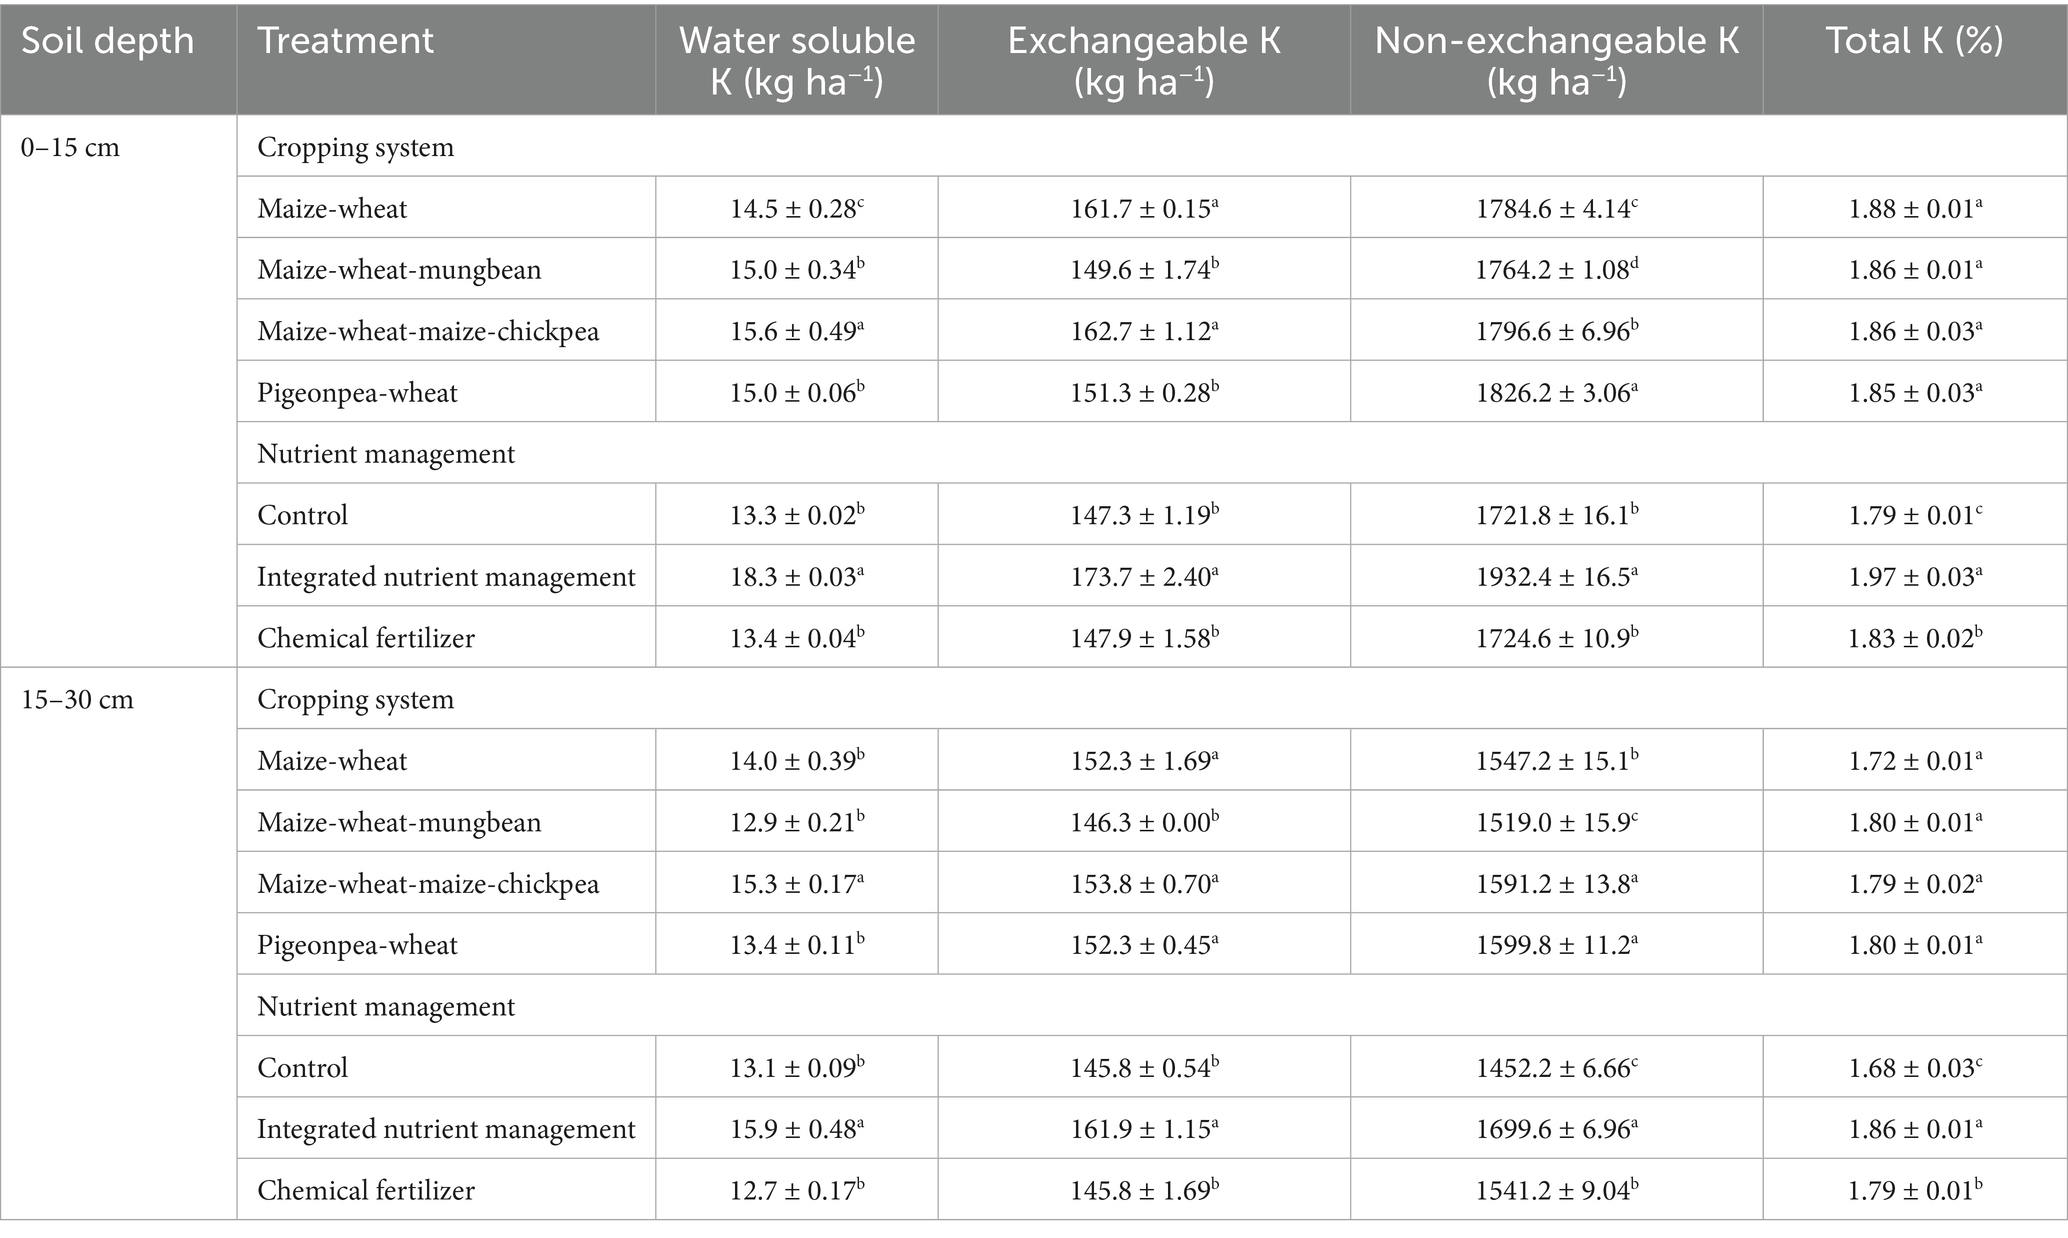
Table 1. Impact of crop rotations and nutrient management after 14 years on potassium (K) pools of soil at 0–15 and 15–30 cm soil depths in upland cropping system ecology.
3.2 Soil K pools in lowland ecology
At the 0–15 cm depth, the rice–wheat system represented increase in water soluble K by 50% over rice–wheat–rice–chickpea and 30% over rice–wheat–mungbean systems (p < 0.05) (Table 2). Exchangeable K was also higher in rice–wheat by 3.4% than rice–wheat–mungbean and 13% rice–chickpea (p < 0.05). Non-exchangeable K increased under rice–wheat by 13% than rice–chickpea and 8% than rice–wheat–mungbean (p < 0.05). At 15–30 cm depth, water soluble K was higher in rice–wheat–mungbean and rice–chickpea, showing a 9% increase over rice–wheat (p < 0.05). Interestingly, exchangeable K was the highest in rice–wheat–rice–chickpea, about 10% more than rice–wheat. Non-exchangeable K followed a similar trend, with rice–wheat outperforming others, maintaining a 7% higher value than rice–wheat–mungbean and 9% more than rice–chickpea (p < 0.05). The INM significantly enhanced all K pools, with water soluble K increasing by 47% and exchangeable K by 27% over RDF at 0–15 cm soil depth (Table 2). At 15–30 cm, INM enhanced the water-soluble K (by 18%), exchangeable K (by 12%), non-exchangeable K (by 12%) over RDF (p < 0.05). Total K was significantly highest under INM across depths, improving by 8% at 0–15 cm and 7% at 15–30 cm than RDF.
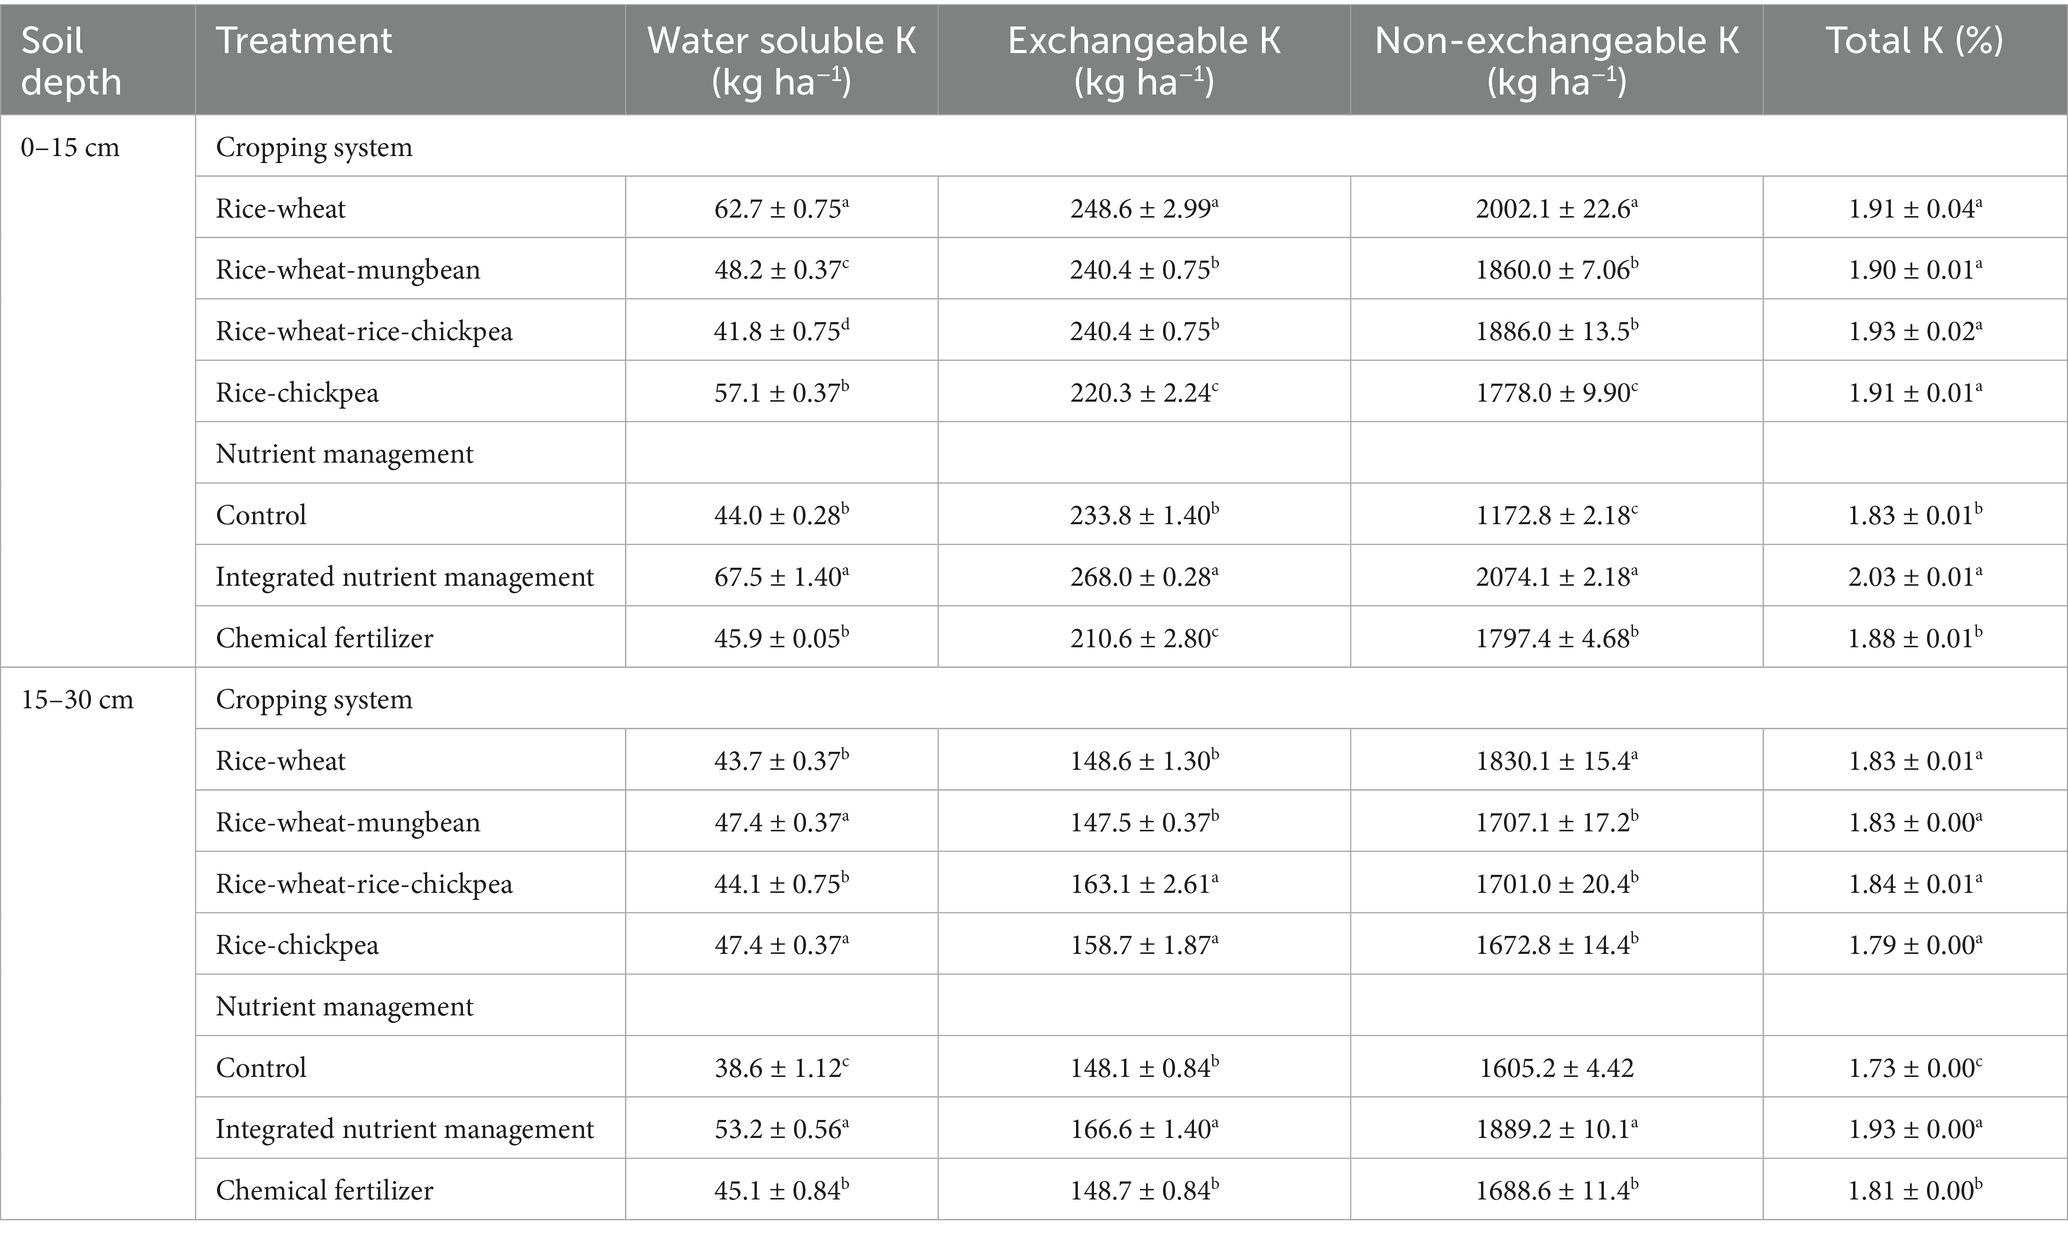
Table 2. Impact of crop rotations and nutrient management after 14 years on potassium (K) pools of soil at 0–15 and 15–30 cm soil depths in lowland cropping system ecology.
3.3 Impact of cropping system ecology (lowland and upland) on K pools
Lowland ecology significantly improved K availability across soil depths compared to upland ecology (Supplementary Figure S1). At 0–15 cm, lowland soils exhibited higher concentrations of water-soluble K (~4 times), exchangeable K, non-exchangeable K, and total K. Similarly, at 15–30 cm depth, lowland conditions maintained higher levels of all K pools, especially water-soluble and exchangeable K. Specifically, water soluble K increased under lowland ecology by 249% at 0–15 cm and 230% at 15–30 cm depth (Table 3). Exchangeable K heightened by 52% at 0–15 cm but showed a non-significant change at 15–30 cm (p < 0.05). Non-exchangeable K increased by 5% at 0–15 cm and 10% at 15–30 cm depth (p < 0.05). Cropping systems combined with INM markedly enhanced K pools than with RDF. In upland ecology, at 0–15 cm depth, the maize–wheat–maize-chickpea with INM increased exchangeable K by~34% and water-soluble K by ~48–52% over maize-wheat with RDF (Figure 2) (p < 0.05). In lowland ecology, legume-based cropping systems with INM significantly improved K pools compared to rice–wheat with RDF, increasing exchangeable K by 12–18% and water-soluble K by 20–30% across depths (p < 0.05). The pigeonpea–wheat system under INM consistently recorded the higher non-exchangeable and total K in both soil layers in upland ecology than maize-wheat with RDF (Figure 3). Rice-wheat-rice-chickpea + INM, rice-chickpea + INM resulted in 5–10% increase in non-exchangeable K over rice-wheat with RDF.
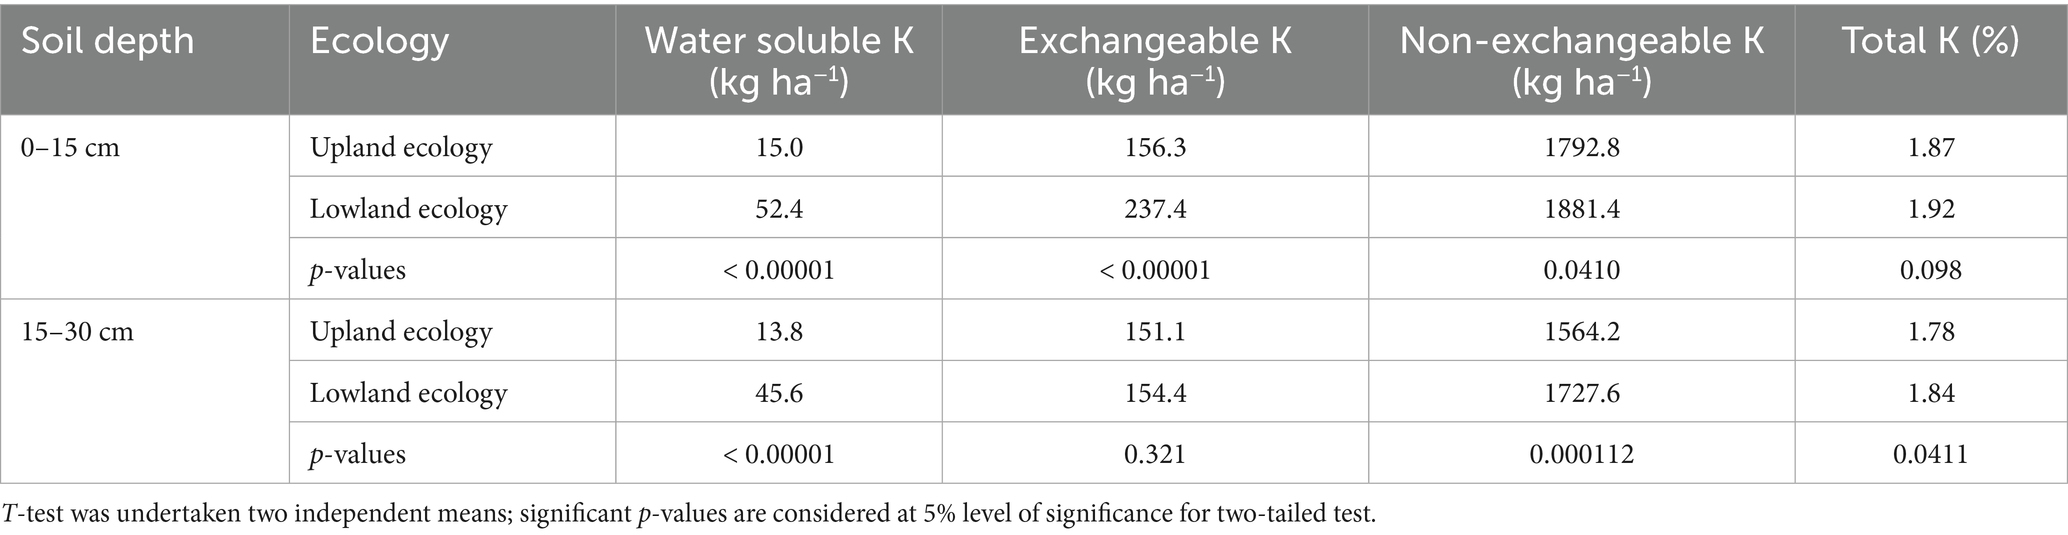
Table 3. Effect of cropping system ecology on different K fractions at soil depths after 14 years of variable crop rotations and nutrient management.
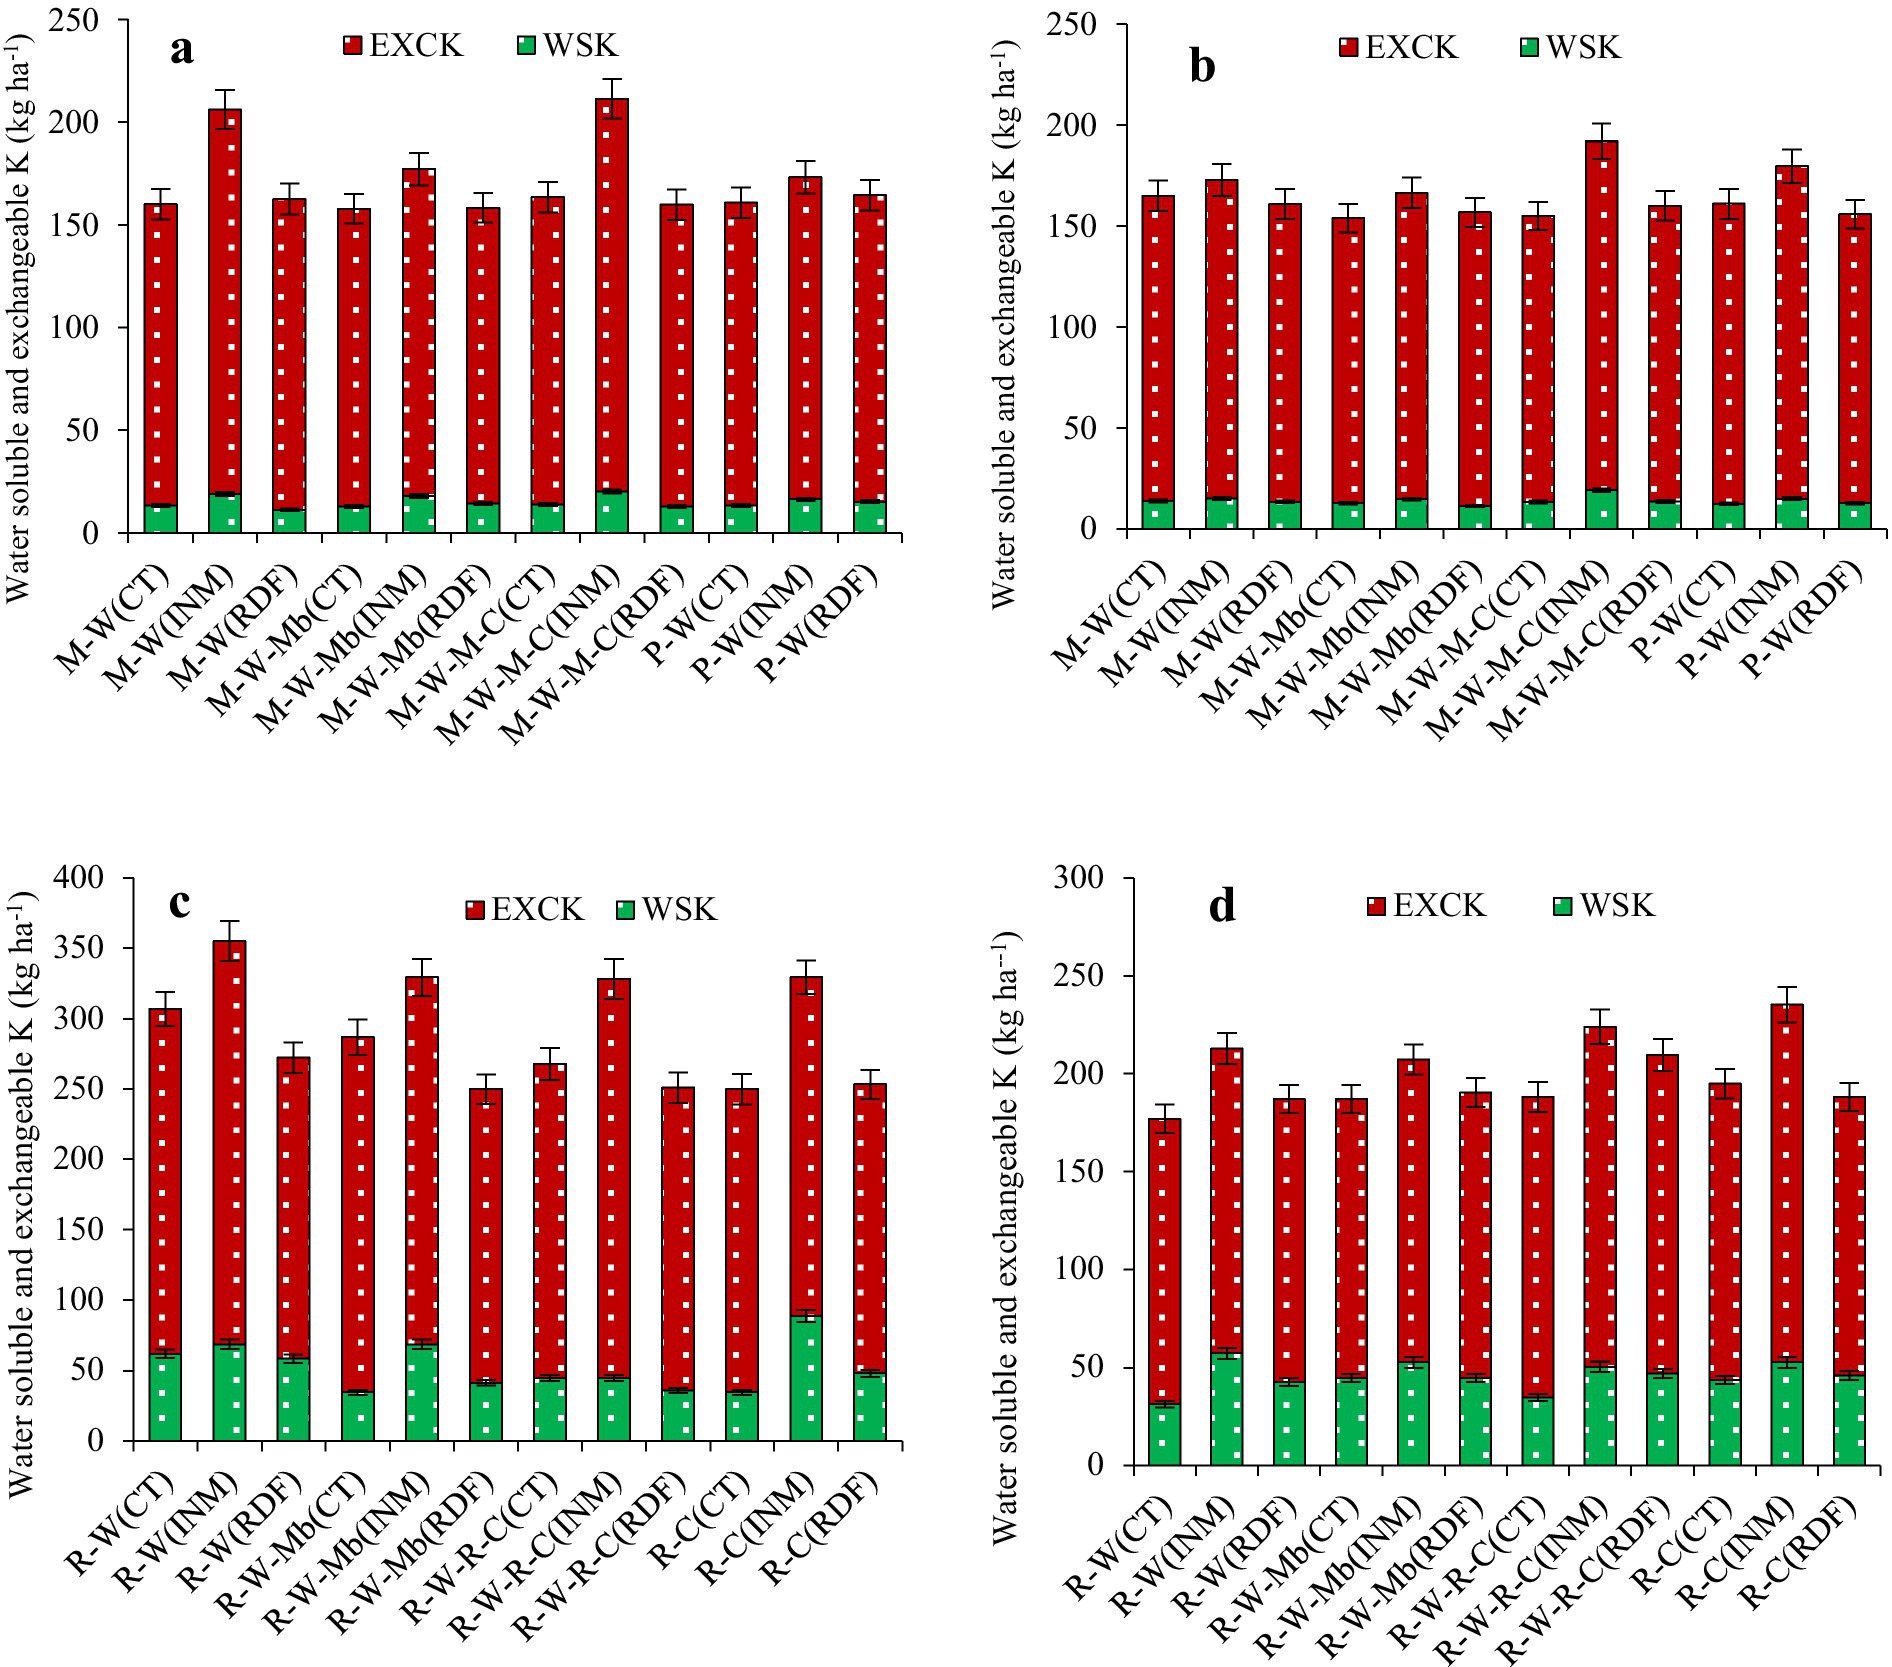
Figure 2. Interactive effect of cropping system and nutrient management (crop management system perspective) on potassium pools such as water soluble (WSK) and exchangeable K (EXCK) (kg ha−1) in upland ecology at 0–15 cm soil depth (a), upland ecology at 15–30 cm soil depth (b), lowland ecology at 0–15 cm soil depth (c), and lowland ecology at 15–30 cm soil depth after 14 years. For details of treatment see Figure 1. INM, integrated nutrient management; RDF, recommended chemical fertilization; CT, control. Error bar indicates the standard error of mean.
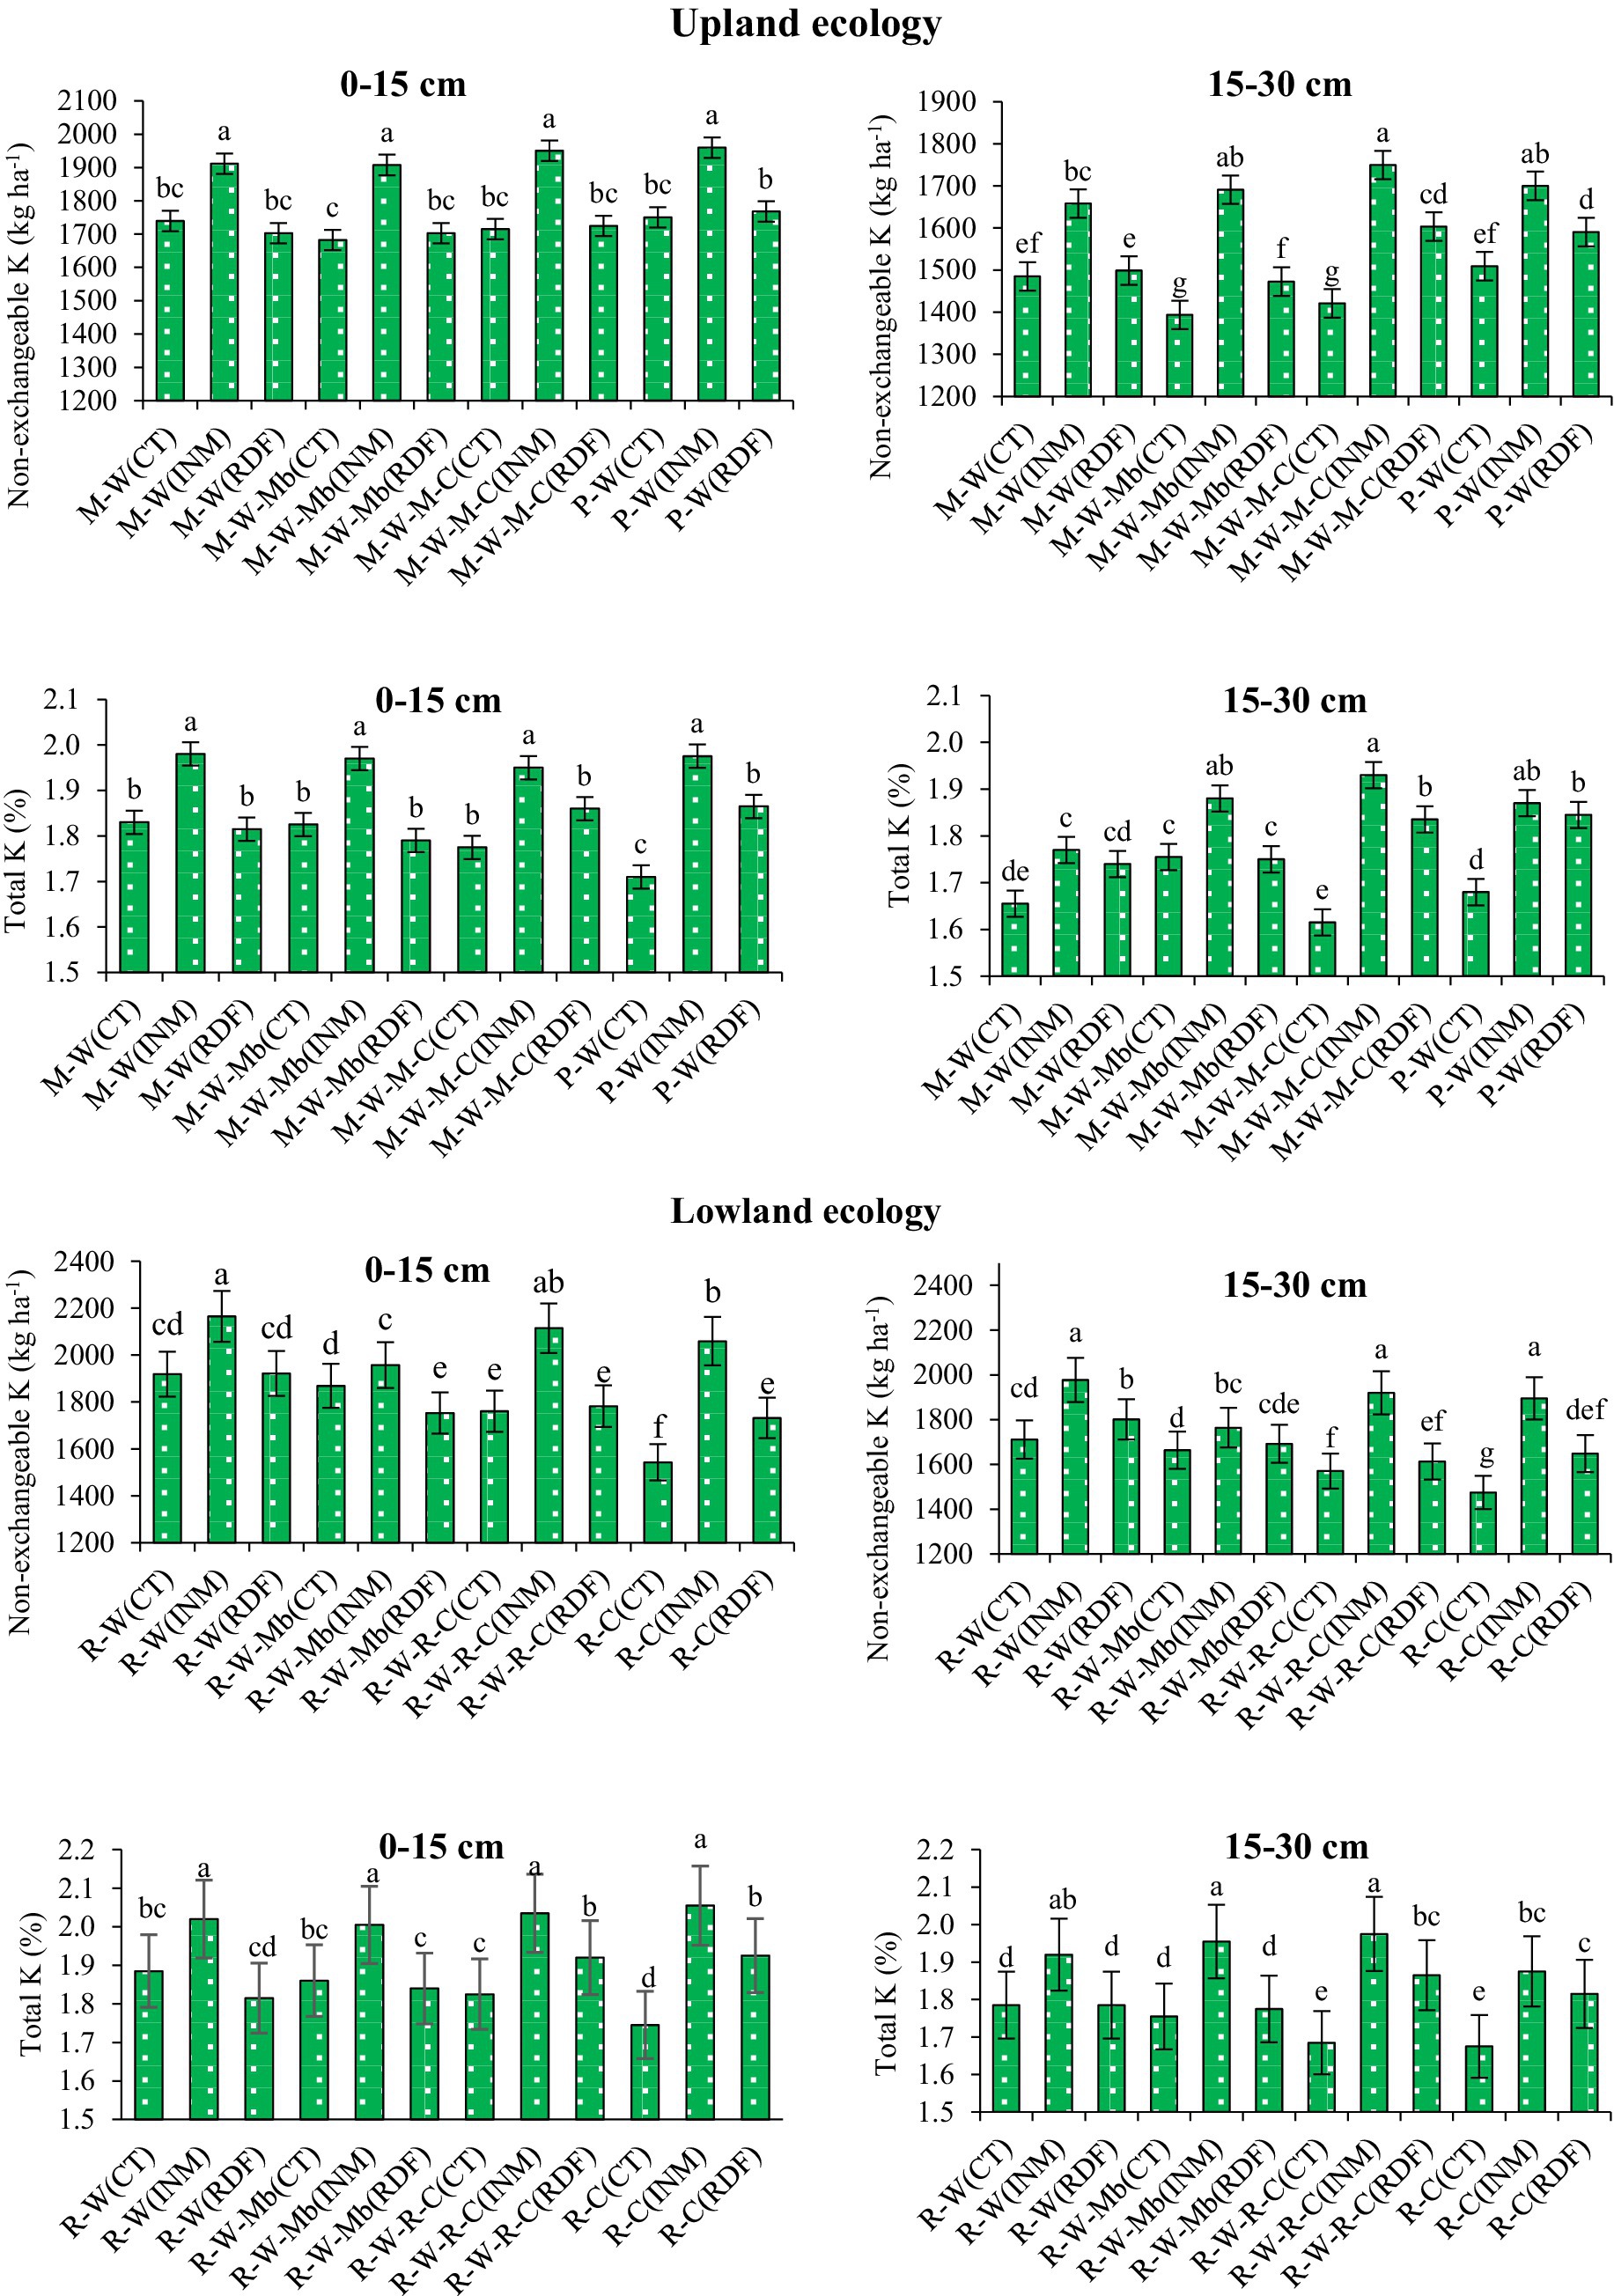
Figure 3. Interactive effect of cropping system and nutrient management (crop management system perspective) on potassium pools such as non-exchangeable K (kg ha−1) and total K (%) at different soil depths of upland ecology and lowland ecology after 14 years. For details of treatment see Figure 1. INM, integrated nutrient management; RDF, recommended chemical fertilization; CT, control. Error bar indicates the standard error of mean; between the bar different lowercase letters (a–g) are significantly different at p < 0.05.
3.4 Depth effect on soil K pools
After 14 years of cropping under different ecologies, soil depth significantly influenced K pools (Table 4). In upland ecology, water soluble K decreased by about 7.6% from 0–15 cm to 15–30 cm depth, while exchangeable K declined by 3.3%, both not statistically significant. However, non-exchangeable K dropped significantly by 12.7%, and total K decreased by 4.3%. In lowland ecology, water soluble K reduced by 13% with depth, exchangeable K decreased sharply by 35%. Non-exchangeable K declined by 8.2%, and total K decreased by 4.2%, both significant. Overall, K availability was higher in topsoil and lowland ecology.
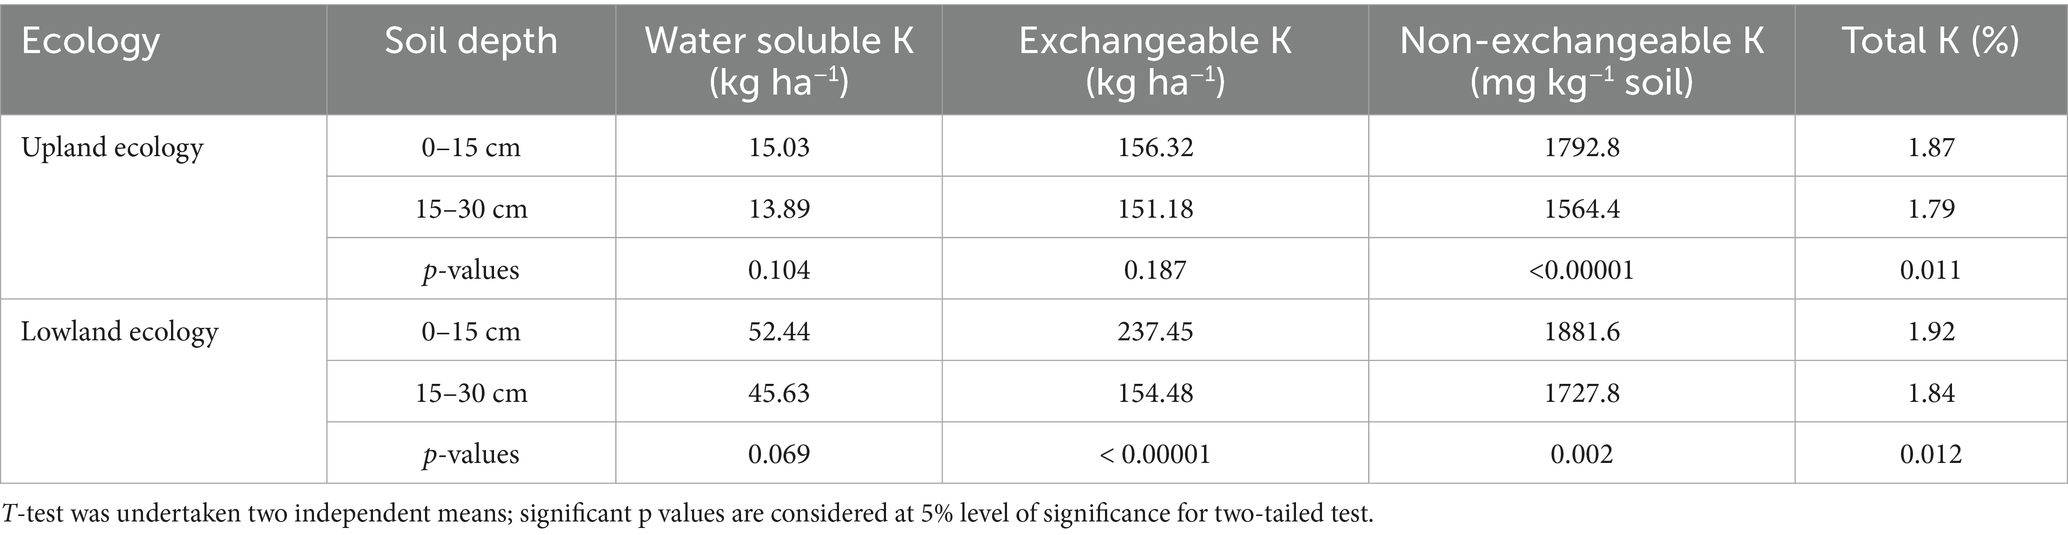
Table 4. Soil depth effect on K pools under different cropping system ecology after 14 years of variable crop rotations and nutrient management.
3.5 Correlation between base crop yields and K pools
In upland ecology, wheat yield showed the strongest correlation with total K (R2 = 0.2417, p = 0.01), followed by exchangeable K (R2 = 0.173, p = 0.02), and water-soluble K (R2 = 0.1834, p = 0.02) (Figure 4). In lowland ecology, rice yield had the highest correlation with total K (R2 = 0.3782, p = 0.001). This was followed by non-exchangeable K (R2 = 0.1761, p = 0.02) and water-soluble K (R2 = 0.1428, p = 0.03), while exchangeable K had a modest effect (R2 = 0.0124, p = 0.30). Heat-map illustrated a clear interaction between cropping systems and nutrient management interaction on soil K pools (Figure 5). Across both upland and lowland ecologies, INM consistently maintained higher levels of all K-fractions, particularly under legume-inclusive systems like maize-wheat-mungbean and rice–wheat–rice–chickpea (Supplementary Figures S2, S3). In contrast, RDF treatments showed markedly reduced K levels. The 0–15 cm soil layer exhibited more pronounced K stratification than the 15–30 cm layer. Overall, INM treatments enhanced K availability, especially in lowland systems with diverse rotations.
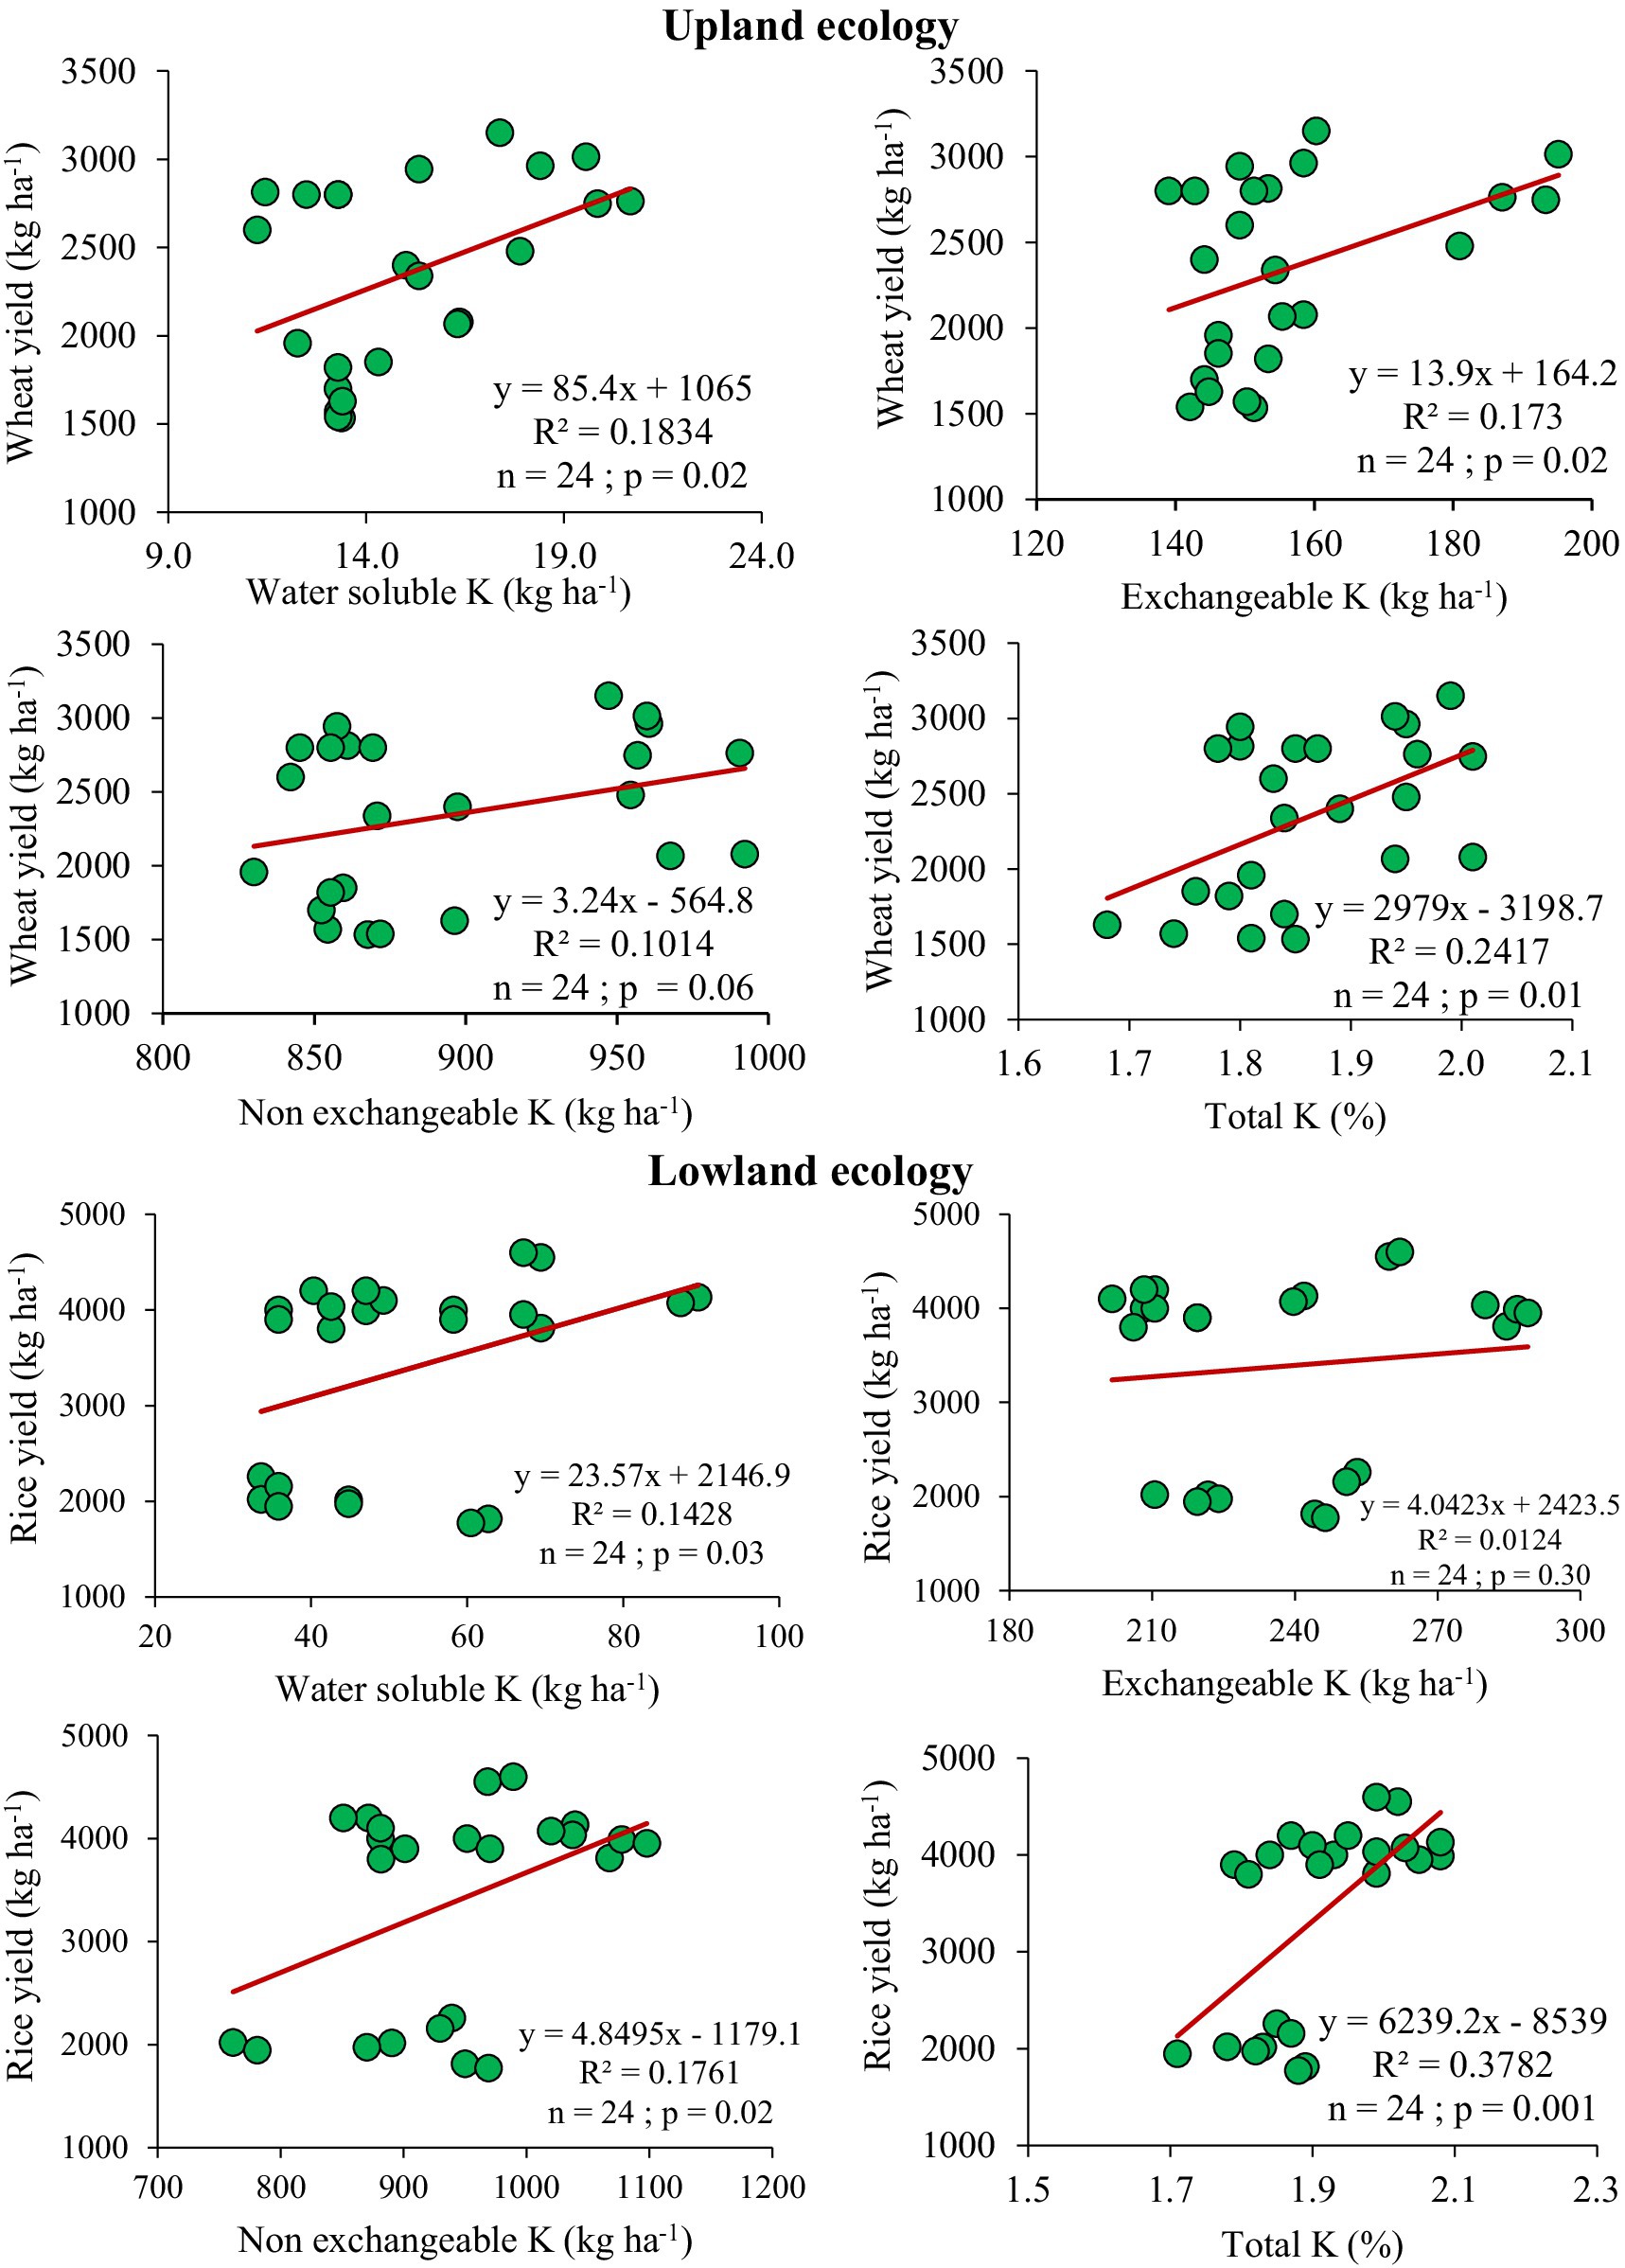
Figure 4. Correlation between base crop grain yield with various K pools at 0–15 cm soil at 14 years of cropping under upland ecology (wheat yield) and lowland ecology (rice yield). n = data points; p values indicates the significance level of correlation for each parameter.
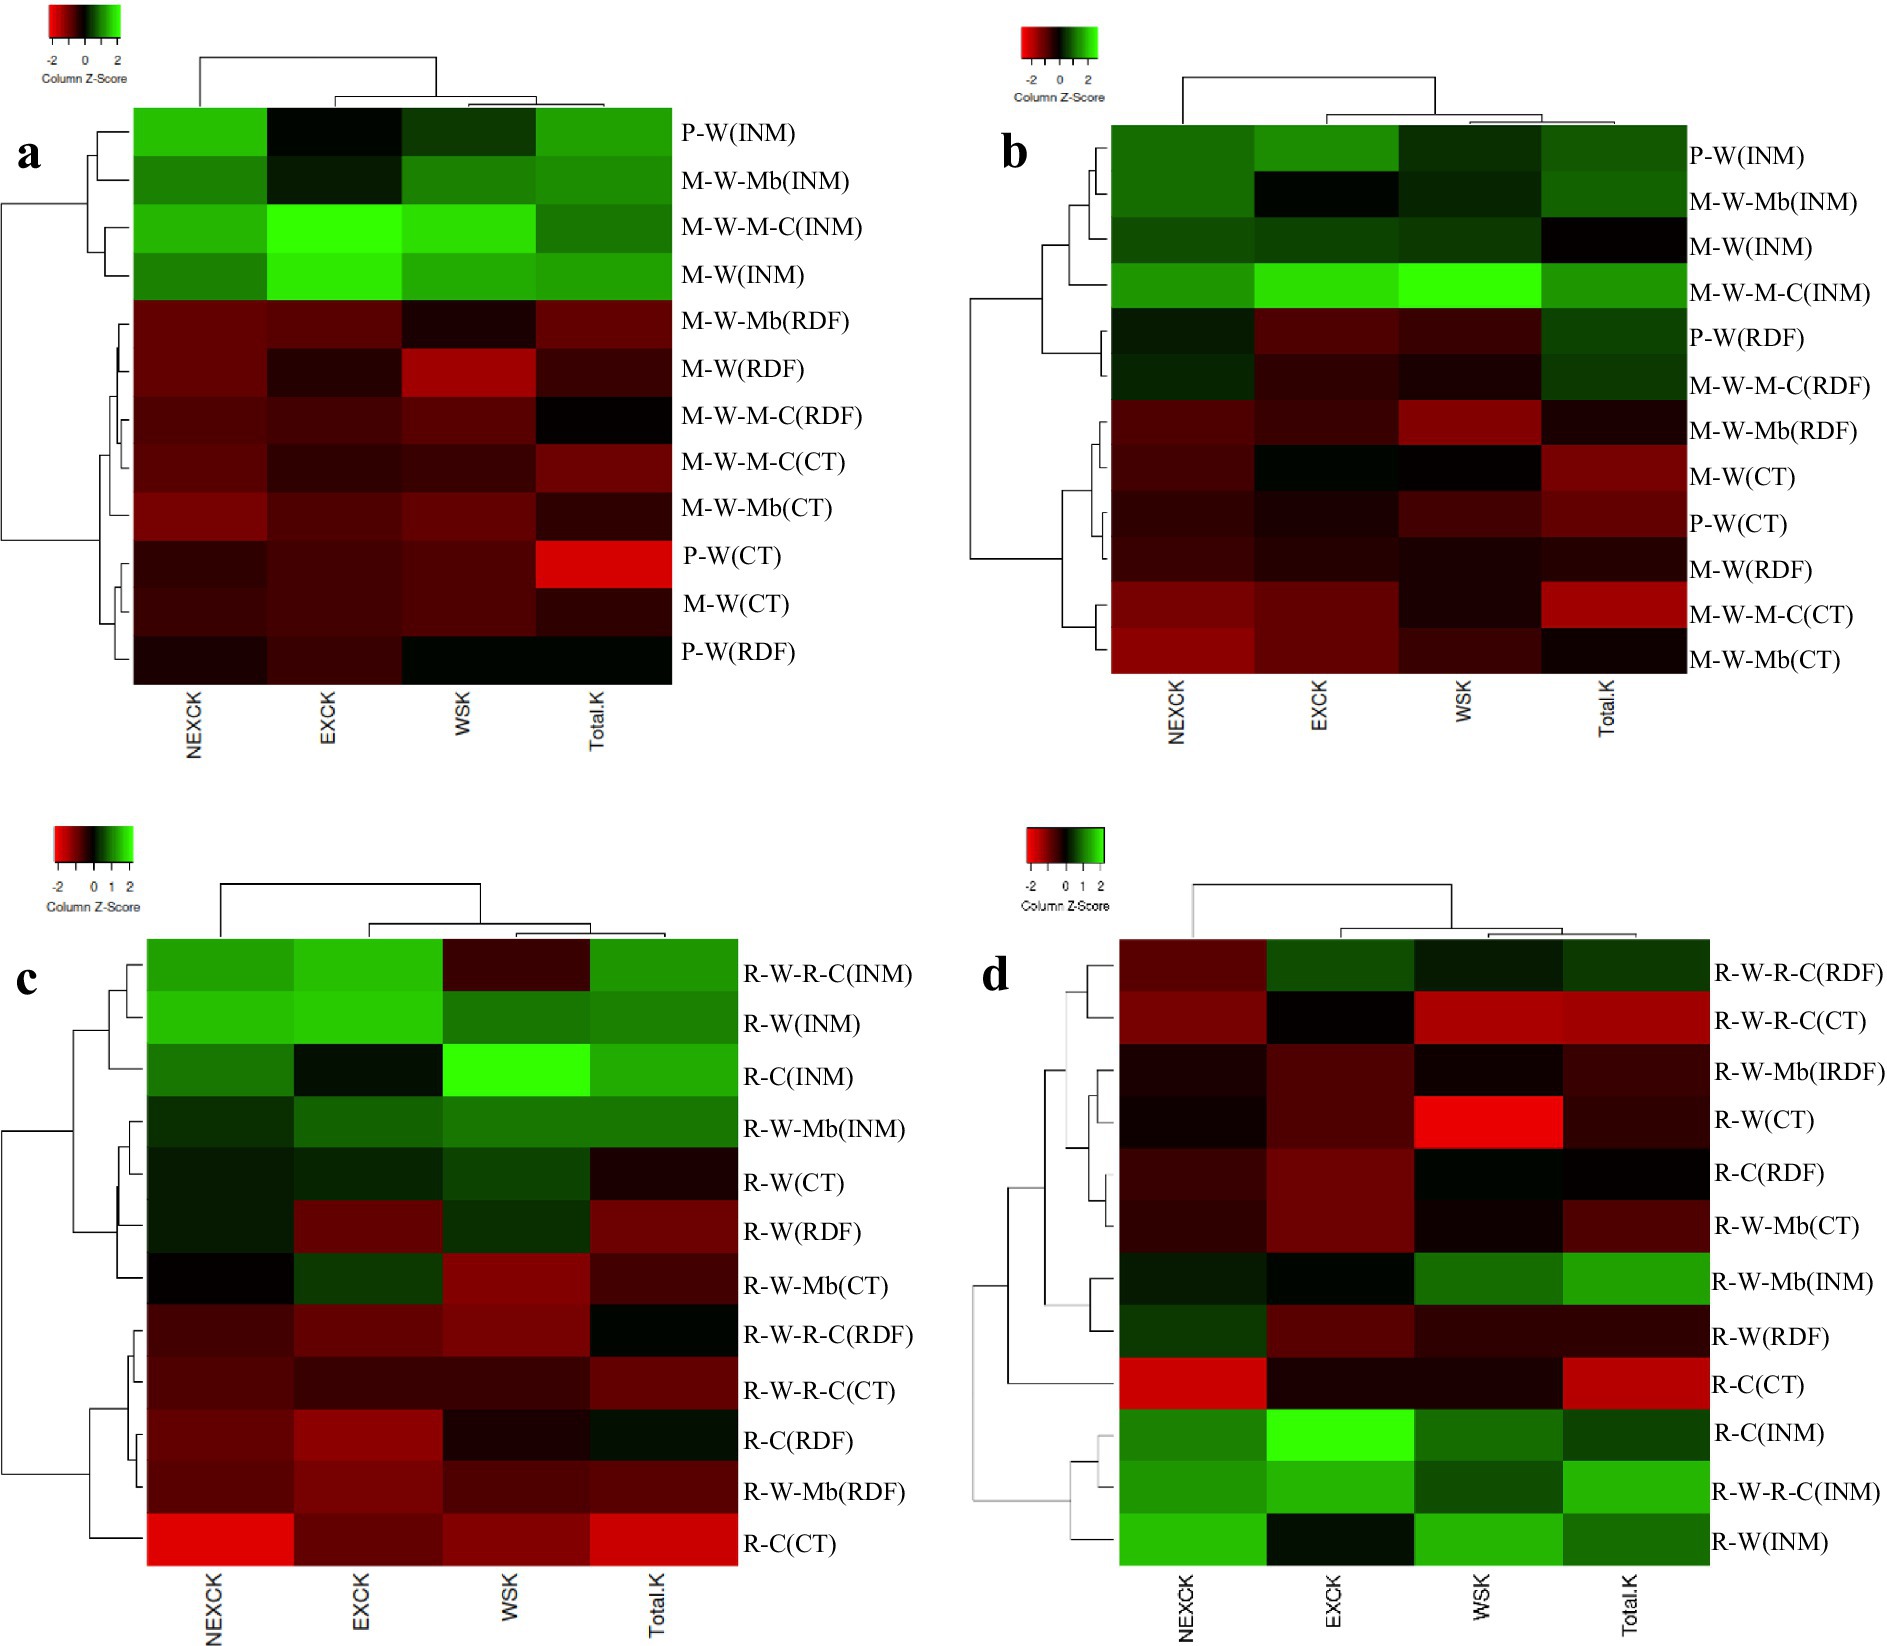
Figure 5. Heatmap depicting the cropping system × nutrient management interaction with different potassium pools under upland ecology at 0–15 cm soil depth (a), upland ecology at 15–30 cm soil depth (b), lowland ecology at 0–15 cm soil depth (c), and lowland ecology at 15–30 cm soil depth after 14 years of cropping (d). For details of treatment see Figure 1. INM, integrated nutrient management; RDF, recommended chemical fertilization; CT, control; WSK, water soluble K; EXCK, exchangeable K; NEXCK, non-exchangeable K.
4 Discussion
Present study provides interactive evidence of crops and nutrient management on dynamics of soil K pools under contrasting ecologies. Among the various fractions, fractions 1 (water-soluble K) and 2 (exchangeable K) sustains immediate plant demand, while fractions 3 (non-exchangeable K) and structural K serves as the slow-release reserve over time and could not serve the purpose within a single season (Buresh et al., 2010).
4.1 Influence of production ecologies on soil K pools
One of the notable findings of this study is the clear advantage of lowland rice ecology in maintaining higher concentrations of all K fractions especially water-soluble K (3–4 times) and exchangeable K (by 52%) in 0–15 cm as favoured by redox state and finer soil texture cm (Sanyal et al., 2014). On the other hand, upland systems showed improved K status when legumes like pigeonpea and chickpea were included, especially under maize–wheat–maize–chickpea and pigeonpea–wheat rotations. Furthermore, ecological characteristics substantially modulate nutrient dynamics, likely due to differences in redox conditions, organic matter turnover, and microbial activity (Dey et al., 2017). However, in the upland soil more aeriation or formation of hydrogen peroxide (H2O2) after rainfall oxidise the structural Fe2+ into Fe3+ resulting decrement of the net negative charge in the crystal surface which ultimately weaken the soil structure and release of K (Bell et al., 2021). Similarly, other important factors like soil organic matter which has higher CEC but does not necessarily indicate higher K retention and leaching of K was significantly higher in well drained, light texture soils with heavy K application (Goulding et al., 2021; Ishfaq et al., 2023). Upland and lowland ecologies more specifically differential moisture regime have profound impact on soil K-dynamics as Zeng and Brown (2000), reported alternate wetting-drying significantly increased K+-fixation due to entrapment of K+ into deeper interlayers from the peripheral surfaces. Cereal-cereal rotations tend to mine more K, especially water-soluble and exchangeable forms, while legume-based systems can enhance exchangeable K but may rely heavily on native reserves (Singh et al., 2014; Sarkar et al., 2014). Such findings underscore the importance of site-specific (cropping system and ecology specific) nutrient management recommendations rather than a one-size-fits-all approach.
4.2 Influence of cropping systems on soil K pools
Different crops grown within a system and their respective soil fertilization methods can influence potassium (K) dynamics (Singh et al., 2014). Indian soils typically contain minerals capable of supplying substantial amounts of K to crops. However, involvement of input intensive crop cultivars insufficient K inputs can lead to significant K mining, creating large negative balances and eventually depleting the native soil K reserves (Tewatia et al., 2017). In lowland rice ecologies, higher K pools were recorded under the rice–wheat system, particularly at a depth of 0–15 cm. Singh et al. (2014) also noted that omitting K fertilization in the rice–wheat system led to the annual depletion of 158–349 kg K ha−1 from soil reserves, highlighting the risk that ongoing insufficient K application could compromise long-term productivity. The superior K availability observed under the rice-wheat rotation compared to rice-wheat-mungbean or rice-wheat-rice-chickpea systems can be attributed to the differential K uptake and residue return patterns inherent to these crops. Rice and wheat residues are excellent source of K upon degradation and Li et al. (2020) underlined straw inclusion along with recommended K dose could restore non-exchangeable K but, did not guarantee rapid jump in available K. Conversely, legume-inclusive rotations might slightly reduce soil available K due to different nutrient uptake dynamics and lower residue K content. Higher K pools were observed under legume-based systems such as rice-wheat-rice-chickpea in 15–30 cm depth than rice-wheat system because of difference in root system architecture. Tap-root/deeper roots in legumes facilitates uptake of more K from the subsoil than shallow/fibrous systems of cereals crops (White, 2013). Not only that, White (2013) listed several important root mediated characters for crops with high K-acquisition efficiency and among which early root vigor and root biomass, higher root biomass and root length density, increasing affinity K-uptake capacity, affinity for K+-transporter protein and formation of root hairs were some of them. Therefore, cereal-legume cropping system could utilize K pools across soil profile and had higher K cycling than cereal-cereal system. Results indicated that pigeonpea inclusion, through mechanisms like deeper root systems, organic matter contribution, and enhanced microbial activity facilitating the weathering of K-bearing minerals ultimately the subsoil K pool (Nath et al., 2023a). Thus, the pigeonpea–wheat system stands out among the pulse-based rotations for enhancing non-exchangeable K especially in the subsoil layer, contributing to long-term soil fertility. However, previous literature by Høgh-Jensen and Pedersen (2003) summarized legumes were inefficient in exploring K from non-exchangeable forms than cereals due to lesser root growth, shorter root: shoot ratio and minuscule root hair formation. Nonetheless, effective planning of nutrient and crop management is essential in cropping systems to prevent nutrient imbalances in the soil. Therefore, cropping system diversification, particularly with legumes viz. pigeonpea–wheat in upland ecology and rice–wheat–rice–chickpea in lowland, showed marked effects on soil K pools in this study.
4.3 Influence of nutrient management practices on soil K pools
Diversified fertilizer management regimes mechanistically regulate the K in soil system (Randive et al., 2021). In present study, INM consistently outperformed the recommended dose of fertilizers for K pools across all systems and soil depths. These improvements can be attributed to the combined effects of organic amendments and balanced fertilization, which enhance soil CEC, buffer nutrient losses, and support microbial-mediated K mineralization (Sanyal et al., 2014). The beneficial impacts of residue incorporation on exchangeable K was due to (i) residue act as insulator preventing soil heat flux, (ii) hinder K leaching through mass-flow, (iii) augment microbial activity via supplying labile C sources, (iv) the decomposed organic residue preferably attached with high valent cations (Al3+, Mg2+ and Ca2+) leaving behind K+ ions in the exchangeable surfaces and further for the crops (Sharma et al., 2023). Residue quality is also an important consideration to ascertain nutrient release kinetics and biochemical characteristics like total C and N in the residue, C: N ratio, lignin: N ratio and (lignin+polyphenol)/N were useful criterion to characterize residue degradation (Partey et al., 2013). Partey et al. (2013) reported among the cations, K has the fastest release rates and K-release from plant residue do not necessarily correlated with residue decomposition as it is not present as an organic form in plant. Potassium release study from three different residue combination showed, maximum K release occurred within 2 weeks of incubation and there was a significant difference between sole maize, Mexican sunflower and faba bean with maximum K-release under mixed residue (maize+ faba bean) (Partey et al., 2013). Laboratory incubation study by Jalali (2011) corroborates similar findings as results highlights released K had positive correlation with residue K content (r = 0.998) and negatively correlated with total C: K ratio of the residue (r = 0.990). While, microorganisms contribute to K availability by organic acid mediated solubilization of soil minerals (mica, illite) or chelating the Si-ion to make a way for the K into solution (Basak et al., 2021; Basak et al., 2017). The clear superiority of INM indicates its potential as a sustainable alternative to sole chemical fertilizer application, which can deplete soil reserves over time. While chemical inputs may improve short-term availability, they often degrade soil health and K balance. Conversely, INM enhances long-term K sustainability by combining chemical, organic, and biofertilizer sources (Hazra et al., 2019). Therefore, K application based on soil available K might misguide external K application recommendation because of the response of plants to a varied dynamic nature of K pools over time (Sanyal et al., 2014).
4.4 Influence of soil depths on soil K pools and correlation with crop yield
Soil depth also played a key role in K stratification. Both ecologies showed a general decline in K availability from 0–15 cm to 15–30 cm depths, with significant reductions in non-exchangeable and total K, particularly in lowland soils. This suggests surface accumulation of nutrients due to limited vertical movement and highlights the need for shallow-rooted crops to capitalize on surface nutrient enrichment (Das et al., 2018). Furthermore, application of fertilisers and crop residues periodically in the soil surface prop up the levels of soil K pools unlike the sub-surface layer (15–30 cm) (Islam et al., 2023). Lastly, the positive correlations between K fractions and crop yields-especially total K with rice (R2 = 0.3782) and wheat (R2 = 0.2417), confirm that reserve K pools contribute to yield stability in long-term systems. These results emphasize the importance of maintaining adequate non-exchangeable and total K to sustain productivity.
4.5 Limitations, future research points and outcome
While the study provides valuable long-term insights, it is constrained by its site-specific nature and limited cropping systems. Broader validation across diverse soil types, climate regimes, and management intensities is needed. Moreover, mineral K reserves (structural K) were not assessed, which could provide a more comprehensive view of total K sustainability. Future strategies should focus on K budgeting, precision K application technologies and enhanced organic inputs (e.g., engineered biochar, compost blends and sewage sludge) to further stabilize the K reserve pool. Also in this particular study, assessment of mineralogical changes under long term cropping practices using X-ray diffraction analysis (XRD) was missing and should be included in the future efforts. Moreover, economics analysis is needed to check the profitability of legume inclusion under long run system.
The scalability of these findings is high, particularly in agro-ecological zones of South Asia, where; resource-poor farmers often face K deficiency due to nutrient mining. The study provides a robust framework for integrating crop and nutrient strategies into location-specific fertilizer recommendations. Specific policy and recommendations which would benefit the farming community are: i) Irrespective of production ecologies it is critical to introduce at least one pulse crop in intensive cereal based system to improve K availability specifically in the IGP ii) in long-run cropping systems like Rice–wheat–rice–chickpea or pigeonpea–wheat, combined with INM, significantly sustains non-exchangeable K pools, prevents mineralogical changes and overall soil quality.
In summary, this study provides strong scientific support for adopting INM and legume-based crop rotations tailored to ecological conditions as a strategy to maintain K sustainability vis-à-vis succour prolonged agricultural productivity. INM combined with legume-based diversified cropping systems significantly enhances K availability across soil depths and ecologies. Overall, this study provides a scientific basis for developing regionally optimized, ecologically aligned, and sustainable potassium management strategies in intensive cropping systems (Supplementary Figure S4).
5 Conclusion
The findings deepen the significance of integrated nutrient management and legume-inclusive rotations in sustaining and enhancing water-soluble, exchangeable, and non-exchangeable K pools, especially under diverse ecologies like upland and lowland systems. The study recommends leveraging lowland ecologies for superior K retention and availability, supported by legume-inclusive cropping systems. Systems like rice–wheat–rice–chickpea or pigeonpea–wheat, combined with INM, significantly improve K pools and should be promoted in the intensive cereal based systems in the IGP. Thus, legume-based cropping systems proved superior to improve K cycling and long-term soil health. INM significantly boosted all K fractions across depths, outperforming conventional recommended dose of fertilizers. It is suggested to tailor K management to ecological contexts focusing on management practices in upland areas and capitalize on high K availability in lowlands. These findings point toward the critical role of organic amendments and balanced fertilization in improving soil K availability and buffering capacity. It is also recommended to monitor K stratification across soil depths and adjust nutrient input methods (such as banding, split application) for surface-enriched soils. Lastly, such studies shall be advocated in the other soil types, considering other locally available organic amendments and in other grain legumes for wider adaptability and sustainability.
Data availability statement
The original contributions presented in the study are included in the article/Supplementary material, further inquiries can be directed to the corresponding authors.
Author contributions
CPN: Data curation, Writing – original draft, Conceptualization, Supervision, Investigation. AD: Data curation, Investigation, Conceptualization, Writing – original draft. KKH: Conceptualization, Writing – review & editing, Supervision. NK: Writing – review & editing, Supervision. CSP: Writing – review & editing, Investigation. MK: Writing – original draft. MH: Writing – review & editing. GPD: Writing – review & editing.
Funding
The author(s) declare that financial support was received for the research and/or publication of this article. The authors convey sincere gratitude towards ICAR-IIPR, Kanpur for funding related to research activities.
Conflict of interest
The authors declare that the research was conducted in the absence of any commercial or financial relationships that could be construed as a potential conflict of interest.
The author(s) declared that they were an editorial board member of Frontiers, at the time of submission. This had no impact on the peer review process and the final decision.
Generative AI statement
The authors declare that no Gen AI was used in the creation of this manuscript.
Any alternative text (alt text) provided alongside figures in this article has been generated by Frontiers with the support of artificial intelligence and reasonable efforts have been made to ensure accuracy, including review by the authors wherever possible. If you identify any issues, please contact us.
Publisher’s note
All claims expressed in this article are solely those of the authors and do not necessarily represent those of their affiliated organizations, or those of the publisher, the editors and the reviewers. Any product that may be evaluated in this article, or claim that may be made by its manufacturer, is not guaranteed or endorsed by the publisher.
Supplementary material
The Supplementary material for this article can be found online at: https://www.frontiersin.org/articles/10.3389/fsufs.2025.1660079/full#supplementary-material
References
Basak, B. B., Saha, A., Sarkar, B., Kumar, B. P., Gajbhiye, N. A., and Banerjee, A. (2021). Repurposing distillation waste biomass and low-value mineral resources through biochar-mineral-complex for sustainable production of high-value medicinal plants and soil quality improvement. Sci. Total Environ. 760:143319. doi: 10.1016/j.scitotenv.2020.143319
Basak, B. B., Sarkar, B., Biswas, D. R., Sarkar, S., Sanderson, P., and Naidu, R. (2017). Bio-intervention of naturally occurring silicate minerals for alternative source of potassium: challenges and opportunities. Adv. Agron. 141, 115–145. doi: 10.1016/bs.agron.2016.10.016
Bell, M. J., Mallarino, A. P., and Volenec, J. (2021). “Considerations for selecting potassium placement methods in soil” in Improving potassium recommendations for agricultural crops. ed. T. S. Murrell (Cham: Springer), 341–363.
Borase, D. N., Nath, C. P., Hazra, K. K., Senthilkumar, M., Singh, S. S., Praharaj, C. S., et al. (2020). Long-term impact of diversified crop rotations and nutrient management practices on soil microbial functions and soil enzymes activity. Ecol. Indic. 114:106322. doi: 10.1016/j.ecolind.2020.106322
Buresh, R. J., Pampolino, M. F., and Witt, C. (2010). Field-specific potassium and phosphorus balances and fertilizer requirements for irrigated rice-based cropping systems. Plant Soil 335, 35–64. doi: 10.1007/s11104-010-0441-z
Das, T. K., Nath, C. P., Das, S., Biswas, S., Bhattacharyya, R., Sudhishri, S., et al. (2020). Conservation agriculture in rice-mustard cropping system for five years: impacts on crop productivity, profitability, water-use efficiency, and soil properties. Field Crop Res. 250:107781. doi: 10.1016/j.fcr.2020.107781
Das, D., Nayak, A. K., Thilagam, V. K., Chatterjee, D., Shahid, M., Tripathi, R., et al. (2018). Measuring potassium fractions is not sufficient to assess the long-term impact of fertilization and manuring on soil’s potassium supplying capacity. J. Soils Sedi. 18, 1806–1820. doi: 10.1007/s11368-018-1922-6
Das, D., Sahoo, J., Raza, M. B., Barman, M., and Das, R. (2022). Ongoing soil potassium depletion under intensive cropping in India and probable mitigation strategies. A review. Agron. Sust. Develop. 42, 1–26. doi: 10.1007/s13593-021-00728-6
Dey, P., Santhi, R., Maragatham, S., and Sellamuthu, K. M. (2017). Status of phosphorus and potassium in the Indian soils Vis-à-Vis world soils. Ind. J. Fert. 13, 44–59.
Drescher, A., Glaser, R., Richert, C., and Nippes, K.R. (2011). Demand for key nutrients (NPK) in the year. Available online at: https://esdac.jrc.ec.europa.eu/projects/NPK/Documents/Freiburg_Demand_for_key_nutrients_in_2050_Drescher.pdf (accessed May 25, 2025).
FAO (2017). The future of food and agriculture trends and challenges. Rome: Food and Agriculture Organization of the United Nations.
Gami, S., Ladha, J., Pathak, H., Shah, M., Pasuquin, E., Pandey, S., et al. (2001). Long-term changes in yield and soil fertility in a twenty-year rice-wheat experiment in Nepal. Biol. Fert. Soils 34, 73–78. doi: 10.1007/s003740100377
Goulding, K., Murrell, T. S., Mikkelsen, R. L., Rosolem, C., Johnston, J., Wang, H., et al. (2021). “Outputs: potassium losses from agricultural systems” in Improving potassium recommendations for agricultural crops. ed. T. S. Murrell (Cham: Springer), 75–93.
Hanway, J. J., and Heidel, H. (1952). Soil analysis methods as used in Iowa state college soil testing laboratory. Iowa Agric. 57, 1–13.
Hazra, K. K., Nath, C. P., Singh, U., Praharaj, C. S., Kumar, N., Singh, S. S., et al. (2019). Diversification of maize-wheat cropping system with legumes and integrated nutrient management increases soil aggregation and carbon sequestration. Geoderma 353, 308–319. doi: 10.1016/j.geoderma.2019.06.039
Høgh-Jensen, H., and Pedersen, M. B. (2003). Morphological plasticity by crop plants and their potassium use efficiency. J. Plant Nutr. 26, 969–984. doi: 10.1081/PLN-120020069
IBM (2020). Indian minerals yearbook 2019 (part- III: mineral reviews) 58th Edition. Nagpur: Ministry of Mines Govt. of India, Indian Bureau of Mines.
Ishfaq, M., Wang, Y., Xu, J., Hassan, M. U., Yuan, H., Liu, L., et al. (2023). Improvement of nutritional quality of food crops with fertilizer: a global meta-analysis. Agron. Sustain. Dev. 43:74. doi: 10.1007/s13593-023-00923-7
Islam, M. J., Cheng, M., Kumar, U., Maniruzzaman, M., Nasreen, S. S., Haque, M. E., et al. (2023). Conservation agriculture in intensive rice cropping reverses soil potassium depletion. Nutr. Cycl. Agroecosyst. 125, 437–451. doi: 10.1007/s10705-023-10261-5
Jalali, M. (2011). Comparison of potassium release of organic residues in five calcareous soils of western Iran in laboratory incubation test. Arid Land Res. Manag. 25, 101–115. doi: 10.1080/15324982.2011.554957
Kinekar, B. K. (2011). Potassium fertilizer situation in India: current use and perspectives. Kar. J. Agric. Sci. 24, 1–6.
Kumar, G., Kumari, R., Shambhavi, S., Kumar, S., Kumari, P., and Padbhushan, R. (2022). Eight-year continuous tillage practice impacts soil properties and forms of potassium under maize-based cropping systems in inceptisols of eastern India. Commun. Soil Sci. Plant Anal. 53, 602–621. doi: 10.1080/00103624.2021.2017961
Lalitha, M., and Dhakshinamoorthy, M. (2014). Forms of soil potassium-a review. Agric. Rev. 35, 64–68. doi: 10.5958/j.0976-0741.35.1.008
Li, X., Li, Y., Wu, T., Qu, C., Ning, P., Shi, J., et al. (2020). Potassium fertilization combined with crop straw incorporation alters soil potassium fractions and availability in Northwest China: an incubation study. PLoS One 15:e0236634. doi: 10.1371/journal.pone.0236634
Mohapatra, S., Rout, K. K., Khanda, C., Mishra, A., Yadav, S., Padbhushan, R., et al. (2025). Impact of potassium management on soil dynamics and crop uptake in rice systems. Front. Sustain. Food Syst. 9:1453311. doi: 10.3389/fsufs.2025.1453311
Nath, C. P., Dutta, A., Hazra, K. K., Praharaj, C. S., Kumar, N., Singh, S. S., et al. (2023a). Long-term impact of pulses and organic amendments inclusion in cropping system on soil physical and chemical properties. Sci. Rep. 13:6508. doi: 10.1038/s41598-023-33255-3
Nath, C. P., Hazra, K. K., Kumar, N., Praharaj, C. S., Singh, S. S., and Singh, U. (2019). Including grain legume in rice–wheat cropping system improves soil organic carbon pools over time. Ecol. Eng. 129, 144–153. doi: 10.1016/j.ecoleng.2019.02.004
Nath, C. P., Hazra, K. K., Kumar, N., Singh, S. S., Praharaj, C. S., Singh, U., et al. (2022). Impact of crop rotation with chemical and organic fertilization on weed seed density, species diversity, and community structure after 13 years. Crop Prot. 153:105860. doi: 10.1016/j.cropro.2021.105860
Nath, C. P., Kumar, N., Dutta, A., Hazra, K. K., Praharaj, C. S., and Singh, S. S. (2023b). Pulse crop and organic amendments in cropping system improve soil quality in rice ecology: evidence from a long–term experiment of 16 years. Geoderma 430:116334. doi: 10.1016/j.geoderma.2023.116334
Partey, S. T., Preziosi, R. F., and Robson, G. D. (2013). Maize residue interaction with high quality organic materials: effects on decomposition and nutrient release dynamics. Agric. Res. 2, 58–67. doi: 10.1007/s40003-013-0051-0
Pratt, J. W. (1965). Bayesian interpretation of standard inference statements. J. Royal Stat. Soc. Series B (Methodological) 27, 169–203.
Raj, R., Kumar, A., Solanki, I. S., Dhar, S., Dass, A., Gupta, A. K., et al. (2017). Influence of crop establishment methods on yield, economics and water productivity of rice cultivars under upland and lowland production ecologies of eastern indo-Gangetic Plains. Paddy Water Environ. 15, 861–877. doi: 10.1007/s10333-017-0598-7
Randive, K., Raut, T., and Jawadand, S. (2021). An overview of the global fertilizer trends and India’s position in 2020. Miner. Econ. 34, 371–384. doi: 10.1007/s13563-020-00246-z
Rawat, J., Pandey, N., and Saxena, J. (2022). “Role of potassium in plant photosynthesis, transport, growth and yield” in Role of potassium in abiotic stress. eds. N. Iqbal and S. Umar (Singapore: Springer).
Sanyal, S. K., Majumdar, K., and Singh, V. K. (2014). Nutrient management in Indian agriculture with special reference to nutrient mining—a relook. J. Indian Soc. Soil Sci. 62, 307–325.
Sarkar, G. K., Debnath, A., Chattopadhyay, A. P., and Sanyal, S. K. (2014). Depletion of soil potassium under exhaustive cropping in Inceptisol and Alfisol. Commun. Soil Sci. Plant Anal. 45, 61–72. doi: 10.1080/00103624.2013.848880
Sharma, S., Singh, P., Ali, H. M., Siddiqui, M. H., and Iqbal, J. (2023). Tillage, green manuring and crop residue management impacts on crop productivity, potassium use efficiency and potassium fractions under rice-wheat system. Heliyon 9:e17828. doi: 10.1016/j.heliyon.2023.e17828
Singh, V. K., Dwivedi, B. S., Tiwari, K. N., Majumdar, K., Rani, M., Singh, S. K., et al. (2014). Optimizing nutrient management strategies for rice–wheat system in the indo-Gangetic Plains of India and adjacent region for higher productivity, nutrient use efficiency and profits. Field Crop Res. 164, 30–44. doi: 10.1016/j.fcr.2014.05.007
Singh, B., and Sapkota, T. B. (2025). Fertiliser policies in ensuring food security and emerging issues in India. Ind. J. Fert. 21, 616–636.
Srivastava, A. K., Das, S. N., Malhotra, S. K., and Majumdar, K. (2014). SSNM-based rationale of fertilizer use in perennial crops: a review. Ind. J. Agric. Sci. 84, 3–17. doi: 10.56093/ijas.v84i1.37139
Tewatia, R. K., Rattan, R. K., Bhende, S., and Kumar, L. (2017). Nutrient use and balances in India with special reference to phosphorus and potassium. Ind. J. Fert. 13, 20–29.
Wang, Y., and Wu, W. H. (2015). Genetic approaches for improvement of the crop potassium acquisition and utilization efficiency. Curr. Opin. Plant Biol. 25, 46–52. doi: 10.1016/j.pbi.2015.04.007
Wang, M., Zheng, Q., Shen, Q., and Guo, S. (2013). The critical role of potassium in plant stress response. Int. J. Mol. Sci. 14, 7370–7390. doi: 10.3390/ijms14047370
White, P. J. (2013). Improving potassium acquisition and utilisation by crop plants. J. Plant Nutr. Soil Sci. 176, 305–316. doi: 10.1002/jpln.201200121
White, K. E., Cavigelli, M. A., and Bagley, G. (2021). Legumes and nutrient management improve phosphorus and potassium balances in long-term crop rotations. Agron. J. 113, 2681–2697. doi: 10.1002/agj2.20651
Wood, L. K., and DeTurk, E. E. (1941). The absorption of potassium in soils in non-replaceable forms. Soil Sci. Soc. Am. J. 5, 152–161. doi: 10.2136/sssaj1941.036159950005000C0026x
Keywords: cereal–legume rotations, integrated nutrient management, potassium stratification, total potassium, upland and lowland ecology
Citation: Nath CP, Dutta A, Hazra KK, Kumar N, Praharaj CS, Kumar M, Hashim M and Dixit GP (2025) Influence of legume diversification and fertilization on soil potassium pools under distinct cropping system ecologies: insight from 14-years study. Front. Sustain. Food Syst. 9:1660079. doi: 10.3389/fsufs.2025.1660079
Edited by:
Dinesh Jinger, Indian Institute of Soil and Water Conservation (ICAR), IndiaReviewed by:
Manoj Parihar, ICAR-Vivekananda Parvatiya Krishi Anusandhan Sansthan, IndiaMuhammad Ishfaq, Shenzhen University, China
Abhik Patra, Dr. Rajendra Prasad Central Agricultural University, India
Copyright © 2025 Nath, Dutta, Hazra, Kumar, Praharaj, Kumar, Hashim and Dixit. This is an open-access article distributed under the terms of the Creative Commons Attribution License (CC BY). The use, distribution or reproduction in other forums is permitted, provided the original author(s) and the copyright owner(s) are credited and that the original publication in this journal is cited, in accordance with accepted academic practice. No use, distribution or reproduction is permitted which does not comply with these terms.
*Correspondence: Chaitanya Prasad Nath, Y3BuYXRoNEBnbWFpbC5jb20=; Asik Dutta, YXNpa2R1dHRhOTc1QGdtYWlsLmNvbQ==; Narendra Kumar, bmt1bWFyLmljYXJAZ21haWwuY29t