 Yue Li1
 Zhong Wang
- 1School of Mathematical Sciences, Chengdu University of Technology, Chengdu, China
- 2Geomathematics Key Laboratory of Sichuan Province, Chengdu University of Technology, Chengdu, China
- 3College of Computer Science and Cyber Security (Oxford Brookes College), Chengdu University of Technology, Chengdu, China
Introduction: Within the context of “dual carbon,” exploring the characteristics of the spatial network structure of regional agricultural carbon emission reduction capacity (ACERC) is beneficial to improve regional sustainable development capacity.
Methods: Taking Sichuan Province as the case area, this research evaluates the regional ACERC and analyzes its spatial and temporal evolution characteristics by collecting agricultural-related data from 2010 to 2021 from all cities in Sichuan Province using the EWM-TOPSIS model. Combined with the modified gravity model, this paper investigates the spatial correlation strength of regional ACERC. Then, using social network analysis (SNA), the spatial network structure and its formation mechanism are explored.
Results and discussion: The research findings indicate that: (1) The ACERC of most cities in Sichuan shows a declining trend, with distinct regional clustering characteristics. The spatial effects of ACERC have transcended geographical proximity to form a complex spatial network. (2) The spatial network structure of ACERC in Sichuan exhibits strong connectivity and a loosening hierarchical structure, but network stability is declining. (3) Cities such as Neijiang, Zigong, and Mianyang occupy central positions within the network, playing the role of central actors. (4) Differences in information-level, rural residents’ income, government importance, and agricultural labor force contribute to the formation of the spatial association network of ACERC. The findings of this study can assist decision-makers in identifying the interconnections and formation mechanisms of ACERC among cities, providing a reference basis for agricultural regional collaborative carbon emission reduction measures.
1 Introduction
Global warming is one of the most serious challenges facing humanity at present, and the multiple hazards to food, water resources and ecological security brought about by climate warming seriously threaten humanity’s survival (Zhou et al., 2024; Toor et al., 2024). As one of the main drivers to climate warming, carbon emissions are now the focus of environmental regulation, and reducing carbon emissions has become a key worldwide concern (Xu et al., 2023; Shen and Wang, 2023). According to “The National Strategy for Adaptation to Climate Change 2035,” China’s average temperature has continued to rise from 1951 to 2020, by an average of 0.26 °C each decade, which has exceeded the world’s average rate of increase. To this end, the Chinese government has made several attempts and proposed a phased approach to achieving the “dual-carbon” target (Zhu et al., 2024). However, this ambitious goal faces significant challenges in the agriculture sector. Agriculture is the world’s second largest source of carbon emissions after industry, with carbon dioxide emissions from agricultural production activities accounting for between 20 and 35 per cent of agricultural greenhouse gas emissions (Frank et al., 2019). China is a large agricultural country and has always relied on agriculture to support its national economy, with agricultural carbon emissions accounting for 17% of total carbon emissions (Liu et al., 2021). According to the data released by the Food and Organization of the United Nations (Figure 1), in 2021, China’s agricultural carbon emissions are 1,322 million tons, an increase of approximately 211 million tons from 2010, showing an upward trend with an average annual growth rate of approximately 1.6%. The majority of carbon emissions from agriculture are generated by agricultural material inputs, agricultural energy consumption, and agricultural plowing, and so on. The extensiveness and universality of agricultural activities make it impossible to avoid agricultural carbon emissions. Improving the utilization rate of agricultural resources, reducing energy consumption, and enhancing ACERC are all efficient ways to achieve low-carbon development in agriculture.
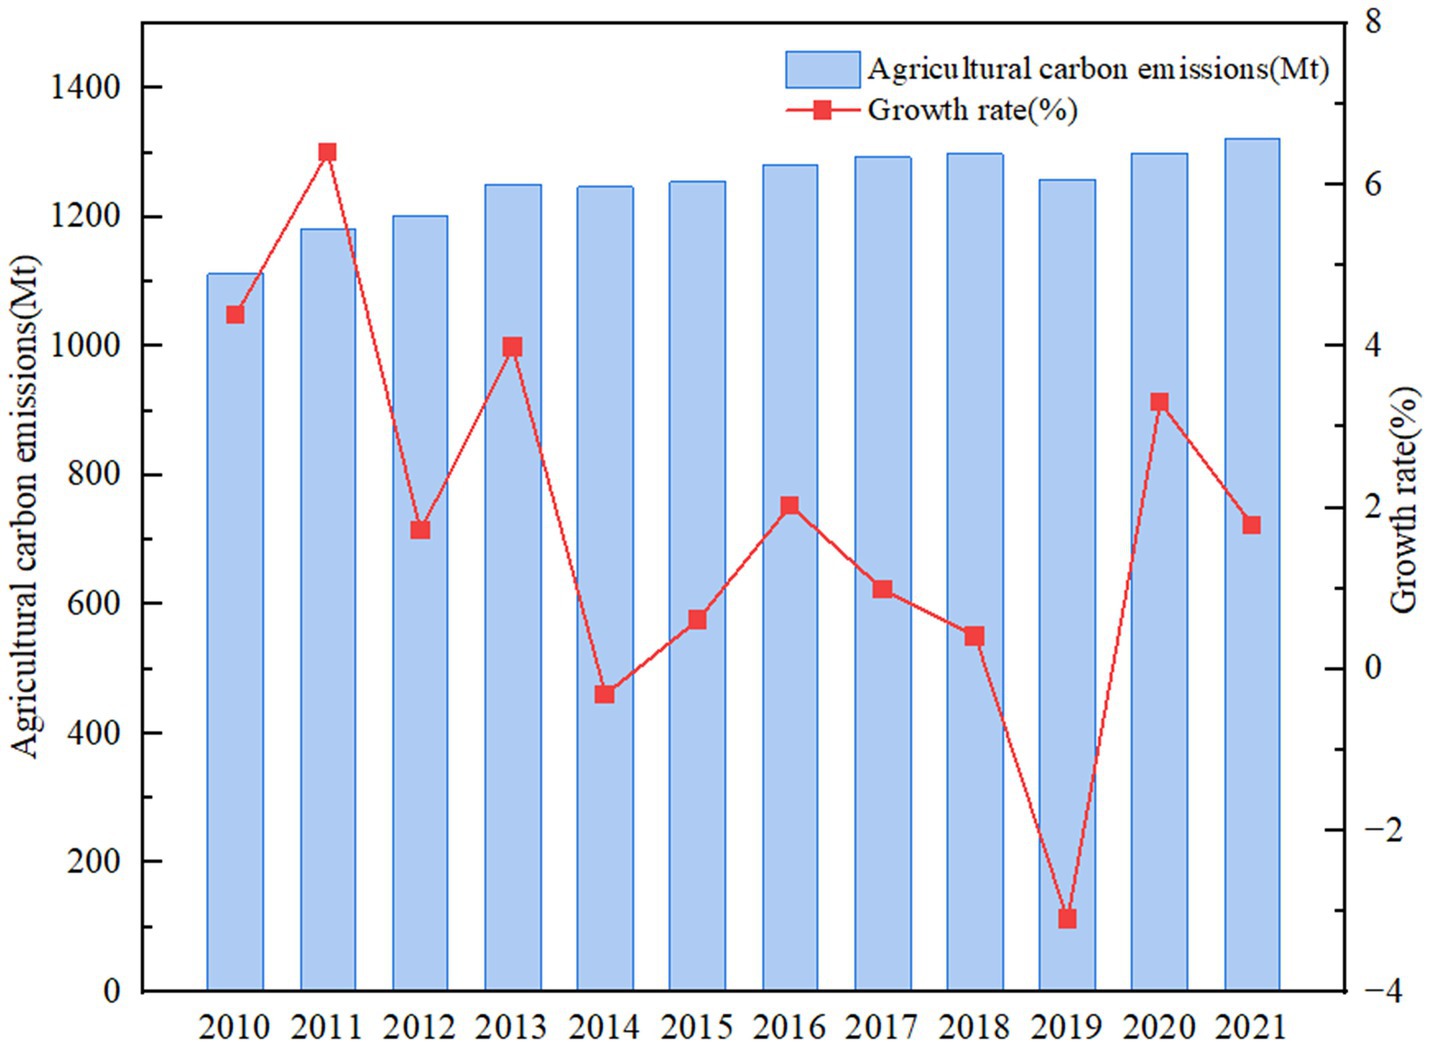
Figure 1. China’s agricultural carbon emissions and growth rate from 2010 to 2021.
“Ability to reduce emissions” refers to the level of social development, political support, economic structure and technology that enables effective carbon emission reductions (IPCC, 2007). Promoting ACER is a critical link in the overall emission reduction aim (Huan et al., 2025), and its success directly influences the achievement of the dual-control carbon reduction target. Consequently, researchers have developed methods to quantify ACERC, which generally fall into three categories: (1) Characterizing the ACERC by assessing the efficiency of agricultural carbon emissions using DEA; (2) Calculating a carbon emission reduction potential index to measure the ACERC while keeping equity and efficiency in mind; (3) Constructing an evaluation index system to quantify the ACERC. However, economic, energy, industrial structure, efficiency, and demographic (Shi and Chang, 2023; Huang X. et al., 2024; Wei and Chen, 2024; Li and Gao, 2024) all have an impact on the ACERC. The first two methods use a single indicator to characterize the ACERC, neglecting the impact of other multidimensional variables. There are few studies that use multidimensional indicators to measure the ACERC, with most concentrating on low-carbon agriculture (Song and Dou, 2024), agricultural carbon peaking (Xu et al., 2022), and agricultural carbon neutrality (Chen et al., 2024). In addition, some scholars have further explored the spatial pattern of agricultural carbon emission reduction (Hou M. Y. et al., 2024), spatial distribution characteristics (Ye et al., 2024) and so on. A large number of studies have shown that agricultural carbon emission reduction presents obvious regional differences. However, the study of regional agricultural carbon emission reduction should not be limited to the differences in spatial distribution, but should also further consider its spatial correlation.
The spatial correlation of ACERC refers to the spatial influence of ACERC in different regions through exchanges and other forms. Exchanges and collaboration between cities have increased in frequency as interregional cooperative development has deepened (Zhang X. et al., 2024; Huang H. et al., 2024). The spatial correlation is not only reflected in the economy, but also in the agricultural carbon emissions. It has been demonstrated that agricultural carbon emissions exhibit a spatial association, mostly due to production factors and technology (Wang et al., 2024). Agriculture in many locations has been driven to intense and large-scale production as a result of market demand, economic development, and government guidance, leading in agricultural industry agglomeration (Wang H. et al., 2023). On the one hand, large-scale, centralized operations can lower carbon emissions by improving crop cultivation, optimizing industrial structure, and sensibly allocating and using agricultural resources. On the other hand, agricultural industrial agglomeration may promote information exchange and technical innovation. In agricultural cluster areas, advanced technology is easier to implement, and new technologies can reduce greenhouse gas emissions during production while increasing the efficiency of agricultural production resources (Zhang S. et al., 2024). In order to lower agricultural greenhouse gas emissions, cities in the agglomeration area compete to introduce technologies from the technology demonstration area. This encourages the spatial spillover effect of agricultural resource elements and provides a pathway for the development of the spatial correlations in the ACERC. Additionally, cities in an area would be subject to comparable environmental regulations, and their approaches to reducing carbon emissions would coincide, leading to “emission reduction imitation” or “emission reduction confrontation” (He et al., 2022). The development of synergistic carbon emission reduction among areas will reinforce the construction of the geographical correlation of ACERC, in addition to the coordinated deployment of higher-level governments. The interaction of the ACERC is not only limited to the neighboring regions, but also exceeds the geographic boundaries to achieve inter-regional interaction. Therefore, the study of ACERC should also consider its spatial correlation, in order to explore the new characteristics of the ACERC under the regional synergistic development.
With regard to the spatial relevance of the ACERC, some scholars have revealed the spatial spillover effect of the ACERC based on exploratory spatial analysis methods and spatial measurement models (He et al., 2021). However, most of these studies are based on the geographical proximity perspective, which lacks a holistic approach, does not take into account the possible impacts of ‘non-neighboring’ areas, and is limited to ‘attribute data’, with obvious regional limitations (Gao and Gao, 2024; Cheng et al., 2024). In response, some scholars have introduced SNA. SNA is an interdisciplinary analysis method that uses mathematical methods and graph theory tools to explore the impact of relationship results on structural composition or the whole from the perspective of ‘relationship’ (Benítez-Andrades et al., 2020), and it can achieve quantitative analysis of complex network relationships between nodes based on ‘relational data’. The quantitative analysis of complex network relationships between nodes can be achieved based on ‘relational data’, which is now widely used in the fields of economy, tourism, carbon emission, environmental pollution, etc. (Liu P. et al., 2023; Tan et al., 2024; Shi et al., 2024; Chen et al., 2023). Relevant studies have analyzed the spatial network characteristics of carbon emissions or carbon emission efficiency from the perspectives of overall network characteristics, individual network characteristics, and the block model by building a carbon emission or carbon emission efficiency correlation matrix (Huang H. et al., 2024; Sun et al., 2024). On this basis, some scholars have investigated the driving factors of spatial correlation networks, such as economic level, spatial distance, technological level, urbanization, and population size (Ji and Zhang, 2023; Zhang Z. et al., 2024), providing a theoretical foundation for the research of ACERC’s spatial correlation network characteristics.
In summary, there are some limitations in the existing studies. In the context of regional development strategy, there is an urgent need to analyze the spatial correlation of ACERC based on the perspective of complex network and breaking through the limitation of geographical proximity. In terms of ACERC, the existing literature is limited to the use of a single indicator to measure the ACERC, and ignores the spatial correlation of ACERC. In view of this, this research takes Sichuan Province as the research object. Based on EWM-TOPSIS, we measure the ACERC in Sichuan Province from 2010 to 2021. The modified gravity model and SNA are then utilized to investigate the spatial structure of ACERC in Sichuan, clarify the correlation effect and interaction mechanism of ACERC between regions. The Quadratic Assignment Procedure (QAP) is used to explore the driving forces of the spatial correlation network. The primary contributions of this study are as follows: (1) Considering five dimensions, namely, agricultural economic development level, agriculture industry structure, agriculture technology progress, agricultural input, and agricultural carbon emission level, the paper comprehensively evaluates ACERC of cities in Sichuan, and enriches the literature on the evaluation of ACERC. (2) By integrating theories related to ACERC, spatial correlation network, and regional agricultural development, a theoretical framework has been constructed that systematically reveals the spatial correlation of regional ACERC. Based on this theoretical framework, a comprehensive examination of the spatial relationship and driving mechanisms between the ACERC of “adjacent” and “non-adjacent” cities has been conducted, providing support for the formulation of regional agricultural collaborative carbon emission reduction policies in the future.
The following is a summary of the rest of the study: section 2 presents an overview of the study area, the data sources, and the research methodology; section 3 describes the findings of the research as well as the analytical process; section 4 is a discussion of the results of the analysis; and section 5 summarizes the conclusions of the analysis and provides corresponding policy implications.
2 Materials and methodologies
2.1 Research framework
In this study, Sichuan Province is taken as the study region, and data related to agriculture in each city of Sichuan Province from 2010 to 2021 are collected. An assessment system of ACERC is constructed based on five key dimensions, namely, agricultural development level, agricultural industrial structure, agricultural technological progress, agricultural inputs and agricultural carbon emissions level, and the EWM-TOPSIS model is utilized to assess the regional ACERC. Based on the assessment results and the modified gravity model, the spatial correlation strength of the regional ACERC is calculated. Then, the overall characteristics and individual characteristics of the spatial association network of ACERC are analyzed using SNA, and the roles played by cities in the spatial network are examined based on the outputs of the block model and core-edge. Finally, the spatial network formation mechanism is explored using QAP regression analysis. The detailed steps are shown in Figure 2.
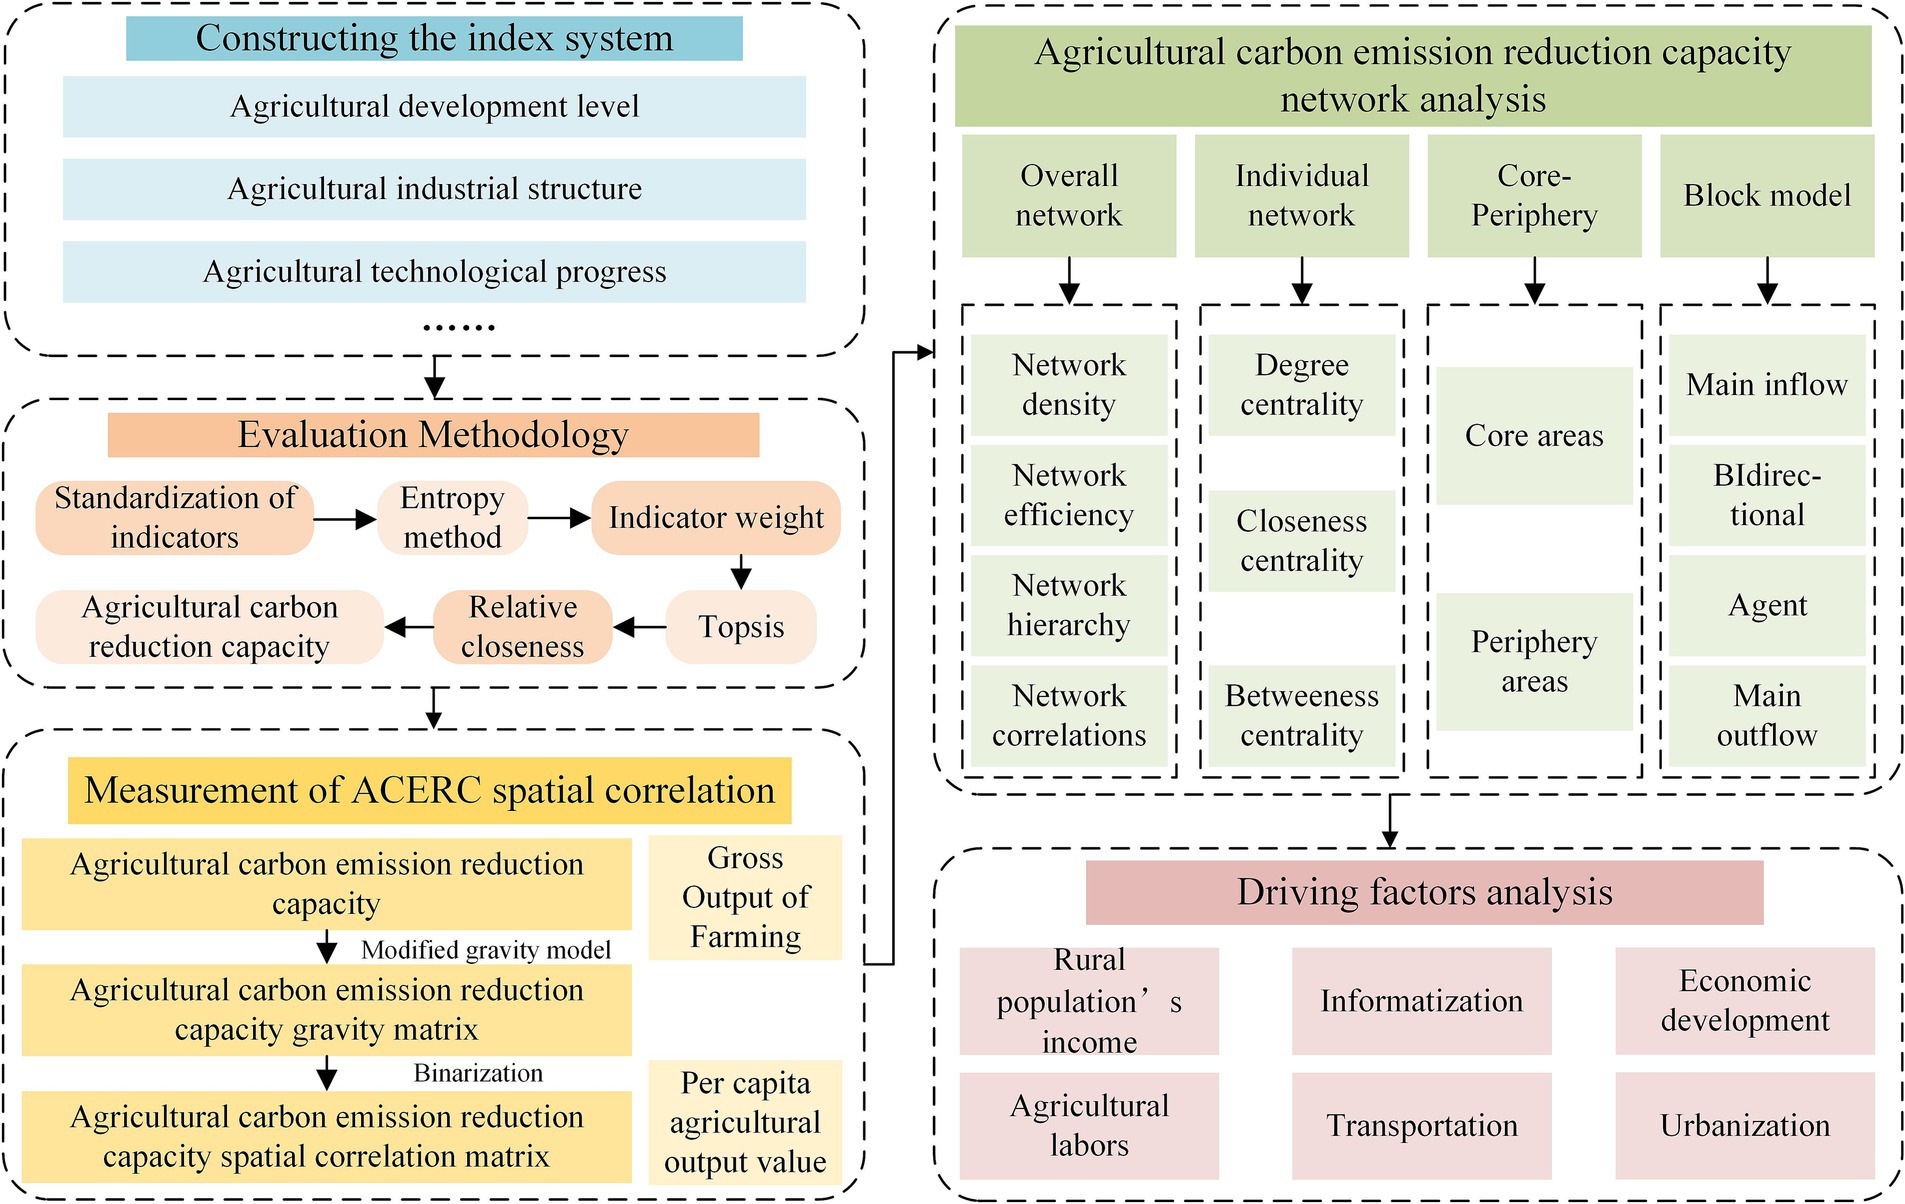
Figure 2. Research frame diagram.
2.2 Study area and data
Sichuan Province is located in southwestern China, at the upper reaches of the Yangtze River, between latitude 26°03′–34°19′ north and longitude 97°21′–108°12′ east (Figure 3). It covers a total area of 486,000 square kilometers, with 18 prefecture-level cities and 3 autonomous prefectures under its jurisdiction. One of the 13 main grain-producing regions of China, Sichuan Province is a traditional agricultural province that is crucial to the country’s agricultural modernization and food security. Because of the government’s careful monitoring and the community’s combined efforts, Sichuan’s agricultural development has yielded remarkable results throughout the past 40 years of reform and opening up. In 2021, grain output reached 35.821 million tons, ranking tenth in the nation, while the primary industry’s added value reached 566.19 billion yuan, ranking second in the nation after Shandong Province. Sichuan’s “10 + 3” industrial strategy has also yielded remarkable results, turning the province from a large agricultural area into a potent one. However, a considerable amount of carbon emissions has also been produced in spite of agriculture’s continuous advancements. Taking the plantation industry as an example, the carbon emissions from the plantation industry in Sichuan in 2021 are 23,585,100 tons. Currently, there is a situation of small-scale agricultural production, irrational industrial structure, and low fertilizer utilization rate in Sichuan Province. Sichuan Province is facing a serious situation in agricultural carbon emission reduction. To this end, the Sichuan Provincial Department of Agriculture and Rural Development, in conjunction with the Provincial Development and Reform Commission, has triggered the Implementation Plan for Emission Reduction and Carbon Sequestration in Rural Agriculture in Sichuan Province, which sets out various rural emission reduction and carbon sequestration targets and calls for the realization of a green transformation of agriculture. Reducing carbon emissions from agriculture is a critical component of achieving peak carbon and carbon neutrality in Sichuan, as well as supporting China’s dual carbon goal.
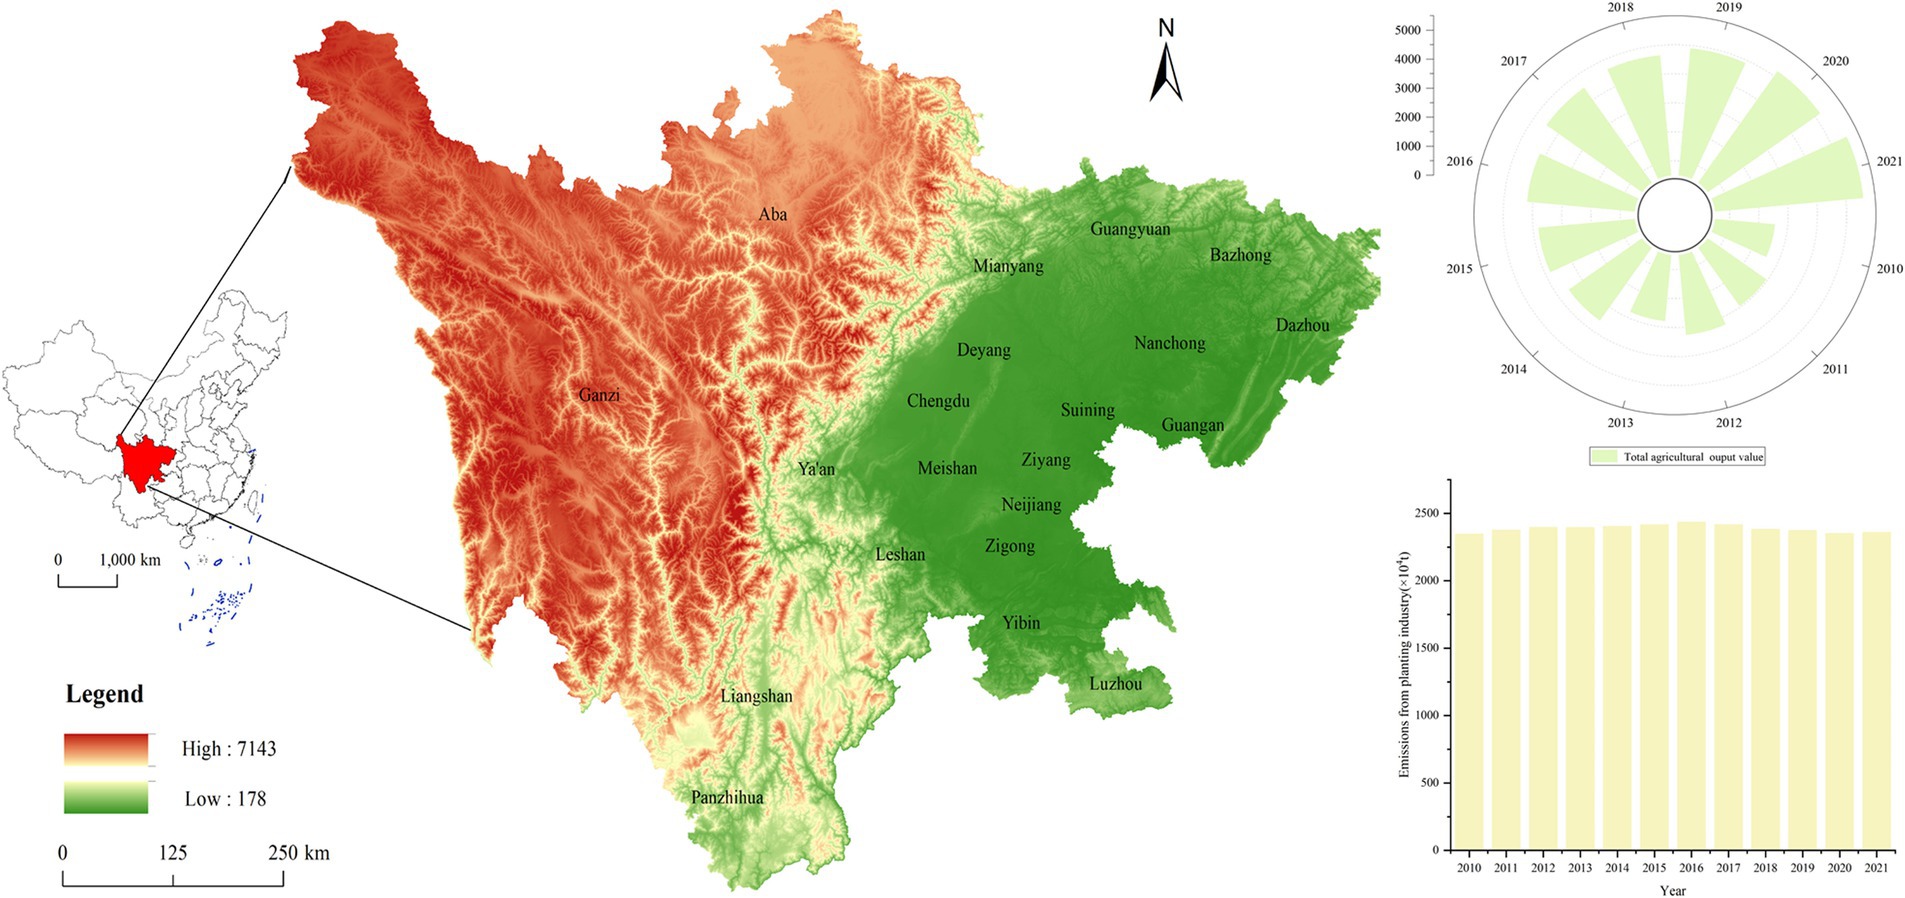
Figure 3. Overview map of the study area.
The research time span of this research is from 2010 to 2021, focusing on 21 cities in Sichuan Province. The data used in this research come from the Sichuan Provincial Statistical Yearbook, the Sichuan Provincial Science and Technology Yearbook, the statistical yearbooks of prefectural-level cities, the administrative reports of prefectural-level city governments, and the statistical bulletins of national economic and social development. For missing data on fertilizer application and pesticide application in Ganzi, Aba and Liangshan in 2021, linear interpolation was used to fill in the gaps. Distances between municipalities were calculated using the distance function in Arcgis. Carbon emissions from agriculture are calculated according to the methodology provided in the 2006 IPCC Guidelines for National Greenhouse Gas Inventories.
2.3 Methods
2.3.1 Construction of an indicator system for ACERC
The current agricultural development pattern, which is marked by high investment, rapid growth, and high resource usage, is no longer feasible in light of the “dual carbon” goals. Agricultural expansion must align with national “dual carbon” policies and progressively transition to a low-carbon and green model in order to achieve the “dual carbon” goals. Numerous factors affect agricultural carbon emissions, and the effects of the economy, industrial structure, technological advancement, and other factors must be taken into account in order to reduce agricultural carbon emissions (Huang Y. et al., 2024; Zheng et al., 2024; Ji et al., 2024). Thus, this study is founded on the scholars’ research findings (Chen et al., 2023; Liu Y. et al., 2023; Li et al., 2023; Cai et al., 2025). Following the principles of comprehensiveness, accessibility, representativeness, and scientificity in the selection of indicators, this paper establishes an indicator system based on five aspects: agricultural development level, agricultural industry structure, agricultural technology progress, agricultural inputs, and the level of agricultural carbon emissions, as shown in Table 1.
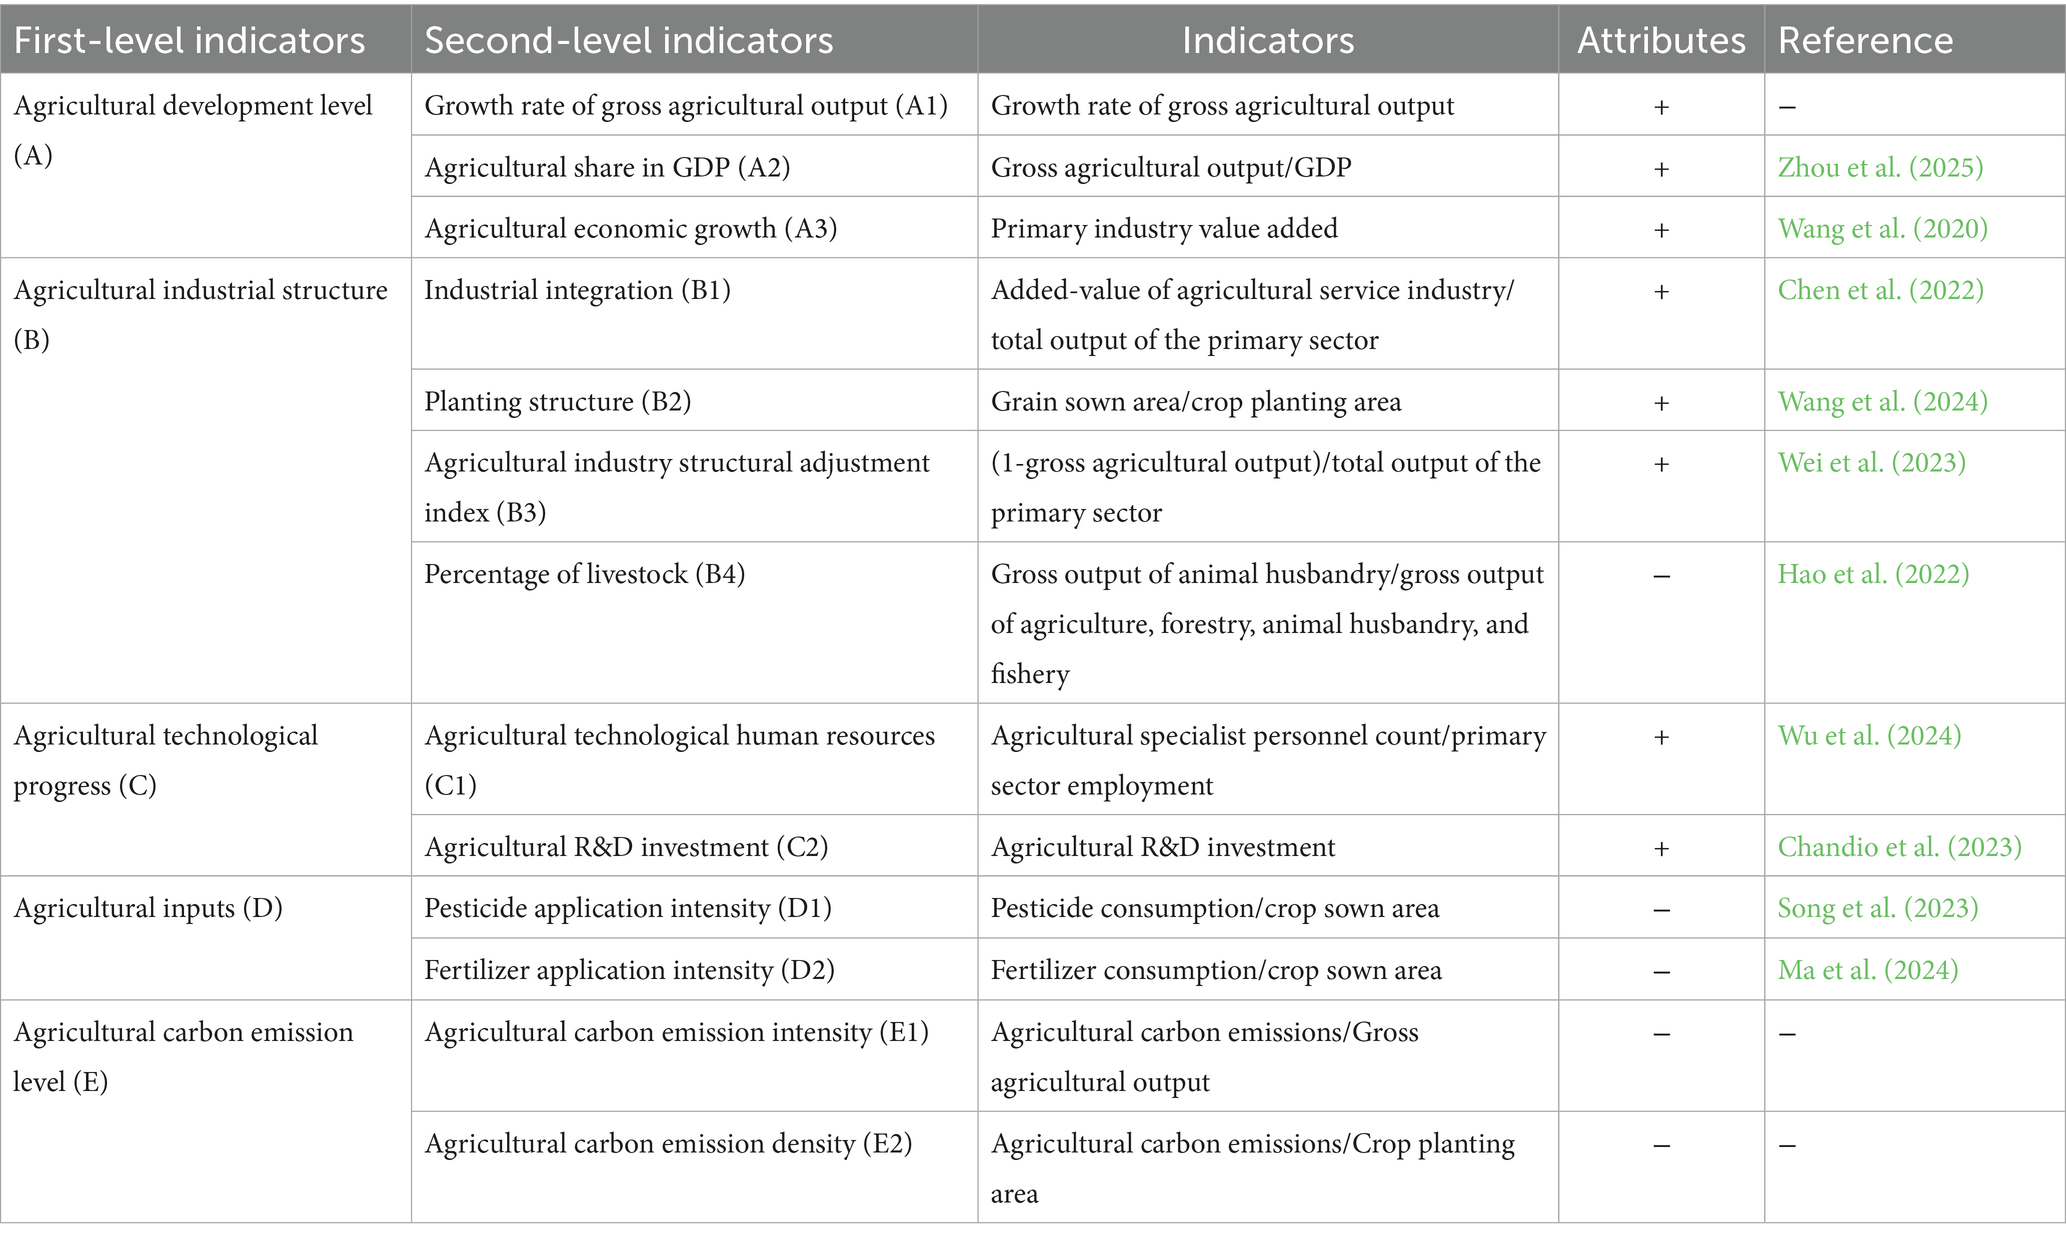
Table 1. Evaluation system of ACERC.
2.3.2 Calculation of ACERC
Regarding the calculation of indicator weights, most of the existing literature uses methods such as hierarchical analysis (Dutta et al., 2024), principal component analysis (Liu et al., 2024), and CRITIC (Ke et al., 2022). However, these methods are flawed in that they ignore the nature of weights, lack objectivity in evaluation outcomes, and are sensitive to outliers. The EWM is an objective weighting method that reduces subjectivity and bias in results by determining objective weights depending on the degree of indicator variability. The TOPSIS method uses a simple, intuitive approach and little processing effort to determine the distance between each measurement object and the optimal and subpar solutions. The TOPSIS and EWM are combined in the EWM-TOPSIS technique. It considers the correlations between features when determining attribute weights and expresses these correlations using information entropy, which enhances model accuracy and enables a more detailed analysis of how characteristics affect decision outcomes. The results are also more accurate since it considers both indication weights and how close assessment items are to the ideal solution. The EWM-TOPSIS model is suitable for sample data that contains a variety of evaluation objects and indicators, enabling strong comparability evaluation conclusions, despite a number of constraints in its application technique. Consequently, it has had extensive use across numerous industries (Miao et al., 2025; Wang J. et al., 2023; Zhang et al., 2022).
The panel data should be converted into cross-sectional data using the indicator dimensions, with the weights of the indicators being the same in each year, to ensure that the outcomes are comparable across time periods. Comparing outcomes across time periods is ensured by setting a consistent reference object. To ascertain the ACERC of every Sichuan city at the prefecture level, this study uses EWM-TOPSIS. The following is the precise formula.
1. Since there are obvious differences in the units of measurement of the various indicators, the indicators are standardized. Positive indicators are calculated using Equation 1, and negative indicators are calculated using Equation 2:
where i represents the city, j represents the indicator, and represent the maximum and minimum values of the indicator, respectively, and represents the standard value of the j indicator for the city.
2. Calculate the entropy value of the j indicator using Equation 3:
3. Calculate the weight Wj of the j indicator using Equations 4, 5:
3. Calculate the Euclidean distances and between each evaluation object and the positive ideal solution and negative ideal solution , respectively, using Equations 6, 7:
4. Calculate the relative progress Ci, using Equation 8:
where Ci represents ACERC. The closer its value is to 1, the higher the agricultural carbon reduction capacity of the city i.
2.3.3 Modified gravity model
The gravity model is widely acknowledged as one of the feasible methods. The new economic geography theory believes that spatial distance has an impact on the inter-city interaction relationship and follows the principle of distance decay. The traditional gravity model lacks knowledge of the urban system and is difficult to reflect the spatial correlation between cities. Based on the above considerations, the traditional gravity model was modified by incorporating regional agricultural economic factors, drawing on the previous literature (Hou G. J. et al., 2024). The modified formulas are presented in Equations 9, 10:
where i and j represent cities i and j respectively; Rij represents the spatial correlation strength of ACERC between city i and city j; ACERC represents agricultural carbon emission reduction capacity; kij represents the contribution of city to the spatial correlation intensity of agricultural carbon emission reduction capacity between city i and city j; Dij represents geographical distance between city i and city j; g represents the per capita gross value of agricultural output; ag represents the gross value of agricultural output.
2.3.4 SNA model
The SNA method is an interdisciplinary approach to analyzing “relational data.” It uses relationships as the basic unit of analysis and construct models by quantifying the relationships between places in the region. Based on the spatial correlation network matrix, this research adopts the SNA method to explore the member relationships in the network, and comprehensively reveals the structure of the spatial correlation network and its attribute characteristics of the ACERC of each city in Sichuan Province.
1. Overall structural characteristics. In this survey, network efficiency, hierarchy, density and connectedness are selected to characterize the overall structure of the ACERC of cities in Sichuan Province. Among them, network density is used to reflect the correlation strength of each node within the spatial correlation network. Network efficiency reflects the stability of the spatial correlation network. Network connectedness is used to reflect whether there is an unreachable logarithm in the spatial correlation network of ACERC. Network hierarchy reflects the status difference of each node in the spatial network structure. The lower its value is, the smaller the gap between the hierarchies within the network is, and the more balanced the effect of each node on the spatial correlation network of ACERC. The detailed formula for each indicator are presented in Table 2.
2. Individual structural characteristics. The individual structural characteristics of the spatial association network are mainly analyzed using three indicators: degree centrality, closeness centrality and betweenness centrality. In the study, when the degree centrality of a node is higher, it indicates that the node is closer to the center of the spatial correlation network and has a stronger effect on the rest of the network nodes. When the closeness centrality of a city is higher, it indicates that it is closer to the other cities in the spatial correlation network. The betweenness centrality of a city is higher, the stronger the city’s controlling and regulating effect on the other cities in the spatial correlation network is. The detailed formula for each indicator are presented in Table 3.
3. Core-periphery structural characteristic. The core-periphery structure is a special structure formed by the interconnection of regions with a compact center and a loose periphery, which characterizes the status or importance of a region in the spatial association network. Therefore, this research utilizes the core-periphery structure to identify the core and edge actors in the spatial linkage network of ACERC in Sichuan.
4. Block model. The basic method for spatial clustering analysis in SNA is the block model. To arrive at a coefficient matrix with values of 1 or −1, clustering analysis is carried out iteratively, which entails computing the correlation coefficients of each row in the network matrix. People who have the same coefficients are divided into two groups. The clustering structural features of ACERC throughout 21 Sichuan cities are investigated in this study using the block model, with an emphasis on the roles and functions of each block within the spatial association network of ACERC across 21 cities. This study classifies the 21 cities into four categories: bidirectional spillover, net benefit, net spillover, and broker. The attributes of each block are determined based on the ratio of internal and external reception and emission relationships within the block and the number of members within the block. The classification criteria are shown in Table 4.
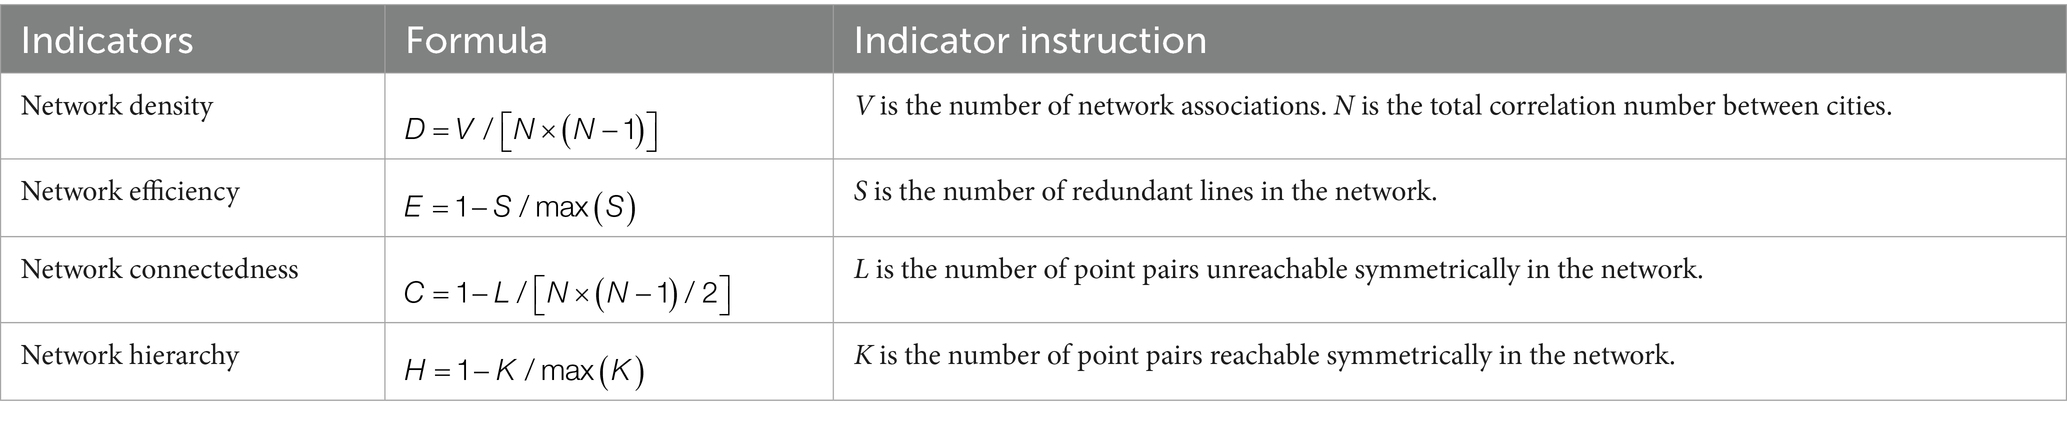
Table 2. Description of overall network characterization indicators.
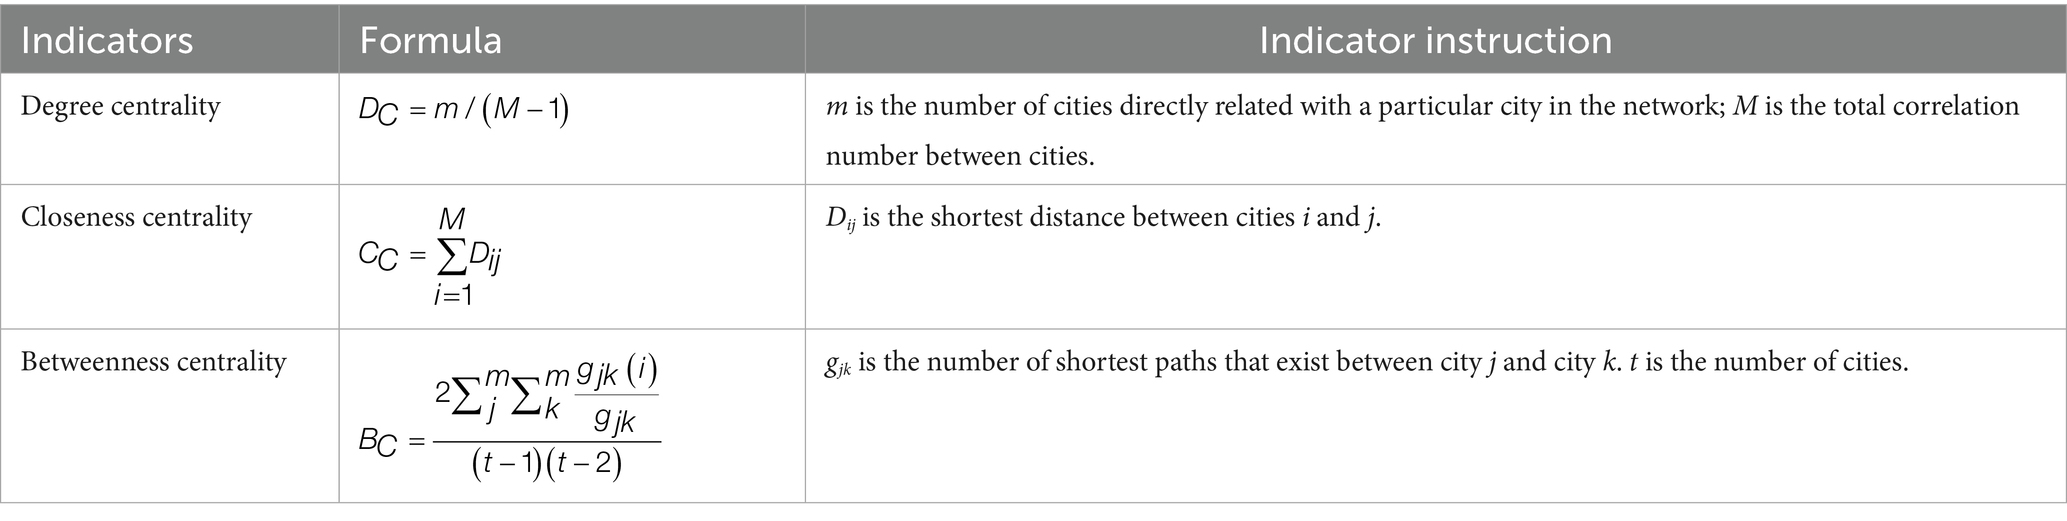
Table 3. Description of individual network characterization indicators.

Table 4. Block model sectioning rules.
2.3.5 QAP analysis
Identifying the driving factors of the spatial correlation network of ACERC is crucial for regional agricultural carbon emission reduction efforts. The QAP can identify the influencing factors of the spatial association network of independent variables based on “relationship data.” Furthermore, QAP does not require independence and normal distribution assumptions and can overcome the collinearity problem between variables (Li et al., 2024). Consequently, the results of utilizing the QAP to analyze relationship data are more reliable than those of standard regression analysis. In order to better understand the factors influencing the spatial correlation network evolution of ACERC across 21 Sichuan cities, this study uses the QAP approach. Based on previous research findings (Chen et al., 2022; Yang and Su, 2024; Yang and Zhu, 2025), the selected driving factors are as follows: (1) Information-level difference matrix (inf), represented by the total volume of postal and telecommunications services in each region. (2) Rural residents’ income difference (inc), represented by the difference in per capita disposable income of rural residents. (3) Economic level difference matrix (gdp), represented by the difference in regional GDP. (4) The government importance difference matrix (gov), represented by differences in expenditures on agriculture, forestry, and water affairs. (5) Agricultural labor force difference matrix (lab), represented by differences in the number of agricultural workers. (6) Transportation level difference matrix, represented by differences in regional highway freight volume (tran). (7) Urbanization level difference matrix (urb), represented by differences in urbanization rates.
3 Results
3.1 Weight analysis of ACERC
The EWM is used to calculate the weights of various indicators affecting the ACERC, with the results shown in Figure 4. Among the first-level indicators, the indicator with the highest weight is agricultural industrial structure at 0.2797, indicating that improving the ACERC requires a focus on optimizing the agricultural industry structure. Among the secondary indicators, the highest weight value is for pesticide application intensity in agricultural input, at 0.0996; followed by agricultural technical talent resources and agricultural share in GDP, at 0.0968 and 0.0948, respectively. The weighting results show that indicators with lower weights are focused in agricultural carbon emission levels.
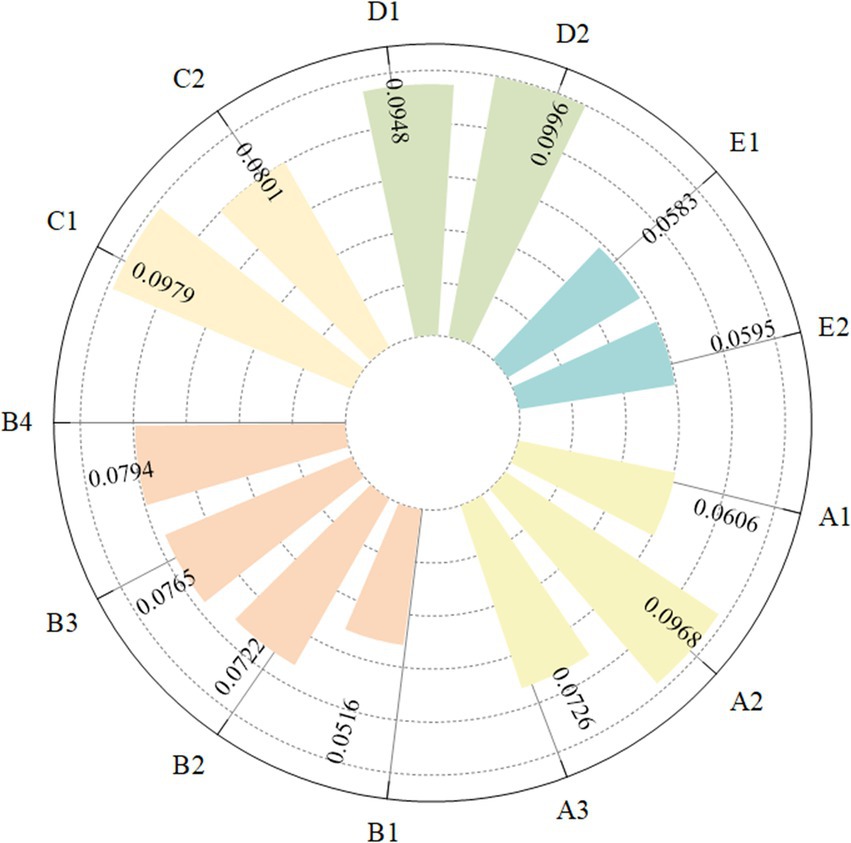
Figure 4. The weight of indicators affecting ACERC.
3.2 Spatial and temporal characteristics of ACERC
3.2.1 Temporal evolutionary characteristics of ACERC
With the help of the EWM-TOPSIS, the annual ACERC of 21 cities in Sichuan Province from 2010 to 2021 is measured and analyzed, and the results are shown in Figure 5. The average level of ACERC in all cities fall from 0.476 in 2010 to 0.456 in 2021, showing an overall negative trend in ACERC. Chengdu has the highest ACERC value, at 0.548. Aba and Nanchong come next. The three cities with the lowest ACERC are Luzhou, Panzhihua, and Suining, with 0.392, 0.375, and 0.367, respectively. Ziyang have the highest average annual growth rate, at 2.6%. Guang’an have the slowest growth rate, with an average annual growth rate of 0.06% for the research period. The majority of cities see negative growth, with Ganzi having the biggest fall in ACERC, with an average annual growth rate of −2.75%. This could be due to Ganzi’s move to modern agriculture, which includes increased investment in production materials to raise agricultural productivity and hence increase agricultural carbon emissions. However, Ganzi’s total agricultural carbon emissions are rather low. As a result, when carbon emissions increase by a given level, ACERC tends to drop.
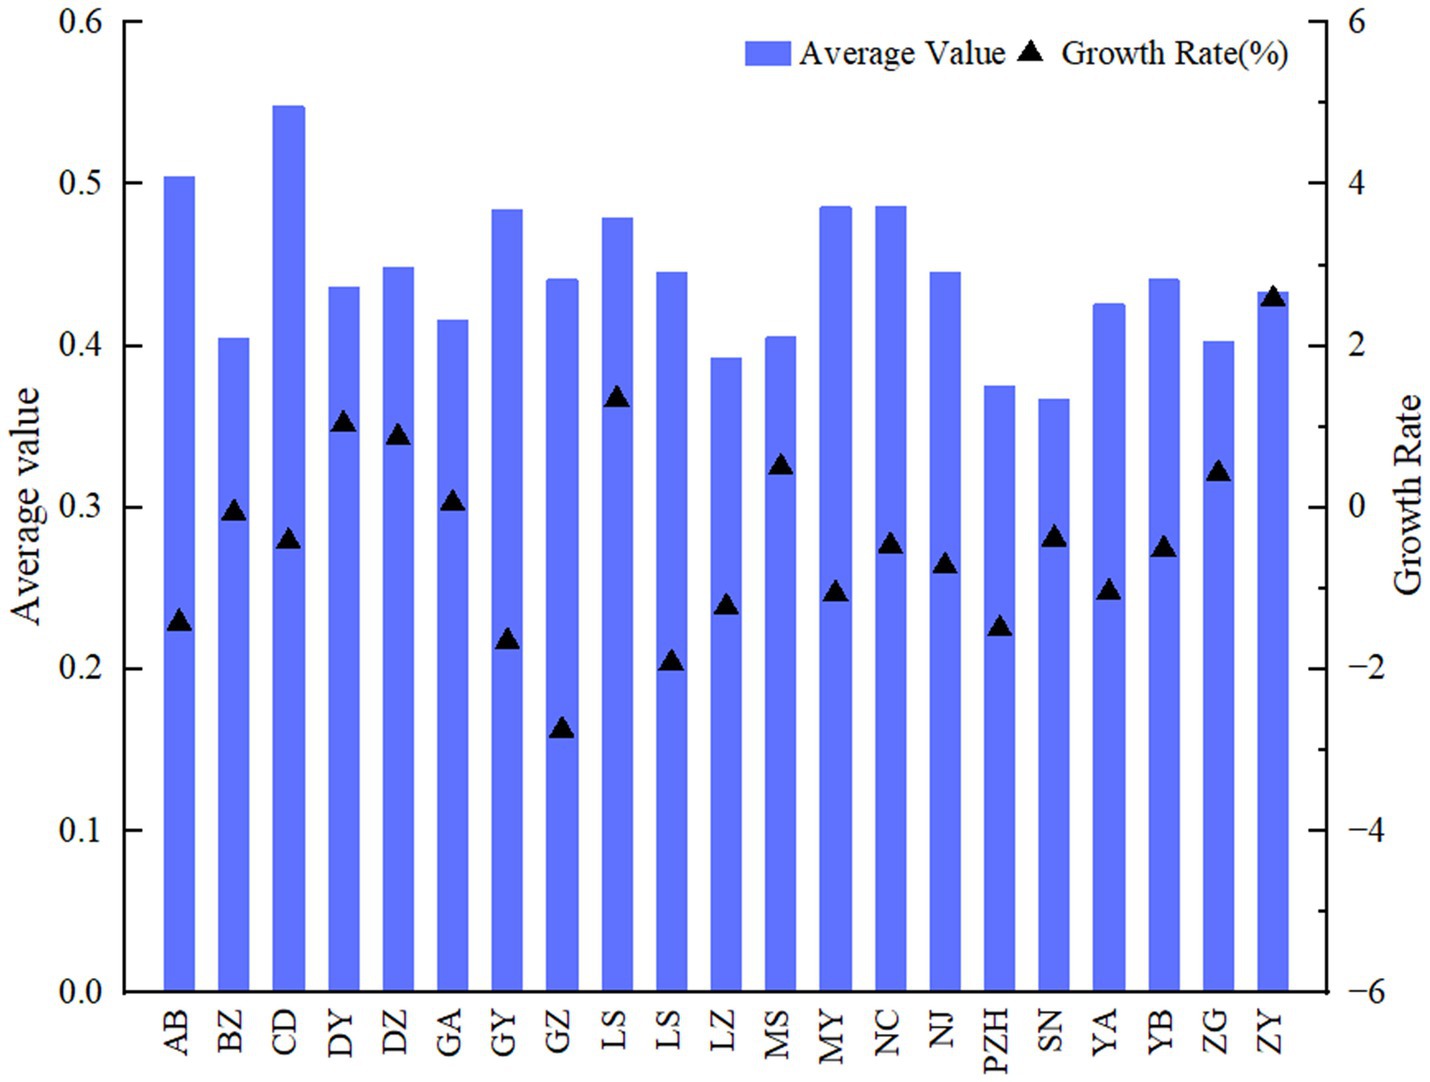
Figure 5. Average value and growth rate of ACERC from 2010 to 2021.
3.2.2 Spatial evolutionary characteristics of ACERC
To better understand the spatial characteristics of ACERC in Sichuan Province cities, this survey selects 2010, 2014, 2018, and 2021 as the study period, and uses ArcGIS software to draw the spatial differentiation map of the level of ACERC in each region (Figure 6). In 2010, Sichuan has a high ACERC, with cities clustered together. Because of the influence of various factors on ACERC, surrounding cities typically have comparable agricultural production settings, resulting in ACERC convergence. Sichuan’s overall ACERC declines somewhat in 2014, with minor changes in distribution characteristics compared with 2010. Cities along the province’s north–south axis have slightly higher overall ACERCs than cities in other regions. In 2018, the ACERC of most cities decreases dramatically, but the number of cities with Grade I ACERC climb significantly. At that time, Sichuan was experiencing unprecedented growth. Population growth and economic development increased demand for grain and agricultural products, resulting in an expansion of agricultural production. However, in the early phases, agricultural production methods in some cities were rather extensive, resulting in a huge amount of agricultural carbon emissions, causing the ACERC to fall behind the rate of agricultural emissions. In 2021, the ACERC of cities in Sichuan improves compared to 2018. This could be because Sichuan aggressively supported agricultural supply-side structural reforms and low-emission agricultural production techniques, in response to the Chinese government’s proposal to promote green agricultural development.
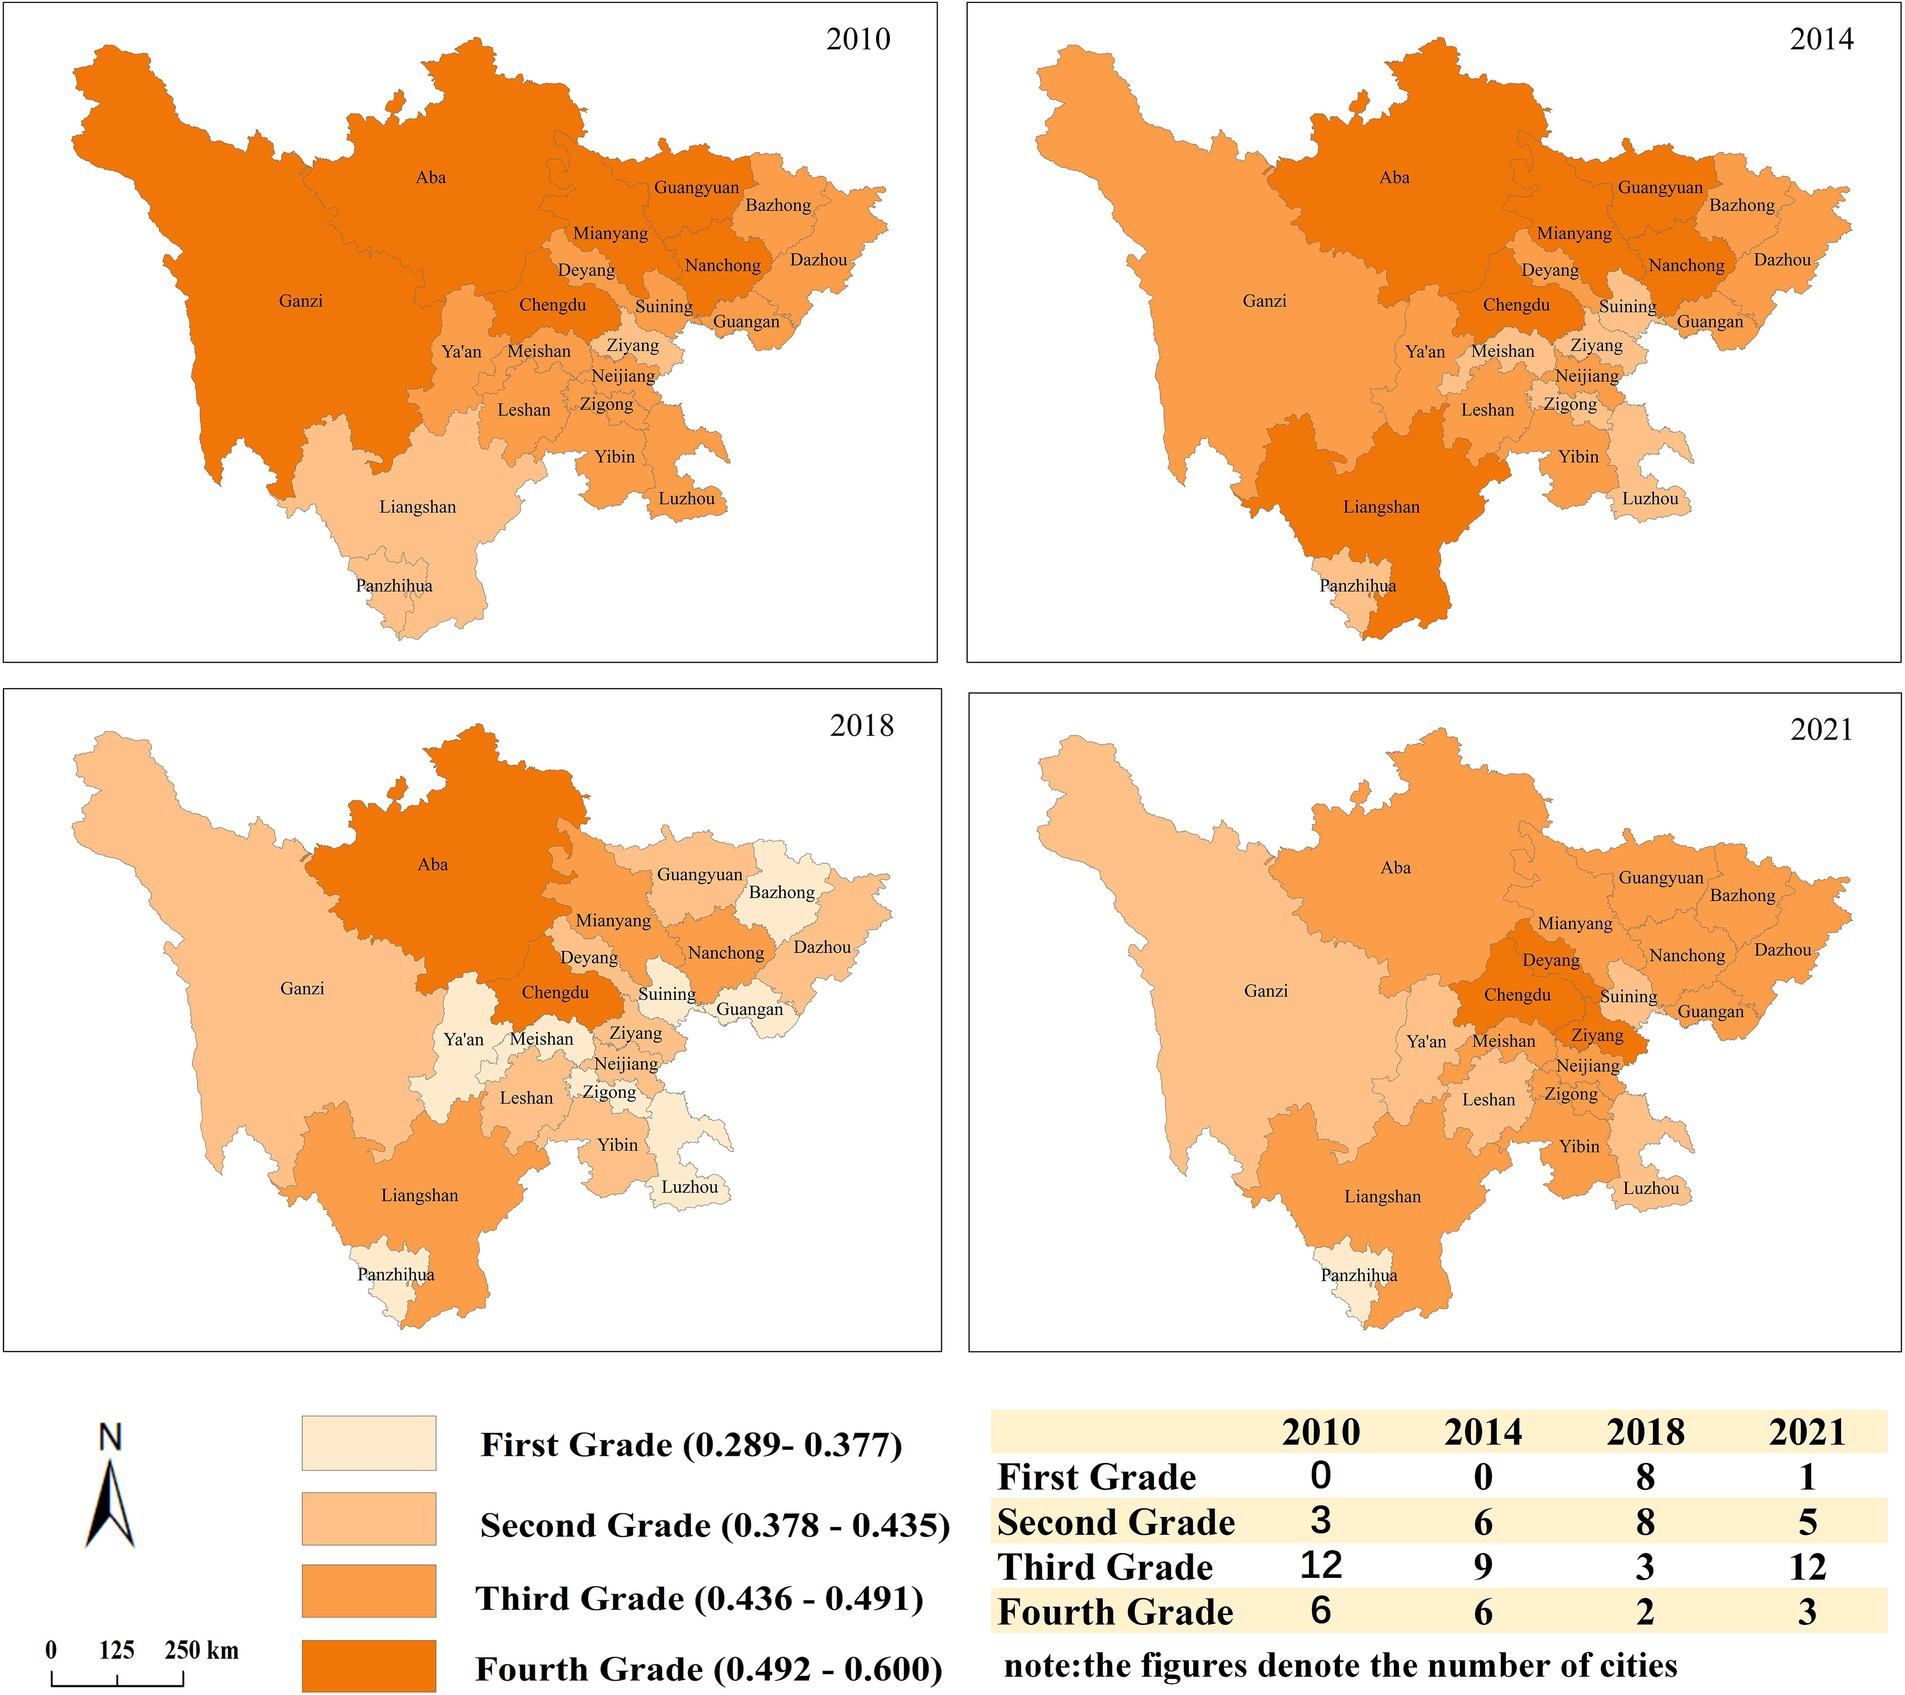
Figure 6. Spatial distribution of ACERC from 2010 to 2021.
3.3 Overall network characteristic of ACERC
Using the modified gravity model, the spatial correlation of ACERC in Sichuan Province is determined. To dipict the spatial correlation strength as well as the path of ACERC in Sichuan Province, 2010 and 2021 are chosen as time nodes to be visualized with the assistant of Arcgis, and the spatial correlation strength is separated into three levels utilizing the natural break method, as shown in Figure 7. Generally speaking, the spatial network structure of ACERC is obvious, showing the characteristic of “sparse in the west and dense in the east.” Over time, the strength of inter-city spatial linkages has been increasing. The geographical barrier between cities has been gradually eliminated, communication and interaction have been strengthened, thus promoting the synergistic development of agricultural carbon emission reduction. In 2010, Aba, Chengdu and Meishan form a triangle of strong links, as do Guangyuan, Bazhong, Nanchong, and Guang’an. Chengdu, being the leading city in Sichuan Province, plays an obvious siphoning role in the region, and has a certain intensity of radiation effect on most of the surrounding cities. In 2021, Neijiang and Ziyang present a “twin-star” structure, with strong spatial linkages. It is worth noting that the spatial pattern with Chengdu as the core has changed, with Neijiang taking over Chengdu’s central position in the network.
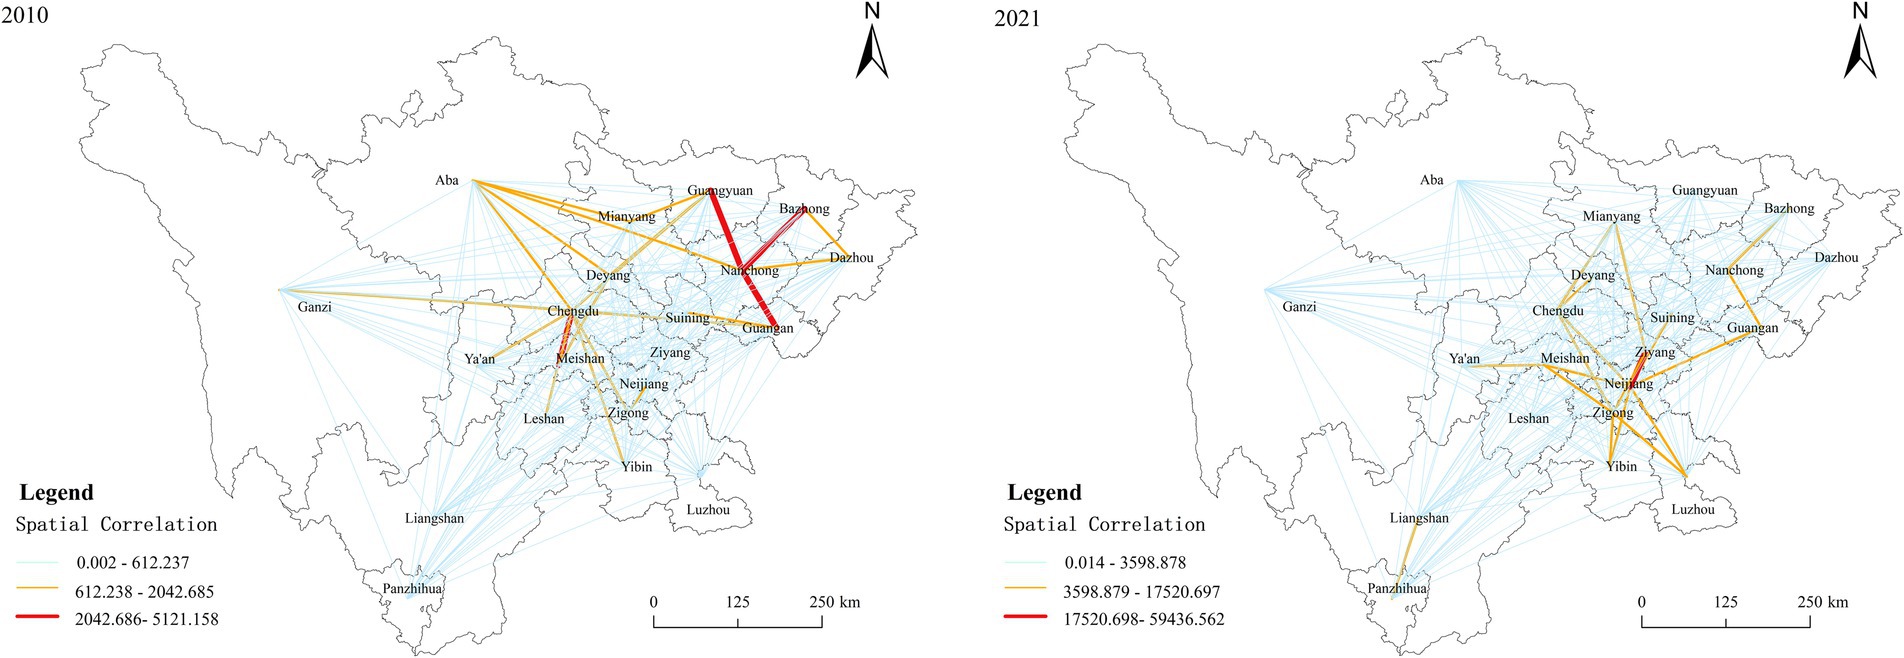
Figure 7. Spatial correlation strength of ACERC in 2010 and 2021.
In order to analyze the overall network characteristics of ACERC in Sichuan Province, the network density, network hierarchy, network closeness and network efficiency of the spatial correlation network in Sichuan Province from 2010 to 2021 are measured using Ucinet. The results are shown in Table 5.
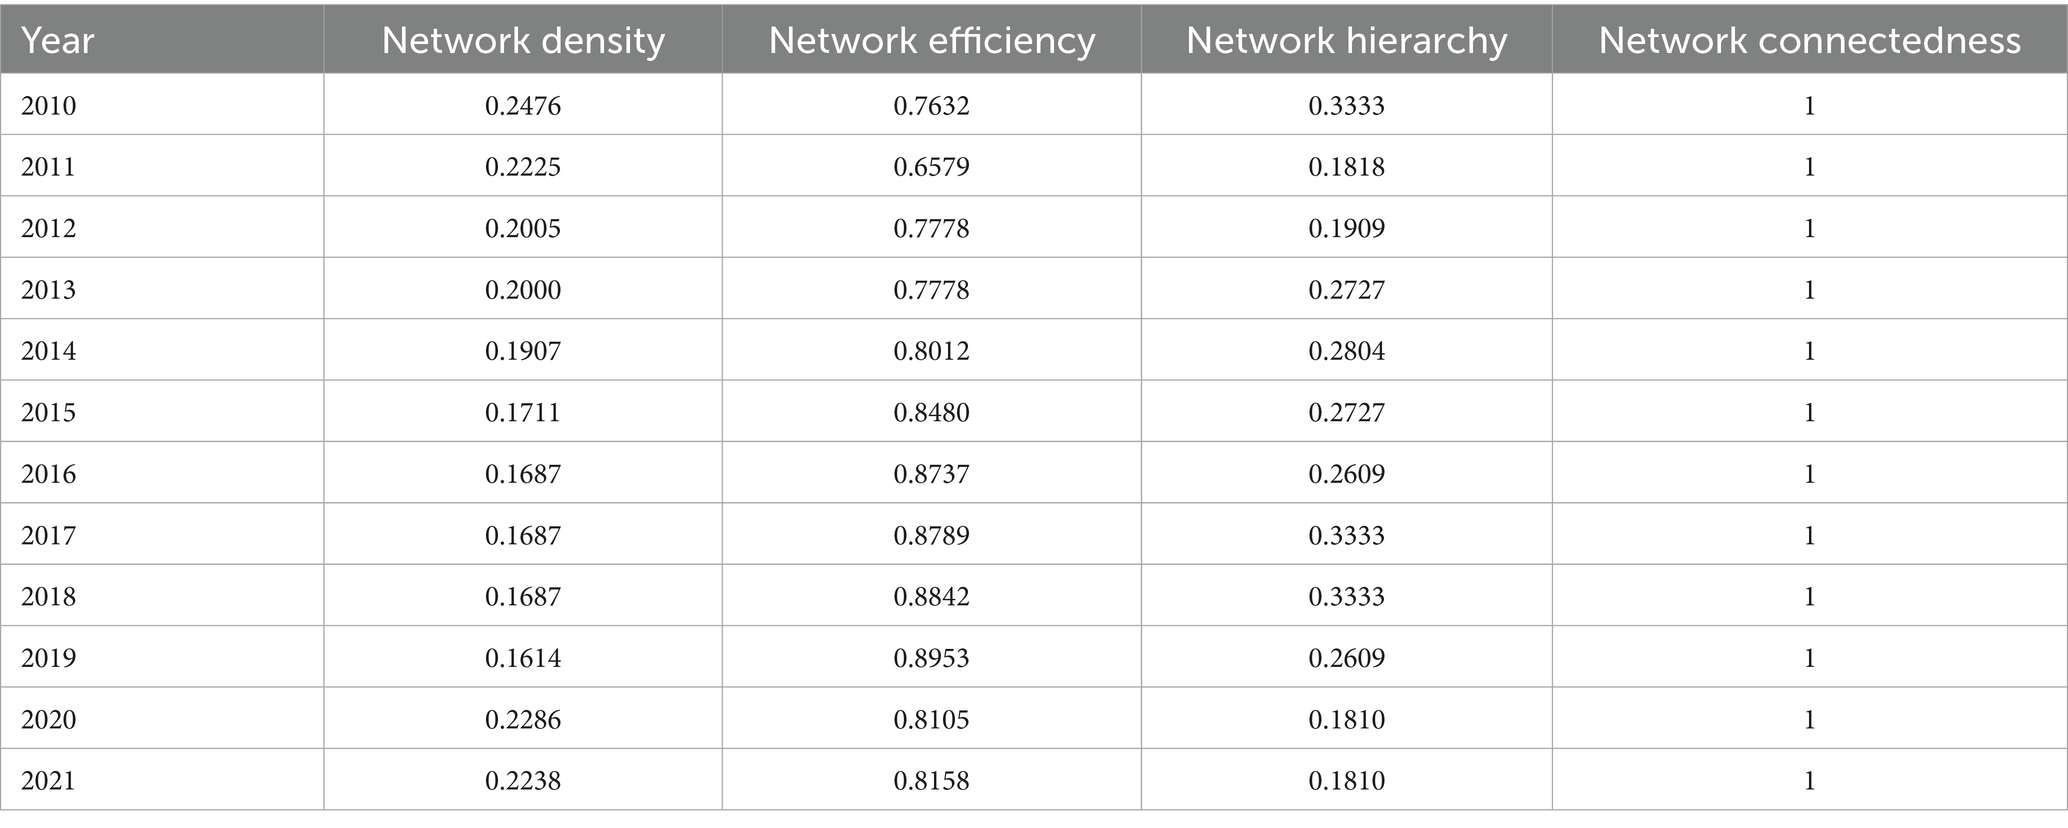
Table 5. The overall characteristics of ACERC in Sichuan.
(1) During the study period, the network density of ACERC decreases from 0.2476 to 0.2238. The average value of network density is 0.1956, which is relatively low overall, indicating that the inter-municipal spatial connection of ACERC is not strong. This is because there are regional differences in the ability of municipalities to access and exchange agricultural capital, technology, and labor. There are barriers to inter-municipal interconnections. (2) The network connectedness consistently maintains its level of 1, suggesting that there is no isolated development among cities, and that any city could be integrated into the spatial network of ACERC through direct or indirect links with other cities. The spillover effect between cities is obvious, and they influenced each other. (3) The network hierarchy decreases from 0.3333 to 0.1810, indicating that the degree of network inequality in the spatial correlation network gradually decreases and develops in the direction of equalization, and the synergistic effect of agricultural carbon emission reduction in each region is obvious. Mainly influenced by market, information, policy and other factors, agricultural labor, capital, agricultural technology and other factors related to agricultural carbon emission reduction are able to achieve coordinated allocation within the province, reducing regional differences. (4) In the spatial correlation network, network efficiency shows a fluctuating upward trend, rising from 0.7632 to 0.8158, indicating that the spatial correlation between the ACERC of various cities and is decreasing and the stability of the network is declining.
3.4 Individual network characteristic of ACERC
The overall network characteristics only reflect the overall situation of the spatial correlation network of ACERC in Sichuan Province. To further reveal the position and role of each city in the network, this paper measures and analyzes three individual network characteristic indicators, namely, degree centrality, betweenness centrality and closeness centrality of each city in 2021. The results are shown in Figure 8.
1. The average degree centrality for 2021 is 5.238. Six cities, including Neijiang, Zigong, and Mianyang, have degree centrality values higher than the average. It indicates that these cities have significant spatial connections with other cities and occupy central positions in the network, playing a leading role in enhancing Sichuan’s ACERC. Due to the differences in inter-city connections, the ACERC of cities form a directed spatial network. In-degree and out-degree reflect a city’s radiation and aggregation effects on other cities. In 2021, eight cities, including Nanchong, Deyang, Mianyang, Chengdu, and Liangshan, have higher in-degree than out-degree. These cities are predominantly economically developed regions that benefit greatly from the spatial association network of ACERC. They effectively attract and promote resources and elements conducive to agricultural carbon emissions reduction, converting them efficiently to enhance their own ACERC.
2. In 2021, Sichuan’s average betweenness centrality value is 21.99. Six cities have betweenness centrality scores higher than the average, including Neijiang, Mianyang, Zigong, Meishan, and others. These cities dominate the network structure and can effectively regulate and control the ACERCs in other regions. These cities serve as the primary conduits for the majority of network connectivity. Some of them, such as Meishan and Ya’an, are located in central Sichuan, allowing them to effectively aggregate various agricultural resources from neighboring cities, absorb advanced agricultural technologies, funds, and talent from developed cities, and export these resources to cities with lower ACERC. Neijiang, as a transportation hub in Sichuan Province, has a well-developed transportation network that strengthens direct connections with other cities, facilitating the flow of relevant resources and elements. Therefore, it can serve as an “intermediary” and “bridge” within the spatial association network.
3. In terms of closeness centrality, Sichuan’s average value in 2021 is 52.66. Nine cities have values above the average, indicating that they are ‘active participants’ in the spatial association network, capable of receiving and transmitting relevant elements and thereby influencing other cities’ ACERC. In comparison to other cities, Mianyang has a strong agricultural industry base, with a well-developed agricultural industrial chain, high agricultural production value, and modern agriculture technology and facilities. It can provide other cities with green and low-carbon technologies and related green and low-carbon production knowledge. Ganzi’s high closeness centrality stems mostly from policy support. Under the support of policies such as the Western Development Initiative, the more developed regions in eastern Sichuan have provided Ganzi with various elements such as funds, talent, and technology. The inflow of these elements has enhanced Ganzi’s closeness centrality.
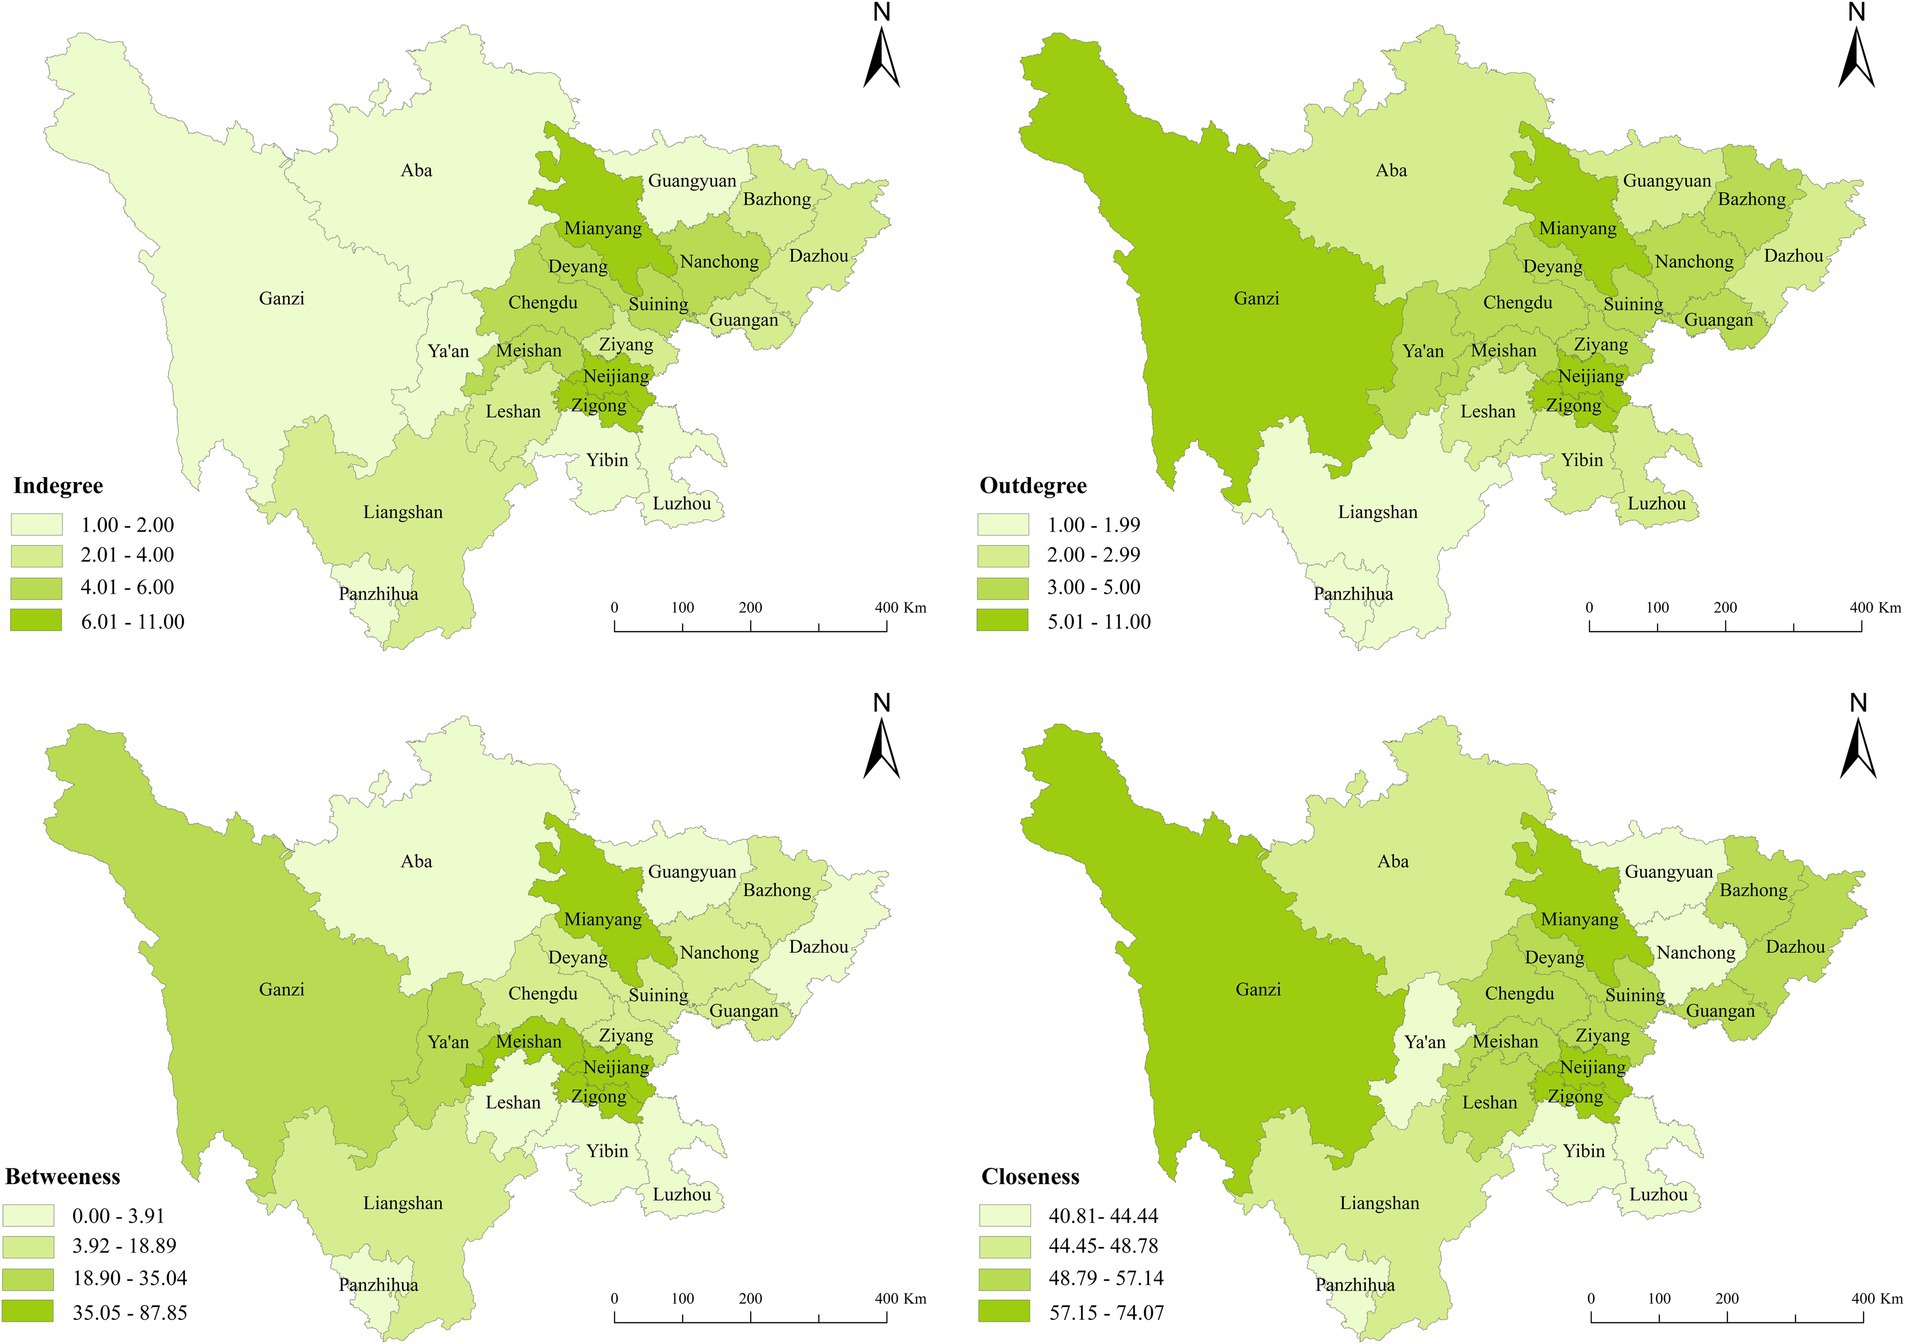
Figure 8. Spatial distribution of cities’ centrality in 2021.
3.5 Spatial clustering characteristics of ACERC
This paper uses the CONCOR in Ucinet6 to explore the roles of each sector in the spatial correlation network of ACERC in Sichuan in 2021 within the network structure, dividing it into four sectors. The members within each sector are listed in Table 6.
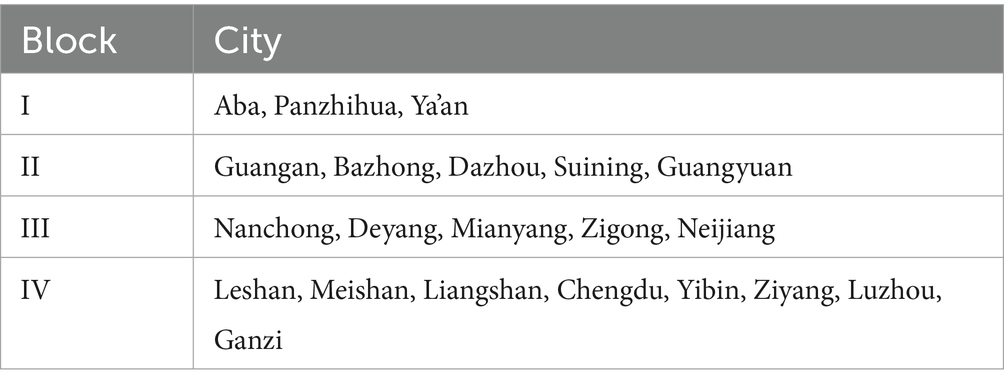
Table 6. Cities within each block.
As shown in Table 7, block I gets 9 external relationships and sends out 13 others. The number of external relationships receives is less than the number sent out, and there are few internal relationships inside the sector, hence it falls under the broker sector. Members of this sector include Aba, Panzhihua, and Ya’an, who serve as a “bridge” in ACERC’s spatial association network. Block II has an expected internal relationship ratio of 20%, however the actual ratio was 9.52%. The number of received relationships and overflow relationships are 26 and 38, respectively, indicating a net overflow block. This block includes Guang’an, Bazhong, Dazhou, Suining, and Guangyuan. These cities primarily export labor and other factors to other blocks. Block III has an actual internal relationship ratio greater than the expected internal relationship ratio, with the number of relationships receiving spillover from other blocks far exceeding the number of relationships sent to other blocks, thus qualifying as a net beneficiary block. The cities within this block are Nanchong, Deyang, Mianyang, Zigong, and Neijiang. These cities either have well-developed agriculture or advanced transportation infrastructure, primarily benefiting from factor inputs from other blocks. Region IV has more connections with external regions than with its internal members, with both incoming and outgoing relationships being relatively high. Therefore, this region also belongs to the broker region, which includes eight cities such as Liangshan, Ganzi, and Yibin.
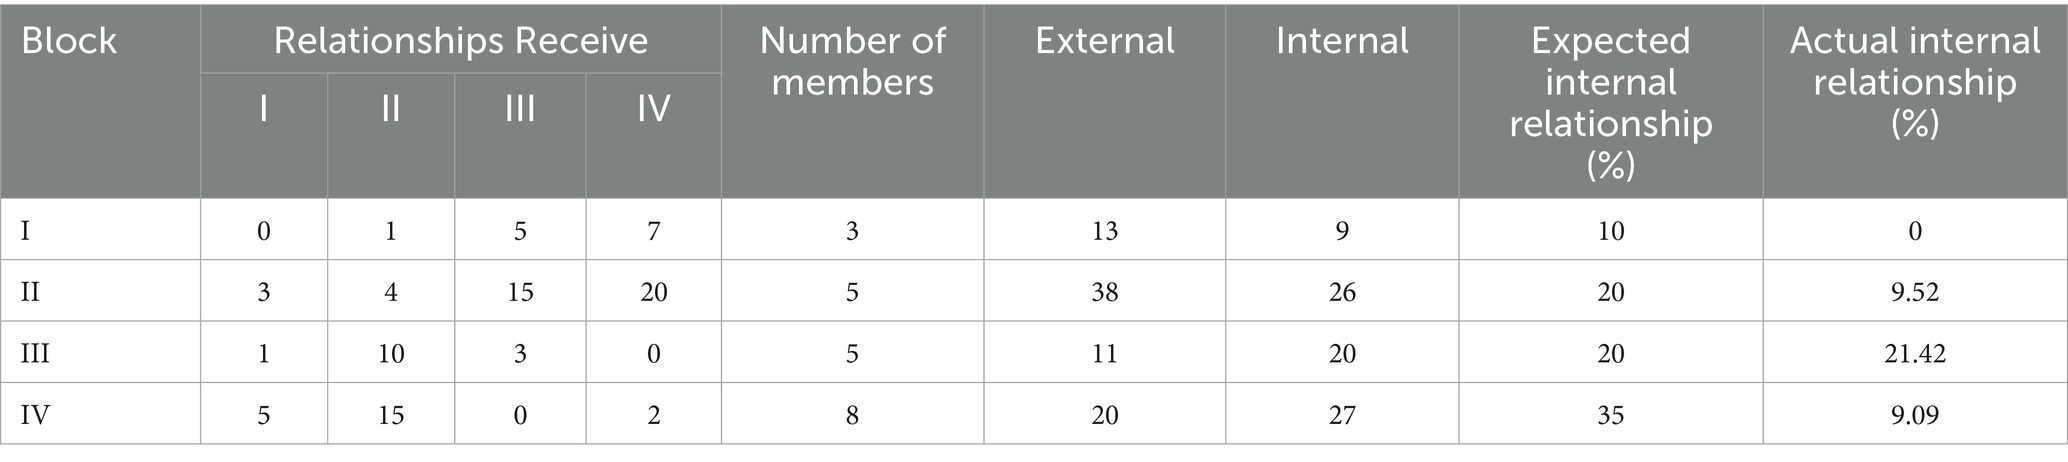
Table 7. Block model analysis of ACERC network in Sichuan.
The identification of core-periphery structures also holds significant practical implications for spatial network structures. This study utilized the Core/Periphery function in Ucinet to map the core-periphery structure diagrams of Sichuan’s ACERC for 2010 and 2021 (Figure 9), analyzing the evolutionary characteristics of the core-periphery structure. In 2010, the core areas are primarily located in the northern part of Sichuan, including Chengdu, Deyang, Zigong, and Nanchong. In 2021, the core regions have undergone changes, with Suining, Yibin, and Aba no longer part of the core region, as their agglomeration functions and attractiveness have weakened. Additionally, Ganzi, Neijiang, Meishan, Guang’an, and Ziyang have become part of the core region. During the study period, the core area shows an expanding trend, with the number of core area cities increasing from 8 in 2010 to 10 in 2021. This may be attributed to the rapid economic development of Sichuan under the impetus of the Chengdu-Chongqing Metropolitan Area initiative, which has led to the further improvement of infrastructure such as transportation and information technology, as well as more frequent exchanges of technology, capital, and experience between cities, thereby enhancing connectivity among them. Additionally, Sichuan has divided its territory into different functional zones based on resource endowments and industrial characteristics, such as the Chengdu Plain Agricultural Zone and the Southern Sichuan Hilly Ecological Zone. Through policy guidance, core cities are leading the development of low-carbon agricultural technologies in peripheral cities.

Figure 9. Core-periphery structure of spatial correlation network of ACERC in 2010 and 2021.
3.6 Driving factors of the spatial correlation network
This study uses Ucinet’s QAP regression analysis, setting the number of random permutations to 5,000, to analyze the factors impacting ACERC’s spatial correlation network in2021. The results are shown in Table 8.
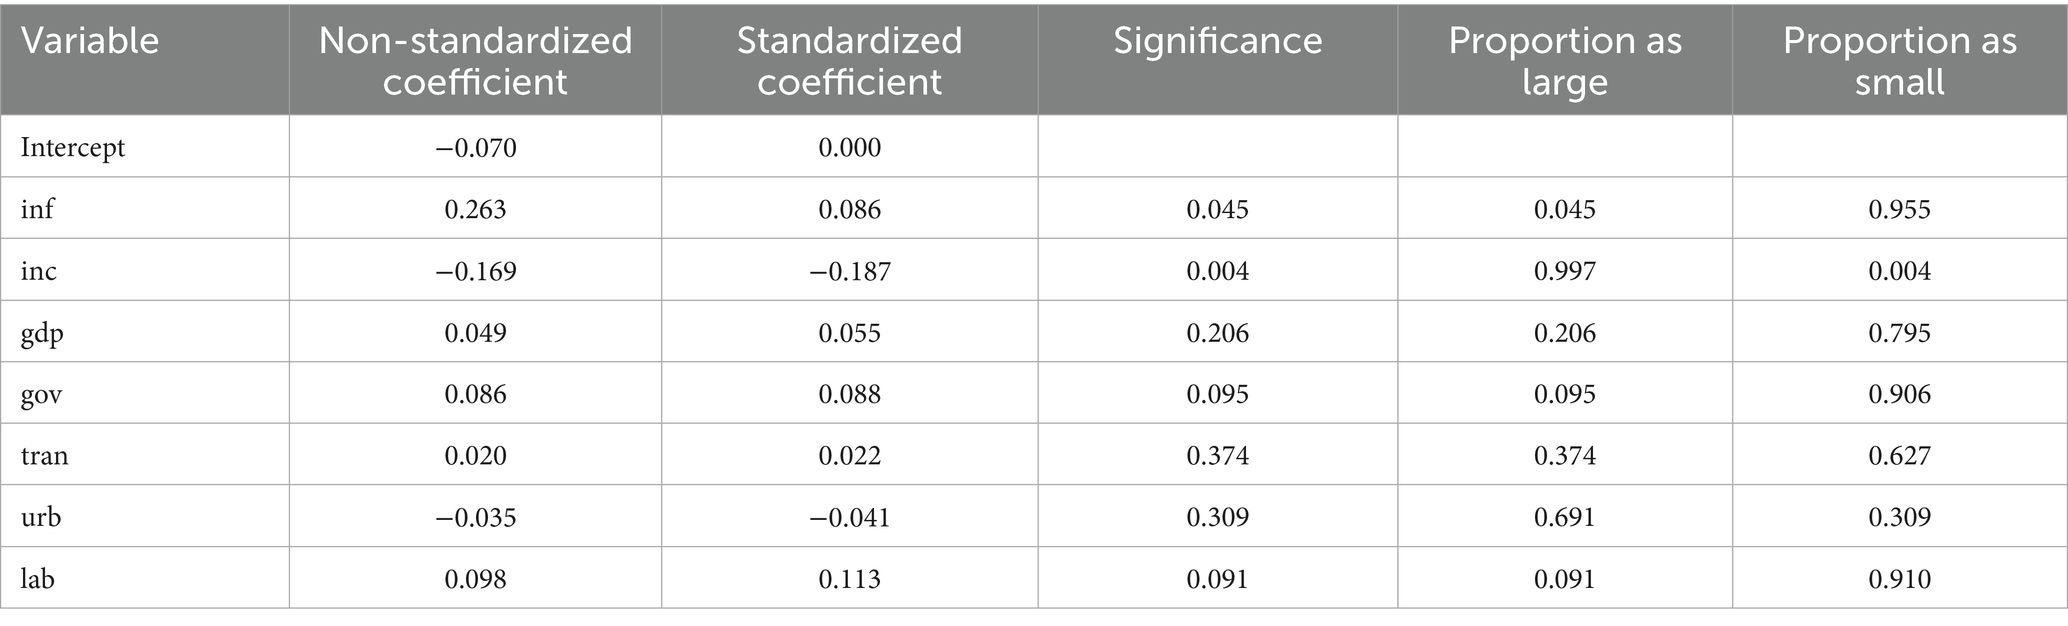
Table 8. QAP regression analysis of ACERC spatial correlation network in Sichuan.
(1) The regression coefficient of the information-level difference matrix is significantly positive, indicating that the greater the difference in the information level among cities, the more conducive it is to the formation of a spatial association network for ACERC. This may be because cities with the higher information level concentrate various elements within the spatial association network for ACERC, thereby promoting the flow of elements within the network. (2) The regression coefficient of the rural inhabitants’ income difference matrix is strongly negative, suggesting that the smaller the difference in farmer income across regions, the easier it is to create a spatial association network for ACERC. When there is a small difference in rural residents’ income levels across regions, technical exchanges and cooperation among farmers become more common, and they are more willing to share experiences and learn from one another, allowing the flow of agricultural elements such as technology across regions and thus strengthening the spatial connections in ACERC. (3) The government importance difference matrix is significantly positive, implying that the higher the difference in government importance between cities, the better the chances of ACERC forming a spatial connection network. Governments that prioritize agricultural growth often invest more budgetary resources, such as R&D funding, in the sector. Thus, high-importance regions may have more sophisticated agricultural carbon emission reduction technologies, but low-importance regions, due to technological limitations, must actively promote exchanges with high-importance regions, thereby improving regional spatial connectivity. (4) The agricultural labor force difference matrix is significantly positive, meaning that the higher the gap in the number of agricultural workers between cities, the easier it will be for ACERC to establish a spatial correlation network. Differences in the number of agricultural workers lead to the labor mobility and resource-sharing networks among regions. Regions with surplus labor can move labor resources to regions with labor shortages, and technology can be transmitted to new areas via labor mobility, resulting in geographic interconnection.
4 Discussion
Since the reform and opening up, under the intensive input of agricultural production factors, China’s agricultural development has experienced a high-speed growth phase for nearly 40 years (Hu, 2024). During this period, Chinese agriculture has transitioned from a planned economy to a market economy, realizing the historical change from traditional to modernized agriculture. Over the transformation process, the inputs of agricultural production factors have changed dramatically, and agricultural carbon emissions have shown a continuous upward trend (Liu and Yang, 2021). Because of the uneven development of urban agriculture, there are significant regional difference in agricultural carbon emissions (Cui et al., 2021). At the same time, there is also an imbalance in ACERC between regions. Carbon dioxide is a public good, and the local governance pattern based on administrative division has limited effect. Synergistic governance is required to fundamentally solve the problem of agricultural carbon emissions (Yao et al., 2024). Therefore, realizing the synergistic effect of regional agricultural carbon emission reduction has received increasing attention.
This study systematically uncovers the regional and temporal evolution characteristics of the ACERC, as well as the structural characteristics of the spatial correlation network and its driving variables in Sichuan between 2010 and 2021. According to the study’s findings, the ACERC in Sichuan is on the decline, with some room for improvement. During the study period, there is an imbalance in the ACERC of cities in Sichuan, which may be due to inter-regional variability in the basic conditions of agricultural production, the level of economic development, and the implementation of policies (He et al., 2021), however, the difference in the ACERC of the cities decreases over time, which is indirectly confirmed by the findings of Zhang and Shen (2025). Under the ‘dual carbon’ target, inputs such as pesticides, chemical fertilizers, and agricultural films should be decreased to improve ACERC at its source. The government should also enhance R&D and investment in agricultural science and technology, expedite the adoption of low-carbon technologies, and improve the agriculture industry’s structure.
From the perspective of spatial network, the spatial network connection of ACERC in Sichuan is relatively loose and sparse during the study period, and the stability of the network is decreasing. It might be because Nanchong, Dazhou, and other cities are all large agricultural cities, agricultural products are homogenized, and the cities’ agriculture has developed a competitive relationship that has somewhat hampered inter-city trade. On the other hand, the network rank results indicate that the disparity across cities is progressively closing and is comparatively low. In the ACERC network, Nanchong, Neijiang, Zigong, and other central cities serve as “middlemen” and have direct connections to other cities. Because of their superior agricultural base, advanced agricultural technology, and efficient transportation, the majority of these cities may readily become “bridges” in the network. Stronger relationships with nearby cities are a result of the abundance of agricultural technology experts and agricultural carbon emission influencers found in cities with high agricultural development (Wei and Chen, 2024). As resources, labor, and technology travel to neighboring cities via transportation, transportation infrastructure also plays a significant role in the creation of spatial links. To achieve synergistic carbon emission reduction in regional agriculture, it is necessary to give full play to the role of such cities to promote agriculture to achieve cross-regional carbon emission reduction, which is consistent with the findings of Shang et al. (2022).
From the perspective of the ACERC’ influencing factors, the information-level, rural residents’ income, government priority, and agricultural labor force have the biggest effects on the spatial correlation of ACERC in Sichuan. This is in line with the findings of He et al. (2024). The spatial correlation network of ACERC in Sichuan is not close enough or stable enough, according to the paper’s findings, which suggests that there is insufficient ACERC spatial spillover between cities. In order to strengthen the spatial correlation of inter-regional ACERC, on the one hand, it is necessary to raise rural residents’ incomes, increase their consumption capacity, and cultivate green product consumption habits, as well as to encourage workers in labor resource areas to move to labor-scarce areas in search of more opportunities to achieve labor mobility in the interregional area. On the other hand, the government should prioritize the development of inter-regional coordinated emission reduction activities, as well as organize inter-regional low-carbon agricultural technology training and experience exchange activities focused on regions with high ACERC, while also improving the level of regional information technology communication, in order to create conditions for the flow of agricultural carbon emission reduction factors.
The study has the following drawbacks. To begin, given the limited availability of data, the assessment indicator system may be insufficient to include more representative indicators, and future study should include a broader variety of indicators. Second, the EWM-TOPSIS approach was employed to evaluate the ACERC, although it was not well verified for sensitivity and robustness. Finally, this paper only investigated the breadth and direction of the involvement of the drivers of the ACERC spatial correlation network in Sichuan, and future research is needed to understand the role mechanism of driver interaction.
5 Conclusions and policy implications
Taking Sichuan Province as the study area, in this paper, the EWM-TOPSIS model is used to assess the ACERC of cities in Sichuan, and with the help of gravity model and social network analysis, the structural characteristics of the spatial correlation network of the ACERC in Sichuan are revealed, and the driving factors for the formation of spatial correlation network are investigated by using the QAP regression analysis method. The main conclusions are as follows:
1. According to the comprehensive evaluation results of EWM-TOPSIS, it can be seen that the overall level of ACERC of 21 cities in Sichuan is not high, and most of the cities’ ACERC is showing a decreasing trend, which has a certain space for progress. During the study period, the areas with higher levels of ACERC in the cities of Sichuan are distributed in a piecemeal manner.
2. The closeness of the spatial correlation relationship of ACERC among cities in Sichuan is not high, there is no hierarchical structural feature, and the synergistic trend of ACERC is obvious. However, the stability of the network shows a decreasing trend, and the network structure needs to be further optimized. The network shows a core-edge structure, with the cities of Nanchong, Neijiang, Zigong and Chengdu at the center of the network, controlling the flow of factors influencing ACERC. Cities located in central Sichuan are the main destinations of spatial spillovers from the spatial correlation network of ACERC.
3. The results of the driver analysis show that the information-level, rural residents’ income, government importance and agricultural labor force have an important influence on the formation of the spatial correlation network of ACERC. Among them, similar levels of information-level, government attention and agricultural labor force can promote the formation of the network; differences in rural residents’ income also promote the formation of the spatial correlation network.
Based on the preceding findings, this study makes the following suggestions: first, the analysis demonstrates that there is a broad spatial correlation between Sichuan cities’ ACERC, but the network as a whole is insufficiently connected and unstable. The government should not only monitor the ACERC in city-level cities, but also consider their geographical correlation. In the future, the Sichuan government should fully exploit the role of the market, strengthen interregional agricultural exchanges and cooperation, encourage the accelerated flow of agricultural-related resources and elements, and fully exploit ACERC’s spatial spillovers to improve the tightness and stability of the linkage network. Second, it is essential to concentrate on the key cities and acknowledge the various functions and places that each city plays in the spatial connection network. In particular, cities in the network’s core area, such as Nanchong and Neijiang, should fully utilize their advantages and promote and drive the improvement of other cities’ ACERCs. Cities in the network’s periphery should improve communication and collaboration with the local communities and actively participate in the planning of the synergistic development of Sichuan’s agricultural carbon emission reduction. The government can gradually close the ACERC gap across cities by developing targeted initiatives based on the spatial correlation network building mechanism of ACERC in Sichuan. The positive effects of information technology and agricultural labor force should be brought into full play to increase the communication channels of information, accelerate the transfer and sharing of labor force, and drive the correlation and coordination of urban ACERC.
Data availability statement
The data analyzed in this study is subject to the following licenses/restrictions: the data that support the findings of this study are available on request from the corresponding author. Requests to access these datasets should be directed to emh3YW5nQGNkdXQuZWR1LmNu.
Author contributions
YL: Software, Formal analysis, Writing – original draft, Methodology, Validation, Investigation, Writing – review & editing. ZW: Conceptualization, Writing – review & editing, Project administration, Supervision, Writing – original draft. YC: Writing – original draft, Resources, Investigation, Formal analysis, Data curation. YW: Writing – original draft, Resources, Investigation, Data curation, Software. LY: Writing – original draft, Visualization, Investigation, Resources, Data curation. YZ: Formal analysis, Methodology, Data curation, Visualization, Writing – original draft. HT: Methodology, Writing – original draft, Visualization, Data curation, Resources.
Funding
The author(s) declare that no financial support was received for the research and/or publication of this article.
Conflict of interest
The authors declare that the research was conducted in the absence of any commercial or financial relationships that could be construed as a potential conflict of interest.
Generative AI statement
The authors declare that no Gen AI was used in the creation of this manuscript.
Any alternative text (alt text) provided alongside figures in this article has been generated by Frontiers with the support of artificial intelligence and reasonable efforts have been made to ensure accuracy, including review by the authors wherever possible. If you identify any issues, please contact us.
Publisher’s note
All claims expressed in this article are solely those of the authors and do not necessarily represent those of their affiliated organizations, or those of the publisher, the editors and the reviewers. Any product that may be evaluated in this article, or claim that may be made by its manufacturer, is not guaranteed or endorsed by the publisher.
References
Benítez-Andrades, J. A., García-Rodríguez, I., Benavides, C., Alaiz-Moretón, H., and Labra Gayo, J. E. (2020). An ontology-based multi-domain model in social network analysis: experimental validation and case study. Inf. Sci. 540, 390–413. doi: 10.1016/j.ins.2020.06.008
Cai, J., Zheng, P., Xie, Y. W., Du, Z., and Li, X. (2025). Research on the impact of climate change on green and low-carbon development in agriculture. Ecol. Indic. 170:113090. doi: 10.1016/j.ecolind.2025.113090
Chandio, A. A., Jiang, Y., Akram, W., Ozturk, I., Rauf, A., Mirani, A. A., et al. (2023). The impact of R&D investment on grain crops production in China: analysing the role of agricultural credit and CO2 emissions. Int. J. Finance Econ. 28, 4120–4138. doi: 10.1002/ijfe.2638
Chen, X. L., Di, Q., Jia, W. H., Chen, X., Jia, W., and Hou, Z. (2023). Spatial correlation network of pollution and carbon emission reductions coupled with high-quality economic development in three Chinese urban agglomerations. Sustain. Cities Soc. 94:104552. doi: 10.1016/j.scs.2023.104552
Chen, Z., Sarkar, A., Rahman, A., Li, X., and Xia, X. L. (2022). Exploring the drivers of green agricultural development (GAD) in China: a spatial association network structure approaches. Land Use Policy 112:105827. doi: 10.1016/j.landusepol.2021.105827
Chen, W. T., Zhang, Z. H., and Wang, J. (2024). A comprehensive assessment of carbon emission reduction capacity in Yunnan Province's farmland based on the set pair analysis and cloud matter element model. China Rural Water Hydropower 1. (Chinese) 37:47+55. doi: 10.12396/znsd.230763
Cheng, H., Wu, B., and Jiang, X. (2024). Study on the spatial network structure of energy carbon emission efficiency and its driving factors in Chinese cities. Appl. Energy 371:123689. doi: 10.1016/j.apenergy.2024.123689
Cui, Y., Khan, S. U., Deng, Y., Zhao, M., and Hou, M. (2021). Environmental improvement value of agricultural carbon reduction and its spatiotemporal dynamic evolution: evidence from China. Sci. Total Environ. 754:142170. doi: 10.1016/j.scitotenv.2020.142170
Dutta, A., Banerjee, M., and Ray, R. (2024). Land capability assessment of Sali watershed for agricultural suitability using a multi-criteria-based decision-making approach. Environ. Monit. Assess. 196:237. doi: 10.1007/s10661-024-12393-9
Frank, S., Havlík, P., Stehfest, E., van Meijl, H., Witzke, P., Pérez-Domínguez, I., et al. (2019). Agricultural non-CO2 emission reduction potential in the context of the 1.5 C target. Nat. Clim. Chang. 9, 66–72. doi: 10.1038/s41558-018-0358-8
Gao, Y., and Gao, M. (2024). Spatial correlation network of municipal solid waste carbon emissions and its influencing factors in China. Environ. Impact Assess. Rev. 106:107490. doi: 10.1016/j.eiar.2024.107490
Hao, D., Wang, R., Gao, C., Song, X., Liu, W., and Hu, G. (2022). Spatial-temporal characteristics and influence factors of carbon emission from livestock industry in China. Int. J. Environ. Res. Public Health 19:14837. doi: 10.3390/ijerph192214837
He, Y., Chen, R., Zhu, S., Xia, S., and Wang, F. (2021). Regional correlation of agricultural carbon emission reduction from the perspective of strategic interaction and technology spillover. Chin. J. Popul. Resour. Environ. 31, 102–112. doi: 10.12062/cpre20201012
He, Y., Wang, H., Chen, R., Hou, S., and Xu, D. (2022). The forms, channels and conditions of regional agricultural carbon emission reduction interaction: a provincial perspective in China. Int. J. Environ. Res. Public Health 19:10905. doi: 10.3390/ijerph191710905
He, W., Wang, F., and Feng, N. (2024). Research on the characteristics and influencing factors of the spatial correlation network of cultivated land utilization ecological efficiency in the upper reaches of the Yangtze River, China. PLoS One 19:e0297933. doi: 10.1371/journal.pone.0297933
Hou, M. Y., Cui, X. H., Xie, Y. L., Hou, M., Cui, X., Xie, Y., et al. (2024). Synergistic emission reduction effect of pollution and carbon in China's agricultural sector: regional differences, dominant factors, and their spatial-temporal heterogeneity. Environ. Impact Assess. Rev. 106:107543.
Hou, G. J., Li, Y. Y., Zhang, Y., and Li, W. (2024). A social network analysis regarding conservation agro-ecological efficiency in China. Environ. Dev. Sustain., 1–25. doi: 10.1016/j.eiar.2024.107543
Hu, J. (2024). Green productivity growth and convergence in Chinese agriculture. J. Environ. Plan. Manag. 67, 1775–1804. doi: 10.1080/09640568.2023.2180350
Huan, H., Wang, L., and Zhang, Y. (2025). Regional differences, convergence characteristics, and carbon peaking prediction of agricultural carbon emissions in China. Environ. Pollut. 366:125477. doi: 10.1016/j.envpol.2024.125477
Huang, Y., Elahi, E., You, J., Sheng, Y., Li, J., and Meng, A. (2024). Land use policy implications of demographic shifts: analyzing the impact of aging rural populations on agricultural carbon emissions in China. Land Use Policy 147:107340. doi: 10.1016/j.landusepol.2024.107340
Huang, H., Jia, J., Chen, D., and Liu, S. (2024). Evolution of spatial network structure for land-use carbon emissions and carbon balance zoning in Jiangxi Province: a social network analysis perspective. Ecol. Indic. 158:111508. doi: 10.1016/j.ecolind.2023.111508
Huang, X., Wu, X., Guo, X., and Shen, Y. (2024). Agricultural carbon emissions in China: measurement, spatiotemporal evolution, and influencing factors analysis. Front. Environ. Sci. 12:1488047. doi: 10.3389/fenvs.2024.1488047
IPCC (2007). Climate change 2007: the fourth assessment report of the intergovernmental panel on climate change. New York: Cambridge University Press.
Ji, M., Li, J., and Zhang, M. (2024). What drives the agricultural carbon emissions for low-carbon transition? Evidence from China. Environmental Impact Assessment Review. 105:107440. doi: 10.1016/j.eiar.2024.107440
Ji, X. Q., and Zhang, Y. S. (2023). Spatial correlation network structure and motivation of carbon emission efficiency in planting industry in the Yangtze River Economic Belt. J. Nat. Resour. 38, 675–693. doi: 10.31497/zrzyxb.20230308
Ke, Y. M., Liu, J. W., Meng, J., Ke, Y., Liu, J., Fang, S., et al. (2022). Comprehensive evaluation for plan selection of urban integrated energy systems: a novel multi-criteria decision-making framework. Sustain. Cities Soc. 81:103837. doi: 10.1016/j.scs.2022.103837
Li, W., Dong, F., and Ji, Z. (2023). Evaluation of carbon emission efficiency and reduction potential of 336 cities in China. J. Clean. Prod. 428:139372. doi: 10.1016/j.jclepro.2023.139372
Li, B., and Gao, Y. (2024). Impact and transmission mechanism of digital economy on agricultural energy carbon emission reduction. Int. Rev. Econ. Finance 95:103457. doi: 10.1016/j.iref.2024.103457
Li, Z., Yu, K., Zhong, J., Yang, J., Zhang, D., and Zhu, J. (2024). Spatial correlation network characteristics and influencing factors of water environmental efficiency in three major urban agglomerations in the Yangtze River basin, China. Sustain. Cities Soc. 104:105311. doi: 10.1016/j.scs.2024.105311
Liu, Y., Deng, Y., and Peng, B. (2023). The impact of digital financial inclusion on green and low-carbon agricultural development. Agriculture 13:1748. doi: 10.3390/agriculture13091748
Liu, J. B., Liu, B. R., and Lee, C. C. (2024). Efficiency evaluation of China's transportation system considering carbon emissions: evidence from big data analytics methods. Sci. Total Environ. 922:171031. doi: 10.1016/j.scitotenv.2024.171031
Liu, P., Qin, Y., Luo, Y. Y., Luo, Y., Wang, X., and Guo, X. (2023). Structure of low-carbon economy spatial correlation network in urban agglomeration. J. Clean. Prod. 394:136359. doi: 10.1016/j.jclepro.2023.136359
Liu, M., and Yang, L. (2021). Spatial pattern of China’s agricultural carbon emission performance. Ecol. Indic. 133:108345. doi: 10.1016/j.ecolind.2021.108345
Liu, D., Zhu, X., and Wang, Y. (2021). China's agricultural green total factor productivity based on carbon emission: an analysis of evolution trend and influencing factors. J. Clean. Prod. 278:123692. doi: 10.1016/j.jclepro.2020.123692
Ma, B., Karimi, M. S., Mohammed, K. S., Shahzadi, I., and Dai, J. (2024). Nexus between climate change, agricultural output, fertilizer use, agriculture soil emissions: novel implications in the context of environmental management. J. Clean. Prod. 450:141801. doi: 10.1016/j.jclepro.2024.141801
Miao, C., Na, M., Chen, H., and Ding, M. (2025). Urban resilience evaluation based on entropy-TOPSIS model: a case study of county-level cities in Ningxia, Northwest China. Int. J. Environ. Sci. Technol. 22, 4187–4202. doi: 10.1007/s13762-024-05880-6
Shang, J., Ji, X., Shi, R., and Zhu, M. (2022). Structure and driving factors of spatial correlation network of agricultural carbon emission efficiency in China. Chin. J. Eco-Agric. 30, 543–557. doi: 10.12357/cjea.20210607
Shen, C., and Wang, Y. (2023). How does public concern about climate change affect carbon emissions? Evidence from large-scale online content and provincial-level data in China. J. Clean. Prod. 426:139137. doi: 10.1016/j.jclepro.2023.139137
Shi, H., and Chang, M. (2023). How does agricultural industrial structure upgrading affect agricultural carbon emissions? Threshold effects analysis for China. Environ. Sci. Pollut. Res. 30, 52943–52957. doi: 10.1007/s11356-023-25996-5
Shi, X. Y., Huang, X. X., Zhang, W. X., Shi, X., Huang, X., Zhang, W., et al. (2024). Examining the characteristics and influencing factors of China's carbon emission spatial correlation network structure. Ecol. Indic. 159:111726. doi: 10.1016/j.ecolind.2024.111726
Song, X., and Dou, Y. (2024). Exploration and countermeasures for the development of low-carbon agriculture: a study from Chongming District, Shanghai. Front. Ecol. Evol. 12:1345230. doi: 10.3389/fevo.2024.1345230
Song, S., Zhao, S., Zhang, Y., and Ma, Y. (2023). Carbon emissions from agricultural inputs in China over the past three decades. Agriculture 13:919. doi: 10.3390/agriculture13050919
Sun, Z., Cheng, X., Zhuang, Y., and Sun, Y. (2024). Spatial correlation network structure characteristics of carbon emission efficiency and its influencing factors at city level in China. Environ. Dev. Sustain. 26, 5335–5366. doi: 10.1007/s10668-023-02936-4
Tan, T., Chen, Z. H., Zha, J. P., Chen, Z., Zha, J., He, L., et al. (2024). Tourism productivity: is there any spatial correlation among various regions? The case of China from a network analysis perspective. J. Hosp. Tour. Manag. 58, 256–268. doi: 10.1016/j.jhtm.2024.02.001
Toor, M. D., Ur Rehman, M., Abid, J., Nath, D., Ullah, I., Basit, A., et al. (2024). Microbial ecosystems as guardians of food security and water resources in the era of climate change. Water Air Soil Pollut. 235:741. doi: 10.1007/s11270-024-07533-3
Wang, H., Liu, C., Xiong, L., and Wang, F. (2023). The spatial spillover effect and impact paths of agricultural industry agglomeration on agricultural non-point source pollution: a case study in Yangtze River Delta, China. J. Clean. Prod. 401:136600. doi: 10.1016/j.jclepro.2023.136600
Wang, J., Mo, L., and Ma, Z. (2023). Evaluation of port competitiveness along China’s “belt and road” based on the entropy-TOPSIS method. Sci. Rep. 13:15717. doi: 10.1038/s41598-023-42755-1
Wang, L., Vo, X. V., Shahbaz, M., and Ak, A. (2020). Globalization and carbon emissions: is there any role of agriculture value-added, financial development, and natural resource rent in the aftermath of COP21? J. Environ. Manag. 268:110712. doi: 10.1016/j.jenvman.2020.110712
Wang, L., Zhang, M., and Song, Y. (2024). Research on the spatiotemporal evolution characteristics and driving factors of the spatial connection network of carbon emissions in China: new evidence from 260 cities. Energy 291:130448. doi: 10.1016/j.energy.2024.130448
Wei, X., and Chen, B. (2024). Spatial association network structure of agricultural carbon emission efficiency in Chinese cities and its driving factors. Sci. Rep. 14:31810. doi: 10.1038/s41598-024-83041-y
Wei, S., Yang, Y., and Xu, Y. (2023). Regional development, agricultural industrial upgrading and carbon emissions: what is the role of fiscal expenditure?—-evidence from Northeast China. Econ. Anal. Policy 80, 1858–1871. doi: 10.1016/j.eap.2023.11.016
Wu, H., Zheng, X., Zhou, L., and Meng, Y. (2024). Spatial autocorrelation and driving factors of carbon emission density of crop production in China. Environ. Sci. Pollut. Res. 31, 27172–27191. doi: 10.1007/s11356-024-32908-8
Xu, G. Y., Li, J. J., Schwarz, P. M., Xu, G., Li, J., Yang, H., et al. (2022). Rural financial development and achieving an agricultural carbon emissions peak: an empirical analysis of Henan Province, China. Environ. Dev. Sustain. 24, 12936–12962. doi: 10.1007/s10668-021-01976-y
Xu, C., Xu, Y. Y., Chen, J. D., Xu, Y., Chen, J., Huang, S., et al. (2023). Spatio-temporal efficiency of fiscal environmental expenditure in reducing CO2 emissions in China's cities. J. Environ. Manag. 334:117479. doi: 10.1016/j.jenvman.2023.117479
Yang, Y., and Su, X. (2024). Spatial correlation network structure of carbon emission reduction capacity on urban agglomerations and its driving factors: a perspective of sustainable development goals. Sustain. Cities Soc. 113:105646. doi: 10.1016/j.scs.2024.105646
Yang, X., and Zhu, L. (2025). Spatial correlation network of China's carbon emissions and its influencing factors: perspective from social network analysis. J. Clean. Prod. 516:145671. doi: 10.1016/j.jclepro.2025.145671
Yao, Y., Bi, X., Li, C. H., Li, C., Xu, X., Jing, L., et al. (2024). A united framework modeling of spatial-temporal characteristics for county-level agricultural carbon emission with an application to Hunan in China. J. Environ. Manag. 364:121321. doi: 10.1016/j.jenvman.2024.121321
Ye, J., Xie, R., Deng, X., Lin, M., Chen, Y., Lin, K., et al. (2024). Assessment of agricultural carbon emissions reduction potential and optimization pathways based on a framework of equity and efficiency principles: evidence from Fujian Province in China. Agric. Econ. (Zemědělská ekonomika) 70, 125–136. doi: 10.17221/329/2023-AGRICECON
Zhang, W., and Shen, Y. (2025). Toward low-carbon agriculture: measurement and driver analysis of agricultural carbon emissions in Sichuan province, China. Front. Sustain. Food Syst. 9:1565776. doi: 10.3389/fsufs.2025.1565776
Zhang, S., Wen, X., Sun, Y., and Xiong, Y. (2024). Impact of agricultural product brands and agricultural industry agglomeration on agricultural carbon emissions. J. Environ. Manag. 369:122238. doi: 10.1016/j.jenvman.2024.122238
Zhang, Y., Zhang, Y., Zhang, H., and Zhang, Y. (2022). Evaluation on new first-tier smart cities in China based on entropy method and TOPSIS. Ecol. Indic. 145:109616. doi: 10.1016/j.ecolind.2022.109616
Zhang, Z., Zhu, J., Yang, L., and Lu, N. (2024). Toward dual carbon targets: spatial correlation on comprehensive carbon emission index in urban agglomerations based on a new evaluation model. J. Clean. Prod. 458:142507. doi: 10.1016/j.jclepro.2024.142507
Zhang, X., Zhou, J., Wu, R., and Wang, S. (2024). Spatial network analysis and driving forces of urban carbon emission performance: insights from Guangdong Province. Sci. Total Environ. 951:175538. doi: 10.1016/j.scitotenv.2024.175538
Zheng, X X., Tan, H., and Liao, W. (2024). Spatiotemporal evolution of factors affecting agricultural carbon emissions: empirical evidence from 31 Chinese provinces. Environment, Development and Sustainability. 1–35. doi: 10.1007/s10668-023-04337-z
Zhou, J. R., Li, X. Q., Yu, X., Zhao, T. C., and Ruan, W. X. (2024). Exploring the ecological security evaluation of water resources in the Yangtze River basin under the background of ecological sustainable development. Sci. Rep. 14:15475. doi: 10.1038/s41598-024-65781-z
Zhou, Y., Peng, J., Zhang, Z., Li, Y., and Cheng, L. (2025). Evaluation and obstacle factors diagnosis of agriculture green development level in China’s Yangtze River basin based on the DPSIR framework. Environ. Dev. Sustain. 27, 4971–4999. doi: 10.1007/s10668-024-04467-y
Keywords: agricultural carbon emission reduction capacity, modified gravity model, social network analysis, spatial correlation characteristic, Sichuan Province
Citation: Li Y, Wang Z, Cao Y, Wang Y, Yu L, Zhang Y and Tang H (2025) Study on the evolution characteristics of spatial network structure of regional agricultural carbon emission reduction capacity based on SNA. Front. Sustain. Food Syst. 9:1660573. doi: 10.3389/fsufs.2025.1660573
Edited by:
Pengzhen Liu, Jinan University, ChinaCopyright © 2025 Li, Wang, Cao, Wang, Yu, Zhang and Tang. This is an open-access article distributed under the terms of the Creative Commons Attribution License (CC BY). The use, distribution or reproduction in other forums is permitted, provided the original author(s) and the copyright owner(s) are credited and that the original publication in this journal is cited, in accordance with accepted academic practice. No use, distribution or reproduction is permitted which does not comply with these terms.
*Correspondence: Zhong Wang, emh3YW5nQGNkdXQuZWR1LmNu