 Tagesse Lambebo
 Tesfaye Deme
 Mulatu Geleta
- 1Department of Food Science and Applied Nutrition, Biotechnology and Bioprocess Center of Excellence, Addis Ababa Science and Technology University, Addis Ababa, Ethiopia
- 2Department of Plant Breeding, Swedish University of Agricultural Sciences, Alnarp, Sweden
Cassava (Manihot esculenta Crantz) is a vital food crop in Sub-Saharan Africa, Asia, the Pacific, and South America, serving as a staple for approximately 800 million people. While its roots are a rich energy source, its leaves contain valuable minerals, vitamins, and protein, offering potential to enhance starchy diets if properly processed to reduce toxic anti-nutritional factors. This study evaluated the nutritional profiles of cassava roots and leaves and assessed the role of processing in improving nutrient retention and safety. Two varieties, kello and qulle, obtained from the Areka Agricultural Research Center, were analyzed. Roots and leaves were subjected to fermentation, boiling, and fluidized bed drying, followed by nutritional, anti-nutritional, and functional characterization using AOAC standard methods. Results showed that roots had higher carbohydrate content (81.0–87.1 g/100 g), while leaves exhibited superior protein (21.2–28.4 g/100 g), fiber (16.1–22.9 g/100 g), carotenoids (234.1–987.9 μg/g), and essential minerals, including calcium (499.8–545.4 mg/100 g), potassium (1193.4–1211.0 mg/100 g), magnesium (274.5–340.5 mg/100 g), and iron (129.1–146.1 mg/kg). Anti-nutritional factors, including cyanide (10.1–61.0 mg/kg in leaves vs. 1.8–47.5 mg/kg in roots), condensed tannins, oxalates, and phytate, were higher in leaves but significantly reduced through processing. Fermentation followed by boiling and drying decreased cyanide levels by up to 83.4%, while tannins, oxalates, and phytate were reduced by 59.6, 83.4, and 88.9%, respectively. Variety kello demonstrated a better overall nutritional profile than qulle, except for carotenoids, which were higher in qulle. These findings highlight the influence of genetic background and processing techniques on cassava’s nutritional quality. To optimize cassava’s dietary benefits, further research should explore diverse germplasm and refine processing methods to maximize nutrient retention while minimizing anti-Xnutritional factors.
1 Introduction
Rapid population growth, climate change, and rising health risks are threatening global food security. To safeguard their citizens during a crisis, many nations impose economic restrictions, particularly on food trade. Malnutrition and hidden hunger are most prevalent in developing countries, leading to developmental stunting in children, and weakened immunity against diseases (Teye et al., 2020). One of the greatest challenges today is sustainably increasing food production to meet the demands of a growing world population. Recent estimates suggest that by 2050, global food production will need to double to ensure sustainable food security. According to Burns et al. (2010), food security exists when “all people, at all times, have physical and economic access to sufficient safe and nutritious food to meet their dietary needs and food demands for a healthy and active life.”
The United Nations (UN) has established the Sustainable Development Goals (SDGs) to address societal, economic, and environmental challenges, with food systems playing a central role (United Nations Development Program, 2015). These goals aim to create healthier, more equitable, and environmentally sustainable food systems by promoting practices such as combating desertification, reversing land degradation, and preserving biodiversity (Michel et al., 2021; Adebayo, 2023). Achieving these targets is critical for reducing food insecurity, poverty, and improving the livelihoods of smallholder farmers, particularly in sub-Saharan Africa (SSA), where urban and peri-urban areas face a worsening double burden of malnutrition (Mbanjo et al., 2021).
Despite SSA’s rich biodiversity, including numerous underutilized, nutrient-dense plant species, malnutrition remains pervasive due to reliance on low-nutrient staple crops (Abass et al., 2018). The Global Facilitation Unit for Underutilized Species (GFU) highlights these plants as untapped resources for combating hunger, as they offer essential micronutrients often absent in traditional diets (Uchechukwu-Agua et al., 2015). Shifting from import-dependent foods (e.g., wheat flour) to locally sourced alternatives could strengthen food security, empower smallholder farmers, and stimulate agri-food value chains (Noort et al., 2022). For many African nations, this transition represents a dual opportunity: reducing costly food imports while leveraging indigenous crops to tackle malnutrition and poverty on a larger scale.
The majority of the world’s population relies on a plant-based diet. Cassava (Manihote sculenta Crantz) is a tuberous root crop belonging to the family Euphorbiaceae, genus Manihot. It is the third most important source of calories in the tropics and the sixth most important food crop after sugar cane, maize, rice, wheat, and potato, in terms of global annual production. Due to its versatile nature, it is frequently referred to as the “drought, war, and famine crop” in much of the developing world. As it is a major staple crop, it has the potential to play a crucial role in addressing food security challenges in the face of climate change. It can grow in poor soils, is easily propagated, requires minimal cultivation, and can tolerate both periodic and prolonged droughts. It is simple to cultivate, produces well in favorable conditions, and even produces edible roots in poor soils with dry conditions. As a result, it is drought-resilient, and its mature roots can maintain their nutritional content without water for an extended period of time, suggesting that it could be the future food security crop in some developing countries (Pushpalatha and Gangadharan, 2020).
According to studies, cassava can tolerate temperatures up to 40 °C before the rate of photosynthesis begins to decline. It also features a built-in system to address water scarcity by shedding leaves. It can withstand salt levels of up to 150 mM, with the younger ones able to resist up to 40 mM. It can live in locations with rainfall ranging from 500 to 5,000 mm (Pushpalatha and Gangadharan, 2020). Cassava is expected to supply the world’s protein requirements. In comparison to cassava leaves, the roots have a higher carbohydrate content; however, the leaves and by-products of root harvest have a higher protein level (approximately 14–40%), minerals, vitamins B1, B2, and C, and carotenes. The leaves are regarded as a vital protein source when compared to other green vegetables (Karri and Nalluri, 2016).
Although cassava offers economic and nutritional advantages, it remains challenging to incorporate these promising yet underutilized species into our regular diet. Due to its toxic substances, which restrict its use (Ndam et al., 2019), variable toxicity levels of cassava have been reported in literature, with total content depending on altitude, geographical location, period of harvesting, type of varieties, and seasonal conditions (Turyagyenda et al., 2013). The high fiber content, tannins, and lack of amino acid availability make its leaves difficult to digest. As a result, effective detoxification techniques that retain all essential nutrients must be developed.
Nowadays, food security is a major problem in many developing countries, mainly due to rapid population growth and global climate change. To resolve this, many communities are increasingly focusing their efforts on developing new strategies to enhance the utilization of locally cultivated crops. Despite the fact that Ethiopia has a variety of nutritious underutilized crops that are rich sources of micronutrients and other health-related components are not utilized to their potential. As a result, Malnutrition remains a significant problem in many areas of countries where these crops can grow, due to a lack of awareness about their nutritional profile, appropriate processing techniques, and utilization (Bechoff, 2017).
Several crops are underutilized in the majority of areas where they are grown due to a lack of awareness about their complete nutritional and anti-nutritional values, as well as information on processing. Growing drought-resistant crop varieties and employing appropriate food processing methods and equipment may help mitigate health risks (Neves et al., 2021). To our knowledge, there are limited studies that quantify the impact of various processing techniques (e.g., fermentation and drying) on nutrient retention (e.g., vitamins and minerals) in cassava. Therefore, the aim of this study was nutritional enhancement of cassava through processing so as to contribute to sustainable food systems through addressing the following specific objectives. The objective of the study was (1) to determine the nutritional profile of the root and leaves of the two cassava varieties (kello and qulle) dominantly grown in Ethiopia, (2) to determine the effect of processing techniques on nutritional, physicochemical and functional properties of the two varieties, (3) to analyze the effect of processing techniques on anti-nutritional contents of the roots and leaves and (4) to provide accurate data and basic information for policymakers, and consumers as well as researchers and stakeholders.
2 Materials and methods
2.1 Sample collection
Cassava (Manihot esculenta Crantz) root and leaf samples were collected from the experimental farm of Areka Agricultural Research Center using purposive sampling. This study utilized two cassava cultivars, qulle and kello, and all experiments were carried out at Addis Ababa Science and Technology University.
2.2 Experimental design
The study employed a 3 × 2 factorial design incorporating three processing techniques and two varieties. Three distinct drying protocols were evaluated to determine their comparative efficacy in terms of nutrient retention and detoxification (see Table 1).
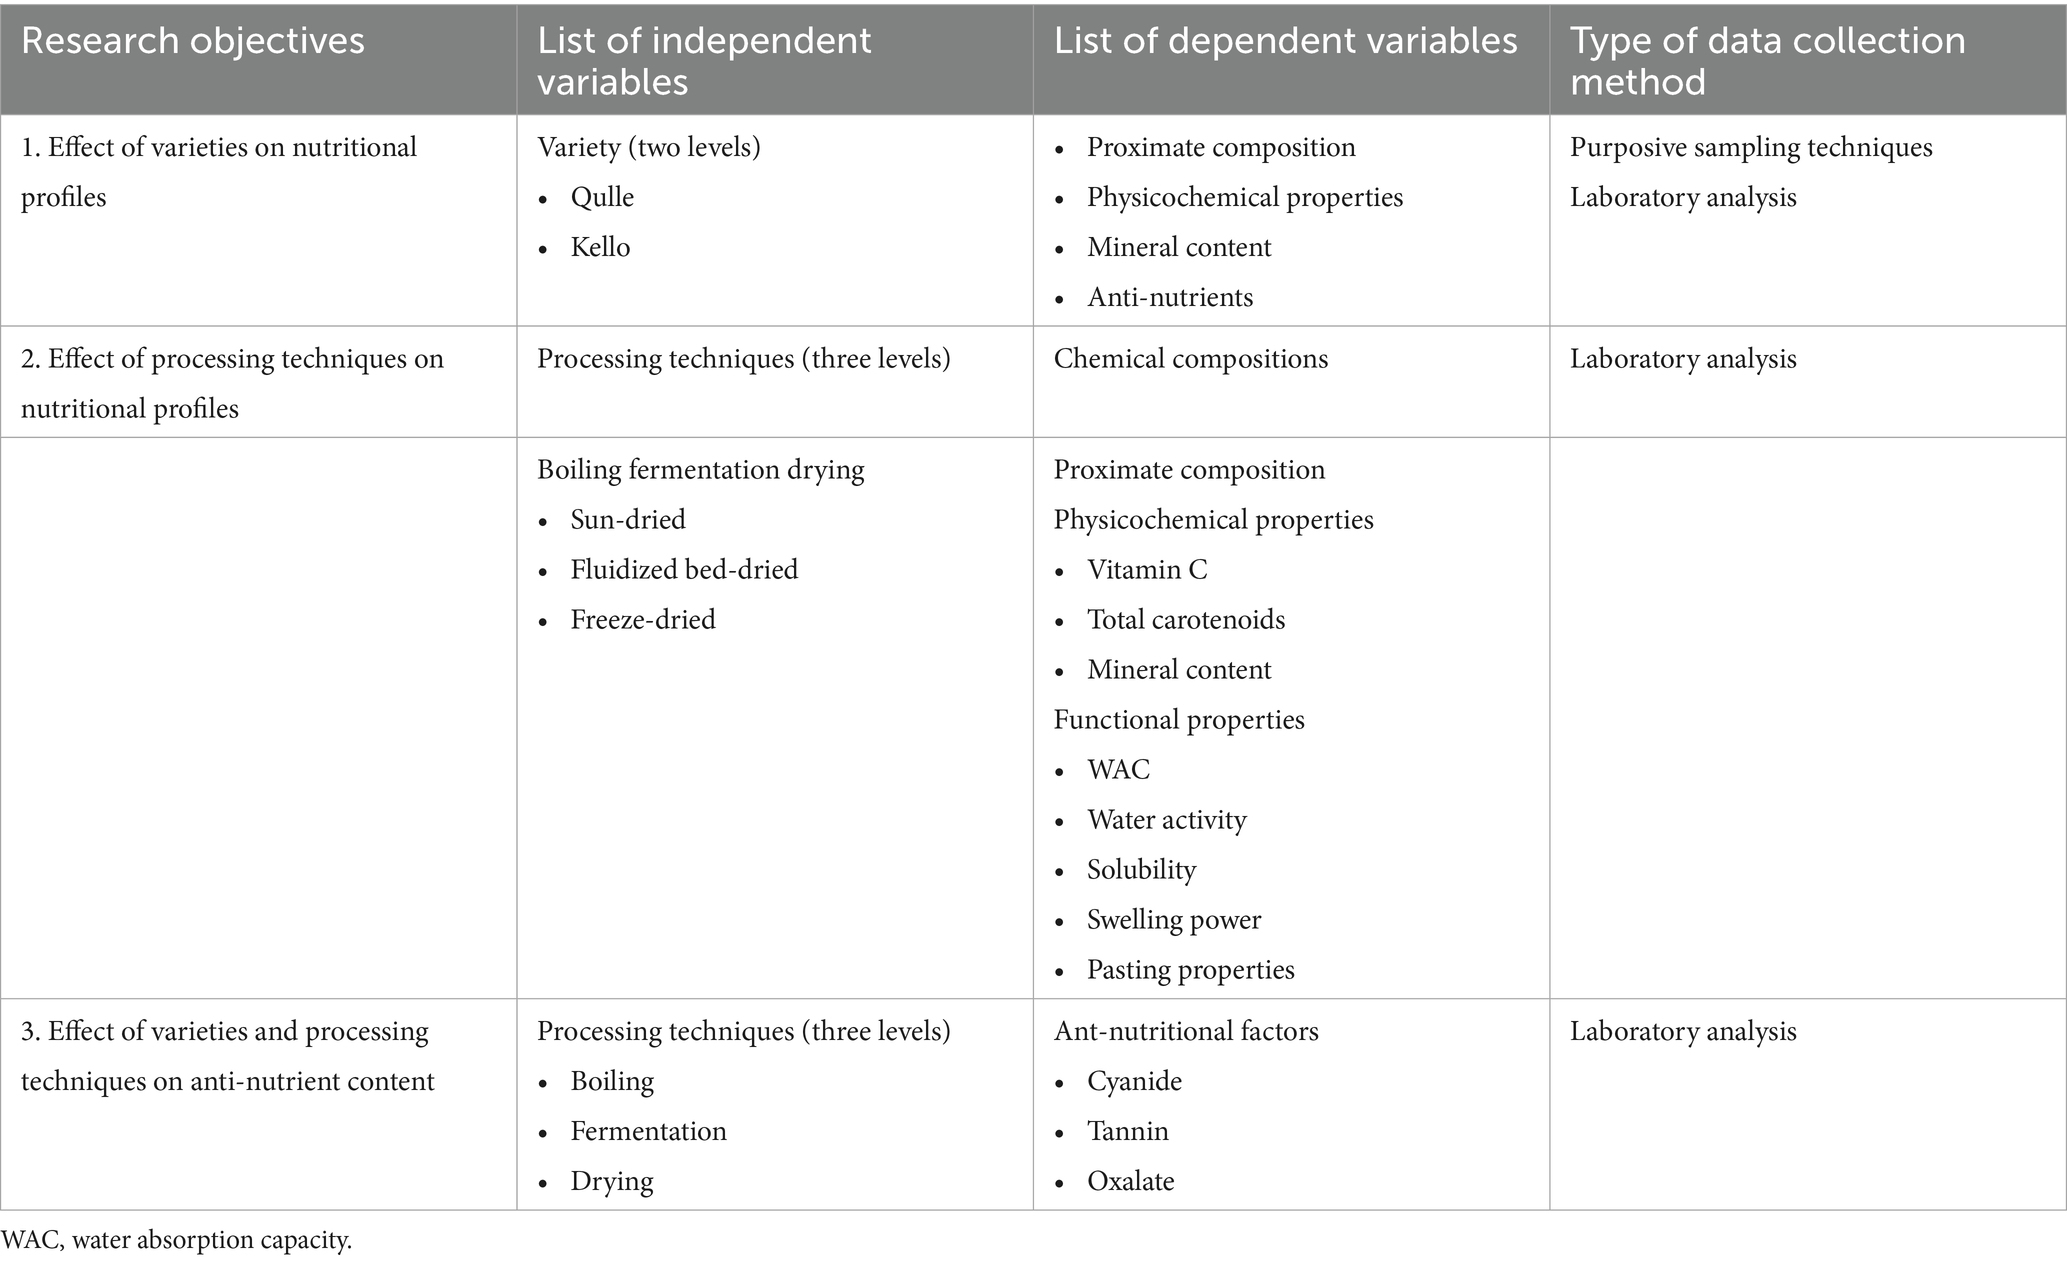
Table 1. Variable description.
2.3 Sample preparation
To prepare the cassava roots for further processing, they were first peeled, washed, grated, and sliced. A measured quantity of grated cassava pulp was soaked in deionized water at room temperature for 72 h, with the water changed every 24 h. The pH of the expressed juice was measured at 24-h intervals to monitor the progress of fermentation. Three drying techniques, sun-drying, fluid bed-drying, and freeze-drying, were employed. Finally, the dried cassava roots were milled to a particle size of 250 μm and stored in plastic bags until used for the experiment.
Cassava leaf samples were prepared according to the method described by Pitirini et al. (2021). The leaves were manually separated from the stems and washed in deionized water, homogenized, and then divided into portions for further processing, including boiling, fermentation, and drying. For the boiling process, the leaves were leached under running water by squeezing them in a sieve until the water became colorless, followed by boiling for approximately 5 min. A 700 g sample was then weighed, placed in a Teflon-coated pan, mixed with 1,000 mL of deionized water, and cooked for 15 min in a single boil on a domestic cooker. For fermentation, the leaves were soaked in deionized water for 72 h at room temperature, with the water replaced every 24 h, while the pH of the extracted juice was monitored at 24-h intervals to track the fermentation process. The raw and fermented samples were dried using three methods: sun-drying for 7 days, fluidized bed drying at 50 °C for 180 min, and freeze-drying for 10 h. This is because a temperature range of 40–80 °C for 180 min is effective in reducing hydrogen cyanide (HCN) levels in cassava leaves, as reported by Boakye Peprah et al. (2020). Finally, the dried leaves were ground into a powder using a laboratory mill and stored in plastic bags for subsequent analysis.
2.4 Proximate composition analysis
2.4.1 Moisture content
The moisture content of the cassava root and leaf flour samples was determined following the AOAC (2016) method. Approximately 5 g of each sample was weighed into a pre-dried dish, which was then placed in an air oven maintained at 105 °C and left to dry for 5 h. After drying, the samples were then cooled in a desiccator and reweighed. This process was repeated, with the dishes returned to the oven, until successive weight measurements showed a variation of less than 0.05%, indicating that equilibrium had been reached. The moisture contents of the samples were then calculated as the percentage loss in weight relative to the original sample weight.
2.4.2 Ash content
The ash content was determined according to the AOAC (2016) method. Approximately 2.5 g of cassava flour was weighed into a pre-dried, pre-weighed crucible. The crucible containing the sample was then placed in a muffle furnace and ignited to 550 °C ± 10 °C until white ash was produced. After combustion, the sample was cooled in a desiccator for 30 min and weighed. The cooling and weighing process was repeated until consecutive measurements showed a difference of less than 1 mg, indicating constant weight. The ash content of the sample was then calculated and expressed as a percentage of the original sample weight.
2.4.3 Protein content
The crude protein content was determined following the AOAC (2016) method. A 1 g sample was weighed and transferred into a Kjeldahl digestion flask containing 8 g of catalyst mixture (96% anhydrous sodium sulfate, 3.5% copper sulfate, and 0.5% selenium dioxide). Then, 20 mL of sulfuric acid was added, along with glass beads to prevent bumping during digestion. The digestion process began with maximum heating power to ensure the rapid breakdown of organic matter. Heating continued until the solution became clear, indicating that the digestion was complete. After cooling, the digestion vessel was connected directly to the nitrogen determination apparatus for distillation. The resulting ammonium sulfate ((NH4)2SO4) was treated with sodium hydroxide (NAOH) to liberate ammonia, which was then distilled into a receiving flask containing 50 mL of boric acid solution with methyl red indicator. The condenser delivery tube was positioned below the surface of the boric acid solution to ensure efficient absorption of ammonia. Then, the digest was diluted with distilled water to about 30 mL, and the pH was adjusted to neutral with sodium hydroxide. Distillation continued until about 300 mL of distillate was collected. Finally, the crude protein content was calculated by multiplying the determined nitrogen percentage using a conversion factor of 6.25.
2.4.4 Fat content
The crude fat content was determined according to the AOAC (2016) method. A 3 g of a homogenized, dried cassava sample was accurately weighed and placed into an extraction thimble for fat determination. The sample in the thimble was covered with fat-free cotton wool to prevent particle loss during the extraction process. A pre-weighed extraction flask crucible was filled with 100 mL of hexane, and the extraction apparatus was assembled and automatically heated for 3 h. Following extraction, the solvent was evaporated, and the flasks containing the lipid extract were dried in an oven at 105 °C for 1 h to remove residual solvent. The flask was then cooled to room temperature in a desiccator and reweighed. The crude fat content was calculated using the formula:
where w is the weight of the sample in grams.
2.4.5 Crude fiber content
The crude fiber content was determined according to the AOAC (2016) A 2 g of the sample was accurately weighed into a 500 mL conical flask containing 150 mL of 1.25% sulfuric acid solution. The mixture was boiled for 30 min. The digested mixture was filtered through a Buchner funnel lined with a pre-weighed filter paper, and the residue was thoroughly washed with hot distilled water. The retained residue was then transferred into a conical flask, and 150 mL of 1.25% potassium hydroxide (KOH) solution was added, and boiled for 30 min from the onset of boiling. The mixture was filtered again through a Büchner funnel with fresh filter paper. The residue was quantitatively transferred to a pre-weighed crucible and dried in an air oven set at 105 °C for 2 h. After cooling in a desiccator, the crucible and contents were weighed. The crucible contents were then ignited to 550 °C for 3 h and cooled in a desiccator and reweighed. The fiber content was calculated as the percentage loss on ignition relative to the original sample weight, using the formula:
where F0 is the weight of the dry sample; F1 is the weight of crude fiber plus ash after oven-dried; and F2 is the weight of the sample after ignition in the furnace.
2.4.6 Carbohydrate content
The carbohydrate content was calculated by difference, following the standard approach outlined in AOAC (2016) guidelines. This method involves subtracting the sum of fat, moisture, crude fiber, ash, and protein from 100% to estimate the total carbohydrate content in 100 g of the food sample.
2.4.7 Caloric value
The net energy value (in kJ/100 g) was calculated using the standard method of Yang et al. (2021). This was done by summing the contributions of carbohydrate, crude lipid, and crude protein, each multiplied by its respective energy conversion factor.
2.4.8 Mineral content
The mineral content was analyzed using triple acid digestion (wet digestion method) as per AOAC (2016), where 0.5 g of cassava flour was weighed and digested with 0.7 mL concentrated HNO₃ on a hot plate for 1 h until a nearly clear solution was obtained. Despite the absence of visible solid particles, the digest was filtered through Whatman filter paper, diluted with deionized water until the solution volume reached the standard mark, and analyzed via Microwave Plasma Atomic Emission Spectroscopy (MP-AES, Agilent Model 4,200). Quantification was performed using aqueous calibration standards, with signal responses measured at the respective wavelengths for each element: Ca (393.366 nm), Fe (371.993 nm), K (766.491 nm), Mg (285.213 nm), Na (588.995 nm), and Zn (213.857 nm), from which mineral concentrations were calculated.
2.5 Determination of functional properties
2.5.1 Pasting properties and mixing stability
The pasting properties of the samples were determined using a Rapid Visco Analyzer (RVA 4500, Perten Instruments AB, Australia) following the method described by Hasmadi et al. (2020). Each sample (3.5 g of flour, adjusted to 14% moisture basis) was mixed with 25 mL of deionized water to achieve a total weight of approximately 28 g. The mixture was placed in a canister, homogenized with the paddle, and loaded into the RVA. The temperature profile consisted of heating and cooling at a constant rate of 11.25 °C/min. Pasting parameters, including peak viscosity, breakdown, and final viscosity, setback, and pasting temperature (PT) were recorded using the accompanying software. The 13-min protocol maintained an initial rotation speed of 960 rpm for 10 s, followed by 160 rpm for the remainder of the duration, with viscosity measurements recorded every 4 s as the temperature increased from 50 °C to 95 °C. All data were collected and analyzed using Thermocline software.
2.5.2 Swelling power and solubility
The swelling power and solubility of the flour samples were determined following the standard procedures. A 1 g of each flour sample was weighed into a 15 mL centrifuge tube and thoroughly mixed with 10 mL distilled water using a vortex mixer. The mixture was heated in a water bath (Gerber Instrument, Model WB-12, EU P.R.C) at 85 °C for 30 min, then cooled to room temperature and centrifuged using a bench-top centrifuge (Centurion Scientific, Model Pro-Analytical C2004, UK) at 3,000 rpm for 15 min. The clear supernatant was carefully decanted into a clean, pre-weighed Petri-dish. The supernatant in the Petri dish was evaporated in a hot air oven at 100 °C for 30 min, cooled down, and weighed using an analytical balance. The weight of soluble substances in the supernatant was calculated by subtracting the weight of the insoluble substances. The remaining paste in each centrifuge was weighed to determine the swelling power. Both swelling power and solubility were expressed as percentage weights.
2.5.3 Water absorption capacity (WAC)
The water absorption capacity (WAC) of flour samples was determined according to Yacoub et al. (2018). A total of 1 g of each flour sample was weighed into 15 mL centrifuge tubes and mixed with 10 mL distilled water. After standing undisturbed at room temperature for 30 min, the mixtures were centrifuged at 3,000 rpm for 30 min using a bench-top centrifuge (Centurion Scientific, Model Pro-Analytical C2004, UK). The supernatant was carefully decanted, and the weight of the remaining sediment was measured. The analysis was done in duplicate, with results expressed as percentage weight gain relative to the original sample weight.
2.5.4 Titratable acidity (TTA)
The total titratable acidity was determined following the method of Linus-Chibuezeh et al. (2017). During fermentation, 5 mL aliquots of the sample extract were collected every 24 h. Each aliquot was transferred to a conical flask, and five drops of phenolphthalein indicator were added. The solution was then titrated against 0.1 N sodium hydroxide until a persistent pink endpoint was reached. Titratable acidity was calculated using the following relationship:
2.6 Water activity
Water activity was measured using an AquaLab water activity meter (Decagon Instruments, Inc.) according to AOAC (2016) guidelines and the manufacturer’s manual.
2.6.1 Vitamin C determination
Vitamin C content was determined by iodometric titration, following the AOAC (2016) method, using 0.005 M iodine solution as titrant and 0.5% (w/v) starch solution as the indicator. The iodine solution was prepared by dissolving 1.3 g iodine and 2 g potassium iodide in minimal distilled water, then transferred to a 1 L volumetric flask and diluted. The starch indicator was prepared by dispersing 0.25 g soluble starch in 50 mL near-boiling water, followed by cooling to room temperature. For analysis, 1 g of cassava flour was dissolved in 100 mL of distilled water, and a 20 mL of aliquot was transferred to a 250 mL conical flask containing 150 mL of distilled water and 1 mL of starch indicator. The mixture was titrated with a 0.005 M iodine solution until the first permanent blue-black endpoint (formation of the starch-iodine complex). Vitamin C content was calculated based on the equation:
where v1 is the volume of iodine solution that reacts with the standard vitamin C, v2 is the volume of iodine solution that reacts with the sample solution, and vs is the volume of vitamin C in the sample.
2.6.2 Total carotenoid content
The total carotenoid content was determined following the method of Boakye Peprah et al. (2020) with modifications. One gram of each ground sample was extracted with 25 mL of methanol under vacuum filtration into a conical flask lined with filter paper. To ensure complete carotenoid extraction, the residue was further treated with 25 mL of acetone. The combined filtrate volume was recorded as the first extract. The extract was then transferred to a separator funnel, where 20 mL of petroleum ether was added prior to sample introduction. After adding distilled water, phase separation yielded a yellowish organic layer (carotenoid-rich) and a colorless aqueous layer. After draining and discarding the aqueous phase, the carotenoid solution was repeatedly washed with distilled water until it became clear and colorless. The purified organic phase was collected, and its volume was recorded as the second extract. Absorbance measurements were performed in triplicate at 450 nm using a JASCO V-770 spectrophotometer (Japan Jasco Corporation Company) (a 1 cm glass cuvette was used). Total carotenoid content was calculated using the formula:
where TCC is the total carotenoid content; A is the absorbance; V is the total extract volume after the second extraction; P is the sample weight; and A1%1 cm = 2,592 (β-carotene extinction coefficient in petroleum ether).
2.7 Determination of anti-nutritional factors cyanide content
2.7.1 Cyanide content
The alkaline titration method was used to quantify the cyanide content in cassava root and leaf flours (AOAC, 2016). Briefly, 10 g of ground samples were soaked in 200 mL distilled water containing 10 mL of orthophosphoric acid for 12 h to liberate the bound cyanides. The mixture was distilled until 150 mL of distillate was collected. The distillate was treated with 20 mL of 0.02 M sodium hydroxide and was diluted to 250 mL with distilled water. For analysis, the solution was divided into three aliquots (two 100 mL portions and one 50 mL portion). To each 100 mL aliquot, 8 mL of 6 M ammonium hydroxide and 2 mL of 5% potassium iodide were added, while the 50 mL aliquot received 4 mL of ammonium hydroxide and 1 mL of potassium iodide. Titration was performed with 0.02 M silver nitrate, with 50 mL portions for preliminary trials. A persistent faint turbidity served as an indicator of the endpoint. Cyanide content (mg/100 g wet weight) was calculated using the conversion factor: 1 mL 0.02 N AgNO₃ = 1.08 mg HCN.
2.7.2 Tannin content
The tannin content was determined following the method of Rival et al. (2019) with minor modifications. A 1,000 ppm stock solution was prepared by dissolving 0.05 g of tannic acid in 50 mL of a solution containing 2 mL of 10% sodium carbonate, 2.5 mL Folin–Ciocalteu reagent (Sigma-Aldrich, Germany), and 45.5 mL 70% acetone. Working standards (1.0–5.0 ppm) were prepared from the stock solution using serial dilution (M₁V₁ = M₂V₂). For sample analysis, 0.5 g of cassava flour was extracted with 50 mL of distilled water by mechanical shaking for 1 h. The extract was filtered into a 50 mL volumetric flask and diluted to volume. A 5 mL aliquot was mixed with 2 mL of 0.1 M FeCl₃ in 0.1 N HCl and 0.008 M potassium ferrocyanide. Absorbance was measured at 725 nm using a JASCO V-770 spectrophotometer. Tannic acid content was quantified using a standard curve (absorbance vs. concentration) and expressed as mg tannic acid equivalents per 100 g sample (mg TA/100 g).
2.7.3 Phytate content
Phytic acid content was determined using the method described by Adegbaju et al. (2019). Briefly, 4 g of cassava flour was extracted with 100 mL of 2% HCl for 3 h and filtered. An aliquot (25 mL) of the filtrate was mixed with 5 mL of 0.3% NH₄SCN and 53 mL of distilled water, then titrated against a 0.01 M FeCl₃ solution until a stable brownish-yellow endpoint (≥5 s) was observed. Phytin phosphorus content (1 mL titrant = 1.19 mg phytin phosphorus) was determined, and phytic acid content was calculated by multiplying the phytin phosphorus value by 3.55.
Where TV is the volume obtained after the color change.
2.7.4 Oxalate content
Oxalate content was determined using the standard method of Buta (2020). Two grams (2 g) of the flour residue was weighed into a 250 mL volumetric flask containing 190 mL of distilled water and 10 mL of 6 M HCl. The mixture was digested for 1 h in a boiling water bath, cooled, brought to volume, and then filtered. A 50 mL aliquot of the sample was measured into a beaker, and 20 mL of 6 M HCl was added. The mixture was evaporated to approximately half its volume and then filtered. The residue was washed several times with warm distilled water. Subsequently, 3 drops of methyl orange indicator were added to 25 mL of the filtrate, which was then titrated against a 0.05 M KMnO₄ solution until a faint pink color appeared and persisted for 30 s. Finally, the total oxalate content was calculated.
2.8 Statistical analysis
All experimental data were tabulated for analysis. Statistical computations were performed using Statistical Package for the Social Sciences (SPSS) version 26. The significant differences between mean values were assessed through a two-way analysis of variance (ANOVA) followed by Tukey’s multiple-range test (p<0.05) for mean separation.
3 Result and discussion
3.1 Proximate composition of the cassava root and leaves
Proximate compositions of cassava root are presented in Table 2; the following concentration ranges were obtained for cassava root samples: moisture (5.85–7.30%), ashes (0.8–2.4%), proteins (0.25–1.25%), fat (2.01–3.70%), fiber (0.98–2.31%), carbohydrates (81–87.08%), and caloric value (347.25–378.33%). Also, the proximate compositions of cassava leaf samples are presented in the table; the following concentration ranges were obtained for cassava root samples: moisture (6.11–7.79%), ashes (6.22–9.81%), proteins (21.25–28.45%), fat (4.86–7.79%), fiber (16.15–22.95%), carbohydrates (30.62–39.16%), and caloric value (269.18–311.85%).
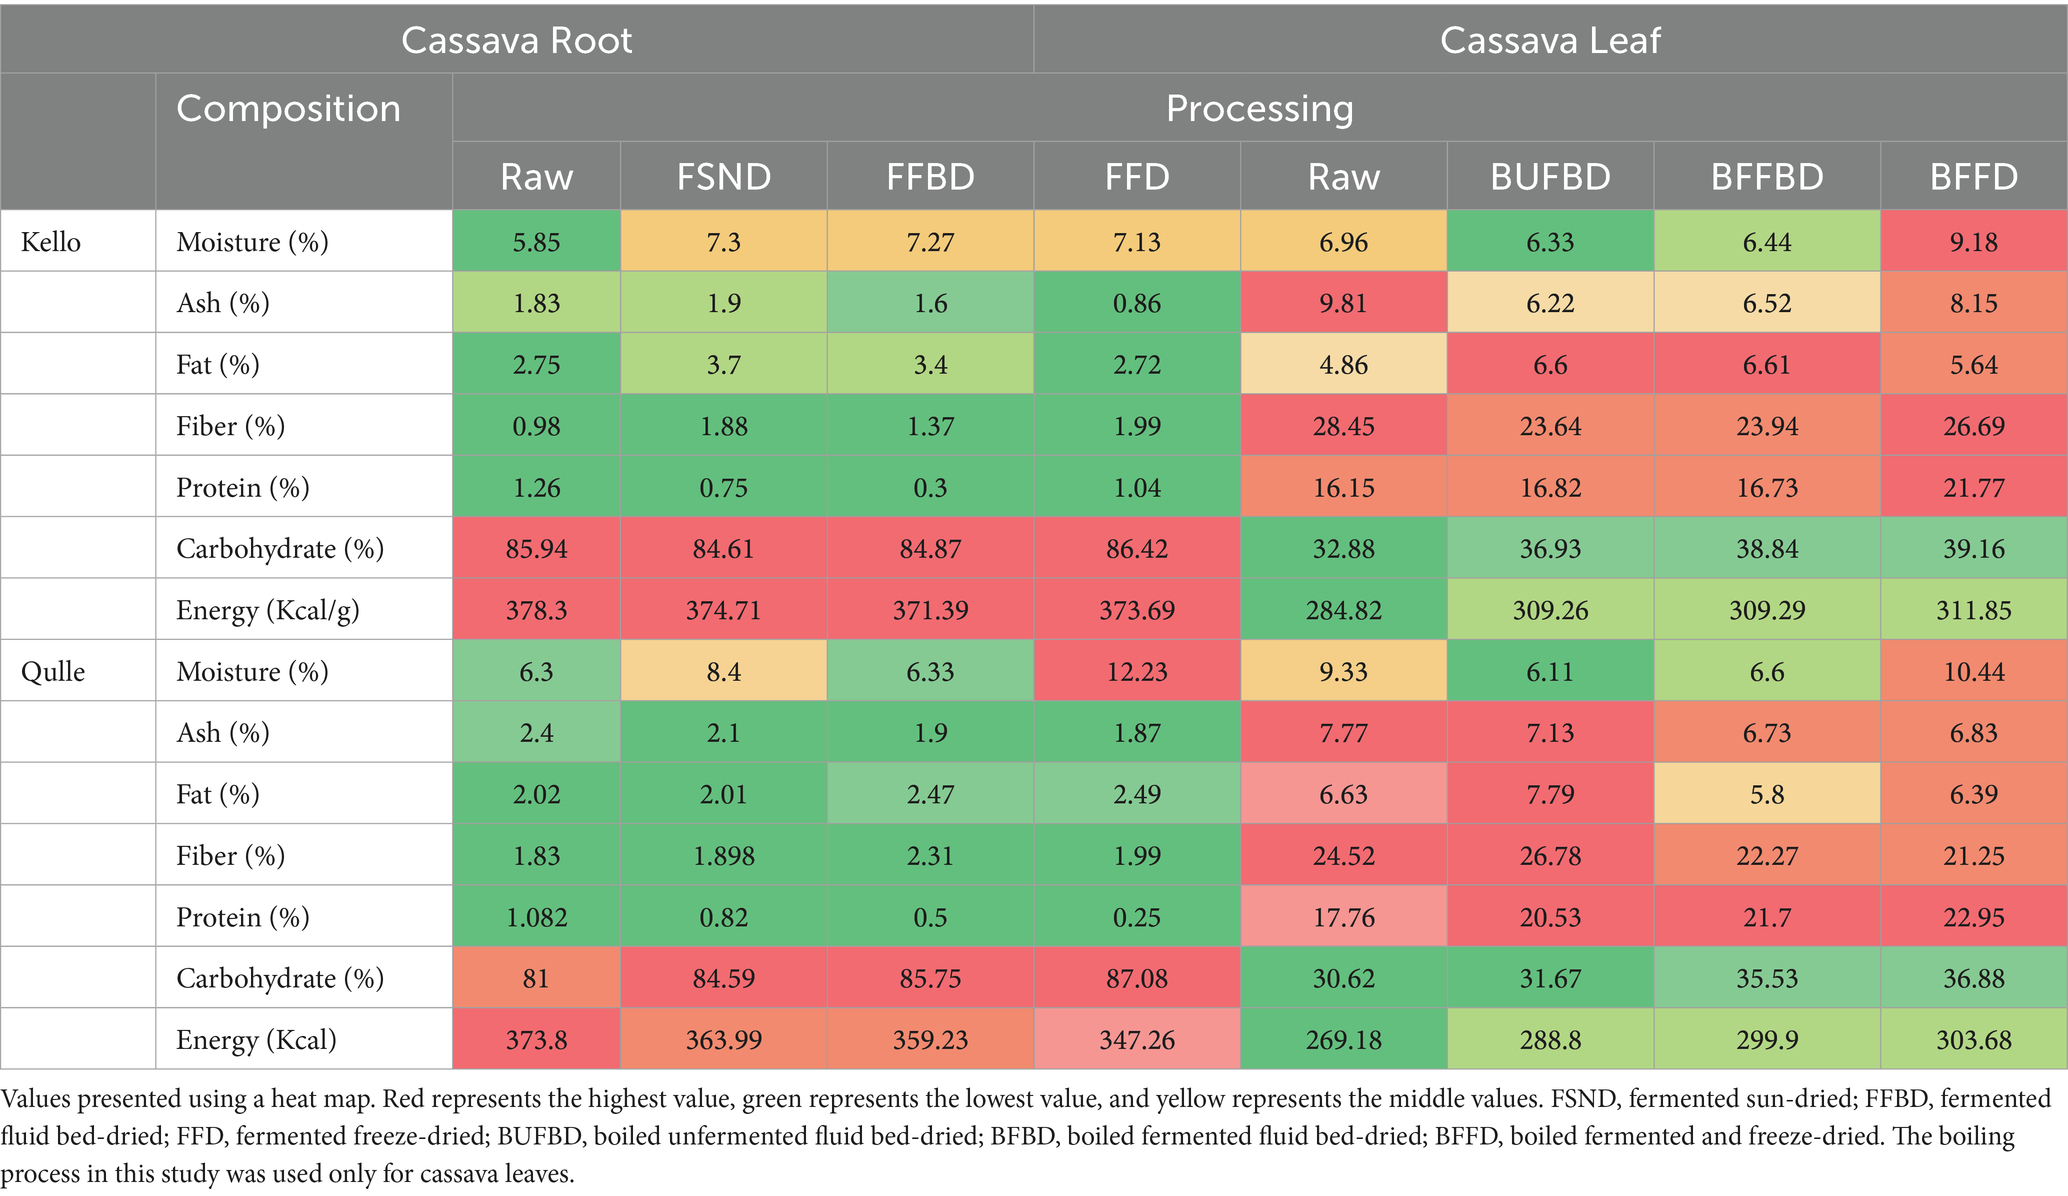
Table 2. Effect of variety and the processing methods on proximate composition of cassava root and leaf flour.
Moisture content was significantly affected (p < 0.05) across all processing conditions and both varieties. According to the report by Hasmadi et al. (2020), the moisture content of cassava root flour ranged from 5.97 to 6.33%. The observed values in this study were comparable with those reported in the literature. However, there was a slight difference due to variations in the variety of cassava samples, the method of drying, and the moisture content of the dried cassava roots before milling into flour. The moisture content of the cassava leaves flour in this study ranged from 6.11 to 7.79%. The maximum moisture content (7.79%) was observed in the boiled fermented and freeze-dried (BFFD) qulle variety, and the minimum value (6.11%) was observed in the Boiled Unfermented Fluid Bed Drier (BUFFBD) in the kello variety. There was a significant difference (p < 0.05) in moisture content between the two varieties and among the processing methods. The moisture content in the present study was slightly lower than that reported by da Silva Santos et al. (2020), where the authors showed that the moisture content for selected local varieties of cassava leaves ranged between 21.5 and 36.4%. The small difference in moisture content of cassava leaves may be attributed to variations in variety and processing methods. The moisture content of the present study (6.11–7.79%) fell within the range reported by Latif and Müller (2015), which was between 5.05 and 11.6%. This indicates that the low moisture content of cassava leaf flour is an important parameter for prolonging shelf life.
The ash content of cassava root flour in this study ranged from 0.8 to 2.4%. The maximum value (2.4%) was observed in fermented fluid bed-dried (FFBD) kello variety, and the minimum value (2.01%) was observed in qulle variety, and the lowest value (0.8%) was observed in fermented freeze-dried (FFD) kello variety. The ash content was significantly different (p < 0.05) for both varieties. The difference in the ash content may be a result of the varietal differences. The values recorded in the present study (0.8 and 2.4%) were comparable to the results obtained by Chisenga et al. (2019a, 2019b), where the authors showed that the ash content ranged between 2.19 and 2.43%. This suggests that cassava root varieties in this study contain a significant amount of minerals. The recorded values were slightly lower than those reported by Buta (2020) for the same cassava root varieties, ranging from 2.43 and 3.45% in kello and qulle, respectively. This slight difference might be a result of several intrinsic and extrinsic factors such as the age of cassava varieties, soil type, fertilizers, and production conditions. The ash content of cassava leaves in the present study ranged from 6.22 and 9.81%. It was significantly (p < 0.05) affected by both variety and processing methods. The maximum ash value was observed in the raw kello variety, and the content was markedly decreased during its fermentation and thermal processing. According to Jamil and Bujang (2016), the ash contents of different cassava leaf varieties ranged from 4.1 to 6.16%. Latif and Müller (2015) report that the ash content of cassava leaves ranged from 5.68 to 6.13%. The results obtained in the present study (6.22 to 9.81) were within the range of findings reported by Okareh et al. (2021), where the authors showed that the average ash content of cassava leaves ranged between 7.36 and 10.5%. This indicates that cassava leaves used in this study contain a significant amount of minerals. A decrease in ash content during processing might be associated with the leaching of some minerals into the water. The relatively high ash content in cassava leaves compared to roots indicates high mineral content. A high mineral element in food enhances growth and development and also catalyzes metabolic processes in the human body.
The fat content in cassava root flour ranged from 2.01 to 3.7%. The maximum value (3.7%) was observed for fermented sun-dried (FSND), and the minimum value 2.01% for FFBD qulle variety. The fat content was significantly different (p < 0.05) for both varieties and across all processing parameters. According to a report by Zainol (2020), the ash content of cassava root flour ranged between 0.55 to 0.69% Chisenga et al. (2019a, 2019b) reported that the range of crude fat contents was 0.15–0.63%. This slight difference might be a result of several intrinsic and extrinsic factors, such as the age of cassava varieties, soil type, fertilizers, and production conditions. The fat content of cassava leaf flour in this study was in the range between 4.86 and 7.79%. The values were significantly (p > 0.05) affected by processing methods and varieties as well. The results (4.86 and 7.79%) were in the range between the results that were reported by Jamil and Bujang (2016), where the authors showed that the fat content of cassava leaf varieties was in the range between 3.84 and 9.1%. The values were slightly greater than the fat content (1.01 and 4.81%) reported by Junior et al. (2019). The slight difference might be due to the differences in variety, processing methods, age, and agroecological factors of cassava leaves.
The fiber content of cassava root flour in this study ranged between 0.98 and 2.31%. The maximum value (2.31%) was recorded for the FFBD qulle variety, and the minimum amount (0.98%) was recorded for the raw kello variety. The fiber content was significantly different (p < 0.05) for both varieties and among all processing methods, as well as for the interaction between variety and processing. The crude fiber content of cassava roots was reported between 3.32 and 3.78% by Chisenga et al. (2019a, 2019b). Onyango et al. (2020) also reported that fiber content ranged from 0.03 to 0.60%. The crude fiber content of cassava root flour ranged from 2.09 to 2.38% according to a report by Hasmadi et al. (2020). The current experimental value (0.98–2.31%) fell within the range of the above-mentioned results. This indicates that cassava root varieties in this study contain a significant amount of dietary fiber.
The crude fiber content of cassava leaves in this study ranged from 16.15 to 22.95%. For both kello and qulle varieties, the crude fiber content was significantly (p < 0.05) affected by all processing conditions. The maximum fiber content was observed for the FFD qulle variety. This indicates that the crude fiber content of cassava varieties can be significantly increased through processing, especially by fermentation. The experimental value was slightly greater than the fiber content of some cassava leaf varieties reported by Okareh et al. (2021): 10.09–16.10%; Jamil and Bujang (2016): 9.16–15.61%; Onyango et al. (2020): 11.60–14.28%; and Latif and Müller (2015): 18.6–19.5%. This slight difference might be due to the difference in variety, agroecological factors, maturity, and processing parameters.
The protein content of cassava root flour in this study ranged from 0.25 to 1.26%. The maximum value, 1.26%, was recorded for the raw kello variety, and the minimum (0.25%) was recorded for the FFD qulle variety. The processing methods had a significant (p < 0.05) effect on protein content, whereas the interaction between variety and processing had no significant (p > 0.05) effect on protein content of cassava root flour. According to reports by Boakye Peprah et al. (2020), the protein content of cassava root flour ranged between 0.01 and 1.45%. This is in contrast to the range reported by Chisenga et al. (2019a, 2019b), which was between 1.21 and 1.87%. The values in the present study (0.25–1.26%) fall within the range reported in the literature. However, the protein content in the present study was slightly lower than that reported by Zainol (2020), where the author showed that the protein content of cassava root was between 2.09 and 2.69%. This slight difference may be due to intrinsic factors such as variety and maturity. The protein contents of Cassava leaves in the present study were varied from 21.25 to 28.45%. These values were similar to the values observed for cassava leaves by Ospina et al. (2021): 21.6–32.5%; da Silva Santos et al. (2020): 21.5–36%; Okareh et al. (2021): 17.13–36.93; Junior et al. (2019): 19.73–29.47%; and Jamil and Bujang (2016): 21.51–28.73%. The protein content of cassava leaves was significantly (p < 0.05) affected by both varieties and all processing parameters. The variation in protein content could be due to the differences in the leaching of some soluble proteins and the degree of denaturation of other groups of proteins following different drying processes. The results in this study lie within the results reported by Latif and Müller (2015), where the authors showed that the protein content of cassava leaves was (17.7–38.1%), which indicates that cassava leaf is a good source of protein.
The carbohydrate content of cassava root flour in this study ranged between 81.0 and 87.08%. It was significantly (p < 0.05) affected by all processing parameters and both varieties. There was an increase in the amount of total carbohydrates when comparing raw to processed cassava root, and the highest carbohydrate content (87.08%) was observed for the FFD qulle variety. The increase in carbohydrate content after the drying and fermentation process may be due to the fact that some high molecular weight carbohydrates, such as starch, are broken down into less complex sugars or other byproducts (Chisenga et al., 2019a, 2019b) reported that the range of carbohydrate content for cassava root flour was between 84.32 and 86.57%. The present experimental value (81–87.08%) lies between the reported values by Manano et al. (2017), where the authors showed that the total carbohydrate content of cassava root ranged between 83.86 and 91.33%. This indicated that varieties and processing methods in this study could retain a significant amount of carbohydrates in cassava root. The carbohydrate content for cassava leaves in this study ranged between 30.62 and 39.16%. It was significantly (p < 0.05) affected by varieties and processing techniques.
The carbohydrate content was relatively greater in the kello variety than that in the qulle variety. The content was increased during processing, which might be due to the breakdown of higher molecular weight carbohydrates into less complex sugars and resulting in the release of sugars from the complex matrix. According to da Silva Santos et al. (2020), the total carbohydrate content of cassava leaves ranged between 47.2 to 68.1%. As reported by Junior et al. (2019), the carbohydrate content of cassava leaves varied from 66.1 to 72.1%. The results in this study (30.62–6.16%) were close to those reported by Jamil and Bujang (2016), where the authors showed that the carbohydrate content of different cassava leaves was reported between 35.17 and 48.80%.
The total caloric value of cassava root ranged between 347.25 and 378.33. The values were significantly different (p < 0.05) for both varieties and for all treatments, and the interaction effect was also significant. The caloric values for cassava leaves in this study ranged from 269.18 to 311.85%. In both varieties, the caloric value was significantly (p > 0.05) affected by processing methods. The values in the present study were slightly lower than findings reported by Junior et al. (2019), where the authors showed that total caloric values for selected varieties of cassava leaves were between 395 and 425 kcal/g. The slight differences might be due to varietal differences, soil type, and agroecological factors.
3.2 Mineral compositions of cassava roots and leaves
Table 3 shows the mineral composition in two local varieties of cassava. Thus, the following concentration ranges were obtained for both root and leave samples in this study: Ca (52.49–54.90 mg/100 g), Mg (38.25–57.74 mg/100 g), K (292.38–296.77 mg/100 g), Na (219.39–239.79 ppm), Fe (14.28–16.65 ppm), and Zn (15.33–18.61 ppm) for cassava roots and Ca (499.85–545.36 mg/100 g), Mg (274.47–340.53 mg/100 g), K (1193.37–340.53 mg/100 g), Fe (89.36–121.96 mg/100 g), Na (129.14–146.12 ppm), and Zn (119.46–132.11 ppm) for cassava leaves with the order of: K > Ca > Mg > Na > Fe > Zn. The mineral composition of both varieties of root in this investigation revealed significant differences (p < 0.05). The variations might be due to the mineral content of the soil from which the plants absorb their nutrients. The values in cassava root were similar to those presented by Nadjiam et al. (2020), where the authors showed that the mineral concentrations of cassava root were Ca (22.4–238.6 mg/100 g), Mg (24.52–165.22 mg/100 g), Fe (75.38–606.37 ppm), and K (22.42–22.44 mg/100 g) and were higher than those reported by Manano et al. (2017), where the authors showed that the mineral content of cassava root were in between Ca (13.15–18.09 mg/100 g), Fe (0.00–0.01 mg/100 g), Zn (0.56–0.87 mg/100 g), and Mg (3.58–3.88 mg/100 g). The values in this study were comparable with those reported by Sebiomo and Banjo (2015), where the authors showed that the mineral contents in cassava root were in the range between Ca (79.196–115.284 mg/100 g), Na (25.58–28.25 ppm), K (69.28–76.41 mg/100 g), Fe (412.70–422.48 ppm), Mg (31.76–33.34 mg/100 g), and Zn (17.52–22.46 ppm).
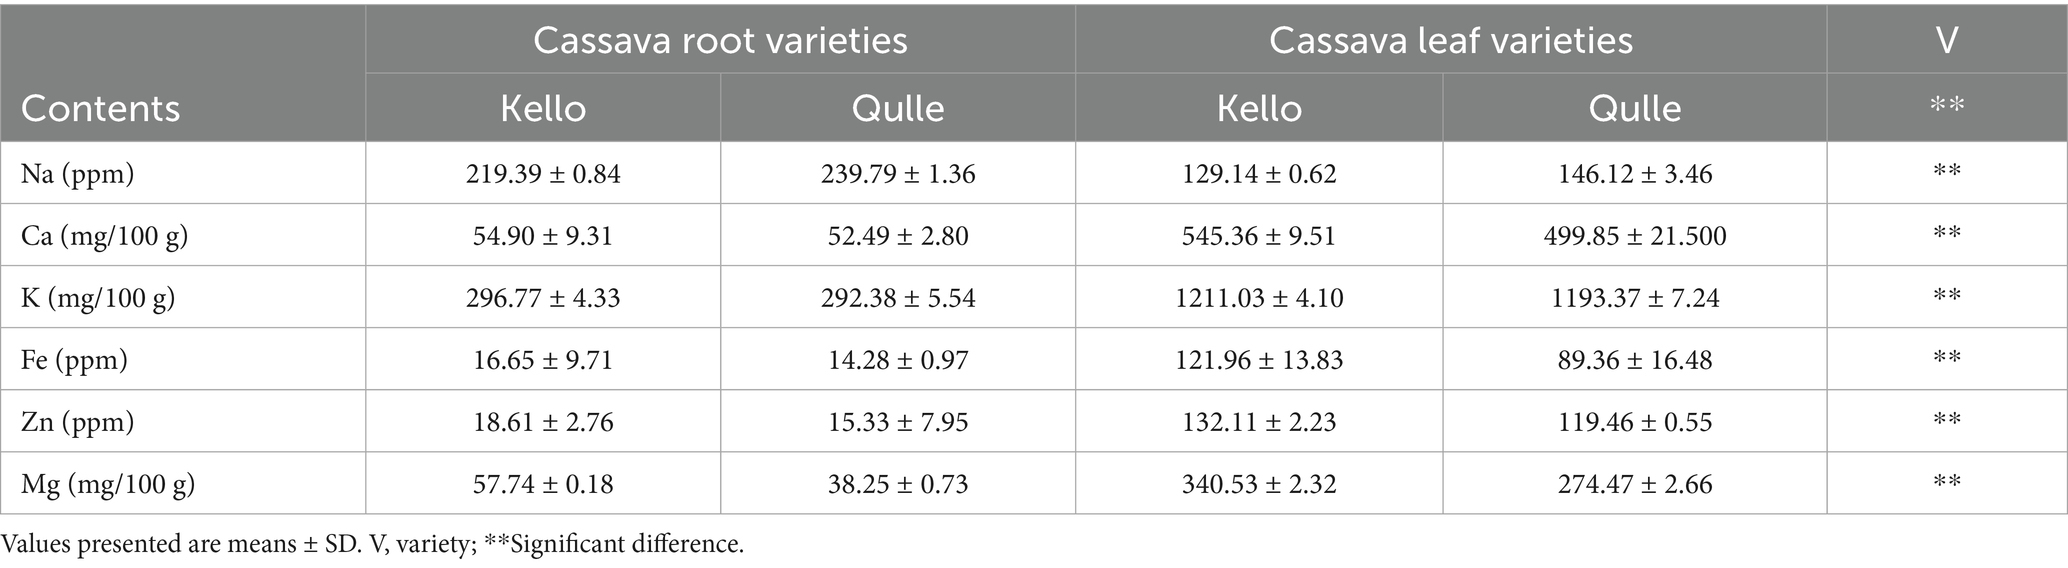
Table 3. Mineral contents of two different cassava cultivars.
Nadjiam et al. (2020) showed mineral concentrations in several cassava leaf varieties were in the range listed in the following: Ca (31.1–1,360 mg/100 g), K (27.08–1870 mg/100 g), Mg (15.77–488.78 mg/100 g), Fe (15.77–488.78 ppm), and Zn (20.2–542.71 ppm). According to Oresegun et al. (2016), cassava leaves contain Ca (680 mg/100 g), Mg (20–70 mg/100 g), K (120–160 mg/100 g), Na (32.78–33.45 ppm), Fe (321.32–458.08 ppm), and Zn (321.32–458.08 ppm) (36.25–68.95 ppm). Latif and Müller (2015) in their investigation reported the mineral content of cassava leaves as follows: K (1,380—2,260 mg/100 g), Ca (430–1,140 mg/100 g), Mg (260–370 mg/100 g), Na (38–120 mg/100 g), Fe (15–27 mg/100 g), and Zn (12–21 mg/100 g). This suggests that the cassava leaves in this study have a comparable mineral makeup, and they could be used to supplement other food recipes. The kello variety had relatively higher levels of mineral content, and for both cassava root and leaf, the kello variant was relatively superior in terms of mineral composition.
3.3 pH and titratable acidity (TTA) of cassava root and leaves
Titratable acidity and pH are two interrelated concepts in food analysis that relate to acidity. The capacity of microorganisms to grow in a certain food can be determined using its pH, whereas titratable acidity is more accurate in predicting how organic acids in the diet affect flavor. The pH and titratable acidity of cassava root and leaves throughout fermentation are illustrated in Table 4. In this study, the pH of the cassava root was dropped rapidly during fermentation from 7.25 to 4.4 and from 6.65 to 4.46 for kello and qulle varieties, respectively. The rapid drop in pH during cassava root fermentation was comparable to that previously reported by Tetchi et al. (2012), where the authors showed that the pH of cassava root dropped from 6.34 to 4.21 during 48 h of fermentation. There was a gradual increase in total acidity during fermentation from 0.041 to 1.8% and from 0.06 to 2.31% for kello and qulle varieties, respectively. The observed changes in pH and TTA during cassava root fermentation in this study were probably due to the accumulation of organic acids.
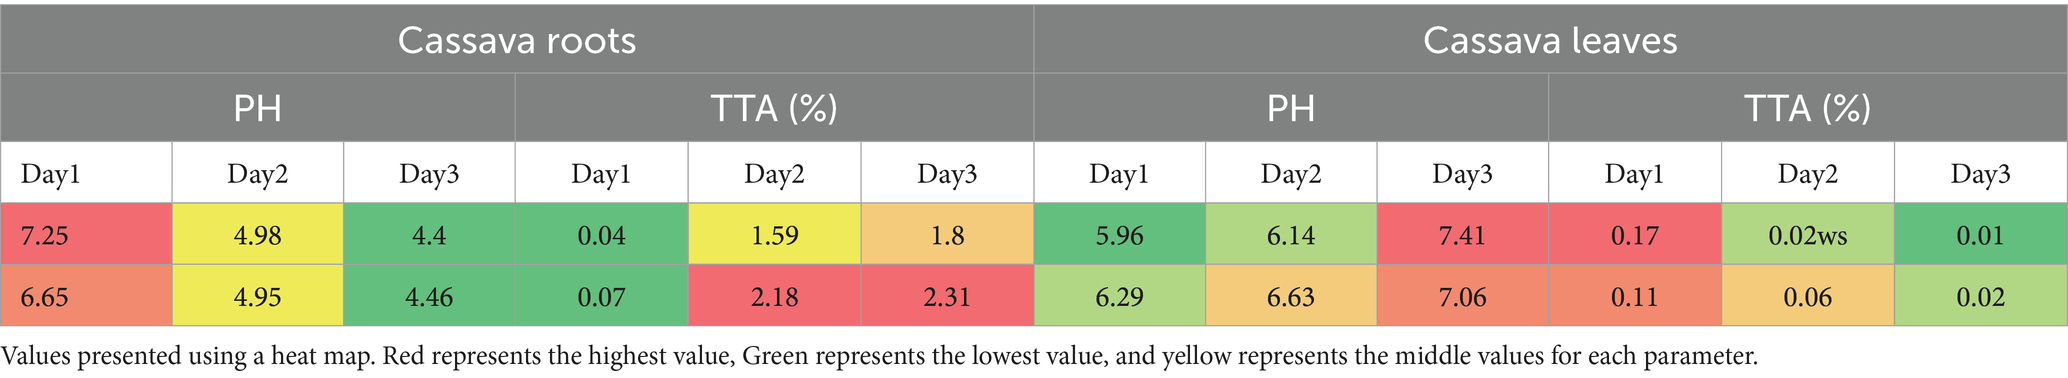
Table 4. pH and titratable acidity (TTA) as affected by fermentation,
The results from this study might ensure that cassava root used in the present study has undergone fermentation to improve nutritional value and to reduce anti-nutritional factors to a safe level of consumption. The pH of cassava leaves did not drop as that of cassava roots in this study because cassava leaves had a lower concentration of carbohydrates or starch to be broken down during fermentation. In this study, the pH of cassava leaves was increased from 5.96 to 7.41 and from 6.29 to 7.06 for kello and qulle varieties, respectively. The TTA of the kello and qulle varieties were decreased slightly during fermentation, from 0.17 to 0.010% and from 108 to 0.0230%, respectively. The values in this study were close to the result previously reported by da Silva Santos et al. (2020), where the authors showed that the ranges were 0.16–1.17% for titratable acidity and 5.91–6.41 for PH. The pH of cassava leaves increased from 6.5–8.5 during fermentation, according to the report by Kobawila et al. (2005), and the value of titratable acidity dropped as alkaline compounds were formed during fermentation. The slightly alkaline PH recorded during cassava leaf fermentation might be attributed to amines produced by bacillus. Bacillus strains can use cyanohydrin as a source of nutrition, particularly Bacillus pumilus. As a result, they could be able to help with cyanide reduction in the fermentation medium (Kobawila et al., 2005).
3.4 Functional properties of cassava root and leaves
Water absorption capacity describes the flour–water association ability under limited water supply. It depends on the power of aggregation between starch molecules. Weak aggregation power between starch molecules causes the surface of its molecules to form a bond with water molecules, which becomes easier, thus increasing the rate of water absorption capacity (Hasmadi et al., 2020). The water absorbing capacity of cassava root flour was presented in Table 5, and the values observed were in the range between 288.5 and 474% and the values were significantly (p < 0.05) affected by all processing methods. The differences in WAC might likely be due to the differences in types of cassava root flour and the processes incorporated. The water-absorbing capacity of cassava leaf flour presented in this study was between 211 and 546%. These values were significantly (p < 0.05) affected by processing methods and varieties. The WAC of the cassava leaves in the present study were in line with the values reported by Leguizamón et al. (2021), where the authors showed that the water absorption capacity of cassava leaves flour was in the range between 404 and 417% and slightly higher in some processing conditions. The minimum variations might be due to differences in processing and analyzing methods. The higher WAC values in this study indicate that cassava leaves might be suitable for the formulation of foods.
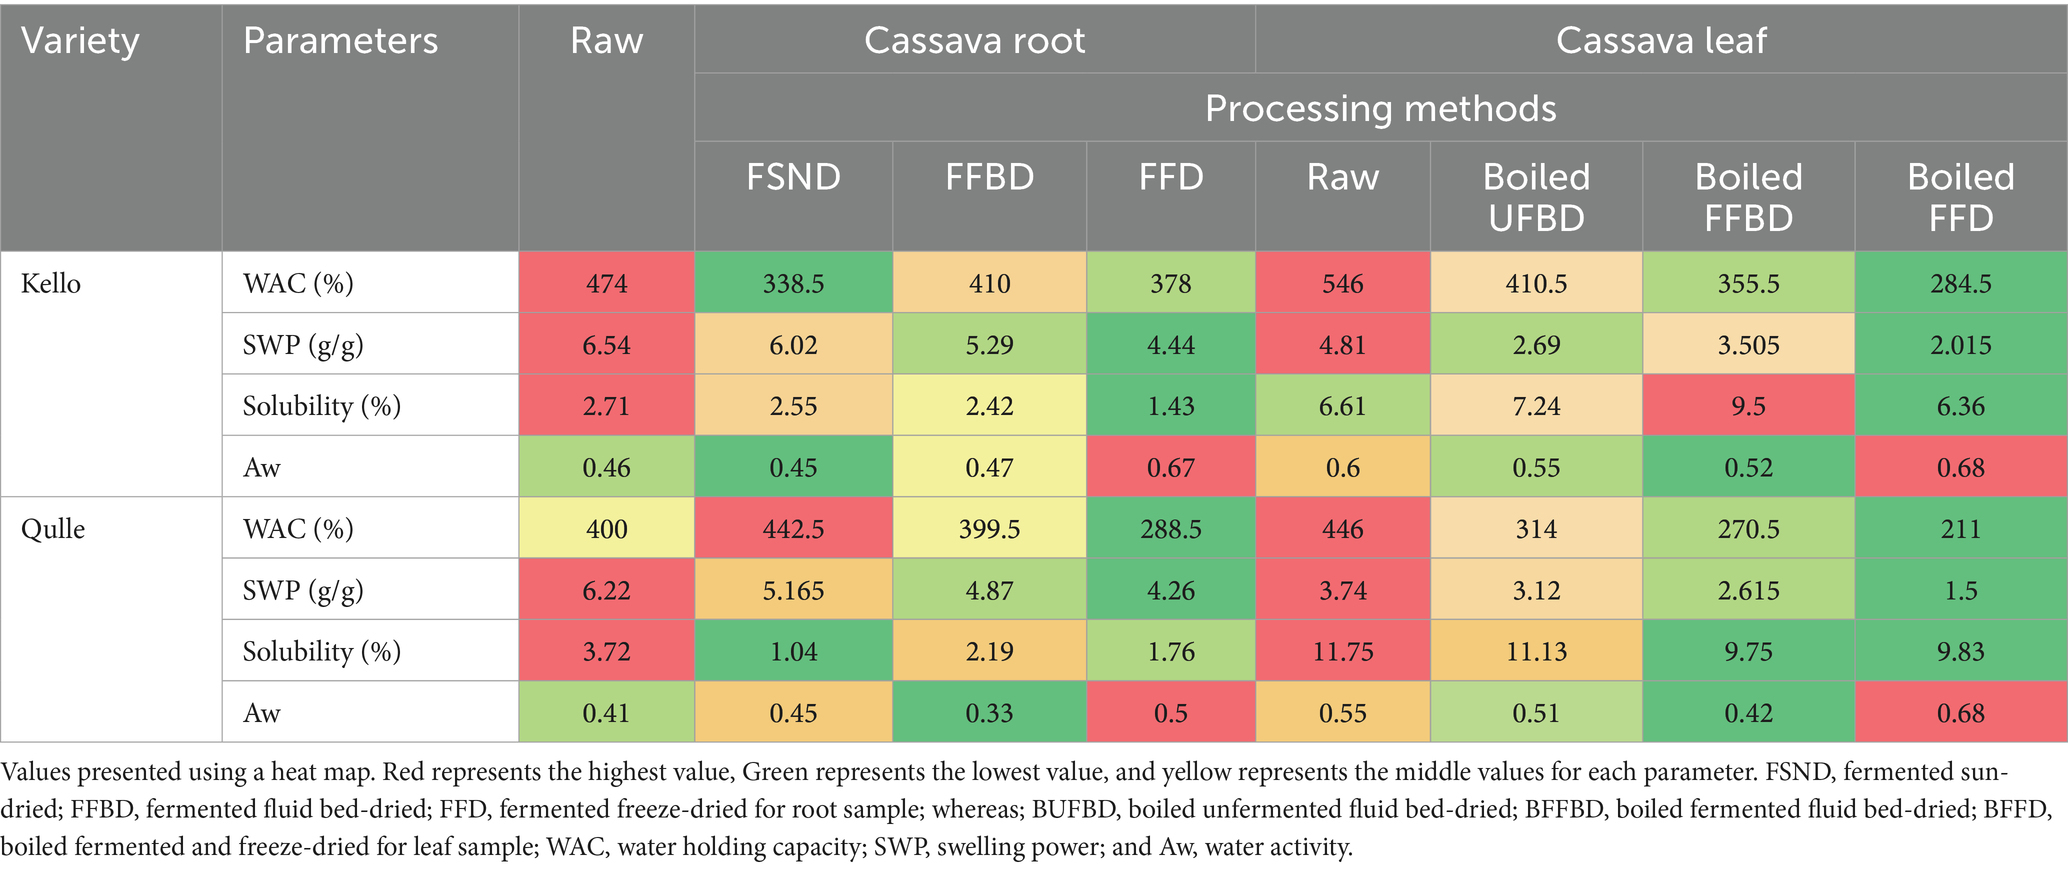
Table 5. Functional properties under different processing conditions in cassava root and leaf flour.
Heating starch molecules in excess water results in the disruption of the crystalline structure and the exposure of the hydroxyl group. The formation of a hydrogen bond by the hydroxyl group and water molecules results in the swelling and solubility of starch granules (Chisenga et al., 2019a, 2019b). Swelling power provides evidence of non-covalent bonding between starch molecules and is influenced mainly by the ratio of amylose to amylopectin (Oyeyinka et al., 2020a, 2020b). Swelling power and water solubility decreased along with increasing fermentation time, caused by a lack of nutrients (Rahma et al., 2017). The solubility of the cassava root flour in this study was in the range between 1.04 and 3.72%. The values were significantly (p < 0.05) affected by processing parameters and interactions. The results were lower than those presented by MaAruf and Abdul (2020), where the authors showed that the solubility of cassava root flour was between 13.3 and 18.18%. The observed variations may be due to differences in the types of processing. The solubility of the cassava leaves flour in this study ranged between 6.36 and 11.75%. The results were slightly lower than the results presented by MaAruf and Abdul (2020), where the authors showed that the solubility of cassava leaf flour was in the range between 13.3 and 18.18%. The observed variations may be due to processing parameters.
The swelling power of the cassava root flour in this study ranged from 4.25 to 6.53 g/g. The values recorded were significantly (p < 0.05) affected by both variety and processing conditions. The values in this study were lower than those reported by MaAruf and Abdul (2020), where the authors showed that the swelling power of cassava root flour was reported between 21.7 and 25.37 g/g. The presence of non-starch components such as proteins and lipids in different varieties and increased amylase activity during processing, such as fermentation, might be responsible for the differences in swelling power (Chisenga et al., 2019a, 2019b). The swelling power of the cassava leaf flour in this study was between 1.5 and 4.8 g/g. The values recorded were significantly (p < 0.05) affected by both variety and processing conditions. The higher solubility and lower swelling power in cassava leaf flour could be important for different food formulations.
Water activity is a measure of the energy status of the water in a system and thus is a far better indicator of perishability than water content (Byju and Suja, 2020). The content of free water used by microorganisms for growth is referred to as water activity. It is linked to feed moisture content high feed moisture content implies high water activity values, and vice versa (Nurrofingah et al., 2019). Growth of fungi and some yeasts usually requires water activity between 0.6 and 0.7. The water activity values of cassava root flour were presented in Table 5, in the range between 0.33 and 0.67. These lower values indicate that cassava root flour is shelf stable with respect to water activity value. The water activity of cassava leaves presented in Table 5 is in the range between 0.33 and 0.50%. The values were significantly (p < 0.05) affected by both varieties and processing methods. Low water activity levels (0.33 to 0.50) were detected for all processing parameters. The water activity of cassava leaf flour in this study (0.33 to 0.50) was close to that reported by Neves et al. (2021), who reported that the water activity of cassava leaf flour was between 0.38 and 0.43. This suggests that cassava leaf flour may have the best storage stability in relation to water activity.
Peak viscosity (PV) is an important rheological property of starchy foods and reflects the behavior of flour and starch paste under various shears, temperatures, and times (Ayetigbo et al., 2018). Peak viscosity is the ability of starch to swell freely before its physical breakdown and measures the maximum viscosity developed during or soon after heating. High peak viscosity is an indication of high starch content and also relates to the water-binding capacity of starch (Kayode et al., 2021). Flour with a lower peak viscosity has a lower thickening power than flour with higher peak viscosity (Nkoudou and Essia, 2017). PV in this study decreased significantly (p < 0.05) from 7,832 cp in the raw qulle variety to 4,875 cp in the FFBD kello variety. This difference could be related to starch molecule breakdown during fermentation, plant maturity, harvest season, paste concentration, and compositional differences in species.
Peak time (Pt) is the corresponding time required for viscosity to reach its peak (maximum). The values of Pt in this investigation ranged from 6.9 min in raw qulle to 9.15 min in raw kello, and the mean peak time of cassava root flour from two cassava variants was 8.59 min; however, they were not significantly different (p > 0.05) among varieties, while they were significantly different (p < 0.05) throughout the processes. The average peak time in this study was slightly greater than that reported by Rachman et al. (2021), where the authors showed that the average peak time was 4.98 min.
Trough viscosity (TV) and breakdown viscosity (BV) are measurements of the resistance and disintegration of flour or starch, respectively, when exposed to temperature changes during pasting. In this study, the TV of cassava root flour increased significantly from 1,583 cp in raw kello to 2,505 cp in FFBD qulle varieties, and it was significantly different (p ≤ 0.05) between varieties and processing conditions. The value of TV in the present study was slightly lower than that reported by Oyeyinka et al. (2020a, 2020b), where the authors showed that the average values of TV of cassava were between 2,724 and 3,369 cp. The difference in TV might be due to the difference in varieties and age of cassava samples.
Breakdown viscosity measures the susceptibility of the starch granule to disintegrate (degree of viscosity reduction) during heat processing, and this may affect the stability of the flour product (Oyeyinka et al., 2020a, 2020b). High breakdown viscosity is a disadvantage in many food applications because it results in unevenly distributed viscosity (Nkoudou and Essia, 2017). It can be used as an indicator for pasting stability during heating and stirring. The qulle variety FFBD flour had the highest breakdown viscosity (5,233 cp), while the raw kello variety flour had the lowest one (3212.5 cp). BV in this study was significantly (p < 0.05) affected by processing. This indicates that a major modification occurred in starch granules of cassava root after processing methods such as fermentation and different drying techniques. This finding indicates that the qulle variety flour had the ability to withstand severe processing conditions better than the kello variety.
The BV value was also highest in the qulle FFBD flours than in all other flours (Table 6). This suggests that the swollen starch granules of fermented and fluid bed-dried flours can be easily disintegrated compared to those of raw and sun-dried starch granules. Thus, unfermented starch granules are more stable during the heating process than fermented starch granules.
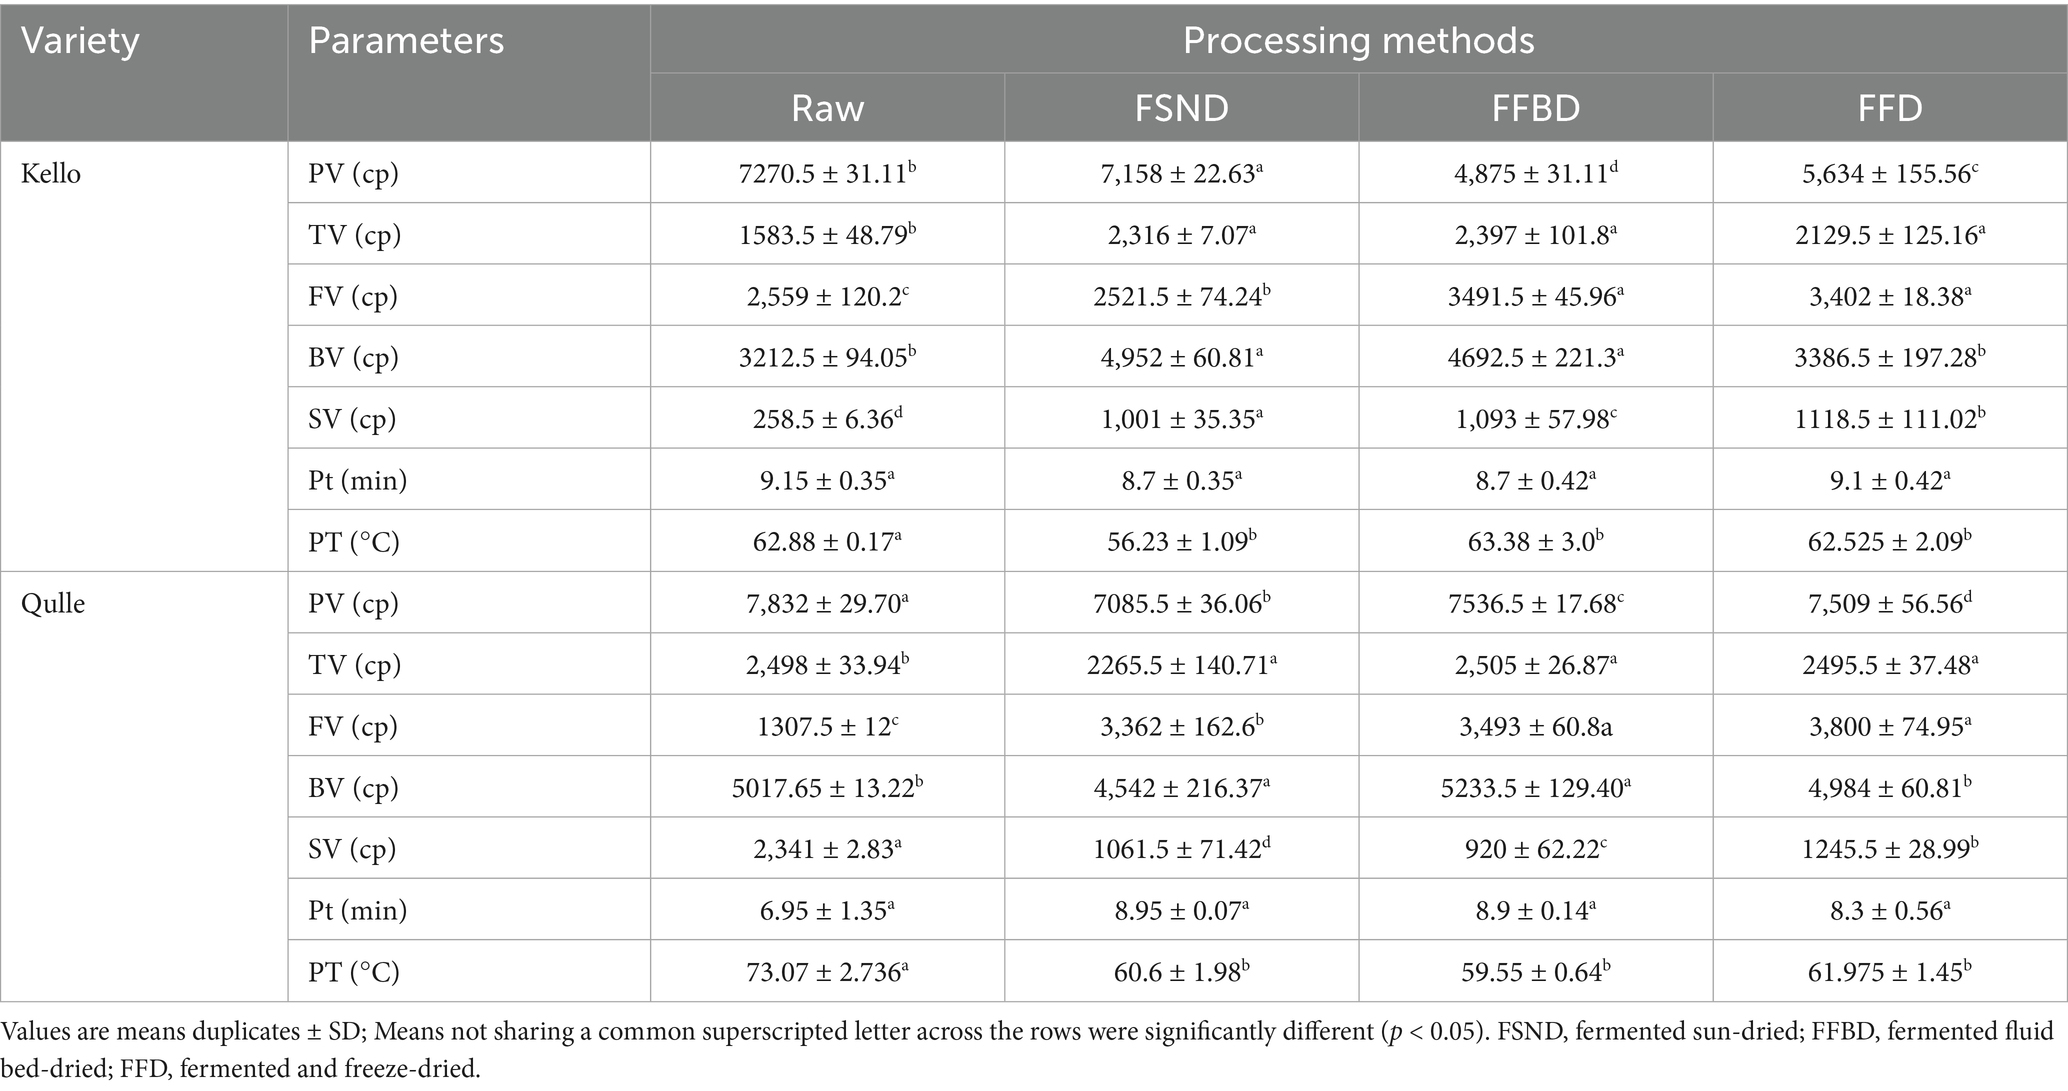
Table 6. Pasting properties of cassava roots as affected by varieties and processing methods.
Setback viscosity (SV) can be considered a measure of the tendency for flour or starch to retrograde, due to realignment of amylose molecules. The index of retrogradation during cooling is known as setback viscosity. Retrogradation describes the process in which a heated starch paste cools, and the exuded amylose molecules reassociate and unite the swollen starch grains in an ordered structure that results in viscosity increase (Oyeyinka et al., 2020a, 2020b). The setback viscosity in this study was significantly (p < 0.05) increased from 258.5 to 2,341 cp. The SV of cassava flour in this study was significantly affected by both processing and varieties. The findings of this study show that processed cassava flour has a higher tendency to retrograde than raw cassava flour.
FV is characteristic of the final product quality of starch-based foods (Ayetigbo et al., 2018). FV of cassava flour in this study was significantly increased from 1,307 cp in raw qulle varieties to 3,800 cp in FFD qulle varieties, respectively, and the results were close to those reported by Rachman et al. (2021), where the authors showed that the FV of cassava flour was 2,514.67 cp. The significant difference (p < 0.05) was shown for both varieties and all processing conditions in terms of final viscosity. Increase of FV might be associated with activities of amylases that hydrolyse amylopectin and thus release polymeric chains of monomer units (Fitzgerald et al., 2003).
Pasting temperature represents the temperature at which the sample will cook. The variation in pasting temperature of the flour could be due to differences in the granular size (Oyeyinka et al., 2020a, 2020b). A lower pasting temperature and a rapid rise in peak viscosity indicate a weak granular structure (Nkoudou and Essia, 2017). The pasting temperature of cassava flour in this study (56–73 °C) was close to the values previously reported, for cassava flour, by Oyeyinka et al. (2020a, 2020b), where the authors showed that the pasting temperature of cassava flour was between 60 and 80 °C. According to the findings, we suggest that cassava root flour has better viscoelastic properties and can be the best ingredient for bakery recipes.
3.5 Vitamin C and total carotenoid content of cassava root and leaves
Table 7 shows vitamin C and Total carotenoid contents for the different cassava root and leaf cultivars. The vitamin C content of cassava root ranged between 5.6 and 19.4%. The smallest value (5.6%) was observed for FSND, and the highest value (19.4%) was recorded in the raw kello variety. The values in this study were in line with the range reported by Chávez et al. (2000), where the authors showed that the vitamin C content of cassava root was between 1 to 40%. The values recorded were significantly (p < 0.05) affected by both varieties and processing conditions. This indicates that vitamin C content in cassava roots might be decreased with different processing conditions, such as fermentation and drying, and genetic variations (Carr and Rowe, 2020). The vitamin C contents of cassava leaves were in the range between 1.3 and 29.5%. There was a significant difference (p < 0.05) in vitamin C contents for varieties, processing, and their interaction. According to Latif and Müller (2015), the vitamin C content of cassava leaves was in the range between 28.3 and 431.5 mg/100 g. The values in this study were greater than those reported by Achidi et al. (2008), where the authors showed that the vitamin C contents of cassava leaves were in the range between 55.07 and 270.23 mg/100 g. The difference might be due to the fact that the destruction of vitamin C occurs during processing, such as fermentation.
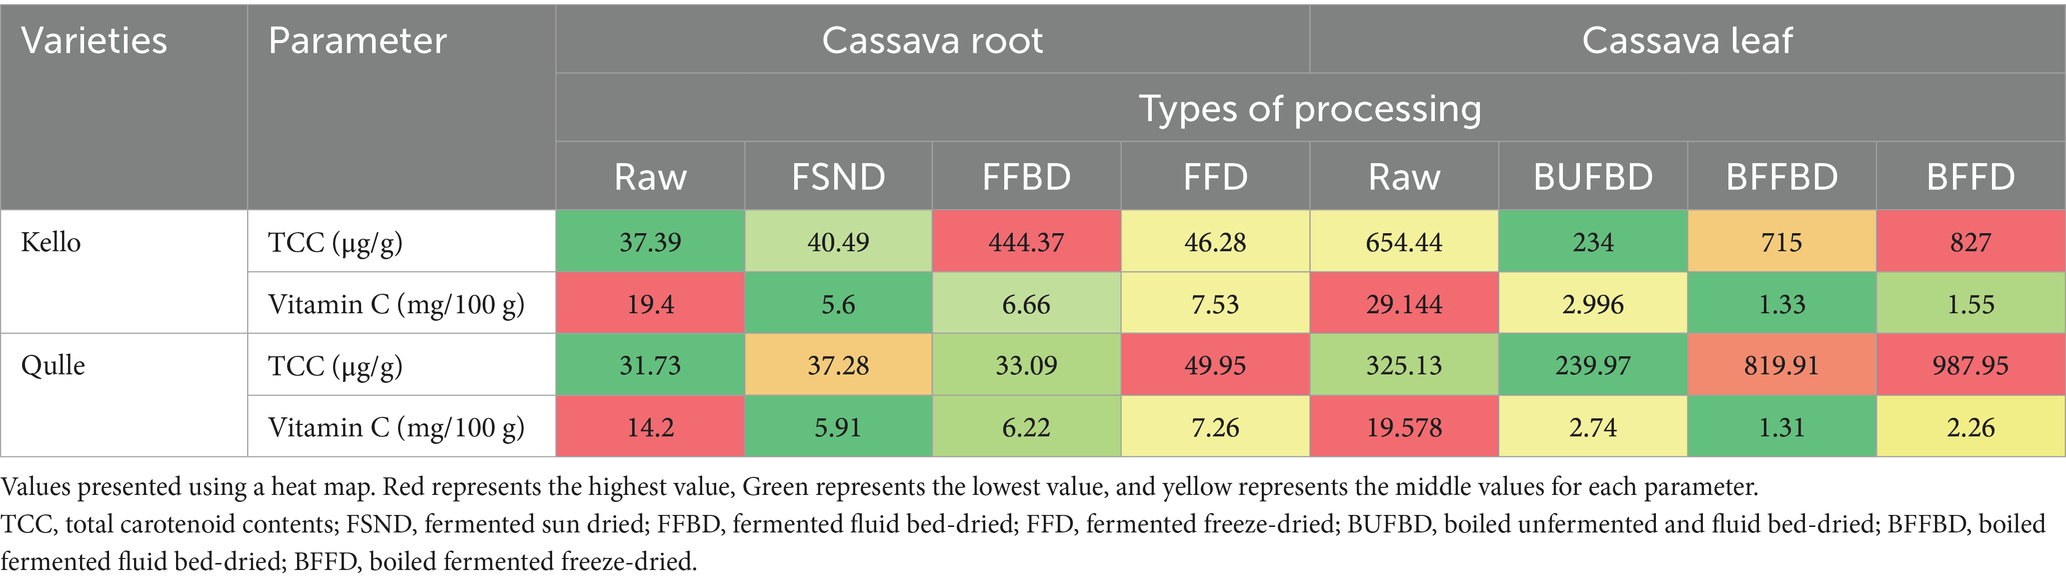
Table 7. Vitamin C and total carotenoid content of cassava root and leaves as affected by varieties and processing.
The total carotenoid content of cassava root flour ranged between 31.73 and 49.95 μg/g. The values were significantly (p < 0.05) greater in FFD qulle variety as compared to raw cassava root flour. There was a significant difference (p < 0.05) in all processing techniques, and better carotenoid retention was observed in FFD for both varieties. The total carotenoid losses during heat treatment could be due to carotenoid isomerization and oxidation, which is the breakdown of trans-carotenoid to its cis-isomers. The difference in total carotenoid content may be a result of one or a combination of factors, such as heat, light, oxygen, and enzymes, which can lead to major or minor losses of carotenoids in cassava root during processing (Mongwaketse et al., 2021). The total carotenoid content in two local varieties of cassava leaves was in the range between 234.10 and 987.95 μg/g. According to the findings in this study, the total carotenoid content (234.10 and 987.95 μg/g) was slightly greater than the results reported by Ospina et al. (2021), where the authors showed that the total carotene content of cassava leaves ranged between 174 and 547 μg/g. For both varieties of cassava leaves, the total carotenoid content of cassava leaves was significantly (p < 0.05) affected by methods of processing and types of varieties. Although cassava leaves are detoxified with a lot of water, essential nutrients may be leached during processing; however, fermentation enhances the average carotenoid content of the cassava leaves. A possible reason could be that, as major compositions of cassava (carbohydrates, moisture, and fiber) are reduced by hydrolysis during fermentation, the proportion of other minor compositions, such as carotenoids, will apparently increase (Ayetigbo et al., 2018). According to Latif and Müller (2015), the β-carotene content of cassava leaves was in the range between 41.6 and 43.6 µg/g the results were slightly lower than the values recorded in this study. Because β-carotene is included in total carotenoids, this could be the case.
3.6 Anti-nutritional factors in cassava root and leaves
The anti-nutrient content of cassava leaves is presented in Table 8. Tannins are polyphenols with a relatively large molecular weight (up to 20,000 Da), and their presence in cassava leaves is believed to play a significant role in the low net protein utilization. They have the potential to create insoluble complexes with proteins, inhibiting digestion by inactivating enzymes. When present in large quantities in food, they can have unfavorable impacts (Natesh et al., 2017). Thus, the tannin content of cassava root flour in this study was in the range between 3.03 and 5.0 mg/100 g. A maximum value (5.0 mg/100 g) was observed in the raw kello variety. The contents were significantly (p < 0.05) decreased under different processing conditions, and also the values were significantly different for different varieties. The levels of tannin content of cassava root in this study were in line with the results reported by Achidi et al. (2008), where the authors showed that the tannin contents of cassava root were in the range between 2.04 and 4.31 mg/100 g. The slight difference may be due to the difference in variety, geographical location, altitude, and climatic conditions, including soil type. The tannin contents of cassava leaves in this study ranged from 20.98 to 52.02 mg/100 g. The contents observed were significantly different (p < 0.05) for both varieties and all processing conditions. Fasuyi (2005) reported that the tannin concentration in different varieties of cassava leaves ranged between 6.9 and 15.0 mg/100 g. According to Jamil and Bujang (2016), the tannin content of different cassava leaf varieties was in the range between 5.74 and 10.16 mg/100 g. Compared to the above literature, the values were slightly greater. The genetic differences among cultivars, plant ages, leaf maturity, soil fertility, experimental setup, calibration, and procedures might account for a minor increase in the final reported values. According to the findings, the tannin content of cassava roots and leaf varieties was significantly decreased for different processing conditions.
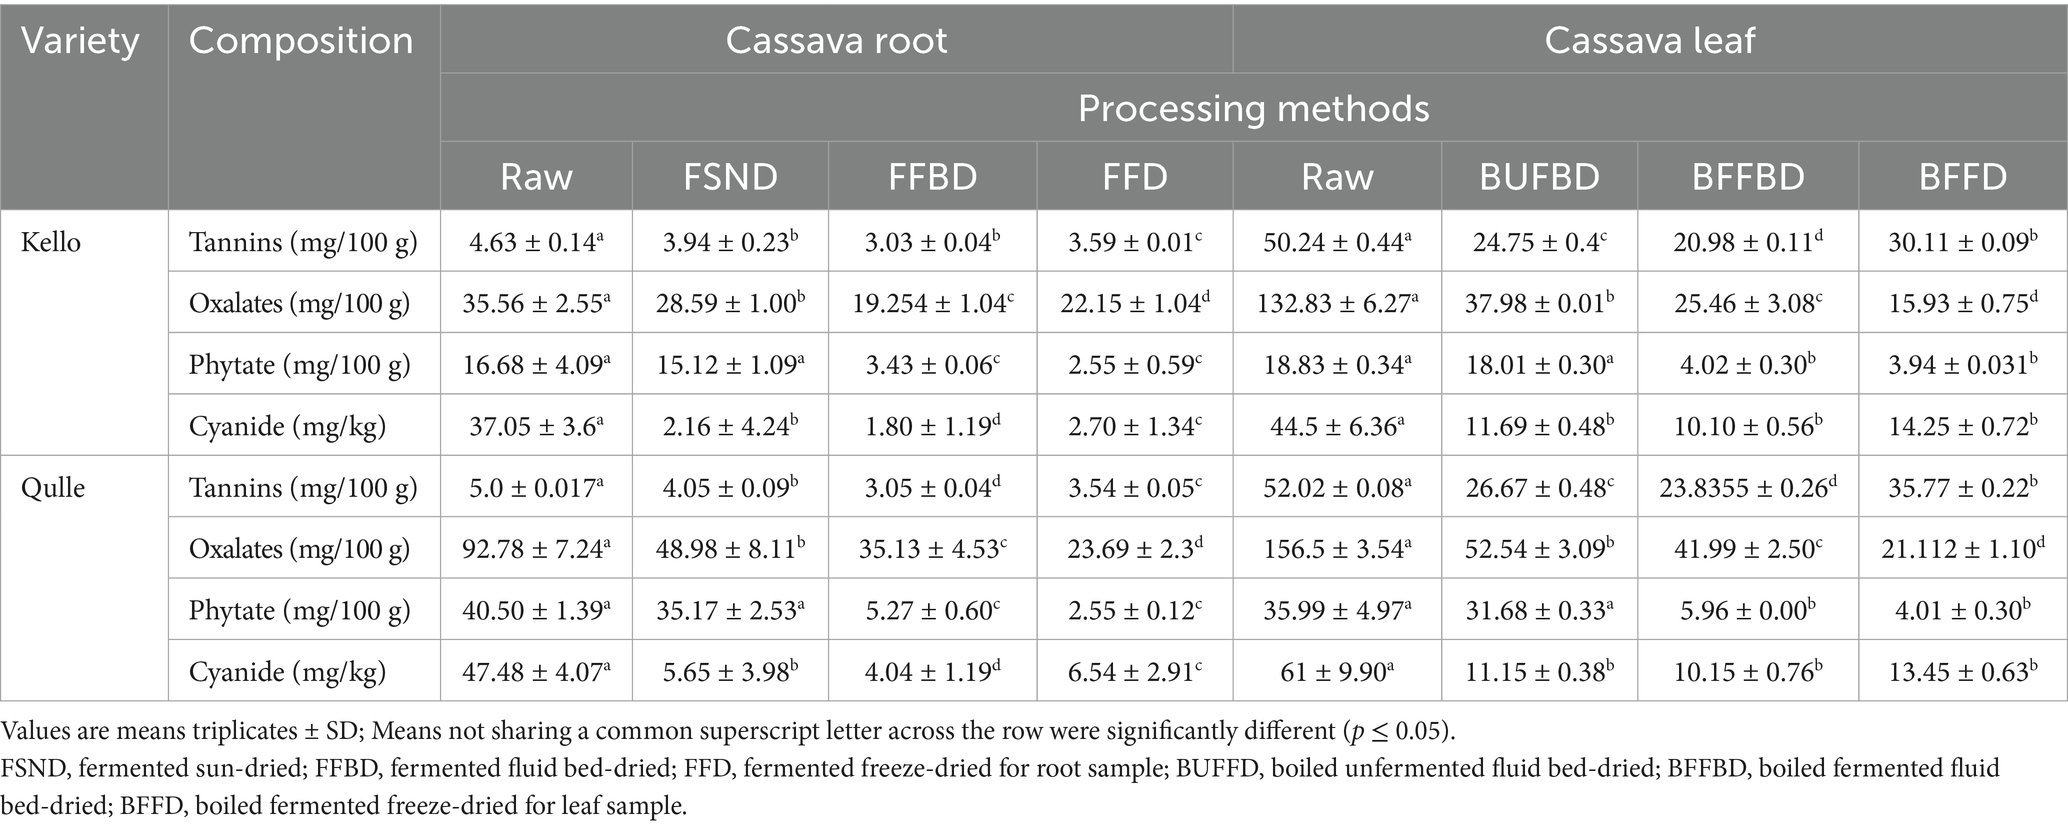
Table 8. Concentrations of anti-nutritional factors after processing in two varieties of cassava root and leaves.
Oxalates are anti-nutrients that negatively affect calcium and magnesium bioavailability. It has the ability to bind calcium and expel it in the urine or form crystals. Because calcium oxalate crystals are a primary component of kidney stones, it is recommended that persons who are prone to them increase their calcium consumption while decreasing their oxalate intake (Amos et al., 2019). Oxalate content of cassava root flour in the present study was recorded in the range between 22.15 and 92.78 mg/100 g, and the maximum value observed for the raw kello variety (92.78 mg/100 g).
The oxalate content was significantly (p < 0.05) different due to the effects of processing methods and varieties, as well as the combined effect. According to the findings by Buta (2020), the oxalate contents of the same varieties were reported in the range 24.93–86.18 mg/100 g for qulle and kello varieties, respectively. This indicates that the present result, 22.15–92.78 mg/100 g, falls within this range of oxalate content of cassava roots. The slight difference in the oxalate level between the experimental value and the reported value may be a result of agroecological differences, such as temperature, climate, soil type, variations in the performance of the analysts (chemicals) used during testing, and even the differences in the analyst who performed the tests. The oxalate content of cassava leaves in this study ranged from 25.46 to 156.5 mg/100 g. The values were significantly (p < 0.05) decreased by processing parameters, and the values varied for different varieties. The results obtained were much lower than the results reported by Montagnac et al. (2009), where the authors showed that the oxalate concentrations of cassava leaves were in the range between 1,350 and 2,880 mg/100 g. This indicates that the varieties and processing methods used in the present study were better at lowering the amount of oxalate.
Phytate is also an anti-nutritional factor that binds proteins and minerals in the gastrointestinal tract, preventing absorption and utilization by the body. Specifically, phytate interferes with the absorption of divalent metals, such as iron and zinc, which are essential nutrients (Siriwan, 2015). It has a negative impact on the activity of digestive enzymes and acts through chelation of mineral cofactors or interaction with proteins. For instance, it interferes with zinc homeostasis. Heat processing, such as boiling and cooking, has no effect in reducing the level of phytic acid, as the phytate is relatively heat stable, but fermentation does (Natesh et al., 2017). The phytate contents of the two local varieties of cassava root flour in this study ranged between 2.55 and 40.5 mg/100 g. The contents were significantly (p < 0.05) affected by both processing and varieties. The difference might be due to fermentation and intrinsic parameters of cassava root varieties. The phytate contents of cassava leaves presented in this study were between 4.02 and 36.0 mg/100 g. The values were significantly (p < 0.05) affected by both varieties and all processing techniques. The minimum value (3.94 mg/100 g) was observed in the BFFD kello variety, and the phytate content was varied in different processing methods. This is due to the fact that during cassava leaves fermentation, there might be dephosphorylation and release of the minerals, making them available for absorption. Therefore, cassava leaves fermentation minimizes the anti-nutritional effect of phytate content.
Consumption of 50–100 mg of cyanide is acute, poisonous, and lethal to adults. Lower consumption of cyanide is not lethal, but long-term intake can cause severe health problems, such as tropical neuropathy (Bayata, 2019). The total cyanide content of the cassava root flour decreases with processing such as fermentation (Nkoudou and Essia, 2017) and thermal treatment (Latif et al., 2019). According to results achieved in this study, the cyanide content of the cassava root flour ranged between 1.8 and 47.48 ppm, with the maximum value observed in the raw qulle variety (47.48 ppm). The content was significantly (p < 0.05) affected by both processing and variety. This indicates that an acceptable level of cyanide in cassava root can be achieved by using appropriate processing and breeding with improved varieties. In addition to the above-mentioned processing methods, literature has shown that pre-processing steps such as peeling, grating, and washing significantly reduce the cyanide level of cassava root. According to the reports Chisenga et al. (2019a, 2019b) and Ospina et al. (2021), the cyanide contents of fresh cassava root ranged between 86.2–154.8 and 346–748.4 mg/100 g, respectively.
According to the current codex and international standards, the level of “total hydrocyanic acid‟ in the fresh cassava root flour must not exceed 10 mg kg (FAO/WHO, 2019). The cyanide levels of cassava root flour (1.8–47.48 ppm) in the current study were lower than previously reported levels and were within acceptable international standards. The cyanide content of cassava leaves in this study ranged from 10.10 to 61.0 ppm, with a maximum value (61 ppm) observed in the raw qulle variety, and the contents were significantly (p < 0.05) decreased for various processing techniques and differed in varieties. According to the findings, overall cyanide concentrations decreased to an acceptable level on processing, with the exception of freeze-dried samples. HCN levels were higher in freeze-dried cassava leaves than in other processing methods. This might be due to the moisture and nutrient retention capacity of freeze-dried food. HCN contents of cassava leaves in this study were in line with the results presented by Jamil and Bujang (2016), where the authors showed that HCN content of different cassava leaf varieties was in the range between 11.29 and 19.29 mg/100 g. The values in this study were lower than the results presented by Oni et al. (2017), where the authors showed that the HCN content of cassava leaves ranged from 58.5 to 86.7 mg/100 g, and those reported by Junior et al. (2019), where the authors showed that the HCN content of cassava leaves varied from 90.6 to 560.9 ppm. According to Bayata (2019), the cyanide level in cassava leaves ranges from 53 to 1,300 ppm. The current investigation’s cyanide levels (10.10–14.25 ppm) in different processing methods were found to be below the acute hazardous limit. A little deviation from the World Health Organization’s (WHO’s) recommended level of cyanide, which is 10 ppm (FAO/WHO, 2019), could be minimized using accurate processing machinery, operational procedures, and personnel. While traditional methods such as drying and boiling can reduce HCN to an acceptable level for ingestion, this research reveals that combining these and other processing methods could be more effective at lowering HCN and preserving essential minerals contained in cassava leaves.
4 Conclusion
Cassava is a climate-smart, nutrient-dense crop that could be a promising food for the future. In terms of nutritional, physicochemical, and functional qualities, cassava root and leaf flour performed well. Cassava flour’s nutritional and anti-nutritional properties are influenced by the variety and processing method. Despite the fact that cassava is an important food source in developing countries, HCN poisoning is still a problem. Finding an appropriate processing method that can significantly reduce HCN will be critical in encouraging utilization. The efficiency of these methods is dependent on the method’s nutrition retention and detoxifying capabilities. The concentration of cyanide was found to have decreased in all processing methods, with a minor increase in freeze-dried samples, according to the data. This suggests that, despite its superior nutrient retention, freeze-drying is ineffective in terms of detoxification. This study confirms that different varieties and a combination of processing methods, such as fermentation, boiling, and drying, modify quality parameters and reduce toxic components significantly (p < 0.05). Data from this finding could provide accurate information for policymakers, consumers, and researchers for product development. More research is needed to develop innovative technologies for product development and recipe optimization so that cassava leaves can be used as a supplemental food. It is also recommended that more research needs to be conducted on public awareness regarding cassava’s nutritional potential and harmful and safe toxicity levels. Due to time and financial constraints, these parameters were not included in the current investigation.
Data availability statement
The datasets presented in this study can be found in online repositories. The names of the repository/repositories and accession number(s) can be found in the article/supplementary material.
Author contributions
TL: Conceptualization, Investigation, Software, Formal analysis, Writing – original draft. TD: Supervision, Writing – review & editing, Data curation, Conceptualization. MG: Writing – review & editing, Validation, Visualization, Data curation.
Funding
The author(s) declare that no financial support was received for the research and/or publication of this article.
Acknowledgments
The authors are grateful to Mr. Asefa Cholo for his cooperation during sample collection, to Mr. Berihun Alebel for his assistance with laboratory analyses, and to Mr. Zemanu Kerie for his cooperation on paperwork. We also thank the Areka Agricultural Research Center in Ethiopia for providing the cassava root and leaf samples used for the research.
Conflict of interest
The authors declare that the research was conducted in the absence of any commercial or financial relationships that could be construed as a potential conflict of interest.
Generative AI statement
The authors declare that no Gen AI was used in the creation of this manuscript.
Any alternative text (alt text) provided alongside figures in this article has been generated by Frontiers with the support of artificial intelligence and reasonable efforts have been made to ensure accuracy, including review by the authors wherever possible. If you identify any issues, please contact us.
Publisher’s note
All claims expressed in this article are solely those of the authors and do not necessarily represent those of their affiliated organizations, or those of the publisher, the editors and the reviewers. Any product that may be evaluated in this article, or claim that may be made by its manufacturer, is not guaranteed or endorsed by the publisher.
References
Abass, A., Awoyale, W., Alenkhe, B., Malu, N., Asiru, B., Manyong, V., et al. (2018). Can food technology innovation change the status of a food security crop? A review of cassava transformation into “bread” in Africa. Food Rev. Int. 34, 87–102. doi: 10.1080/87559129.2016.1239207
Achidi, A. U., Ajayi, O. A., Maziya-Dixon, B., and Bokanga, M. (2008). The effect of processing on the nutrient content of cassava (Manihot esculenta Crantz) leaves. J. Food Process. Preserv. 32, 486–502. doi: 10.1111/j.1745-4549.2007.00165.x
Adebayo, T. S. (2023). Do uncertainties moderate the influence of renewable energy consumption on electric power CO2 emissions? A new policy insights. International Journal of Sustainable Development & World Ecology, 31, 314–329. doi: 10.1080/13504509.2023.2286487
Adegbaju, O., Otunola, G., and Afolayan, A. (2019). Proximate, mineral, vitamin and anti-nutrient content of Celosia argentea at three stages of maturity. S. Afr. J. Bot. 124, 372–379. doi: 10.1016/j.sajb.2019.05.036
Amos, A. T., Idowu, O. M. O., Oso, A. O., Durojaiye, O. J., Agazue, K., and Adebowale, A. A. (2019). The chemical composition, anti-nutritional and microbial properties of ensiled cassava root-leaf blends as potential feed in swine diet. Pertanika J. Trop. Agric. Sci. 42, 1219–1235.
Ayetigbo, O., Latif, S., Abass, A., and Müller, J. (2018). Comparing characteristics of root, flour and starch of biofortified yellow-flesh and white-flesh cassava variants, and sustainability considerations: a review. Sustainability 10:3089. doi: 10.3390/su10093089
Bayata, A. (2019). Review on nutritional value of cassava for use as a staple food. Sci. J. Anal. Chem. 7, 83–91. doi: 10.11648/j.sjac.20190704.12
Bechoff, A. (2017). Use and nutritional value of cassava roots and leaves as a traditional food. Burleigh Dodds Science Publishing Limited.
Boakye Peprah, B., Parkes, E. Y., Harrison, O. A., van Biljon, A., Steiner-Asiedu, M., and Labuschagne, M. T. (2020). Proximate composition, cyanide content, and carotenoid retention after boiling of provitamin A-rich cassava grown in Ghana. Foods, 9:1800.
Burns, A., Gleadow, R., Cliff, J., Zacarias, A., and Cavagnaro, T. (2010). Cassava: the drought, war and famine crop in a changing world. Sustainability, 2, 3572–3607.
Buta, B. M. (2020). Evaluation of oxalate content in Boyna and Taro roots grown in Areka. Ethiopia: World Scientific Research, 12–6.
Byju, G., and Suja, G. (2020). Mineral nutrition of cassava. Adv. Agron. 159, 169–235. doi: 10.1016/bs.agron.2019.08.005
Carr, A. C., and Rowe, S. (2020). Factors affecting vitamin C status and prevalence of deficiency: a global health perspective. Nutrients 12:1963. doi: 10.3390/nu12071963
Chávez, A. L., Bedoya, J., Sánchez, T., Iglesias, C., Ceballos, H., and Roca, W. (2000). Iron, carotene, and ascorbic acid in cassava roots and leaves. Food Nutr. Bull. 21, 410–413. doi: 10.1177/156482650002100413
Chisenga, S. M., Workneh, T. S., Bultosa, G., and Alimi, B. A. (2019a). Progress in research and applications of cassava flour and starch: a review. J. Food Sci. Technol. 56, 2799–2813. doi: 10.1007/s13197-019-03814-6
Chisenga, S. M., Workneh, T. S., Bultosa, G., and Laing, M. (2019b). Proximate composition, cyanide contents, and particle size distribution of cassava flour from cassava varieties in Zambia. AIMS Agric. Food 4, 869–891. doi: 10.3934/agrfood.2019.4.869
da Silva Santos, B. R., Silva, E. F. R., Minho, L. A. C., Brandao, G. C., dos Santos, A. M. P., Santos, W. P. C., et al. (2020). Evaluation of the nutritional composition in effect of processing cassava leaves (Manihot esculenta) using multivariate analysis techniques. Microchem. J. 152:104271. doi: 10.1016/j.microc.2019.104271
Fasuyi, A. O. (2005). Nutrient composition and processing effects on cassava leaf (Manihot esculenta, Crantz) antinutrients. Pak. J. Nutr. 4, 37–42.
Fitzgerald, M., Martin, M., Ward, R., Park, W., and Shead, H. (2003). Viscosity of rice flour: a rheological and biological study. J. Agric. Food Chem. 51, 2295–2299. doi: 10.1021/jf020574i
Hasmadi, M., Noorfarahzilah, M., Noraidah, H., Zainol, M., and Jahurul, M. (2020). Functional properties of composite flour: a review. Food Res. 4, 1820–1831. doi: 10.26656/fr.2017.4(6).419
Jamil, S. S., and Bujang, A. (2016). Nutrient and antinutrient composition of different variety of cassava (Manihot esculenta Crantz) leaves. Jurnal Teknologi 78, 59–63. doi: 10.11113/jt.v78.9024
Junior, E. N. M., Chisté, R. C., and da Silva Pena, R. (2019). Oven drying and hot water cooking processes decrease HCN contents of cassava leaves. Food Res. Int. 119, 517–523. doi: 10.1016/j.foodres.2019.01.029
Karri, V. R., and Nalluri, N. (2016). Cassava: meeting the global protein need. Plant Sci. Today 3, 304–311. doi: 10.14719/pst.2016.3.3.249
Kayode, B. I., Kayode, R. M., Abiodun, O. A., Nwosu, C., Karim, O. R., and Oyeyinka, S. A. (2021). Chemical, functional and physicochemical properties of flour from cassava stored under freezing. J. Stored Prod. Res. 92:101816. doi: 10.1016/j.jspr.2021.101816
Kobawila, S., Louembe, D., Keleke, S., Hounhouigan, J., and Gamba, C. (2005). Reduction of the cyanide content during fermentation of cassava roots and leaves to produce bikedi and ntoba mbodi, two food products from Congo. Afr. J. Biotechnol. 4, 689–696. doi: 10.5897/AJB2005.000-3128
Latif, S., and Müller, J. (2015). Potential of cassava leaves in human nutrition: a review. Trends Food Sci. Technol. 44, 147–158. doi: 10.1016/j.tifs.2015.04.006
Latif, S., Zimmermann, S., Barati, Z., and Müller, J. (2019). Detoxification of cassava leaves by thermal, sodium bicarbonate, enzymatic, and ultrasonic treatments. J. Food Sci. 84, 1986–1991. doi: 10.1111/1750-3841.14658
Leguizamón, A. J., Rompato, K. M., Hoyos, R. E., and Audisio, M. C. (2021). Nutritional evaluation of three varieties of cassava leaves (Manihot esculenta Crantz) grown in Formosa, Argentina. J. Food Compos. Anal. 101:103986. doi: 10.1016/j.jfca.2021.103986
Linus-Chibuezeh, A., Iwe, M., Ngadi, M., Asumugha, V., and Obasi, N. (2017). Evaluation of some physicochemical and pasting properties of three improved cassava varieties available in the southeast of Nigeria. Imp. J. Interdiscip. Res. 3, 641–650.
MaAruf, A., and Abdul, H. (2020). Efficient processing of cassava starch: physicochemical characterization at different processing parameters. Food Res. 4, 143–151. doi: 10.26656/fr.2017.4(1).235
Manano, J., Ogwok, P., and Byarugaba-Bazirake, G. W. (2017). Chemical composition of major cassava varieties in Uganda, targeted for industrialisation. J. Food Res. 7, 1–9. doi: 10.5539/jfr.v7n1p1
Mbanjo, E. G. N., Rabbi, I. Y., Ferguson, M. E., Kayondo, S. I., Eng, N. H., Tripathi, L., et al. (2021). Technological innovations for improving cassava production in sub-Saharan Africa. Frontiers in Genetics, 11:623736.
Michel, D., Eriksson, M., and Klimes, M. (2021). Climate change and (in) security in transboundary river basins. In Handbook of Security and the Environment. Edward Elgar Publishing, 62–75.
Mongwaketse, T., Kruger, J., Lewies, A., Baumgartner, J., and Smuts, C. M. (2021). Minerals, antinutrients content and the bioaccessibility of iron and zinc in cooked, spontaneously fermented-dried, and blanched-dried dark green leafy vegetables commonly consumed in sub-Saharan Africa. Food Sci. Technol. v42:e37921. doi: 10.1590/fst.37921
Montagnac, J. A., Davis, C. R., and Tanumihardjo, S. A. (2009). Processing techniques to reduce toxicity and antinutrients of cassava for use as a staple food. Compr. Rev. Food Sci. Food Saf. 8, 17–27. doi: 10.1111/j.1541-4337.2008.00064.x
Nadjiam, D., Ayessou, N. C., and Guissé, A. (2020). Physicochemical characterization of nine cassava (Manihot esculenta Crantz) cultivars from Chad. Food Nutr. Sci. 11, 741–756. doi: 10.4236/fns.2020.117053
Natesh, H., Abbey, L., and Asiedu, S. (2017). An overview of nutritional and antinutritional factors in green leafy vegetables. Horticult. Int. J. 1:00011. doi: 10.15406/hij.2017.01.00011
Ndam, Y. N., Mounjouenpou, P., Kansci, G., Kenfack, M. J., Meguia, M. P. F., Eyenga, N. S. N. N., et al. (2019). Influence of cultivars and processing methods on the cyanide contents of cassava (Manihot esculenta Crantz) and its traditional food products. Scientific African, 5:e00119.
Neves, E. C. A., Moysés, B. A., Neves, D. A., Campelo, P. H., and Clerici, M. T. P. S. (2021). Sustainable and regional gastronomy: cassava leaves as a potential ingredient for gluten-free biscuits. Res. Soc. Dev. 10:e12010313071-e12010313071. doi: 10.33448/rsd-v10i3.13071
Nkoudou, N. Z., and Essia, J. J. N. (2017). Cyanides reduction and pasting properties of cassava (Manihot esculenta Crantz) flour as affected by fermentation process. Food Nutr. Sci. 8, 326–333. doi: 10.4236/fns.2017.83022
Noort, M. W., Renzetti, S., Linderhof, V., du Rand, G. E., Marx-Pienaar, N. J., de Kock, H. L., et al. (2022). Towards sustainable shifts to healthy diets and food security in sub-Saharan Africa with climate-resilient crops in bread-type products: A food system analysis. Foods, 11:135.
Nurrofingah, U., Sumiati, Y. Retnani, and Dek, M. S. P. (2019). Physical characteristics of duck pellet and antioxidant activity of sweet potato leaves and cassava leaves. AIP conference proceedings, AIP Publishing LLC.
Okareh, O., Ajayeoba, T., Ugbekile, O., and Hammed, T. (2021). The use of cassava leaves as food and medicinal herbs in rural communities and the perceived health risks. Bionature 41, 19–38.
Oni, A., Oluwayemisi, A., Adebayo, K., Sowande, O., Iposu, S., and Onwuka, C. (2017). Effects of supplementing cassava peels with cassava leaves and cowpea haulms on the rumen environment and blood profile parameters of west African dwarf goats. Arch. Zootec. 66, 395–402.
Onyango, C., Luvitaa, S. K., Unbehend, G., and Haase, N. (2020). Nutrient composition, sensory attributes and starch digestibility of cassava porridge modified with hydrothermally-treated finger millet. J. Agric. Food Res. 2:100021. doi: 10.1016/j.jafr.2020.100021
Oresegun, A., Fagbenro, O., Ilona, P., and Bernard, E. (2016). Nutritional and anti-nutritional composition of cassava leaf protein concentrate from six cassava varieties for use in aqua feed. Cogent Food Agric. 2:1147323. doi: 10.1080/23311932.2016.1147323
Ospina, M. A., Pizarro, M., Tran, T., Ricci, J., Belalcazar, J., Luna, J. L., et al. (2021). Cyanogenic, carotenoids and protein composition in leaves and roots across seven diverse population found in the world cassava germplasm collection at CIAT, Colombia. Int. J. Food Sci. Technol. 56, 1343–1353. doi: 10.1111/ijfs.14888
Oyeyinka, S. A., Ayinla, S. O., Sanusi, C. T., Akintayo, O. A., Oyedeji, A. B., Oladipo, J. O., et al. (2020a). Chemical and physicochemical properties of fermented flour from refrigerated cassava root and sensory properties of its cooked paste. J. Food Process. Preserv. 44:e14684. doi: 10.1111/jfpp.14684
Oyeyinka, S. A., Salako, M. O., Akintayo, O. A., Adeloye, A. A., Nidoni, U., Dudu, O. E., et al. (2020b). Structural, functional, and pasting properties of starch from refrigerated cassava root. J. Food Process. Preserv. 44:e14476. doi: 10.1111/jfpp.14476
Pitirini, J. S., Santos, R. I. R., Lima, F. M. S., Nascimento, I. S. B., Barradas, J. O., Faturi, C., et al. (2021). Fermentation profile and chemical composition of cassava root silage. Acta Amazon. 51, 191–198. doi: 10.1590/1809-4392202004410
Pushpalatha, R., and Gangadharan, B. (2020). Is cassava (Manihot esculenta Crantz) a climate “smart” crop? A review in the context of bridging future food demand gap. Trop. Plant Biol. 13, 201–211. doi: 10.1007/s12042-020-09255-2
Rachman, A., Brennan, M. A., Morton, J., and Brennan, C. S. (2021). Starch pasting properties, and the effects of banana flour and cassava flour addition to semolina flour on starch and amino acid digestion. Starch-Stärke 73:2000137. doi: 10.1002/star.202000137
Rahma, I. N., Pratama, R. H., Alwi, D. R., Astuti, W. I. S. T., and Wardhani, D. H. (2017). Swelling power and solubility of modified breadfruit flour using Lactobacillus plantarum. J. Phys. Conf. Ser. 909:012087. doi: 10.1088/1742-6596/909/1/012087
Rival, H., Yulianti, S., and Chandra, B. (2019). Qualitative and quantitative analysis of hexane, acetone ethanol and water extract from bay leaves (Syzgium polyanthum (wight) Walp.). Pharm. Chem. J. 6, 13–20.
Sebiomo, A., and Banjo, F. (2015). The phytochemical, proximate and mineral contents of cassava leaves and nutritive values of associated arthropod pests. J. Turk. Chem. Soc. Sect. A Chem. 7, 675–690. doi: 10.18596/jotcsa.733516
Siriwan, N. (2015). Isolation and selection of potential probiotic lactic acid bacteria from cassava pulp for cholesterol lowering property, School of Food Technology. Institute of Agricultural Technology. Suranaree University of Technology.
Tetchi, F. A., Solomen, O. W., Célah, K. A., and Georges, A. N. G. (2012). Effect of cassava variety and fermentation time on biochemical and microbiological characteristics of raw artisanal starter for attiéké production. Innov. Rom. Food Biotechnol. 10, 40–47.
Teye, E., Deha, C. I., Dadzie, R., and MacArthur, R. L. (2020). Delivering the nutritional needs by food to food fortification of Staples using underutilized plant species in Africa. Int. J. Food Sci. 2020. doi: 10.1155/2020/8826693
Turyagyenda, F. L., Kizito, E. B., Baguma, Y., and Osiru, D. (2013). Evaluation of Ugandan cassava germplasm for drought tolerance.
Uchechukwu-Agua, A. D., Caleb, O. J., and Opara, U. L. (2015). Postharvest handling and storage of fresh cassava root and products: a review. Food Bioprocess Technol. 8, 729–748. doi: 10.1007/s11947-015-1478-z
United Nations Development Program. (2015). Sustainable Development Goals. [online]. United Nations. Available at: https://www.undp.org/content/undp/en/home/sustainable-development-goals.html
Yacoub, A., Djerbi, A., and Fen-Chong, T. (2018). Water absorption in recycled sand: new experimental methods to estimate the water saturation degree and kinetic filling during mortar mixing. Constr. Build. Mater. 158, 464–471. doi: 10.1016/j.conbuildmat.2017.10.023
Yang, H., Yi, N., Zhao, S., Xiang, Z., Qaseem, M. F., Zheng, B., et al. (2021). Characterization of hemicellulose in cassava (Manihot esculenta Crantz) stem during xylogenesis. Carbohydr. Polym. 264:118038. doi: 10.1016/j.carbpol.2021.118038
Keywords: food security, sustainable food system, anti-nutrients, detoxification, cassava varieties, cassava processing
Citation: Lambebo T, Deme T and Geleta M (2025) Nutritional enhancement of cassava through processing: implications for sustainable food systems. Front. Sustain. Food Syst. 9:1660792. doi: 10.3389/fsufs.2025.1660792
Edited by:
Simardeep Kaur, The ICAR Research Complex for North Eastern Hill Region (ICAR RC NEH), IndiaReviewed by:
Seydi Yıkmış, Namik Kemal University, TürkiyeHudson Nyabuga Nyambaka, Kenyatta University, Kenya
Copyright © 2025 Lambebo, Deme and Geleta. This is an open-access article distributed under the terms of the Creative Commons Attribution License (CC BY). The use, distribution or reproduction in other forums is permitted, provided the original author(s) and the copyright owner(s) are credited and that the original publication in this journal is cited, in accordance with accepted academic practice. No use, distribution or reproduction is permitted which does not comply with these terms.
*Correspondence: Tesfaye Deme, aHVuZGV0ZXNmYXllMm4yMThAZ21haWwuY29t; Mulatu Geleta, bXVsYXR1LmdlbGV0YS5kaWRhQHNsdS5zZQ==