 Victoria Padula de Quadros1*
 Jacqueline Tereza da Silva1,2
 Agnieszka Balcerzak1
 Pauline Allemand1
 Catherine Leclercq3
 Marika Ferrari3
 Ximena Schmidt Rivera4
 Christian Reynolds5
 Bridget Anna Holmes1
- 1Food and Nutrition Division, Food and Agriculture Organization of the United Nations, Rome, Italy
- 2Division of Global Agriculture and Food Systems, The University of Edinburgh, Edinburgh, United Kingdom
- 3Research Centre for Food and Nutrition, Council for Agricultural Research and Economics, Rome, Italy
- 4Department of Chemical Engineering, College of Engineering, Design and Physical Science, Brunel University of London, London, United Kingdom
- 5Centre for Food Policy, School of Health and Medical Sciences, City St George’s, University of London, London, United Kingdom
Integrating environmental impacts into dietary assessment is crucial to promote healthy diets from sustainable food systems. Nonetheless, the environmental impacts of individual dietary intake are rarely reported. This paper describes how environmental impacts are integrated into dietary data through the FAO/WHO Global Individual Food Consumption Data Tool (FAO/WHO GIFT). The environmental infographics available on FAO/WHO GIFT offer a user-friendly interface to understand the average footprint of diets, identifying contributing food groups, and exploring variations in environmental impacts. The infographics present estimates for three environmental indicators - greenhouse gas emissions, water use, and land use of dietary intake, allowing users to assess the environmental implications of different diets. Tools to monitor and assess dietary environmental impact, such as those offered by FAO/WHO GIFT, are essential for informing transformation towards healthy diets from sustainable food systems.
1 Introduction
Suboptimal diets are a leading cause of avoidable ill-health and premature death (Afshin et al., 2019). In addition, the way foods that compose diets are produced, processed, distributed, and consumed is a major cause of climate change, environmental degradation, and depletion of natural resources (Poore and Nemecek, 2018). The interaction between food and the natural environment is two-fold, with food systems contributing to climate change and environmental degradation and, at the same time, being vulnerable to those changes (Fanzo et al., 2021). Given this complex relationship, multiple actions should be taken simultaneously at different stages throughout food systems to enhance their contribution to human and planetary health and mitigate deleterious outcomes.
The recognition that food and climate are interconnected resulted in a steep rise in food systems environmental impact assessments. Environmental impacts are often assessed at product-level, usually focusing on specific agricultural commodities, or at the country-level, focusing on impacts related to domestic production (Deconinck et al., 2023). However, there is a lack of information about the environmental impact of diets based on individual-level quantitative dietary intake data. This information is important because consumers have a powerful lever for change according to their dietary patterns. Even if the improvements in food production methods help to reduce the environmental impacts per unit of food, the increasing demand for high-impact food items may outweigh the benefits of improved production methods (Poore and Nemecek, 2018).
Ensuring healthy diets while respecting planetary boundaries is essential to achieve the Sustainable Development Goals and other global commitments to mitigate climate change. Data on food consumption, nutrient intakes and environmental impacts are fundamental to describe, monitor, track and evaluate progress towards healthy diets from sustainable food systems. Whereas several databases provide access to information on individual food consumption (FAO and WHO, n.d.; Karageorgou et al., 2024; EFSA, 2011), and many initiatives report the environmental impacts of food production (Fanzo et al., 2020; FAOSTAT, n.d.), the environmental impacts of individual dietary intake are rarely reported. The integration of environmental impacts into dietary assessment is crucial to drive food system transformation.
The FAO/WHO Global Individual Food Consumption Data Tool (FAO/WHO GIFT) is a global database containing individual-level quantitative dietary intake data from multiple countries, made freely accessible online through an interactive website (Leclercq et al., 2019). Recently, FAO/WHO GIFT was enhanced to include new statistics and infographics on the environmental impacts of diets. The objective of this paper is to introduce the environmental infographics available on FAO/WHO GIFT and explain the methods and rationale for their development. By presenting information on the estimated environmental impacts of individual dietary intake, FAO/WHO GIFT offers evidence to support informed decisions on actions, interventions, and policies for healthy diets from sustainable food systems.
The FAO/WHO GIFT platform was designed to support better access, utilisation and visualisation of data on what people eat and drink, in particular in Low- and Middle-Income Countries (LMICs) (Leclercq et al., 2019; Balcerzak et al., 2022). The platform includes individual-level quantitative dietary intake data collected through 24-h dietary recalls or records, which provide information on the amount of all foods and beverages consumed at the individual level within the surveyed population. This type of data is key to understanding the distribution of food consumption and nutrient intake within the population and can be used by a wide range of stakeholders (Baranowsky, 2013).
As an open access tool, FAO/WHO GIFT promotes free access to dietary datasets, which can be easily downloaded following a standardised data structure and codebook (FAO, n.d.-a). In addition, the platform provides data visualisations tailored to users from different fields, presenting statistics related to food consumption, nutrient intakes, dietary diversity, food safety, and environmental impacts. At the time of writing, 66 datasets from 37 countries are available in FAO/WHO GIFT for download and visualisation. A list of available datasets and their main characteristics is provided in Supplementary material S1.
FAO/WHO GIFT statistics can be visualised through interactive infographics developed according to User Experience/User Interface principles, with the aim of presenting results in an easy-to-understand format for users who are not necessarily experts in nutrition or statistics. Considering that all statistics are based on individual-level data, users are offered a high flexibility to apply filters by sex, age, and special condition (i.e., pregnancy), as well as type of area (rural/urban) and region. This allows users to quickly calculate and visualise results without the need for complex analysis, promoting the sharing of evidence in an accessible manner.
2 Methods
2.1 Matching dietary and environmental data
A major challenge in analysing dietary data from different countries and contexts relates to the harmonisation of the description of food items. For this reason, foods reported in all dietary datasets available on FAO/WHO GIFT are harmonised with the FoodEx2 system (EFSA, n.d.). FoodEx2 is a comprehensive and flexible food classification and description system developed by the European Food Safety Authority (EFSA). FoodEx2 allows for a harmonised food description across different datasets and types of data, such as food consumption, food chemical occurrence, food environmental impacts.
The statistics and infographics on the environmental impacts of diets were developed by matching two different types of data (Figure 1): (a) Individual-level quantitative dietary intake data available on FAO/WHO GIFT, containing information on foods consumed and their quantities by survey participants, nutrient intakes and FoodEx2 food descriptors; (b) Food environmental impact data from a global database matched to FoodEx2, allowing for a rapid matching to the dietary datasets. Foods are then grouped following the standardised FAO/WHO GIFT food groups.
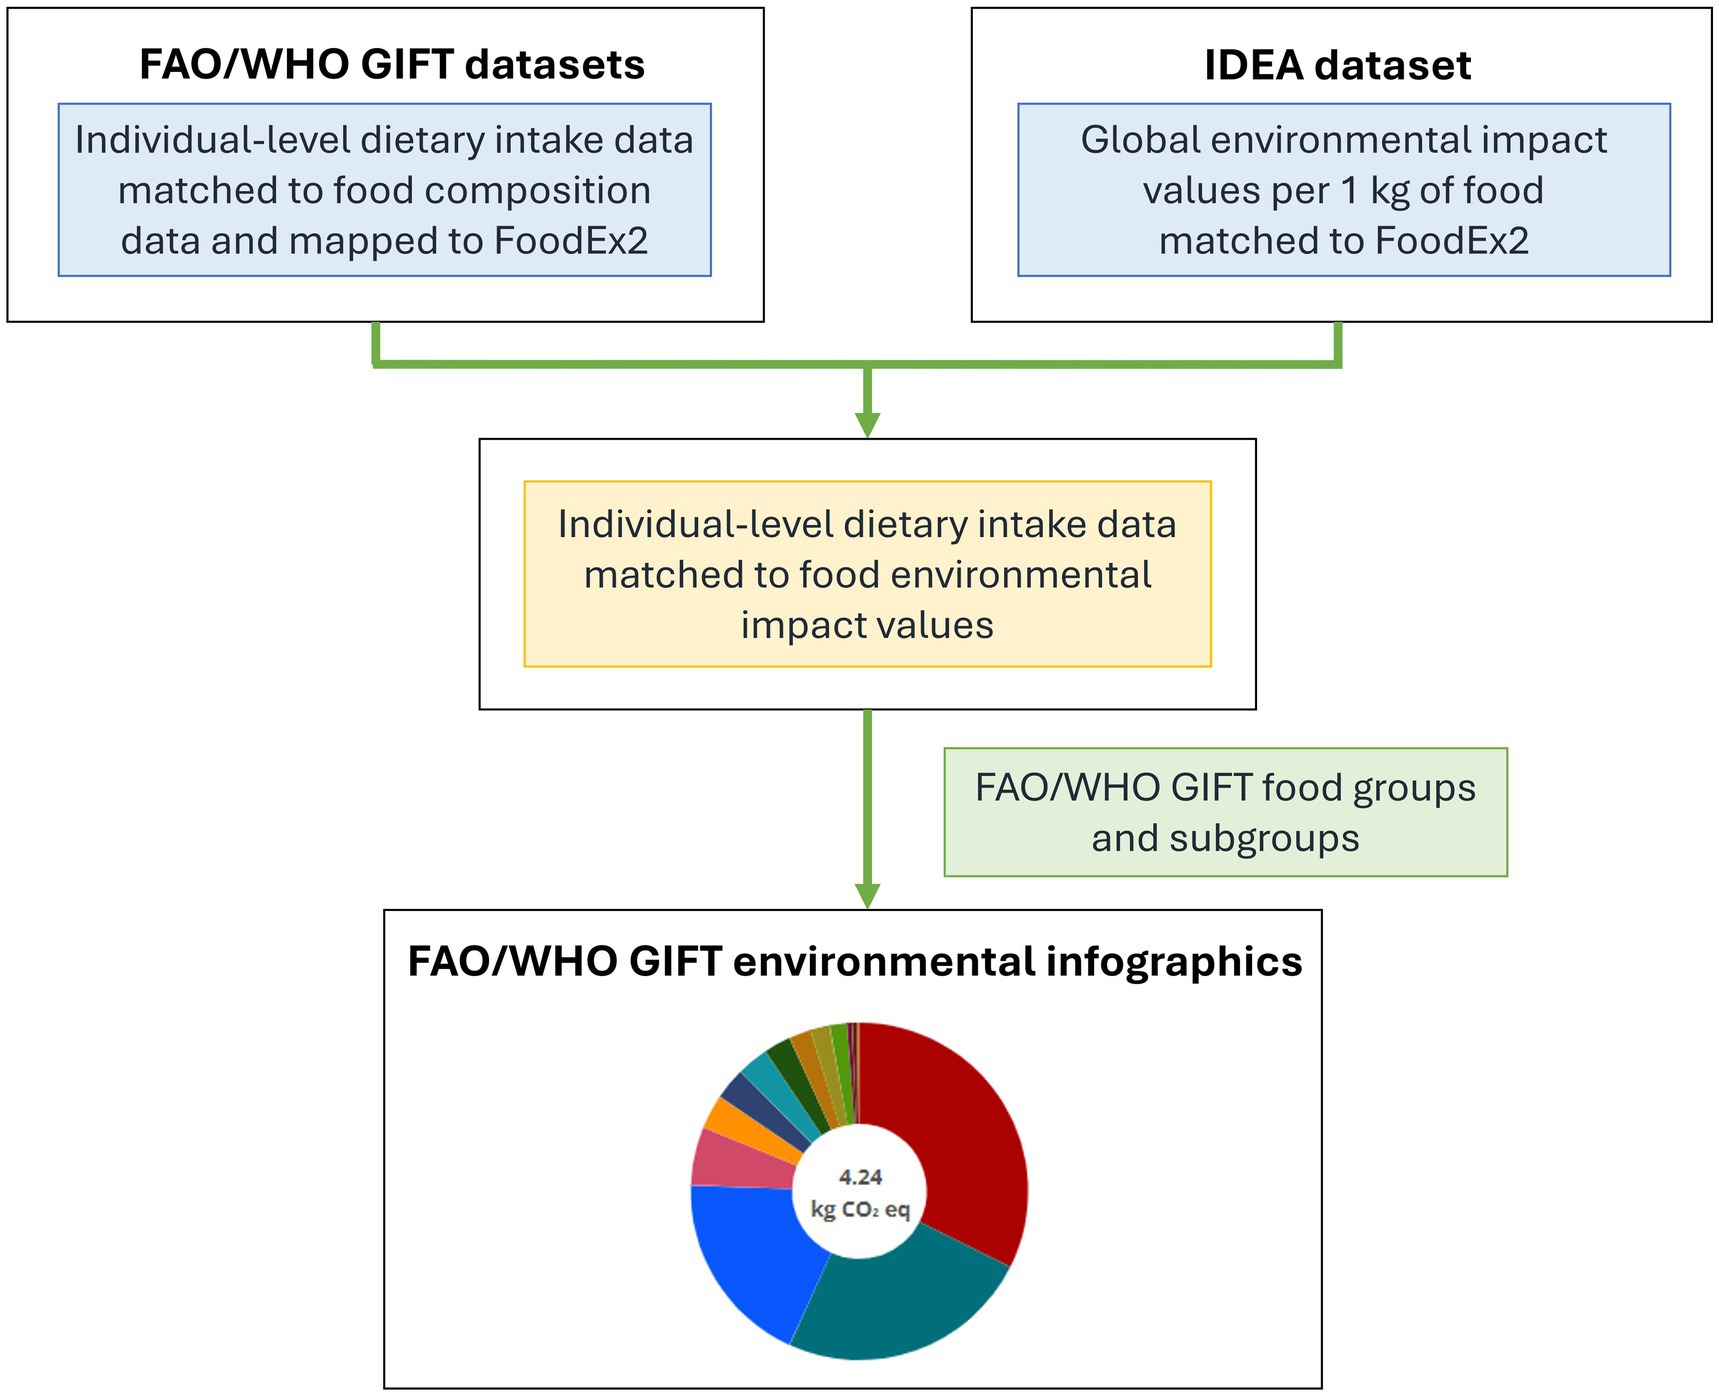
Figure 1. Matching steps used to generate the statistics and infographics on the environmental impacts of diets for FAO/WHO GIFT. FAO/WHO GIFT: Global Individual Food Consumption Data Tool.
2.2 Environmental impact data
To integrate environmental impact and dietary assessment, a tool was developed matching environmental impact values to FoodEx2, herein called Interoperable Dietary and Environmental Assessment dataset (IDEA), which provides environmental impact values for 4,089 FoodEx2 codes. IDEA is described in detail elsewhere (Tereza da Silva et al., 2025). Briefly, environmental impact data from the 43 agricultural food commodities from a systematic review providing multiple environmental impacts of foods from ∼38,000 farms in 119 countries, including LMICs (Poore and Nemecek, 2018) were manually matched to all the FoodEx2 codes from the Exposure hierarchy, using the closest food type. When no environmental values existed for a food type, proxy values from a similar food item were used. For example, beans and lentils received values from “other pulses.” If the FoodEx2 code referred to a complex product (i.e., mixed dishes and recipes containing more than one ingredient), the matching was made considering the largest recipe ingredient (by raw weight) by consulting common recipes. Adjustments were made to the environmental impact values of recipes to mitigate the risk of over- or underestimation.
To calculate the statistics, an automatic matching was performed between IDEA and dietary data available on FAO/WHO GIFT using FoodEx2 codes. This way, greenhouse gas emissions, water use, and land use values were assigned consistently to each food reported as consumed in all dietary datasets. Each FoodEx2 code was then associated to a food group and food subgroup, which are used by the FAO/WHO GIFT platform to calculate the infographics using standardised queries for all datasets and countries.
2.3 Food groups
FoodEx2 codes are grouped into food subgroups and groups allowing users to formulate relevant conclusions from the infographics and results presented in the FAO/WHO GIFT platform. The food groups presented in the environmental infographics are the same as the FAO/WHO GIFT nutrition-sensitive food groups (FAO, n.d.-b), whereas the food subgroups have some differences. In particular, the environment-sensitive break down at subgroup level separates animal-source from plant-source items to the extent possible, and presents the estimated environmental impacts from different types of meat (e.g., bovine, poultry, ovine), fruits (e.g., citrus fruits, berries, and small fruits), vegetables (e.g., tomatoes, brassicas), etc. As much as possible, FoodEx2 codes are grouped based on the environmental impacts assigned to them. The complete list of the grouping used contains 19 main food groups and 97 food subgroups and is available in Supplementary material S2.
3 Results
3.1 Environmental statistics and infographics
Statistics on the environmental impacts of dietary intake are presented in FAO/WHO GIFT for three environmental impact indicators: greenhouse gas emissions, water use and land use. These measures represent three key impacts of human activities on the planet. Greenhouse gas emissions measures global warming potential and is expressed in mass of carbon dioxide equivalent (kg CO2 eq.). Water use estimates the use of a valuable water resource and is expressed in volume (litres). Land use estimates the areas occupied by food production and is expressed in units of area [square meters (m2)].
The two sets of environmental statistics and infographics presented in FAO/WHO GIFT are described below.
3.1.1 Estimated impact by food groups
The first set of environmental infographics presents the estimated average greenhouse gas emissions (kg CO2 eq.), water use (litres) and land use (m2) of the entire diet of the selected population, and of different food groups, subgroups, and food items, per capita per day. This infographic shows the overall environmental impacts of the diet. It also offers an understanding of how the composition of the diet may influence its environmental impact by showing the contribution of different foods to the total impact.
The first results are by default calculated for the total sample of the selected dataset. The number of subjects selected by the user and their age range are presented on top of the infographics, alongside other key information about the sample (distinct population groups included, regions and type of area). Notably, the population for which the results can be calculated is limited to the population/area covered in a given survey, and special attention should be paid to the sampling design and the representativeness of the dataset when interpreting the results. Survey details are available for each dataset and contain detailed information on sampling, geographical coverage and other key aspects of the survey that should be taken into consideration when interpreting the results.
Figure 2A provides an example from the Mexican National Health and Nutrition Survey 2012. The chart in the centre displays the average values of the selected environmental indicator (per capita per day) for the entire diet. Each slice of the chart represents a food group, according to the legend beside the chart. A tooltip is visible when rolling the mouse over each slice (Figure 2B) and shows the average impact values of the selected group in relation to the average consumption. A similar chart is displayed by clicking on the food group slice, presenting the average impact values for the food group and slices for the food subgroups. The same can be done by clicking on the subgroup slice, leading to a chart displaying the average impact values per food item (Figure 2C).
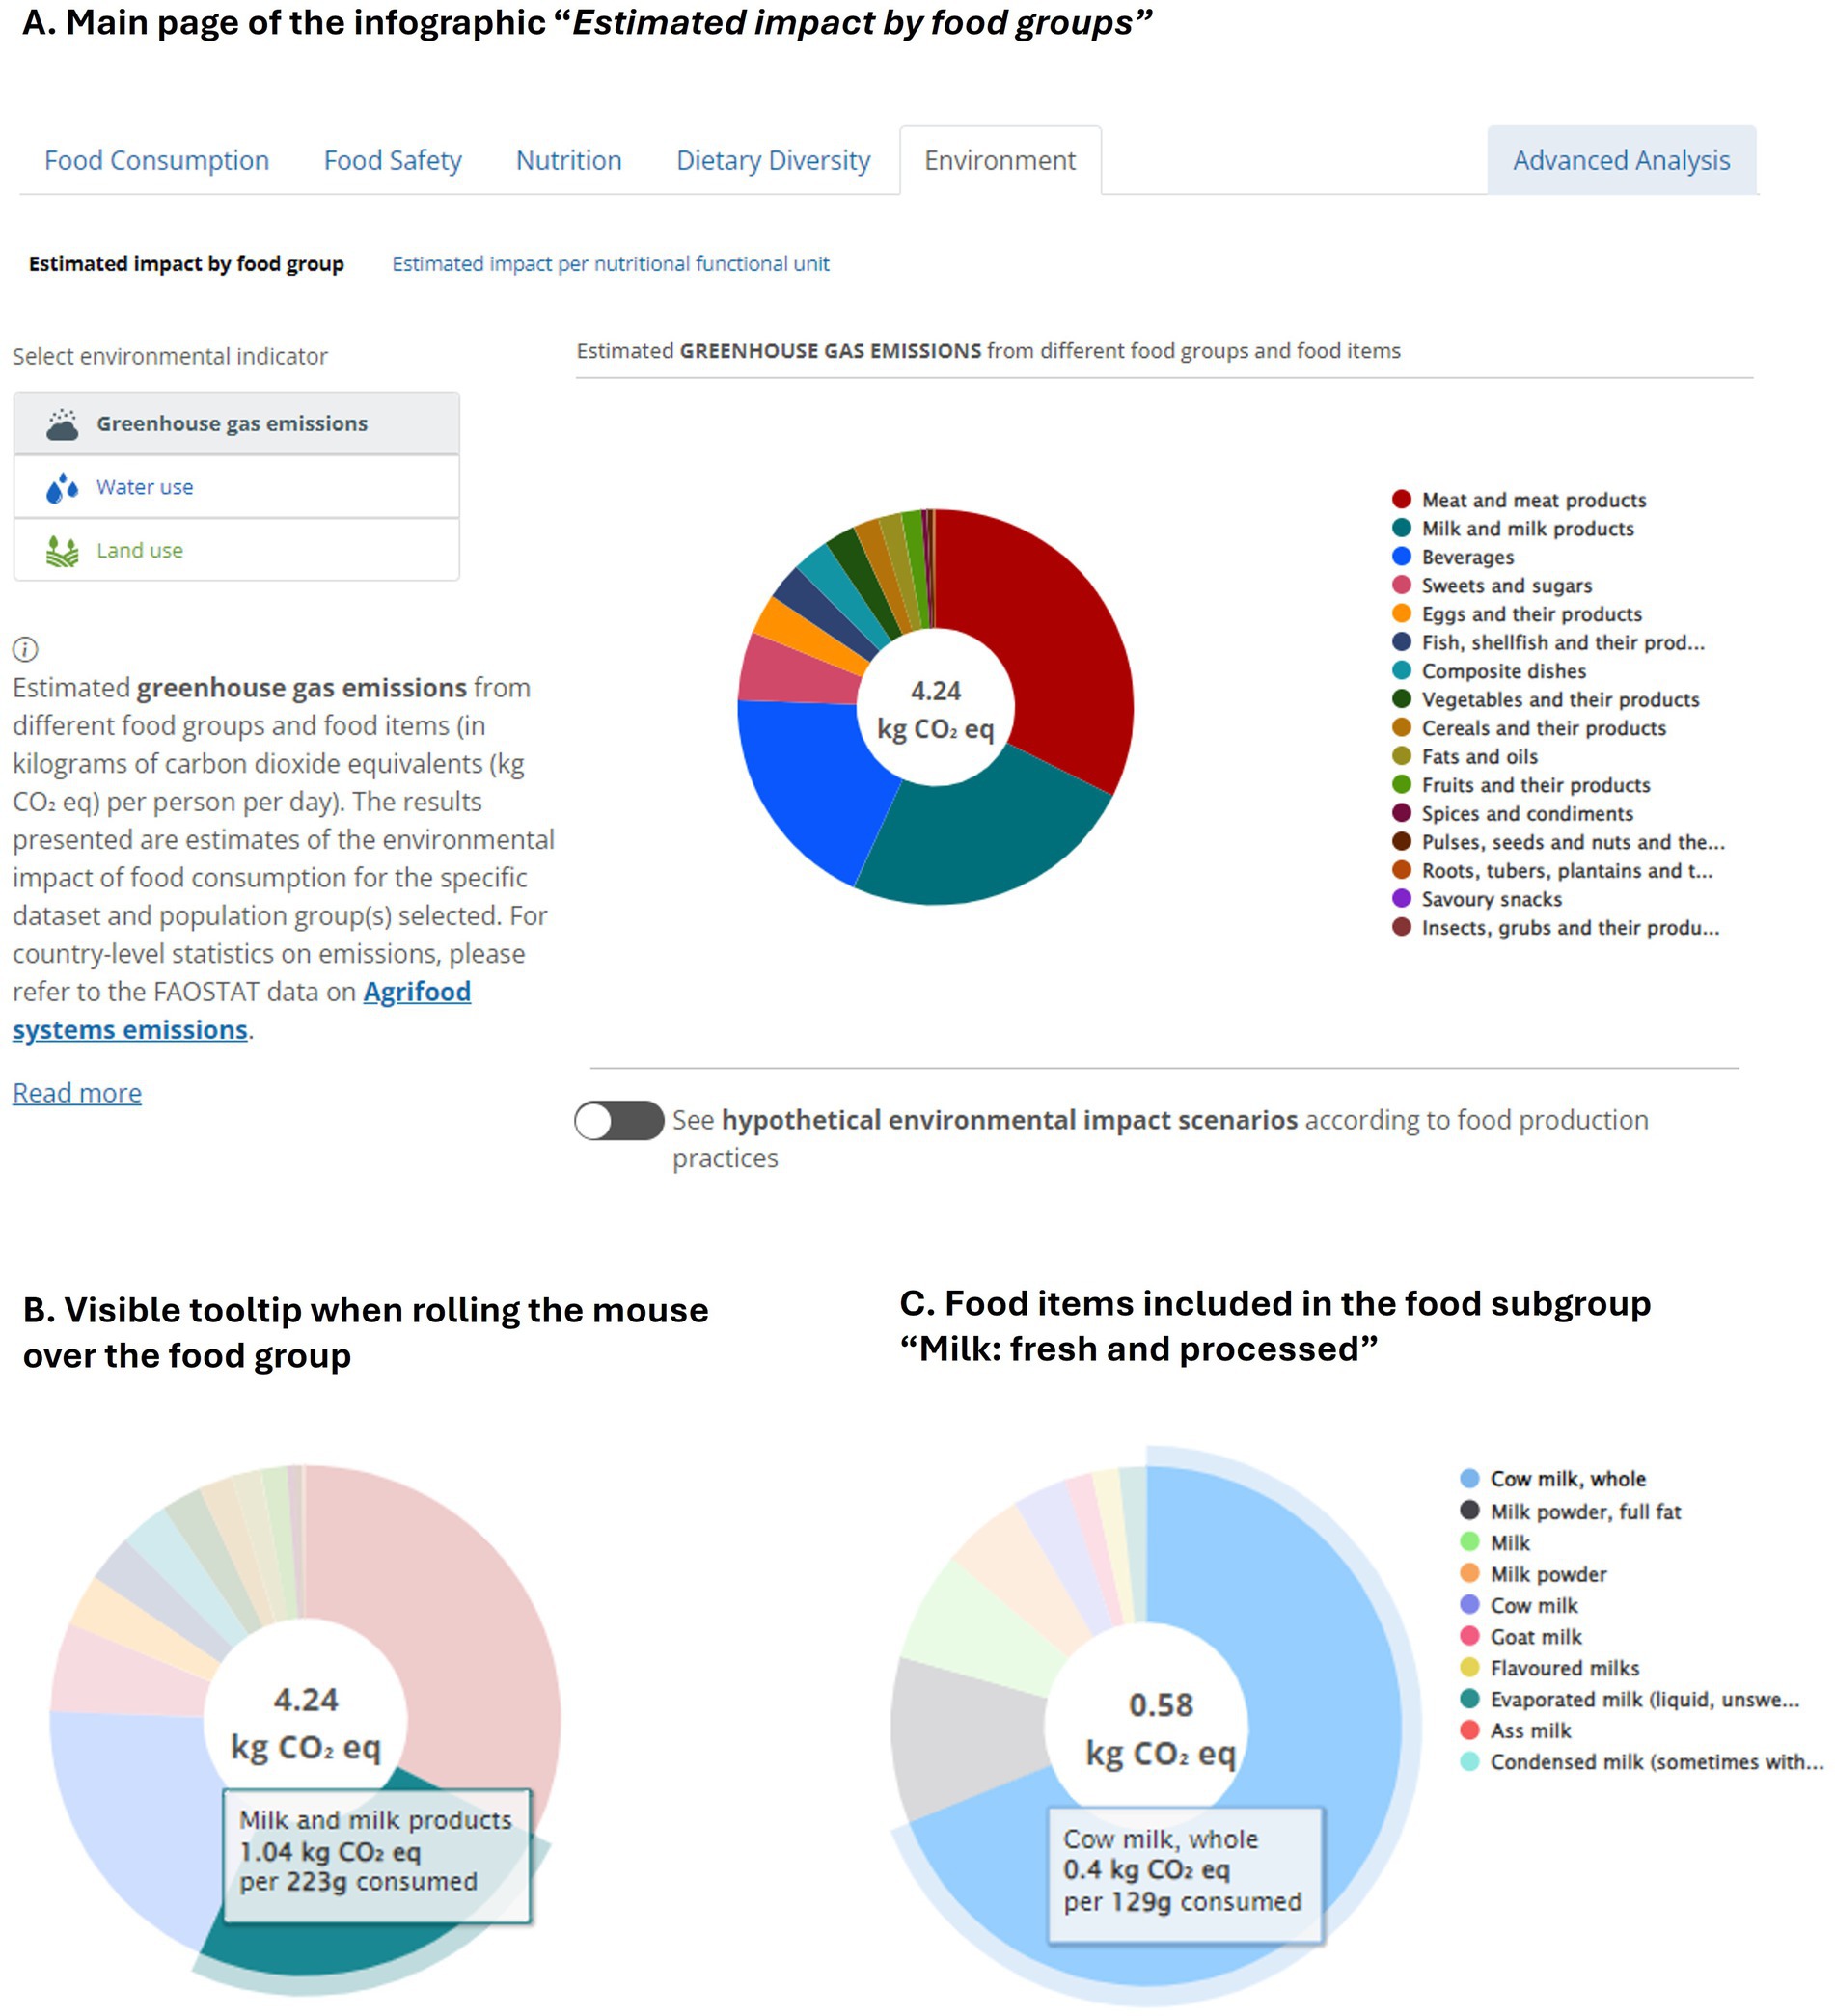
Figure 2. (A) Snapshot of the FAO/WHO GIFT infographics presenting the estimated greenhouse gas emissions, water use and land use of the entire diet of the selected population, and of different food groups, subgroups, and food items, per capita per day. The example presented is for greenhouse gas emissions estimates (kg CO2 eq.). (B) The average impact values of the selected food group in relation to the average consumption is shown by rolling the mouse over the chart slice. (C) The graphs present the average impact values by food group, subgroup and item. The example presented is for greenhouse gas emissions estimates of the food items within the food subgroup “Milk: fresh and processed” and food group “Milk and milk products.” All figures present estimates for the entire sample of the Mexican National Health and Nutrition Survey 2012.
All results are presented in three graphs. The main graph shows results calculated using the global average environmental impact of each food. By clicking on the button “See hypothetical environmental impact scenarios according to food production practices,” two additional graphs are displayed (Figure 3). These graphs present hypothetical scenarios showing the environmental impact of the same diet if all foods had lower environmental impacts (low-impact scenario), or higher environmental impacts (high-impact scenario). These hypothetical scenarios reflect the variation in environmental impact values and provide an understanding of the uncertainty around estimates using the global means (main graph).
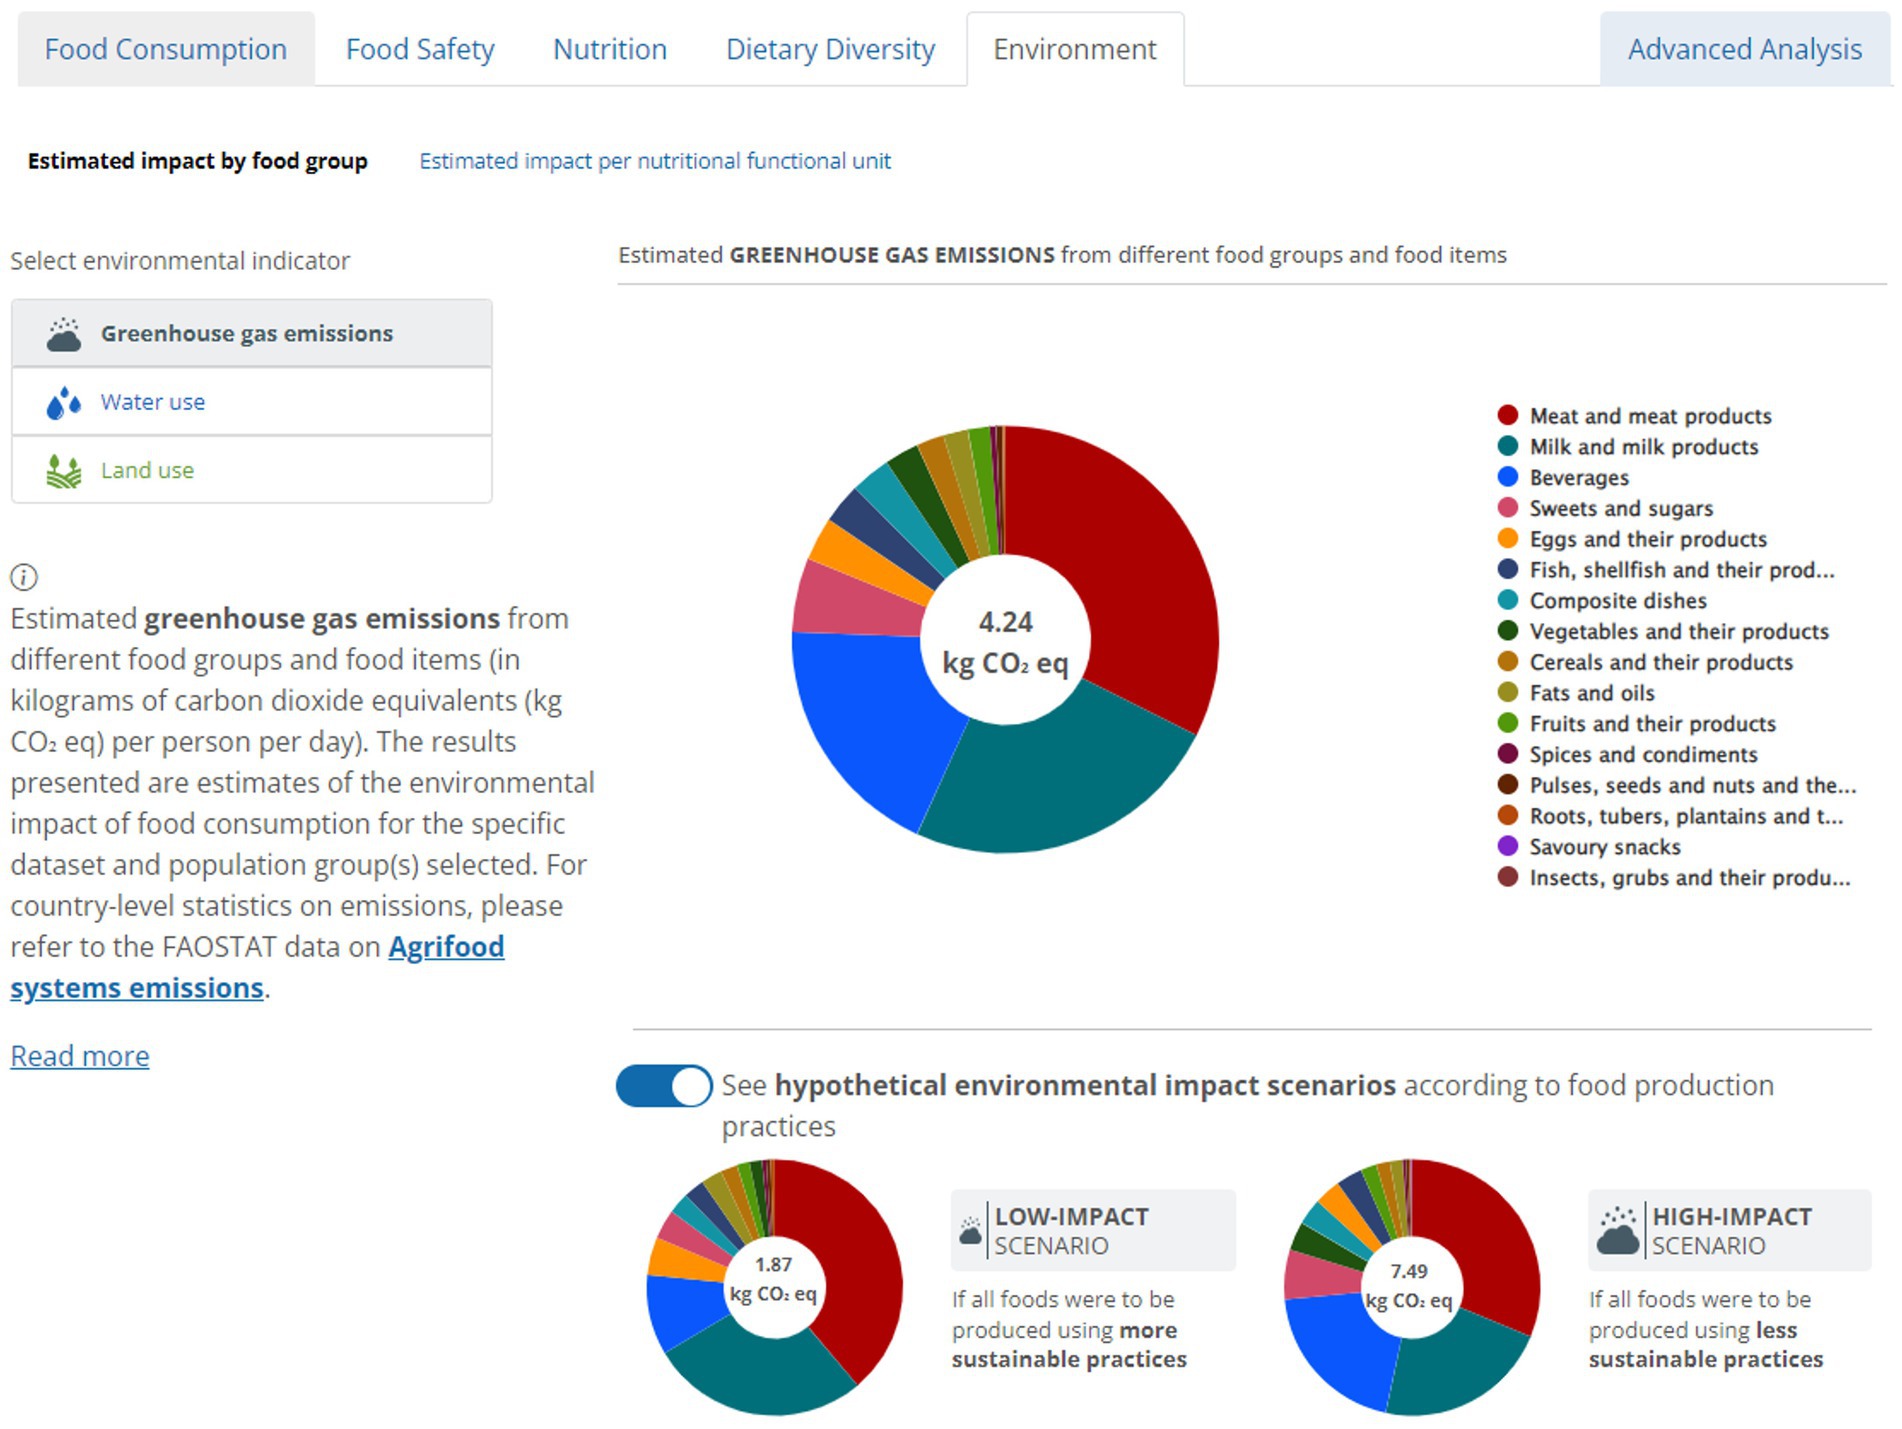
Figure 3. Snapshot of the hypothetical scenarios showing the environmental impact of the same diet if all foods had lower environmental impacts (low-impact scenario), or higher environmental impacts (high-impact scenario). The figure presents estimates for the entire sample of the Mexican National Health and Nutrition Survey 2012.
The results for the first set of infographics are calculated by multiplying the quantities of foods consumed by the environmental impacts of that given food. After calculating the environmental impact per food consumed, the impacts of the entire diet and by food groups and subgroups are calculated by summing up all foods consumed by an individual per day. If an individual has multiple 24-h dietary recalls/records, an average of food consumption across the reported days is computed. The infographics are calculated separately for the three different environmental impact levels for each food (low, average and high impact). The low-impact scenario is calculated using the 10th percentile of the environmental impact of each food, whereas the high-impact scenario is calculated using the 90th percentile of the environmental impact of each food, both based on a previous study (Poore and Nemecek, 2018).
3.1.2 Estimated impact per nutritional functional units
In terms of data presentation, environmental impacts of diets are usually reported per weight or volume (kg or litres) (FAOSTAT, n.d.) of food or beverage consumed. While this approach is simple and easy to understand, it does not express food functionality (McLaren et al., 2021), i.e., to nourish by providing dietary energy and nutrients to the body. Functional units that take into consideration the nutritional function of foods are key to describe environmental impacts in the context of healthy diets from sustainable food systems (McLaren et al., 2021).
The second set of environmental infographics presents the estimated average greenhouse gas emissions (kg CO2 eq.), water use (litres) and land use (m2) per 1,000 kilocalories (kcal), 10 grams (g) of protein and 100 milligrams (mg) of calcium reported as consumed, per capita per day (Figure 4). In this indicator, the results are presented for the entire diet only. No values per food group, subgroup or item are displayed. The greenhouse gas emissions, water use, and land use values are presented side by side. Similarly to the previous infographic, the low- and high-impact scenarios are displayed by clicking the “See hypothetical environmental impact scenarios according to food production practices” button (Figure 4).
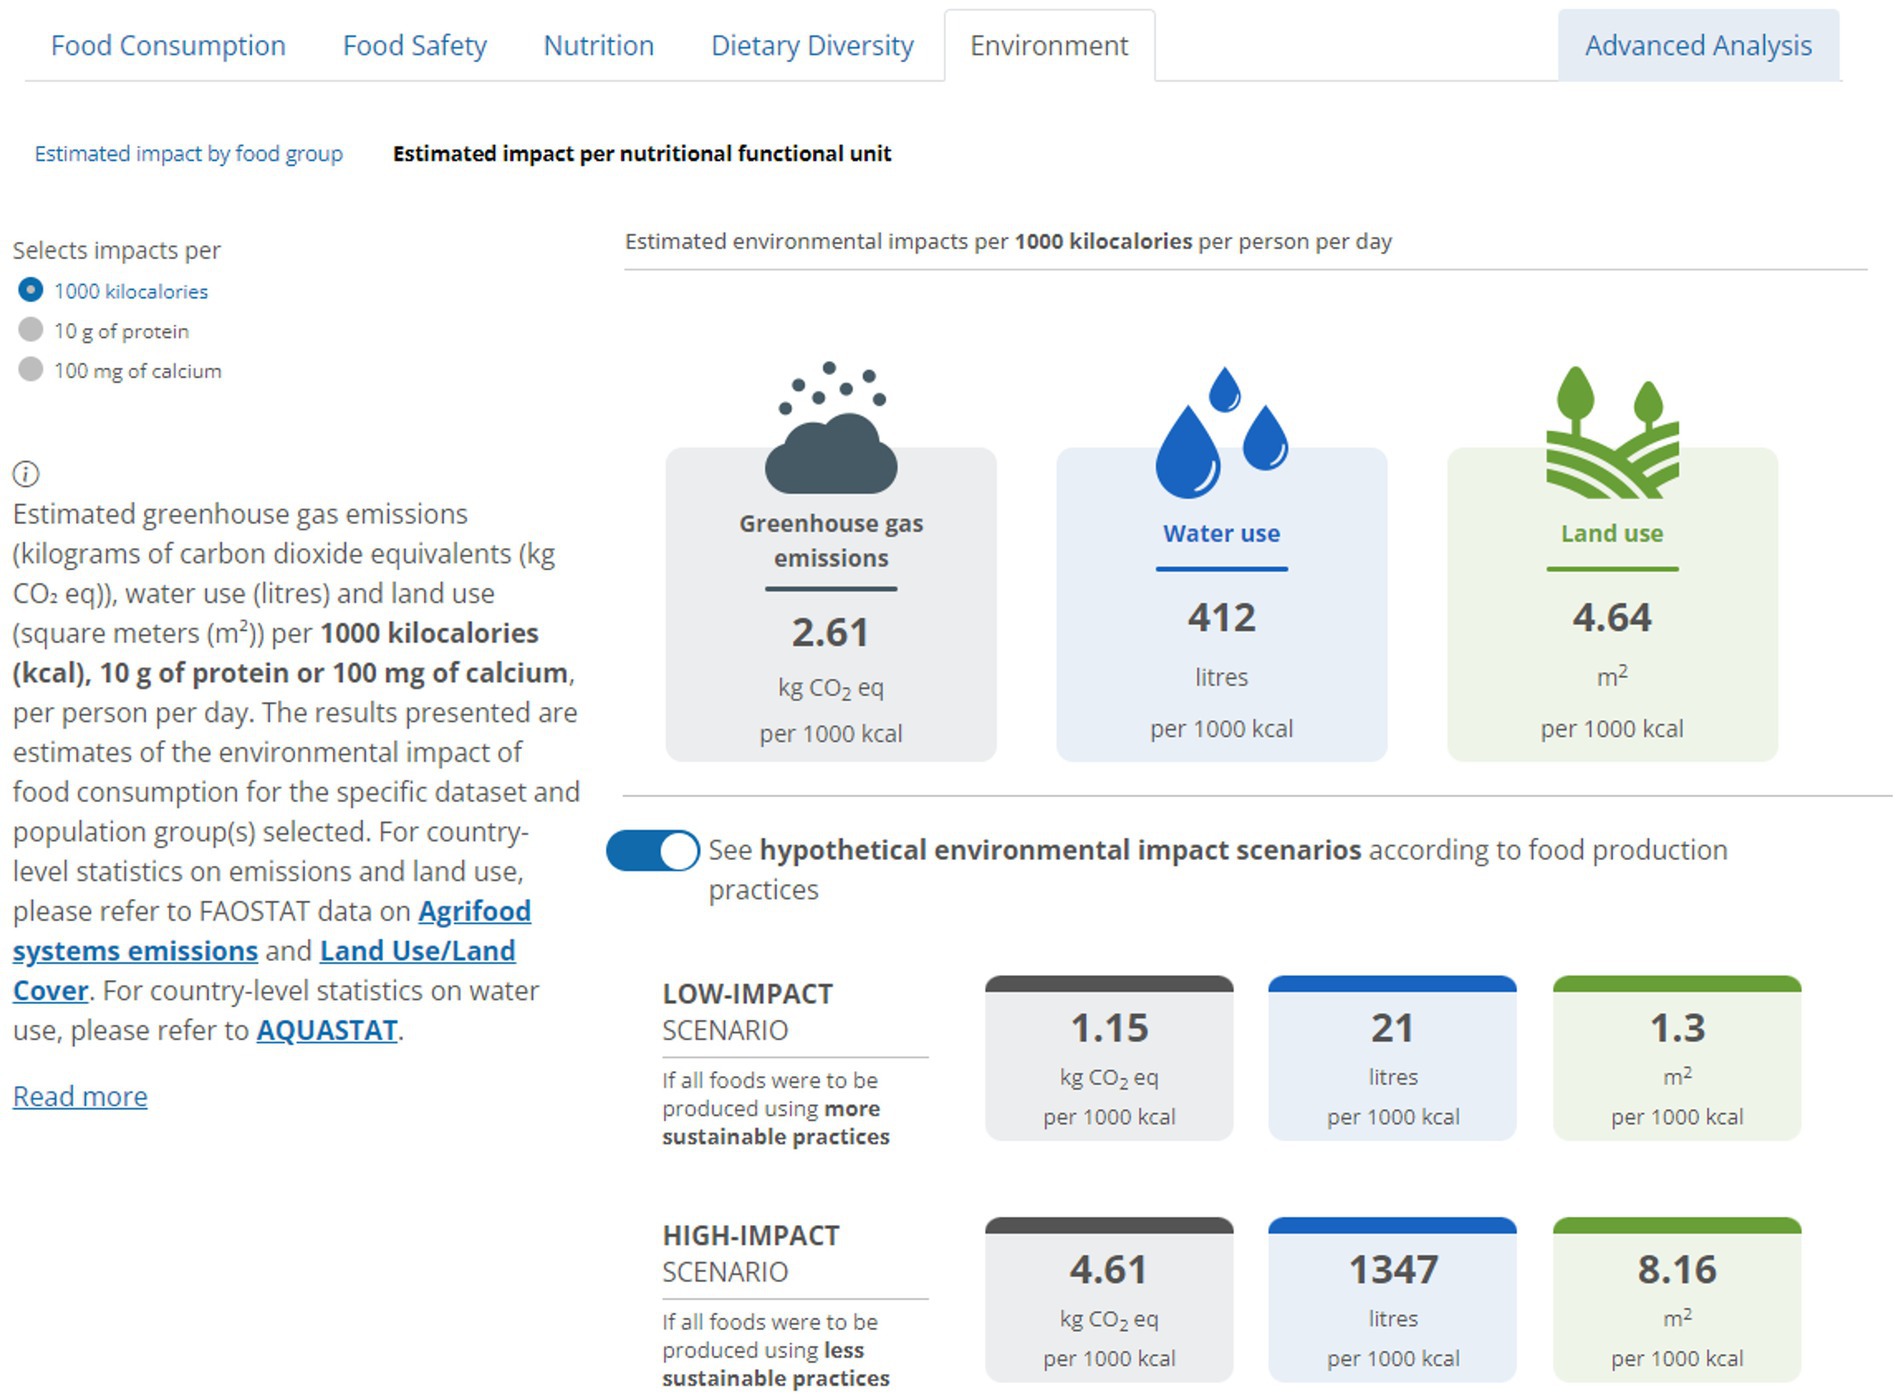
Figure 4. Snapshot of the FAO/WHO GIFT infographics presenting the estimated greenhouse gas emissions, water use and land use of the entire diet of the selected population, per 1,000 kilocalories (kcal), 10 grams (g) of protein and 100 milligrams (mg) of calcium reported as consumed, per capita per day. The example presented is for impacts per 1,000 kcal. The figure presents estimates for the entire sample of the Mexican National Health and Nutrition Survey 2012.
The calculations for the second set of infographics are consistent with those used to calculate the results for the “Estimated impact by food groups” infographics, with a few additional steps. Once the environmental impacts of the entire diet per capita per day are calculated, the same procedure is applied to calculate the daily per capita energy intake, protein intake or calcium intake. Finally, the population daily average environmental impacts of diets per 1,000 kcal, 10 g protein, or 100 mg of calcium are calculated. Also in this case, the results for the three levels of environmental impact are calculated separately.
Dietary energy, protein and calcium were selected based on their importance in providing insights into food security and different forms of malnutrition and considering data availability. It is important to highlight that the functional units used should not be interpreted as a means of indicating nutrient adequacy/inadequacy and are not intended to reflect dietary energy and nutrient requirements. The infographics in FAO/WHO GIFT aimed at providing useful information for the assessment of nutrient adequacy are within the “Nutrition” and “Advanced Analysis” sub-sections (FAO, n.d.-c). The purpose of the functional units in the environmental infographics is to normalise the results – for example, for every X kcal, the diet has a certain environmental impact. With this purpose, the values selected for the functional units were intentionally different from dietary energy or nutrient intake recommendations to avoid confusion.
4 Discussion
In this paper, we described the statistics and infographics on the environmental impacts of diets based on individual-level quantitative dietary intake data available on the FAO/WHO GIFT platform. These infographics are easy to interpret, enabling their usage by users that are not necessarily experts, in particular policymakers and governmental institutions. They allow users to understand the average footprint of diets, and which food groups contribute most to the footprints. They also allow users to understand the environmental impact of diets per 1,000 kcal, 10 grams of protein and 100 mg of calcium.
Tools in dietary impact assessment are necessary to inform food system transformation. By depicting the closest possible information of actual food consumption, FAO/WHO GIFT provides insight into dietary patterns, and how these patterns can be shaped to minimise environmental impacts. The environmental infographics consider global average values for the environmental impacts of foods (Poore and Nemecek, 2018) which serve as useful estimates in the absence of regional, national, or subnational values, a common scenario in many LMICs. In this context, FAO/WHO GIFT provides standardised analysis on the environmental impacts of diets for different datasets and countries, considering harmonised environmental impact values, food groups and nutritional functional units, in a rapid, effortless manner. This level of standardisation and harmonisation is possible due to the use of a common food classification and description system (FoodEx2) (EFSA, n.d.) for all dietary datasets shared in FAO/WHO GIFT and for the environmental impact values used (Tereza da Silva et al., 2025). This makes FAO/WHO GIFT the first open access global tool to provide standardised estimates on the environmental impacts of diets based on individual dietary data for multiple datasets. In addition, FAO/WHO GIFT provides access to harmonised microdata from dietary surveys, allowing users to perform their own analysis on the environmental impact of diets. These innovations offered by FAO/WHO GIFT do not only advance the understanding of dietary impacts on the environment, but also pave the way for informed interventions to promote healthy diets from sustainable food systems worldwide.
Potential caveats should be noted. Even if global environmental impact values are useful in the absence of context-specific values, a more accurate depiction of actual environmental impacts requires context, regional or national-specific data. In addition, the limited availability of environmental impact data at food item level and the consequent need to rely on data for broader food categories also constitutes a challenge. Addressing these gaps requires further efforts to gather and analyse data tailored to specific geographic contexts and production systems, enhancing our understanding of the nuanced environmental footprints associated with different regions and specific food items. These points are crucial for informing evidence-based policies and should be a priority for future research. The availability of up-to-date dietary intake data also represents a challenge. Time-relevant dietary data are essential to accurately capture current food consumption practices and to inform effective, evidence-based nutrition policies (FAO and Intake, 2022; de Quadros et al., 2022). Nevertheless, available dietary intake data for many countries, in particular LMICs, were collected more than a decade ago. Consequently, they may not fully reflect current consumption patterns, potentially limiting the generalisability of some results. In addition, the environmental impacts of diets displayed on FAO/WHO GIFT also require careful interpretation according to the characteristics of the dietary survey for which the impacts were calculated. For instance, some dietary surveys are at the subnational level or include only specific population groups (e.g., women or children) and thus are not always representative of the country population. Other factors that affect dietary patterns also vary between surveys, such as season coverage, period of data collection and type of area. For these reasons, results should be interpreted taking into account the specific characteristics of each survey, summarised in Supplementary material S1 and described in the platform’s Survey details, and with complementary sources of evidence where available. Notwithstanding these limitations, the dietary intake datasets included in FAO/WHO GIFT remain among the most valuable sources of information currently available for these countries, helping to characterise overall consumption patterns across diverse contexts.
The complex relationship between diets and environmental sustainability underscores the need for innovative approaches to assess and address their impacts. While reporting environmental impacts at the product or country level is common, the integration of environmental impact data to dietary assessments using individual-level quantitative dietary intake data remains underexplored. Recognising the potential of diets to drive food system transformation, efforts to provide detailed dietary and environmental impact data are crucial. FAO/WHO GIFT emerges as a valuable resource, offering comprehensive insights into food consumption patterns and their environmental implications, and provides a framework and approach that can be easily implemented at a larger scale as more data become available. Moving forward, continued collaboration and refinement of tools like FAO/WHO GIFT may contribute to advance efforts towards healthy diets for the people and the planet.
Data availability statement
The datasets presented in this study can be found in online repositories. The names of the repository/repositories and accession number(s) can be found at https://www.fao.org/gift-individual-food-consumption/en/.
Author contributions
VQ: Visualization, Data curation, Methodology, Conceptualization, Writing – original draft, Writing – review & editing. JT: Writing – review & editing, Writing – original draft, Data curation, Visualization, Methodology, Conceptualization. AB: Methodology, Data curation, Writing – review & editing. PA: Writing – review & editing, Methodology, Data curation. CL: Writing – review & editing, Conceptualization, Methodology. MF: Methodology, Writing – review & editing. XS: Writing – review & editing, Methodology. CR: Methodology, Conceptualization, Writing – review & editing. BH: Writing – review & editing, Supervision, Conceptualization.
Funding
The author(s) declare that financial support was received for the research and/or publication of this article. This research was funded by the Gates Foundation, grant numbers INV-010508 and INV-053345, and the Food and Agriculture Organization of the United Nations.
Acknowledgments
The authors would like to acknowledge the FAO colleagues (current and former) that supported the development of the FAO/WHO GIFT platform’s environmental infographics, namely Rita Ferreira de Sousa, Teresa Bevere, Valeria Scrilatti, Giovanni Luca Abblasio, Giles Hanley-Cook and Simone Gie. We would also like to acknowledge Sarah Bridle and all FAO colleagues that provided inputs throughout the development process. We are thankful to all data providers that have shared their data through the platform and for their interest in being a part of this global initiative.
Conflict of interest
The authors declare that the research was conducted in the absence of any commercial or financial relationships that could be construed as a potential conflict of interest.
Generative AI statement
The authors declare that no Gen AI was used in the creation of this manuscript.
Any alternative text (alt text) provided alongside figures in this article has been generated by Frontiers with the support of artificial intelligence and reasonable efforts have been made to ensure accuracy, including review by the authors wherever possible. If you identify any issues, please contact us.
Publisher’s note
All claims expressed in this article are solely those of the authors and do not necessarily represent those of their affiliated organizations, or those of the publisher, the editors and the reviewers. Any product that may be evaluated in this article, or claim that may be made by its manufacturer, is not guaranteed or endorsed by the publisher.
Author disclaimer
The views expressed in this publication are those of the authors and do not necessarily reflect the views or policies of the Food and Agriculture Organization of the United Nations.
Supplementary material
The Supplementary material for this article can be found online at: https://www.frontiersin.org/articles/10.3389/fsufs.2025.1662566/full#supplementary-material
References
Afshin, A., Sur, P. J., Fay, K. A., Cornaby, L., Ferrara, G., Salama, J. S., et al. (2019). Health effects of dietary risks in 195 countries, 1990–2017: a systematic analysis for the global burden of disease study 2017. Lancet 393, 1958–1972. doi: 10.1016/S0140-6736(19)30041-8,
Balcerzak, A., Bevere, T., Padula de Quadros, V., and Holmes, B. A. (2022). Open data sharing for dietary survey data. UN-Nutrition journal volume 1: Transforming nutrition, vol. 1. Rome: FAO, 99–102.
Baranowsky, T. (2013). “24-hour recall and diet record methods” in Nutritional epidemiology. ed. W. Willett. 3rd ed (Oxford: Oxford University), 49–69.
de Quadros, V. P., Balcerzak, A., Allemand, P., de Sousa, R. F., Bevere, T., Arsenault, J., et al. (2022). Global trends in the availability of dietary data in low and middle-income countries. Nutrients 14:2987. doi: 10.3390/nu14142987,
Deconinck, K., Jansen, M., and Barisone, C. (2023). Fast and furious: the rise of environmental impact reporting in food systems. Eur. Rev. Agric. Econ. 50, 1310–1337. doi: 10.1093/erae/jbad018
EFSA. Food classification standardisation – the FoodEx2 system. Available online at: https://www.efsa.europa.eu/en/data/data-standardisation (Acessed October 11, 2025).
EFSA (2011). Use of the EFSA comprehensive European food consumption database in exposure assessment. EFSA J. 9:2097. doi: 10.2903/j.efsa.2011.2097
Fanzo, J., Bellows, A. L., Spiker, M. L., Thorne-Lyman, A. L., and Bloem, M. W. (2021). The importance of food systems and the environment for nutrition. Am. J. Clin. Nutr. 113, 7–16. doi: 10.1093/ajcn/nqaa313,
Fanzo, J., Haddad, L., McLaren, R., Marshall, Q., Davis, C., Herforth, A., et al. (2020). The Food Systems Dashboard is a new tool to inform better food policy. Nat. Food 1, 243–246. doi: 10.1038/s43016-020-0077-y
FAO. (n.d.-a) Data collation, harmonisation and sharing. Available online at: https://www.fao.org/gift-individual-food-consumption/methodology/data-collation-harmonisation-and-sharing/en (Acessed October 11, 2025).
FAO. (n.d.-b) Food groupings used by the FAO/WHO GIFT platform. Available online at: https://www.fao.org/gift-individual-food-consumption/methodology/food-groups-and-sub-groups/en (Acessed October 11, 2025).
FAO. (n.d.-c) Estimated usual intakes of selected nutrients. Available online at: https://www.fao.org/gift-individual-food-consumption/methodology/indicators-and-summary-statistics/estimated-usual-intakes-of-selected-nutrients/en (Acessed October 11, 2025).
FAOSTAT. Emissions totals. Available online at: https://www.fao.org/faostat/en/#data/GT (Acessed October 11, 2025).
FAO and WHO. (n.d.) FAO/WHO Global Individual Food Consumption Data Tool. Available online at: http://www.fao.org/gift-individual-food-consumption/en (Acessed October 11, 2025).
Karageorgou, D., Lara-Castor, L., de Quadros, V. P., de Sousa, R. F., Holmes, B. A., Ioannidou, S., et al. (2024). Harmonising dietary datasets for global surveillance: methods and findings from the global dietary database. Public Health Nutr. 27:e47. doi: 10.1017/S1368980024000211
Leclercq, C., Allemand, P., Balcerzak, A., Branca, F., Sousa, R. F., Lartey, A., et al. (2019). FAO/WHO GIFT (global individual food consumption data tool): a global repository for harmonised individual quantitative food consumption studies. Proc. Nutr. Soc. 78, 484–495. doi: 10.1017/S0029665119000491,
McLaren, S., Berardy, A., Henderson, A., Holden, N., Huppertz, T., Jolliet, O., et al. (2021). Integration of environment and nutrition in life cycle assessment of food items: Opportunities and challenges. Rome.
Poore, J., and Nemecek, T. (2018). Reducing food’s environmental impacts through producers and consumers. Science 360, 987–992. doi: 10.1126/science.aaq0216,
Keywords: food systems, healthy diets, dietary assessment, environmental impacts, greenhouse gas emissions, water use, land use
Citation: de Quadros VP, Tereza da Silva J, Balcerzak A, Allemand P, Leclercq C, Ferrari M, Schmidt Rivera X, Reynolds C and Holmes BA (2025) Estimating the environmental impact of diets based on individual-level dietary intake data: infographics on the FAO/WHO GIFT platform. Front. Sustain. Food Syst. 9:1662566. doi: 10.3389/fsufs.2025.1662566
Edited by:
Meike Morren, VU Amsterdam, NetherlandsReviewed by:
Diane Zimmermann, Independent Scholar, Geneva, SwitzerlandLuca Muzzioli, Sapienza University of Rome, Italy
Copyright © 2025 Food and Agriculture Organization of the United Nations. This is an open-access article distributed under the terms of the Creative Commons Attribution License (CC BY). The use, distribution or reproduction in other forums is permitted, provided the original author(s) and the copyright owner(s) are credited and that the original publication in this journal is cited, in accordance with accepted academic practice. No use, distribution or reproduction is permitted which does not comply with these terms.
*Correspondence: Victoria Padula de Quadros, dmljdG9yaWEucGFkdWxhZGVxdWFkcm9zQGZhby5vcmc=