 Kunxiang Wei
 Fan Zhang2†
 Chunjing Lou
- 1School of Public Administration, Shenyang Normal University, Shenyang, China
- 2Agricultural Information Institute, Chinese Academy of Agricultural Sciences, Beijing, China
The food system faces severe global climate change and resource constraints, requiring consideration of its resource consumption and ecosystem impact. How to achieve food security under the water-energy-food-ecology (WEFE) system framework is a common challenge for all countries worldwide. Therefore, food security research from the perspective of WEFE holds great practical value and significance. It aligns with the vision of meeting people’s ecological resource needs and supports the UN Sustainable Development Goals. This study constructed a measurement system consisting of 4 subsystems and 17 indicators and used 2014–2021 panel data from 31 provincial-level regions to assess food security capability from the perspective of WEFE. The findings are as follows: (1) The food security guarantee capacity of 31 provincial-level regions improved from 2014 to 2021. (2) From 2014 to 2021, a small number of indicators contributed more significantly to food security capacity: agricultural fertilizer application, diesel use and pesticide use had an average annual contribution of 46.71% (potentially unsustainable with environmental risks). Additionally, some indicators saw a marked rise in contribution–over 8 years, water-saving irrigation area, cumulative soil erosion control area and green coverage area increased by 27.17, 22.29, and 25.93%, highlighting the key role of ecological environment and resource elements in the food system. (3) From 2014 to 2021, the relative importance (or influence) of the indicators on food security capacity remained relatively stable: pesticide use dropped significantly by 22.17%, while other indicators changed by less than 10%. (4) Based on the food security capacity assessment results, this study designed a functional zoning (seven types). The determination of functional zoning was based on the assessment results of the water, energy, food, and land subsystems within the food security capacity assessment results. Furthermore, it proposed targeted response strategies and policy recommendations to enhance the region’s food security, based on the characteristics of different functional areas. This study provided more reasonable functional zoning methods and more realistic results, which can promote balanced WEFE development, stabilize regional food supply, optimize water and energy use in production, protect ecology, strengthen global food security, and offer a Chinese solution for a new international food security paradigm.
1 Introduction
The food system is facing the severe situation of global climate change and resource constraints, a situation that makes it necessary to consider the system’s resource consumption and its impact on the ecosystem. How to achieve food security under the framework of the water-energy-food-ecology system (WEFE) is a common problem that has to be faced by all countries in the world. According to the 2025 Global Report on Food Crises, nearly 300 million people around the world will face serious food insecurity in 2025 (FSIN and GNAFC, 2025). The main reason is that the global food system is facing multiple challenges such as climate change and geopolitical conflicts, which will seriously threaten the food security level of countries. In this context, the world is very concerned about how to achieve the “Zero Hunger,” which is goal 2 of the United Nations Sustainable Development Goals (SDGs) (Ge et al., 2018; Tang Y. F. et al., 2021; Wang and Huang, 2024). It is necessary to study how to eliminate hunger, promote food security, improve nutritional status and promote the sustainability of agricultural systems.
As a country with a large population, food security has always been regarded as a national strategy in China, and a large number of policies have been promulgated for the construction and maintenance of food systems (Zeng et al., 2025). In 1992, the Chinese government formally defined the concept of food security. It was summarized as ensuring that all residents have effective access to sufficient food, with a rational structure and high quality. This concept is highly consistent with the international concept of food security (FAO, 2017), as both share the core demands for adequate, healthy, and high-quality food. Many issues such as carbon emissions, ecological impacts, and resource consumption from the food system have received increasing attention (Shi et al., 2025; Huan et al., 2025). Consequently, there is a hope that the food system will become more sustainable and transform into a greener, more ecological model of agriculture (Eakin et al., 2017; McMichael, 2011). In this context, China has innovatively proposed a concept of “all-encompassing approach to food” based on its own resource endowment and development needs. In recent years, Chinese government has issued a series of policies [including Opinions on Practicing the All-encompassing Approach to Food and Building a Diversified Food Supply System, Comprehensive Rural Revitalization Plan (2024–2027), National Whole Grain Action Plan (2024–2035), etc.] to practice the concept of “all-encompassing approach to food” (Xiong et al., 2025). The all-encompassing approach to food is an extension and expansion of the concept of food security, emphasizing the construction of a diversified food supply system and the development of food resources from multiple channels. This means that more types of food are included in the residents’ diet, which will reduce the supply pressure of staple crops. In addition, the all-encompassing approach to food is also an important part of the structural reform of China’s agricultural supply side. The reason is that the concept has a strong sustainable development position, emphasizing that the food system should maintain a harmonious balance with the ecosystem, and minimize the impact on the ecological environment and the inefficient consumption of resources on the premise of ensuring food supply (Fan S. G. et al., 2023).
Food security is an important part of national security (Frantsisko et al., 2020). How to build a more resilient food system is the top priority of national policy agendas (Deconinck et al., 2023). A more resilient food system refers to the ability of the food system to withstand and recover from challenges (Kertolli et al., 2024). Adaptability, diversification and sustainability are needed to enable countries to maintain food security in the face of challenges such as climate change and market volatility (Béné, 2020). To build a more resilient food system, the interconnections among various components such as water resources, ecology, energy, social and economic factors should be considered, so as to enhance the ability of the food system to withstand various risks and recover from them (Tebaldi and Vignali, 2023). Among them, water, energy, food and ecology are interrelated and inseparable resources that are closely and complexly related (Fu et al., 2024). Water, food and energy are important resources for human social and economic development, with various complex synergies at local, regional and national levels. This is known as the water-energy-food (WEF) nexus (Haji et al., 2022). Terrestrial ecosystems are critical to the safety of food, water and energy, so ecosystems are at the center of this nexus (Bidoglio and Brander, 2016). They together constitute the known water-energy-food-ecology nexus (WEFE nexus) (Shi et al., 2020). The above nexus shows that the essence of food security is a cross-domain and cross-scale complex system problem.
In the field of Rural and Regional Development, functional zoning is formulated to achieve regional development goals. Different regions are classified into functional zones based on shared characteristics or attributes that influence regional development goals, and the combination of these zones forms the functional zoning. In previous studies, some scholars have utilized the formulation of functional zoning to optimize the relationship between ecological protection and human development (Wang et al., 2023), while others have employed the same approach to reshape sustainable geographical patterns (Fan et al., 2019). Because zones of the same type share common traits, they can be governed by similar policies in their development. Conversely, different policies are adopted for different types of zones. The design of functional zoning aligns with the theory of regional functional differentiation and has proven effective in promoting regional development in practice (Chen et al., 2023). The distribution of water, energy and ecological resources in China shows a significant imbalance due to differences in geographic location, climatic conditions and geological formations (Gao et al., 2025). Food system as a complex system highly dependent on water, energy and ecological system, functional zoning should be carried out in order to develop sustainable geographic patterns to maximize food security (Fan et al., 2019). About the study of functional zoning of agricultural subjects, different scholars have put forward different views on the focus of zoning: one scholar argues that any scientific zoning plan for farmland should include two aspects-the characteristics of matching supply and demand, and the relationship between different functions (He et al., 2021). Bousbaine et al. have also argued that for the goals of world food security and food sovereignty, it is necessary to integrate farmland protection with other values associated with farmland and agricultural activities through more comprehensive functional planning (Bousbaine et al., 2017). Li et al. suggest that function-oriented zoning of arable land utilization is more effective in improving resource utilization efficiency than blind all-around protection approaches. The food production function of arable land is emphasized, and food production security and landscape ecological function are also considered (Li et al., 2022). According to Ma et al., it is necessary to carry out “special zone” spatial layout planning for the main functional area of food, so as to provide a basic guarantee for the survival and security of the country (Ma and Niu, 2009). In summary, the role and value of functional zoning have been demonstrated in relevant studies and recognized by scholars. This study introduces functional zoning as a method to explore strategies and policies for enhancing regional food security capacity, with the aim of promoting the balanced development of the WEFE.
This study constructed a measurement system consisting of 4 subsystems and 17 indicators and used 2014–2021 panel data from 31 provincial-level regions (excluding Hong Kong, Macao, and Taiwan) to assess food security capability from the perspective of WEFE. Based on the assessment results of food security capability from the perspective of WEFE, this study designed functional zoning for the studied regions. This functional zoning includes seven types, and the difference between them is mainly the degree of perfection of the WEFE system function in the assessment results. Furthermore, it proposed response strategies and policy recommendations to improve food security in the region, which were tailored to the characteristics of different functional areas. In this study, we assessed food security capacity from the perspective of the WEFE. This approach is of practical significance because evaluating the food system’s resource consumption and its ecological impact is crucial for building a sustainable food system. Moreover, in contrast to multi-country studies at the river-basin or global scale, this study provides a novel assessment of food security capability within a single country by applying the WEFE perspective at the provincial-level. The improvement strategies proposed at this level are, therefore, more practical than those derived from broader-scale analyses.
2 Methodology
2.1 Theoretical foundation
The internal and the external systems are the two basic components that make up the construction of the relationship between the WEFE (Figure 1). The internal system encompasses the water, energy, and food subsystems. Through the input and output of water resources and energy elements to produce food, the interactive relationship within the internal nexus is realized. The external system is the ecological subsystem. Using various governance methods to create a good external environment ensures the healthy operation of the internal system. Its connotation is to achieve the relational safety of multiple resources within a regional scope. Based on ensuring the effective investment and reduction of water resources and energy, as well as ecological value, it meets the requirements of regional water resources carrying capacity, efficient energy utilization, and environmental friendliness. At the same time, it considers other external system elements to achieve the zoning and policy choices for food security based on multi-element relationships.
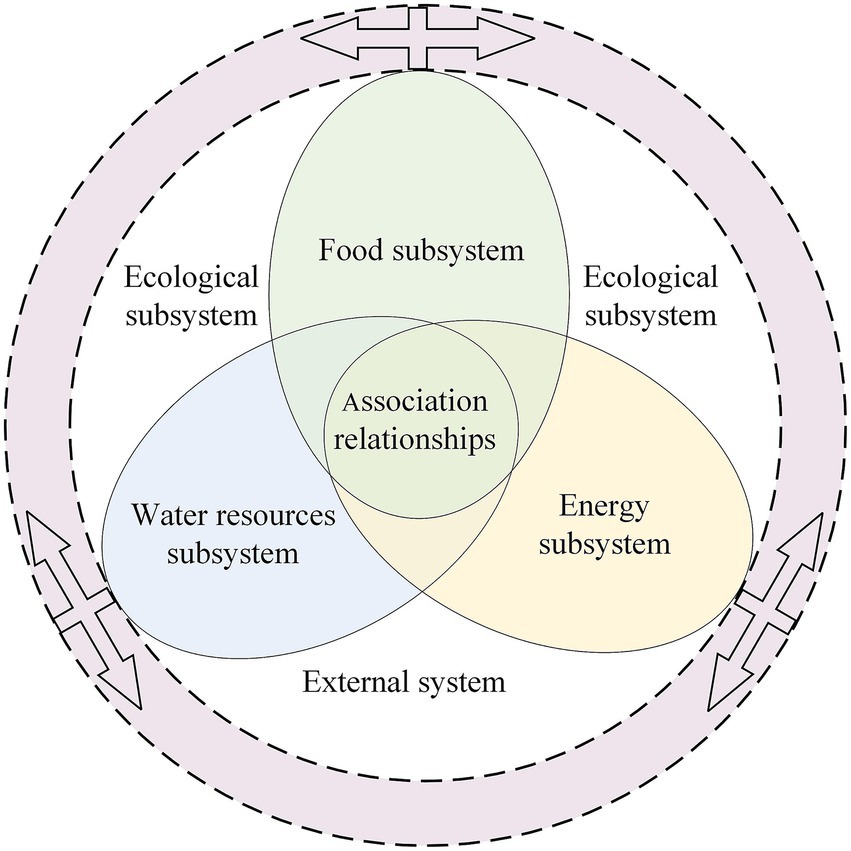
Figure 1. Water-energy-food-ecology system.
Based on the WEFE, this study attempted to construct a food security guarantee capability measurement system including the water resources subsystem, the energy subsystem, the food subsystem, and the ecological subsystem (Figure 2). The empirical study on food security guarantee capacity from the perspective of the WEFE was carried out based on panel data on food security in 31 provincial-level regions (including provinces, autonomous regions, and municipalities, excluding Hong Kong, Macao and Taiwan regions) from 2014 to 2021. The contribution model and obstacle degree model were used to identify the core factors affecting food security guarantee capacity. According to the calculation results, the functional zoning of food security from the perspective of the WEFE was designed, and the food security strategy and policy choices based on functional zoning were proposed.
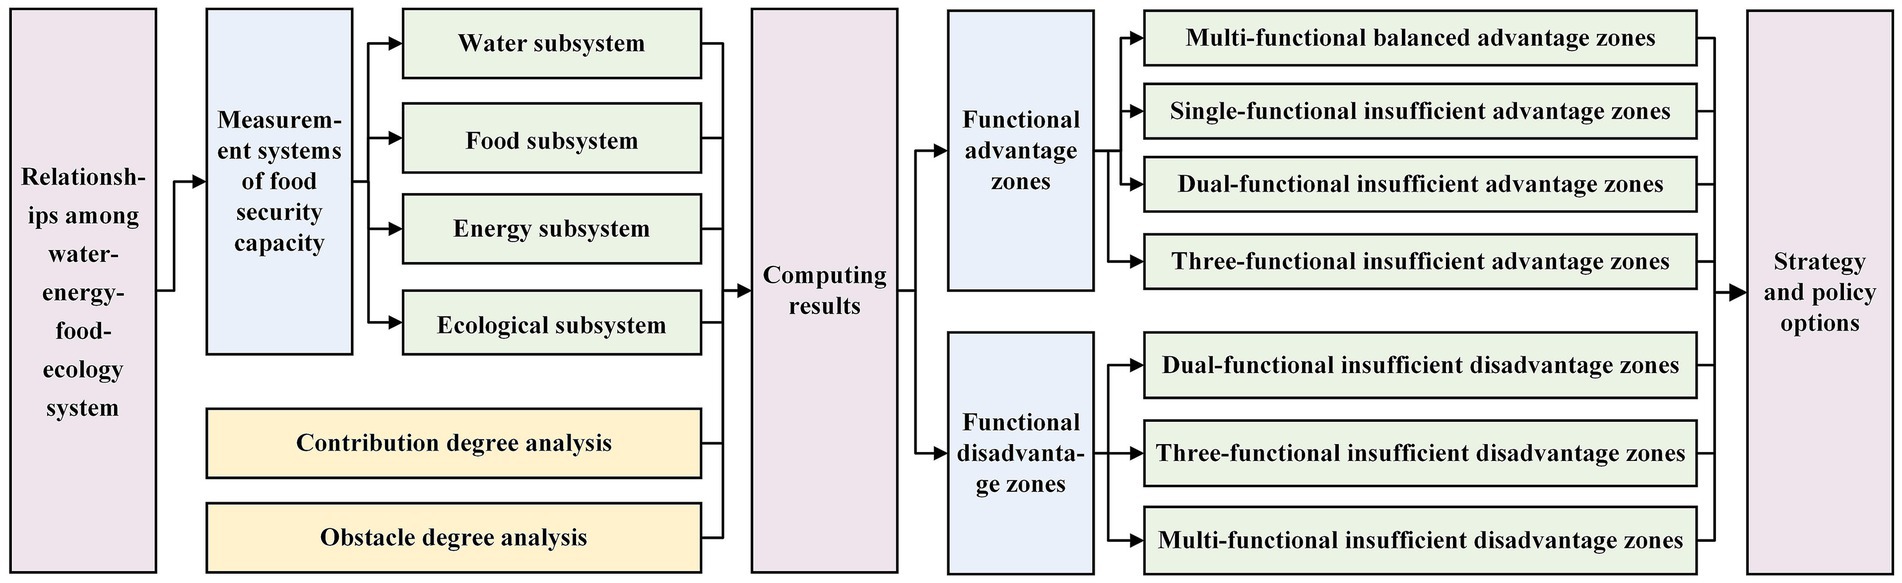
Figure 2. Study framework for ensuring food security with water-energy-ecology system.
2.2 Data source
The research objects are 31 provincial-level regions (including provinces, autonomous regions, and municipalities, excluding Hong Kong, Macao and Taiwan regions) in mainland China. The time series is from 2014 to 2021. The study’s data are derived from the China Statistical Yearbook, China Rural Statistical Yearbook, and China Water Conservancy Statistical Yearbook from 2015 to 2022. Among them, the China Statistical Yearbook is an informative annual publication compiled and printed by the National Bureau of Statistics of the People’s Republic of China, the China Rural Statistical Yearbook is an informative annual publication compiled and printed by the Department of Rural Socio-Economic Surveys of the National Bureau of Statistics of the People’s Republic of China, and the China Water Resources Statistical Yearbook is an informative annual publication compiled and printed by the Ministry of Water Resources of the People’s Republic of China.
2.3 Measurement system
2.3.1 Preliminary screening of measurement indicators
Appropriate indicator selection will directly affect the scientific nature of the calculation results. To better calculate the food security guarantee capacity in the context of the WEFE, the research selected the measurement system of food security guarantee capacity under this context (intended indicators), including four subsystems and 17 specific indicators. This selection was made by referring to the results of previous studies, following the principles of scientificity, representativeness and operability, and combining them with the theoretical framework of China’s food security from the perspective of the WEFE (Table 1). It contained four subsystems and 17 specific indicators.
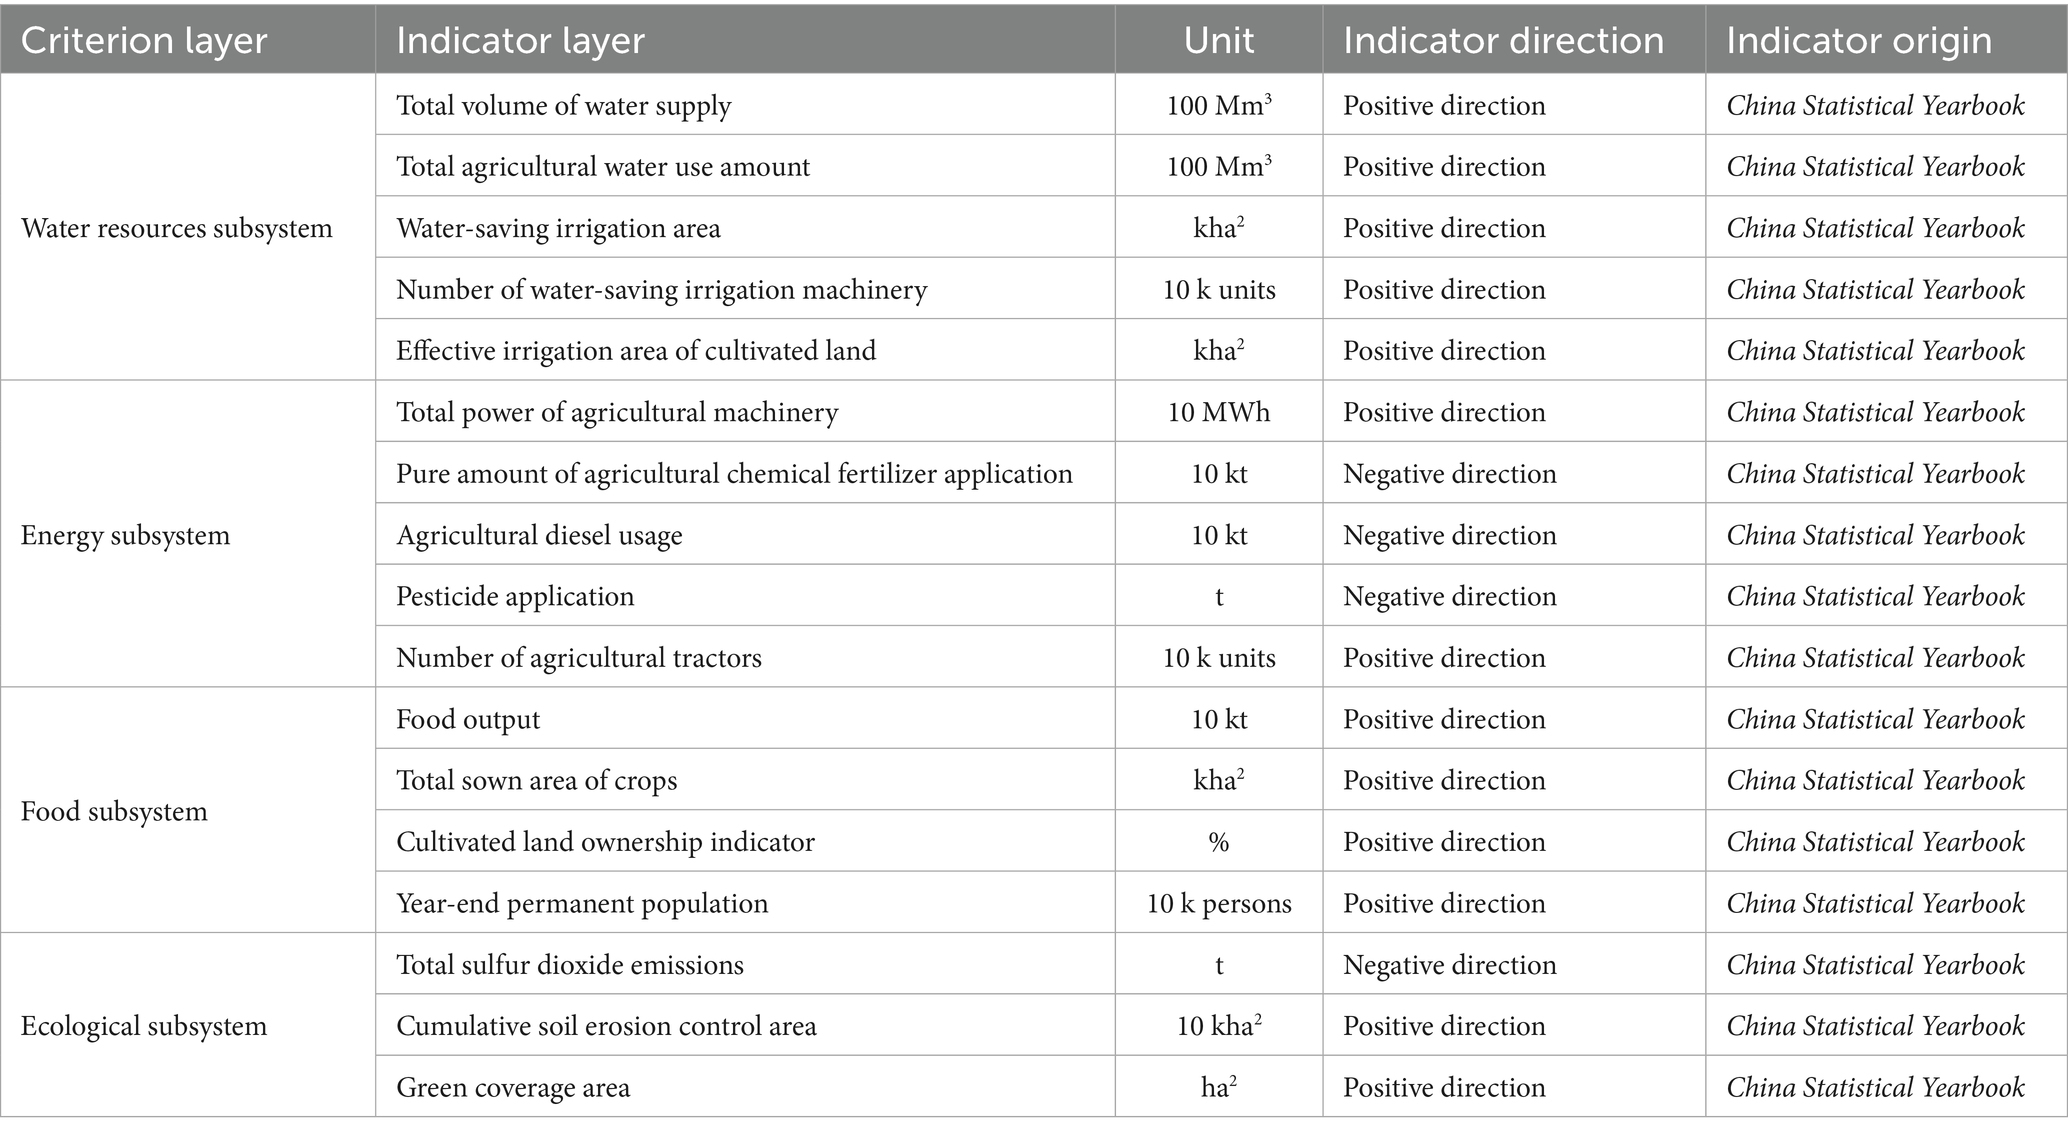
Table 1. Food security guarantee capacity measurement system (intention indicators).
The water resources subsystem is mainly reflected in the degree of satisfaction with the water resources demand of the food system. The measurement of the subsystem should consider the relevant important indicators that affect the sustainability and effectiveness of water resources security in the food system. Total volume of water supply and total agricultural water use amount can represent the abundance of regional water resources and the potential to invest water resources in the food system. Water-saving irrigation area and effective irrigation area of cultivated land can reflect the level of efficient utilization of water resources system. Number of water-saving irrigation machinery can reflect the region’s emphasis on agricultural water use and water-saving agricultural development.
The energy subsystem is mainly reflected in the degree of satisfaction of the energy demand of the food system. The measurement of the subsystem should consider the relevant important factors that affect the sustainability and effectiveness of the energy security of the food system. Pure amount of agricultural chemical fertilizer application, agricultural diesel usage and pesticide application is an important form of agricultural secondary energy input in crop planting. Total power of agricultural machinery and number of agricultural tractors is the direct embodiment of the level of agricultural mechanization and the manifestation of indirect input of agricultural energy.
The food subsystem is mainly reflected in the demand and output of the food system. The measurement of the subsystem should consider the direct measurement of the production and demand of the food system and the factors affecting the production and demand. Food output is a direct measure of the output of the food system. Total sown area of crops and cultivated land ownership indicator can reflect the changes in the basic conditions of grain system output. Year-end permanent population can reflect the demand for food and the potential pressure of the food system.
The ecological subsystem is mainly reflected in the relevant ecological factors that have an impact on the operation of the food system. The measurement of the subsystem should consider the external environment of the food system. Total sulfur dioxide emissions and green coverage area can represent the ecological level of the region, and the Cumulative soil erosion control area of the external environment of the grain system can represent the ecological governance effect of the region.
2.3.2 Measurement system construction
The principal component analysis (PCA) is a method to reflect the difference in the influence of indicators on the comprehensive evaluation results through the indicator load coefficient (Greenacre et al., 2022; Abdi and Williams, 2010). In this study, PCA was introduced to screen the indicators that had a strong impact on the evaluation results. Through the principal component analysis of the 17 indicators selected initially, the first five characteristic roots were calculated to be 9.01, 1.76, 1.58, 1.04, and 0.94, respectively. The cumulative contribution rate reached 84.22%, which was highly representative. Therefore, the characteristic vectors corresponding to these five characteristic roots were used to calculate the load coefficient matrix. To ensure that the selected indicators significantly impact the comprehensive evaluation, the absolute value of the load coefficient in each principal component was more than 0.6. The results of the screening are shown in Table 2.
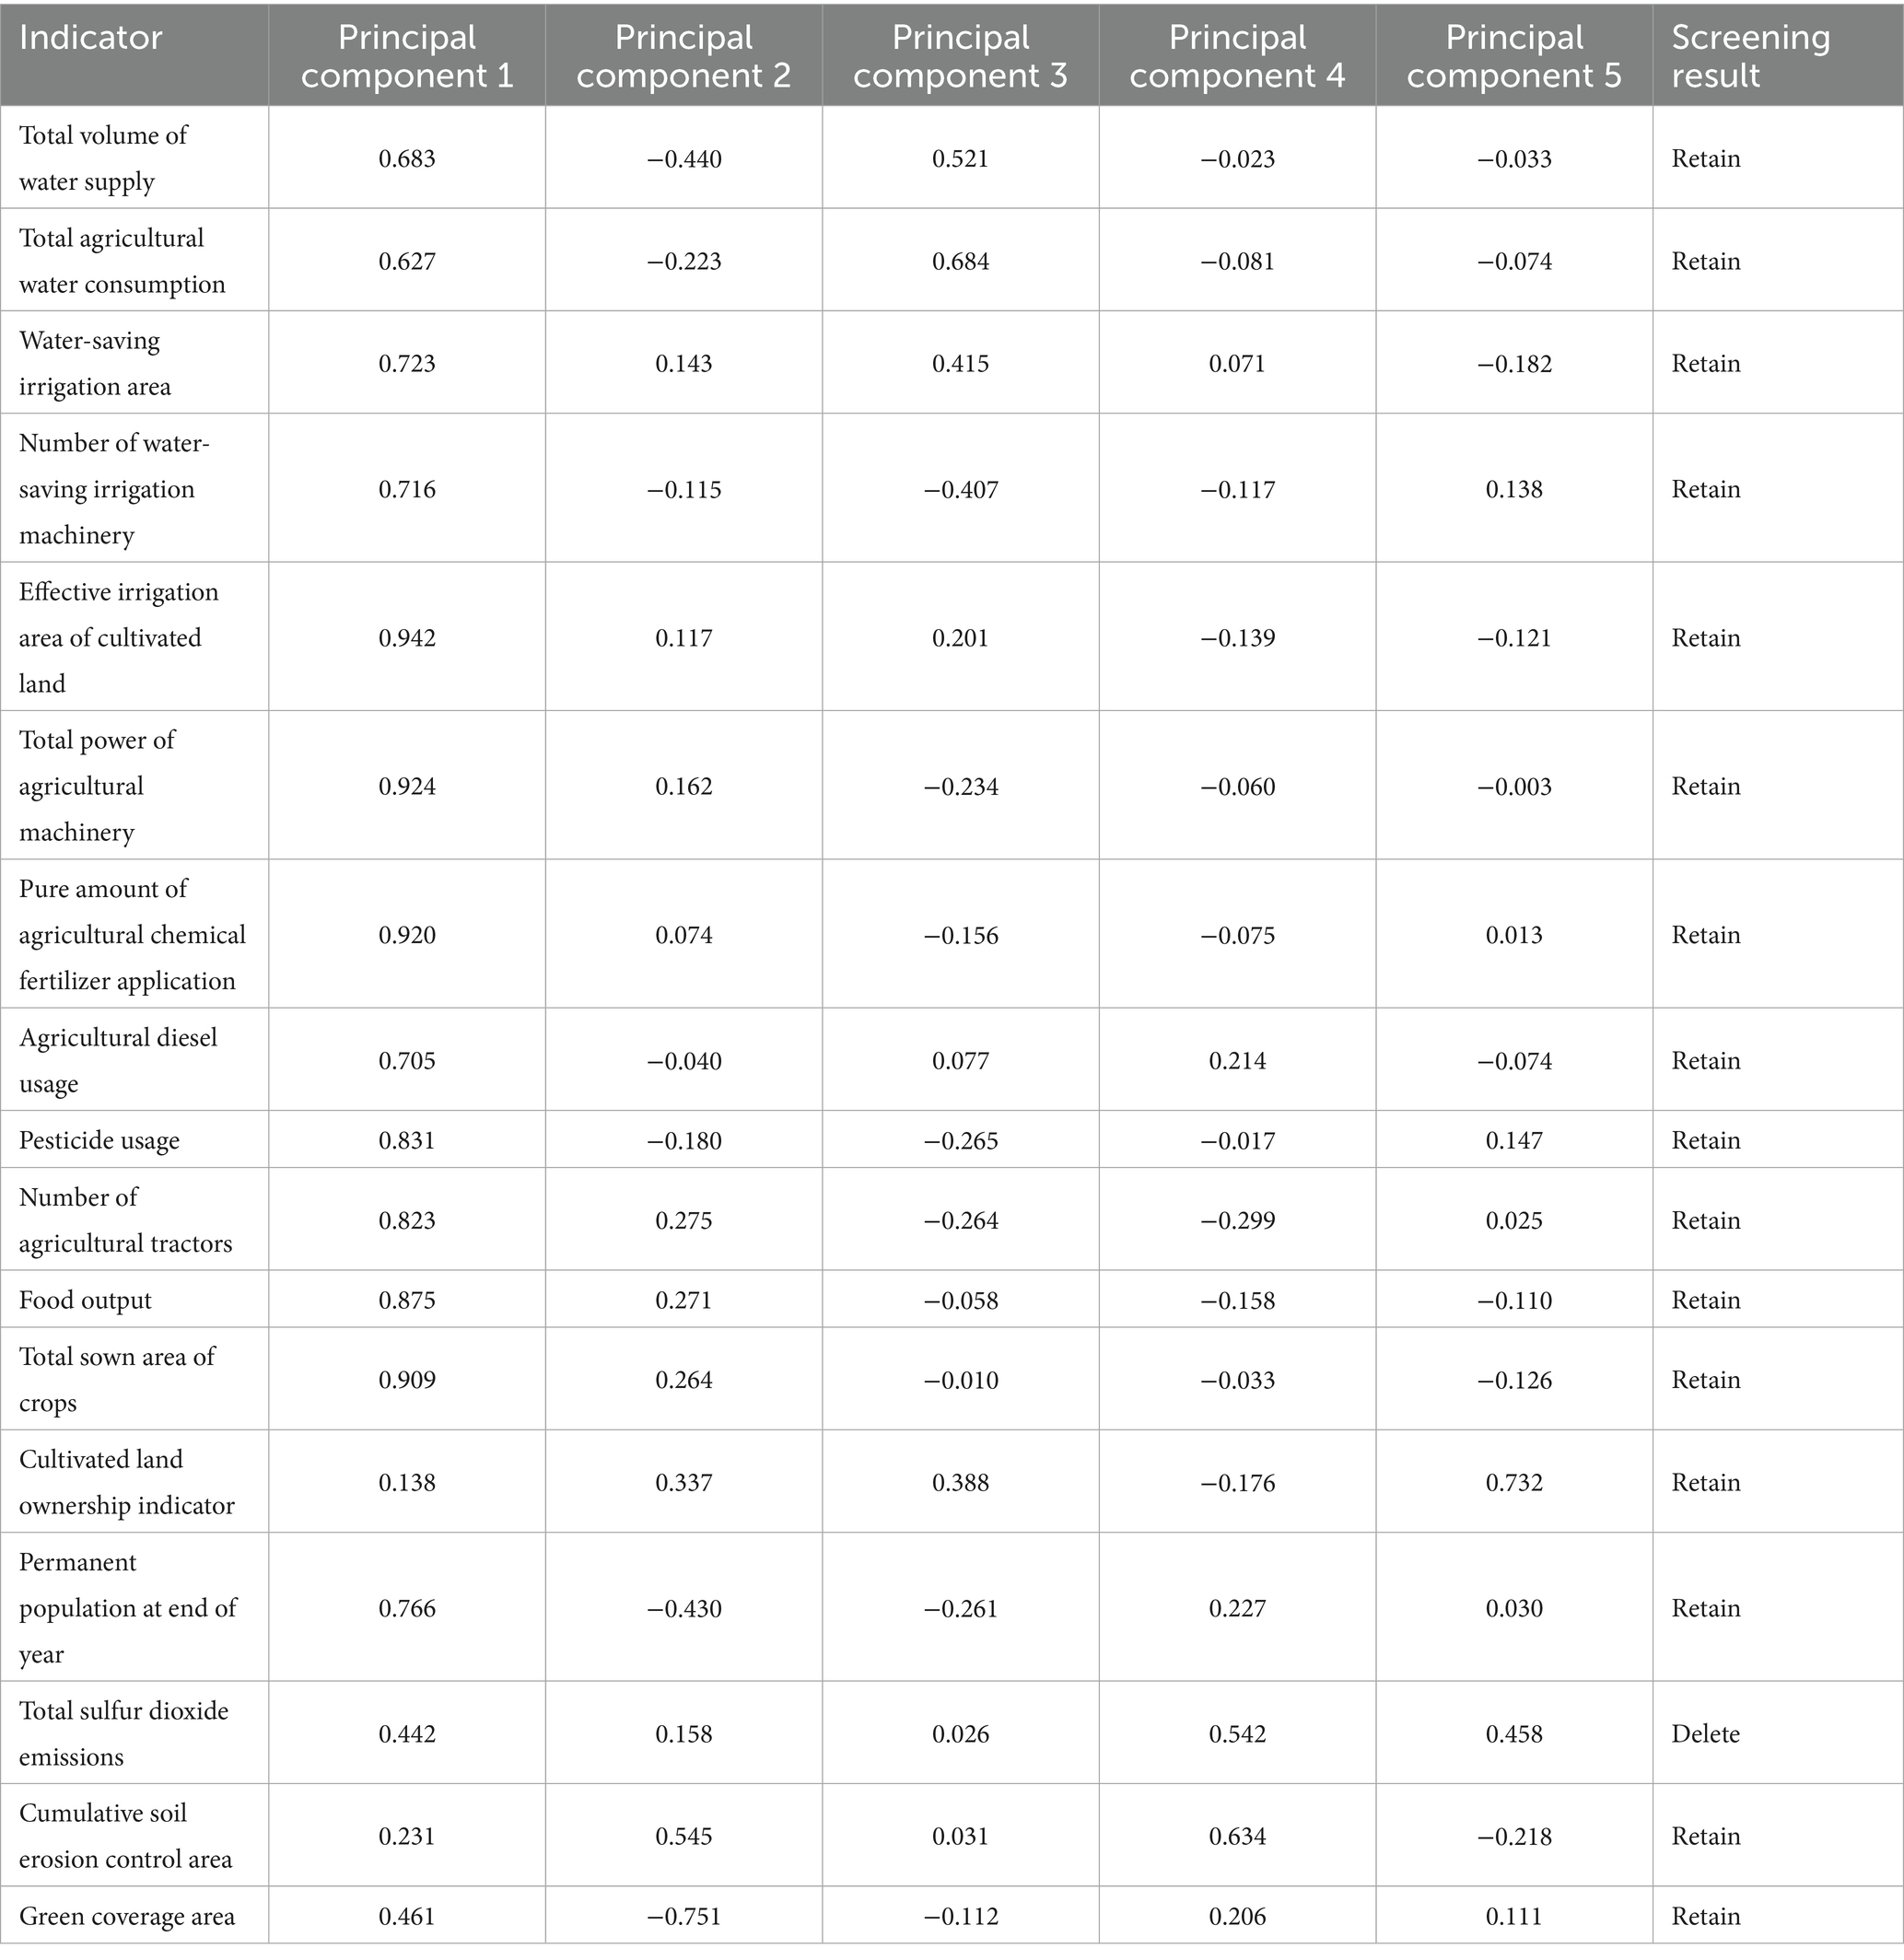
Table 2. Calculation results of principal component load coefficient.
2.4 Research methods
2.4.1 Standardized model for extreme value method
The extreme value method is a standardized processing method based on the maximum and minimum values in a sequence (Chen Z. X. et al., 2024; Zhang et al., 2022). The study tried to introduce the extreme value method to reduce the influence of the difference in data values caused by the indicator unit on the measurement. The calculation formulas are as follows:
represents the j-th evaluation indicator data of the i-th evaluation object after standardization; indicates the maximum value in the metric data, and indicates the minimum value in the metric data.
2.4.2 Combined weight calculation models
2.4.2.1 Entropy weight method
The entropy weight method is a quantitative research method for objective weighting by calculating the information entropy content of a data set (Chen Z. X. et al., 2024; Tang et al., 2024). In this study, the entropy weight method was tried to be introduced as one of the basic methods for the calculation model of the combined weight, and the calculation formulas are as follows:
is the contribution degree of the eigenvalue of the i-th evaluation object under the j-th indicator; is the entropy of the j-th indicator; is the entropy-weighted value of the j-th indicator.
2.4.2.2 Coefficient of variation method for determining weights
The coefficient of variation method is an objective weighting method based on data information (Tan et al., 2021; Yang et al., 2022). In this study, the coefficient of variation method was used as one of the basic methods for the calculation of the combined weight model, and the calculation formulas are as follows:
is the coefficient of variation of the j-th indicator; represents the weight value of the variation coefficient method for the j-th indicator.
2.4.2.3 Mean square deviation method
The mean square deviation method is an objective weighting method that is objectively weighted according to the degree of data dispersion (Cao and Huang, 2021). In this study, the mean square deviation method was used as one of the basic methods for the calculation of the combined weight calculation model. The calculation formula is as follows:
is the standard deviation of the j-th indicator. is the standardized mean of the i-th evaluation object under the j-th indicator. represents the weight value of the mean square deviation method of the j-th indicator.
2.4.2.4 Analytic hierarchy process determines weights of each method
The Analytic Hierarchy Process (AHP) is a systematic analysis method that combines qualitative and quantitative analysis (Qin et al., 2021; Wang H. D. et al., 2021). In this study, the AHP was used to reassign the weights determined by the entropy weight method according to Equations 1–4, the variation coefficient method according to Equations 1, 5, 6, and the mean square deviation method Equations 1, 7, to calculate the final weights. According to the expert scoring results, the weights assigned to the study were 0.25, 0.375, and 0.375, respectively (Table 3).
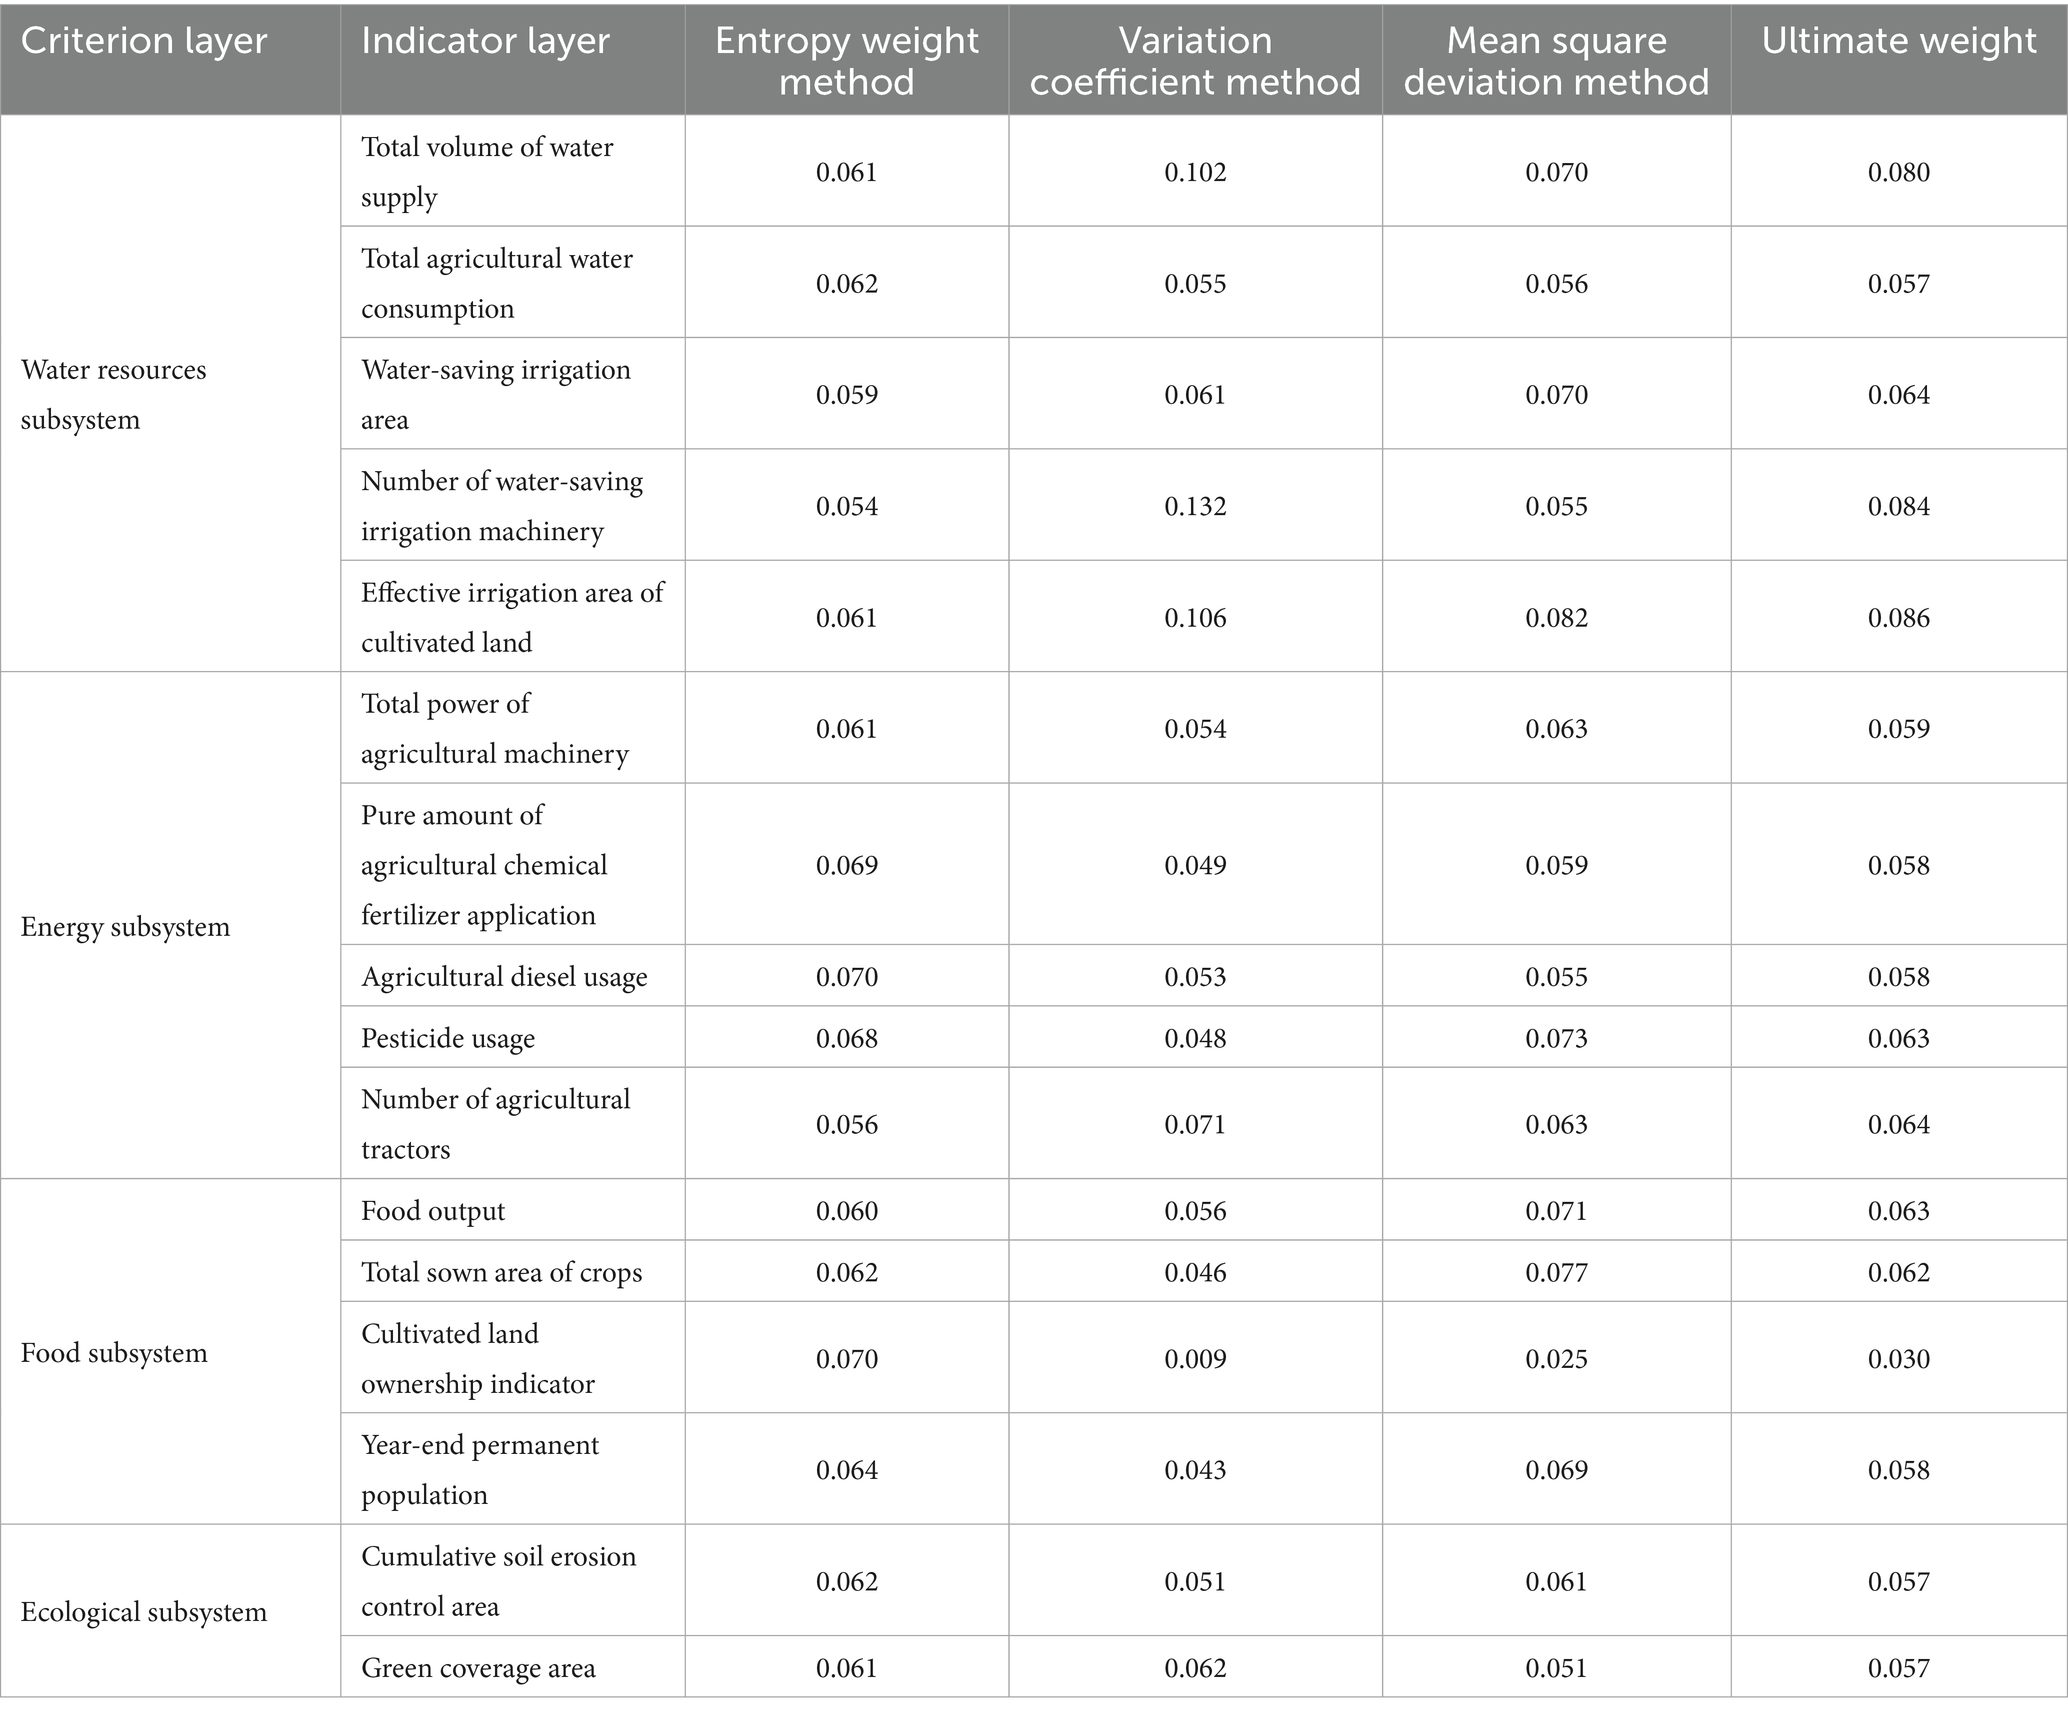
Table 3. Indicator weight of food security guarantee capacity measurement system.
2.4.3 Calculation method of final score
The calculation method of the final score based on the combined weight calculation model was obtained by multiplying the standardized indicator data by the final weight value of the indicator. The calculation formula is as follows:
is the final evaluation score of the i-th evaluation object under the j-th indicator. is the final weight value of the j-th indicator.
3 Analysis of food security guarantee capacity
3.1 Analysis of measurement results
From 2014 to 2021, the food security guarantee capacity value of 31 provincial-level regions showed an upward trend. Among them, the total score of the guarantee capacity value of 31 provincial-level regions increased by 9.08%. The provincial average guarantee capacity value increased by 8.48%. The scores of 12 provincial-level regions, including Yunnan, Hubei, and Gansu, increased significantly by more than 10%. In 2021, the 13 major grain-producing regions in China ranked among the top 16 in terms of their guarantee capacity. Specifically, Shandong Province, Henan Province, and Heilongjiang Province were all at a high level for many years, ranking in the top three fixedly. Yunnan Province’s guarantee capacity value increased significantly, from 0.298 to 0.342, and the ranking increased by three places; Guangxi Autonomous Region, Guizhou Province, and Shanxi Province had a slight increase in their guarantee capacity for many years, which were 0.024, 0.025, and 0.009, respectively, and their rankings decreased by two places. Beijing’s multi-year guarantee capacity value fluctuated the most, hovering around 0.218, and the ranking fluctuated sharply, reaching as many as five places according to Equation 8 (Table 4).
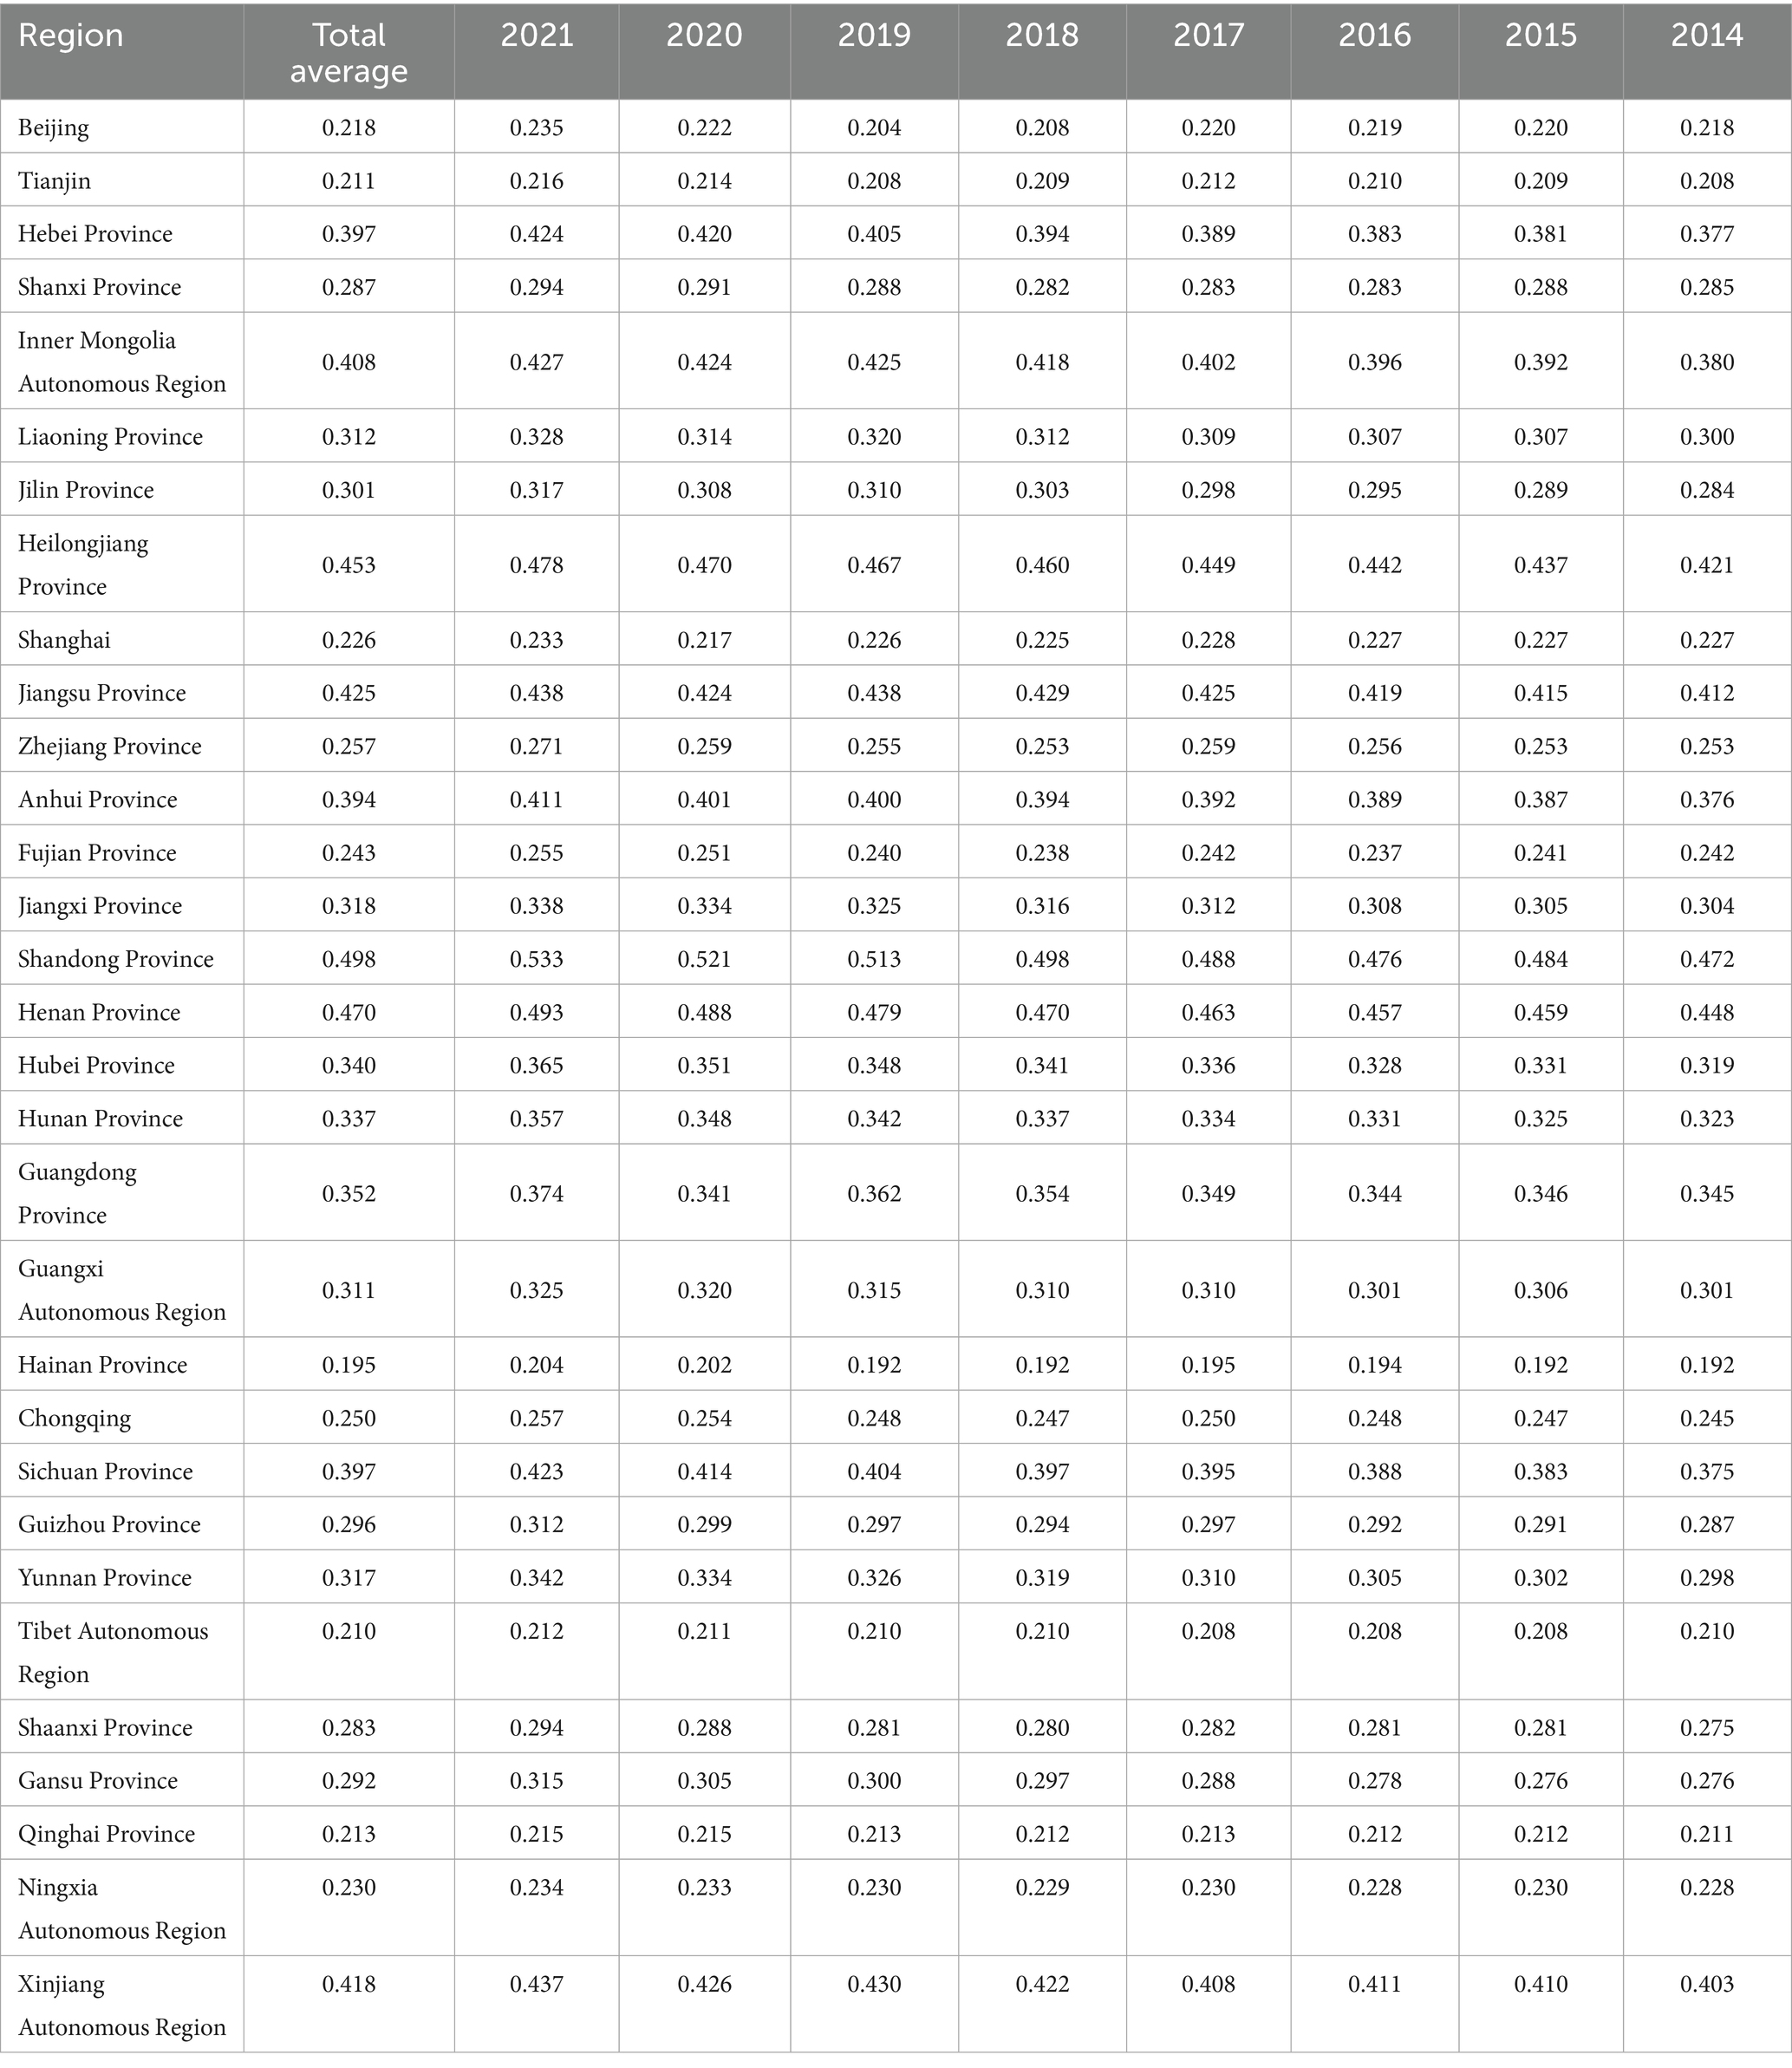
Table 4. Estimation results of food security guarantee capacity.
3.2 Analysis of influencing factors
3.2.1 Sensitivity analysis
Sensitivity analysis is used to study the influence of factor changes on the target (Wu et al., 2023). The study attempted to analyze the sensitivity of the weighting method of the measurement system, explored the influence of different methods on the measurement results, and used the sensitivity coefficient to characterize the sensitivity of the indicators. The calculation for mulais is as follows:
β represents the sensitivity coefficient of the j-th evaluation indicator to the weighting method. denotes the change in the evaluation result of the j-th evaluation indicator for the i-th evaluation object due to adjustments made by the weighting method. denotes the change in the weight of the j-th evaluation indicator due to adjustments made by the weighting method. The results are shown in Table 5 according to Equation 9.
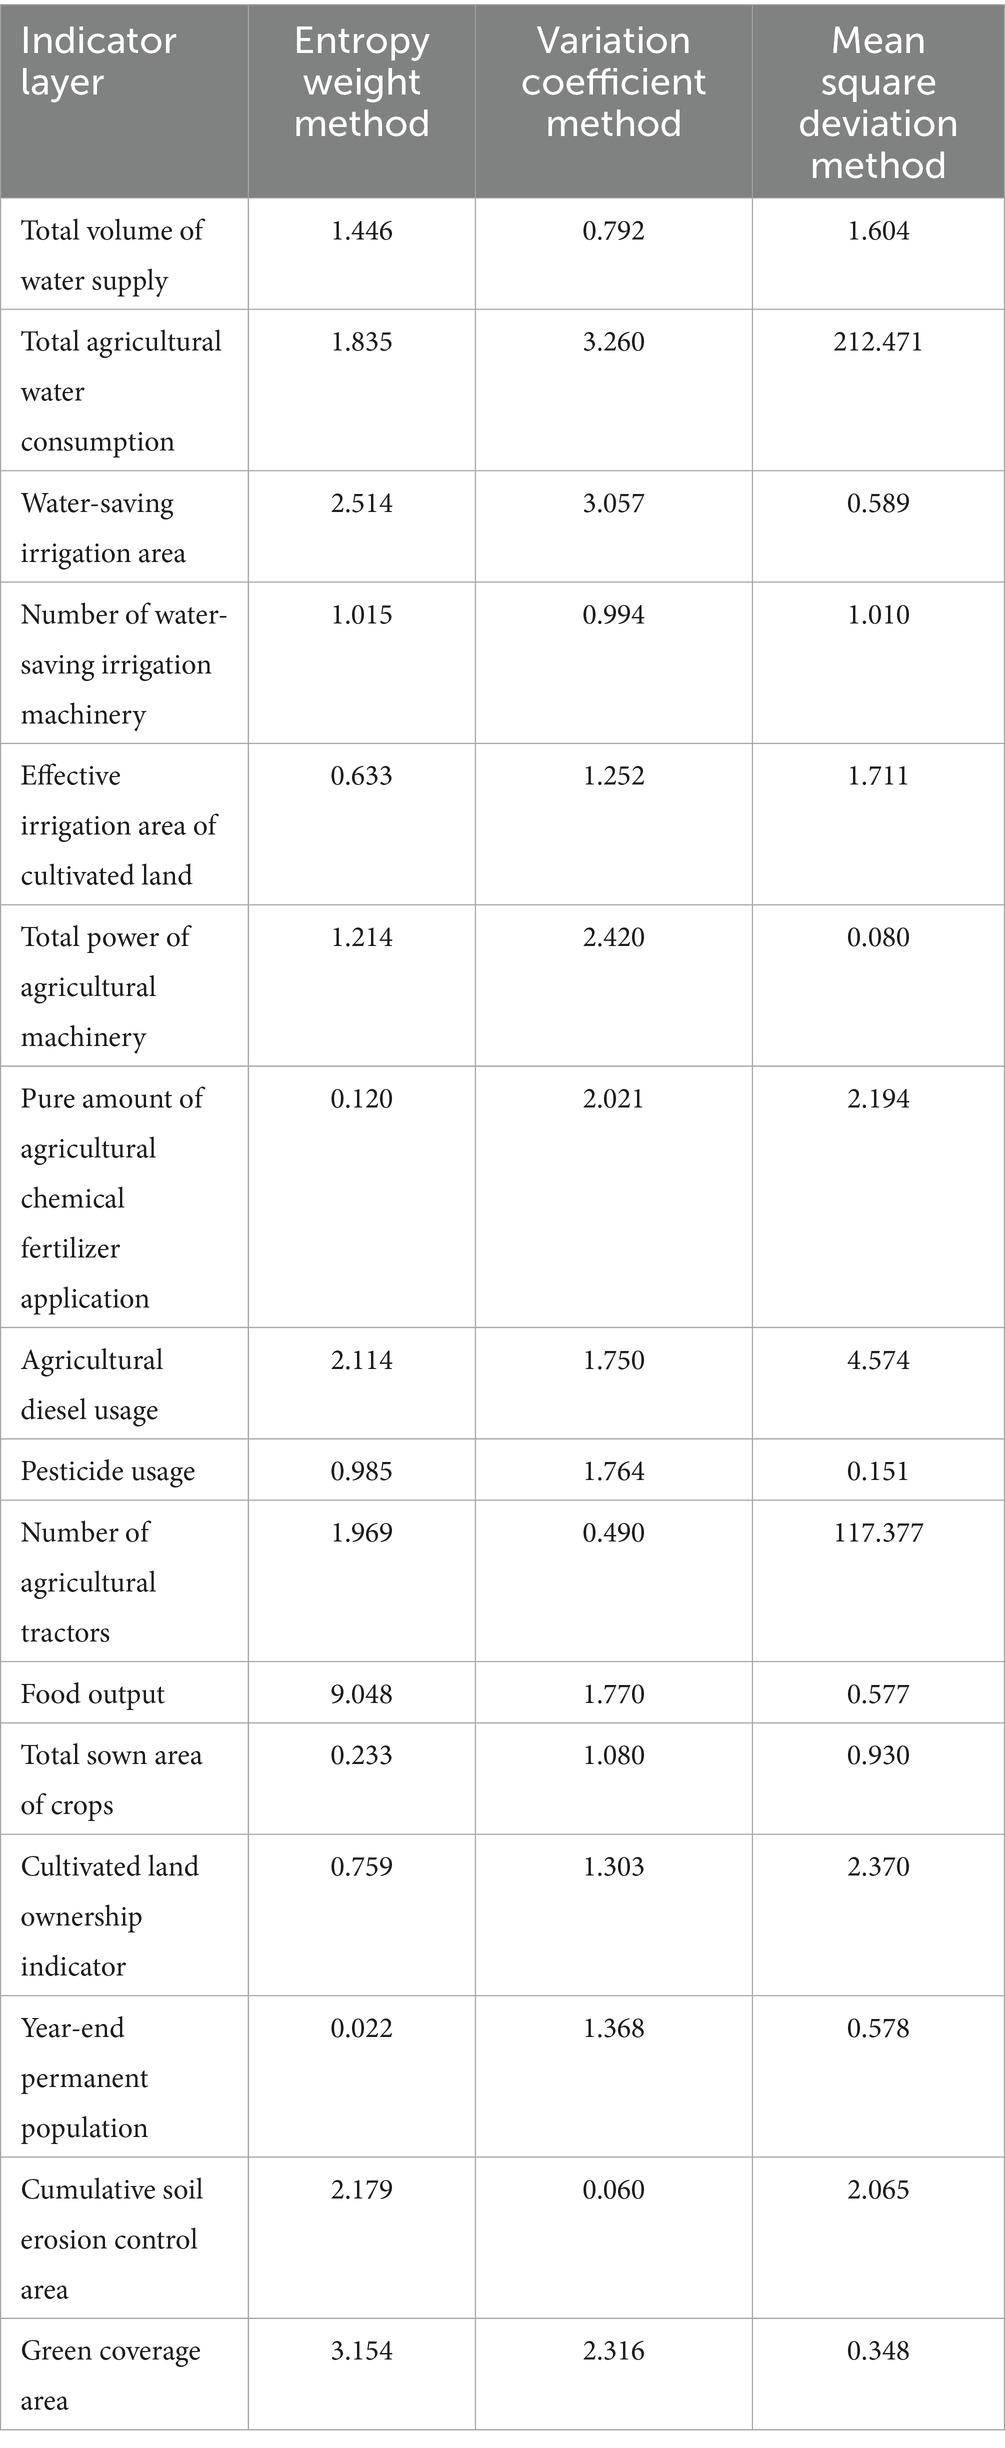
Table 5. Sensitivity analysis of three weight assignment methods.
From the mean sensitivity coefficients of each indicator, it appears that the sensitivity of each indicator to the mean square deviation method was significantly higher than that of other weighting methods. However, after removing the two extreme sensitivity coefficients, it can be seen that there was no significant difference in the sensitivity of each indicator to the three weighting methods. The direct cause of this phenomenon lies in the extreme sensitivity of the two indicators—total agricultural water use and number of agricultural tractors—to the weighting of the mean square deviation method. The sensitivity coefficients are 212.471 and 117.377, respectively, which are significantly higher than the sensitivity coefficients of other indicators for the three methods. From the perspective of weighting methods, the entropy weight method places greater emphasis on the stability of data information entropy, the coefficient of variation method places greater emphasis on the relative dispersion of data, and the mean square deviation method places greater emphasis on the absolute dispersion of data. The three methods have different focuses, which are of great significance for weighting. Therefore, the study used the AHP method to perform secondary weighting on the three methods, with the aim of incorporating the objectivity of the weighting of the three methods. From the results of the sensitivity analysis after removing extreme values, it can be seen that no single method has a dominant influence on the results, which is conducive to the conduct of the study. This supports the rationality of using secondary weighting as the final weighting in the study.
3.2.2 Contribution model analysis
The affecting degree model is a research method to explore the influence of single indicator evaluation results on the final evaluation score (Fang et al., 2021). The study attempted to introduce the affecting model to measure the main contributors of regional security capacity. The calculation formula is as follows:
is the contribution of the j-th indicator. is the evaluation result of the i-th evaluation object under the j-th indicator. The average contribution of each province was taken as the analysis object. The results are as follows according to Equation 10 (Figure 3).
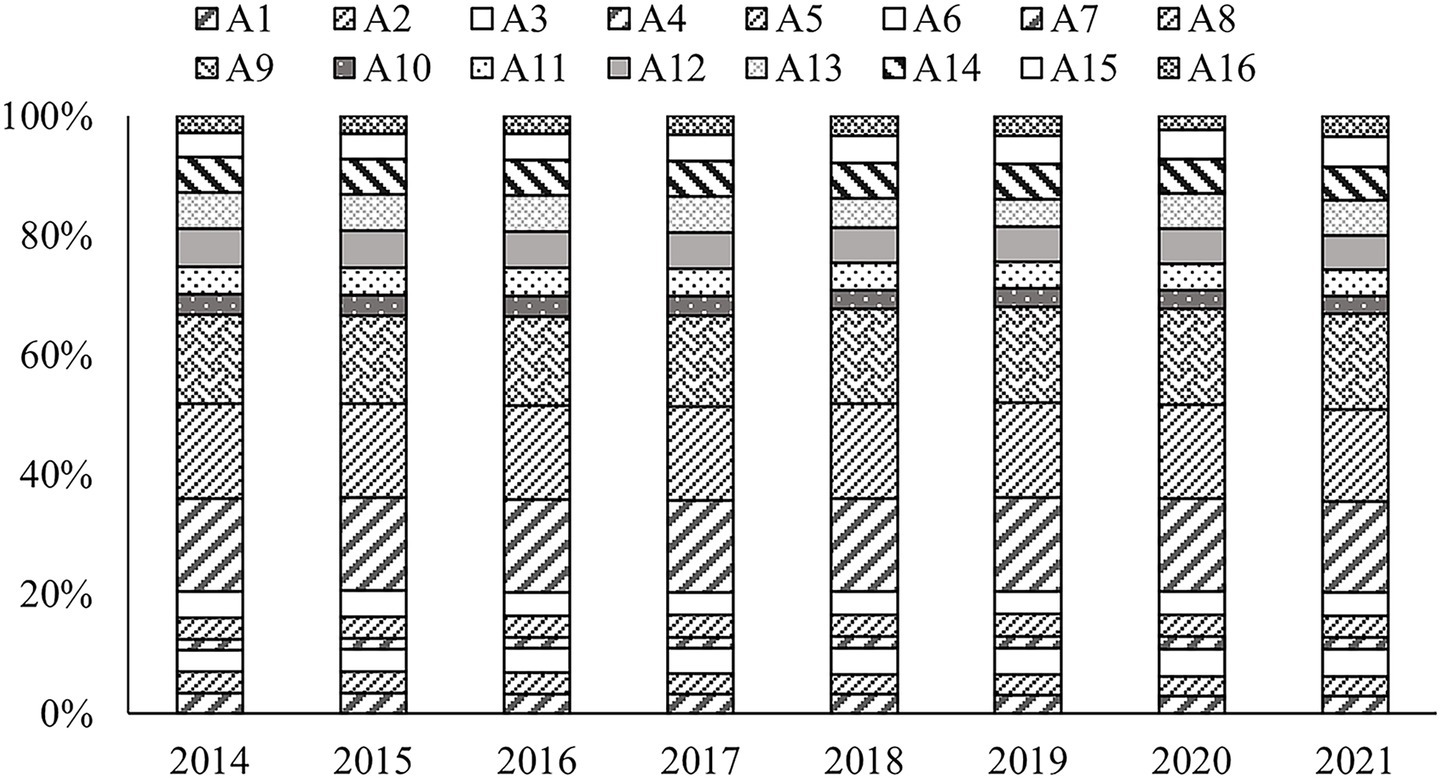
Figure 3. Contribution of food security guarantee capacity indicators.
The change of indicator contribution tended to concentrate on a small number of indicators. In terms of quantity, the contribution of some indicators was far more than that of others. The average annual contribution of A7 (the pure amount of agricultural chemical fertilizer application), A8 (the amount of agricultural diesel usage in various regions), and A9 (the amount of pesticide application) indicators has reached 46.71% in 8 years, close to half of the total score value. The reason may be that, for a long period of time, an agricultural economic development model that relies heavily on agricultural energy (primary and secondary energy) has been beneficial to China’s food security and farmers’ income growth. However, it is important to recognize that this development model is unsustainable. On the one hand, as yields per unit area increase, the marginal benefits of agricultural energy inputs will gradually diminish, and the costs required to increase inputs will gradually rise. On the other hand, the ecological pollution caused by the overuse of agricultural energy has gradually come to light (Tang F. H. M. et al., 2021). The Chinese government and the public are also paying increasing attention to green agriculture and sustainable agriculture. Since 2015, the Chinese government has issued a series of policies to improve the efficiency of agricultural energy use. In addition, studies have pointed out that there is still considerable room for improvement in the utilization rate of agricultural energy in China. Through appropriate policy combinations and optimization of crop structures, it is possible to save a considerable amount of agricultural energy input without affecting food self-sufficiency and agricultural income (Van Wesenbeeck et al., 2021). In terms of the magnitude of change, the contribution of most indicators has been decreasing, and the contribution of a few indicators has increased significantly. The contribution of A3 (total water-saving irrigation area), A15 (cumulative soil erosion control area), and A16 (green coverage area) increased by 27.17, 22.29, and 25.93% respectively, in 8 years.
Specifically, the A8 indicator had the highest average annual contribution, reaching 15.76%; compared with 2014, the contribution of A7 and A8 indicators decreased by 2.93 and 2.59% respectively, while A9 showed an upward trend of 7.48% in 8 years, and ranked first for three consecutive years. The contribution of the A4 (number of water-saving irrigation machinery) indicator was the lowest, with an average contribution of 1.91% for many years. Although the annual growth rate of A4 was high, the status of the lowest contribution in the short term may not change due to the low initial value. The contribution of energy system indicators was generally high, showing a downward trend. The contribution of ecosystem indicators was generally low, showing an overall upward trend, indicating that improving ecosystem functions may be an effective means to maintain the overall strength of the WEFE in the future.
3.2.3 Obstacle degree model analysis
The obstacle degree model is a method to explore the influencing factors of evaluation results based on weight evaluation (Tang et al., 2024; Wang Y. N. et al., 2021). The study attempted to introduce the obstacle degree model to measure the main obstacle factors that restrict the regional support capability. The calculation formula is as follows:
is the obstacle degree of the i-th evaluation object under the j-th indicator; is the factor contribution of the j-th indicator, that is, the final weight value . is the deviation degree of the i-th evaluation object under the j-th indicator. The mean value of the obstacle degree of each province in the year was taken as the analysis object. The results are shown in Figure 4 according to Equation 11.
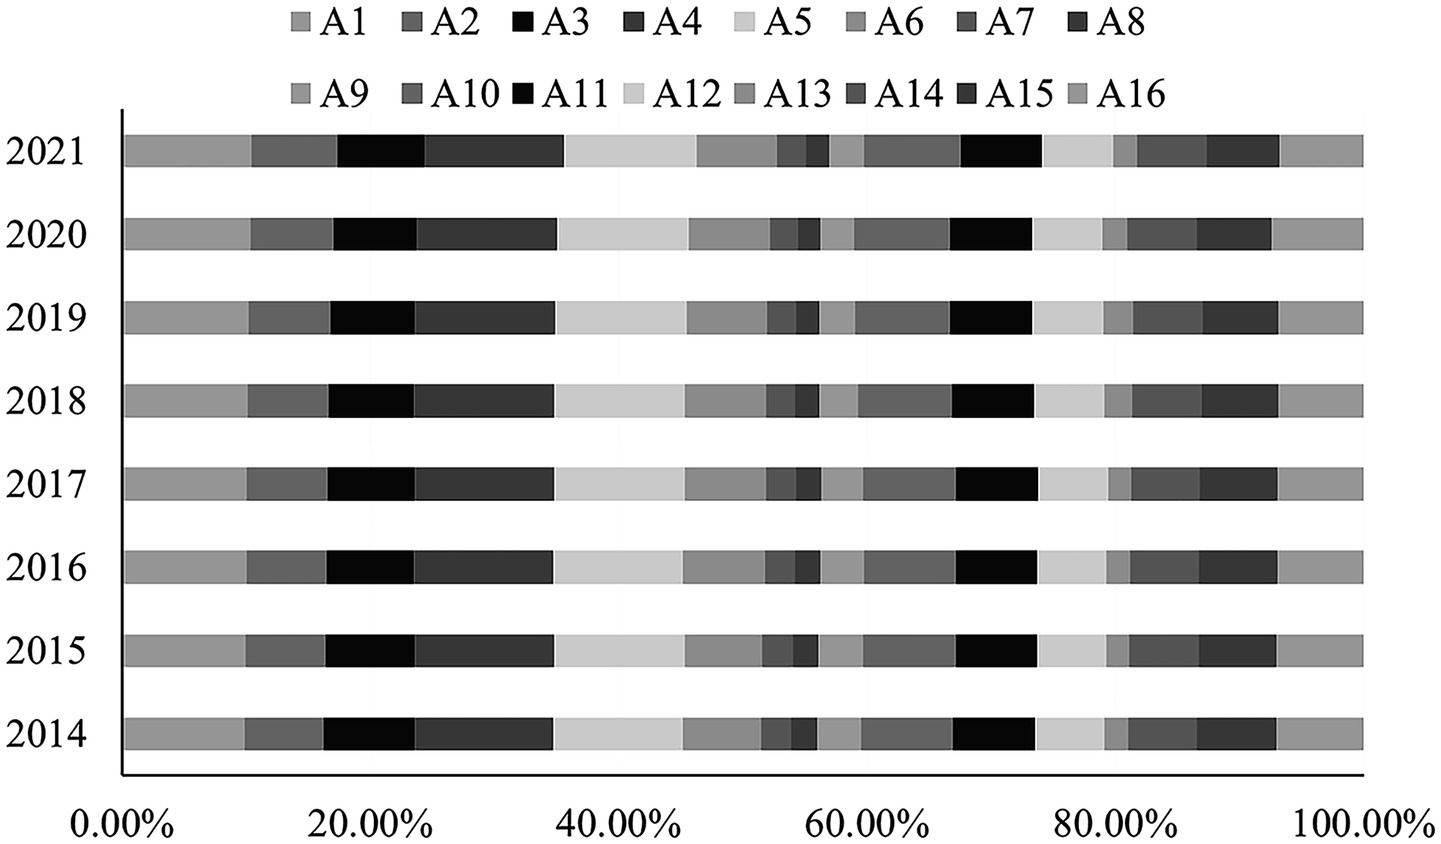
Figure 4. Obstacle degree of food security guarantee capacity indicators.
It can be seen that the indicator obstacle degree changed little from 2014 to 2021. Except for the A9 indicator, the variation range of the other indicators was not more than 10%. The difference in obstacle degree between indicators was also small. The horizontal deviation of the mean distance of all indicators was not more than 5%. Specifically, the indicators of A1 (total water supply), A4 (number of water-saving irrigation machinery), and A5 (effective irrigation area of cultivated land) had high obstacle degrees for many years, which were 10.10, 11.25, and 10.55% respectively, ranking the top three. The continuous improvement of the obstacle degree of the A1 indicator had the potential to surpass the A4 indicator to become the highest obstacle degree indicator. The obstacle degree of the A9 indicator decreased significantly, dropping by 22.17% from 2014 to 2021. The obstacle degree of the A2 (total agricultural water use) indicator increased the most, rising by 9.12% from 2014 to 2021. The indicator obstacle degree of the water resources system was generally high, with a more significant upward trend compared to other systems. It showed that attention should be paid to the restriction of water resources on the development of the WEFE in the future.
Using the top 10% of provinces with the highest obstacle levels across the five water resource system indicators as the selection criterion, the provinces identified include Hebei Province, Inner Mongolia Autonomous Region, Heilongjiang Province, Shandong Province, Henan Province, Hubei Province, Hunan Province, Guangdong Province, Sichuan Province, Guizhou Province, and Xinjiang Autonomous Region. Notably, nine of the 11 provincial-level regions are major grain-producing provinces. This seems reasonable. Agricultural water use is a major contributor to water resource consumption. Grain-producing regions have relatively high agricultural water demand, placing relatively high demands on local water supply capacity and irrigation-related facilities. It is therefore reasonable that the water resource system is an important factor affecting the evaluation scores of these regions (Jiang et al., 2024). Of course, faced with the continuous outflow of resources such as virtual water and virtual land in the form of grain from major producing regions, governments at all levels have also been continuously issuing policies to reduce this impact. At the national level, the Chinese government has proposed the coordinated construction of inter-provincial horizontal interest compensation between grain-producing and consuming regions, attempting to use economic and other forms of compensation to allow net grain-importing regions to compensate major producing regions. In addition, the Chinese government continues to promote the construction of various water conservancy projects, such as the South-to-North Water Diversion Project (to supply water to water-scarce areas in the north) and the High-Standard Farmland Construction Project (to improve water resources utilization efficiency), with the central government providing funding to help local governments alleviate water-related issues in their regions. At the local level, multiple provinces, including Heilongjiang, Henan, and Hebei, have also promulgated policies on comprehensive agricultural water price reform, targeted subsidies, and water conservation incentives to encourage business entities to independently improve water resources utilization efficiency.
4 Results
4.1 Functional zoning
Based on the research findings of relevant scholars (Jiang et al., 2022; Yin et al., 2023), this study designed a functional zoning of 31 provincial-level regions from assessment results of food security capability from the perspective of WEFE. Using a 50% threshold as the standard, this study defined regions with scores in the top 50% of assessment results as having regional advantages. The 31 provincial-level regions were divided into seven types: multi-functional balanced advantage zones, single-functional insufficient advantage zones, dual-functional insufficient advantage zones, three-functional insufficient advantage zones, dual-functional insufficient disadvantage zones, three-functional insufficient disadvantage zones, and multi-functional insufficient disadvantage zones (Table 6).
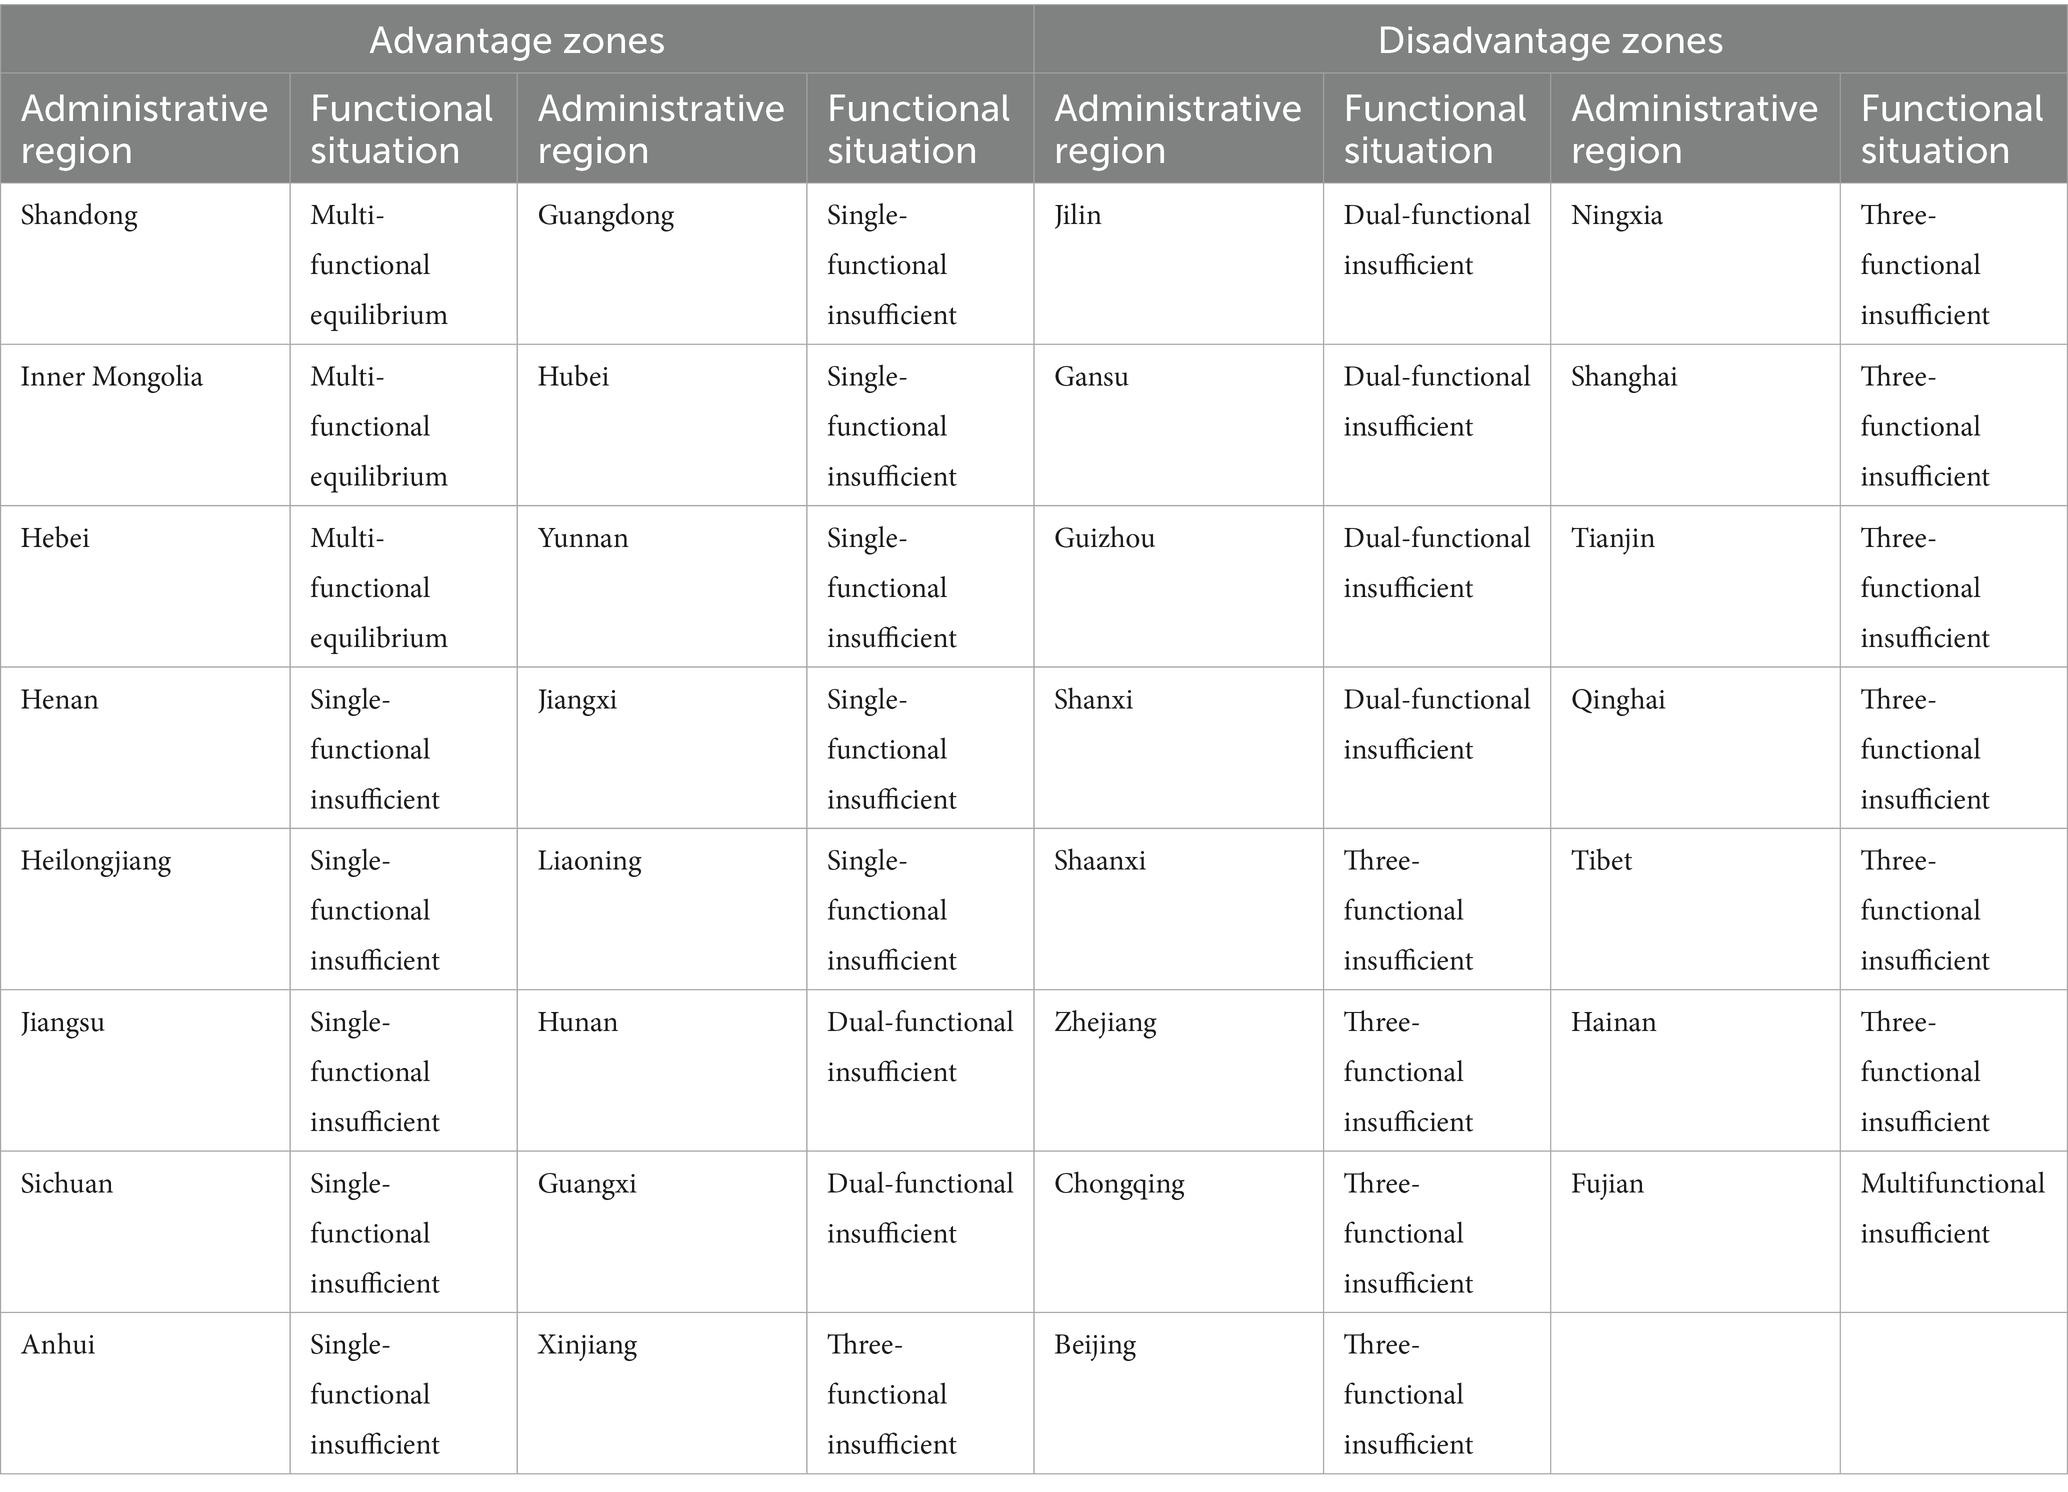
Table 6. Functional zoning of food security.
4.1.1 Advantage zones
From the perspective of the WEFE, the advantage zones of the food security capability were regions with better security capacity. Specifically, they were in the top 16 provincial-level regions in the security capacity score, which included 13 major food-producing provincial-level regions in China. According to the score of each subsystem, they were divided into the multi-functional balanced advantage zones, the single-functional insufficient advantage zones, the dual-functional insufficient advantage zones, and the three-functional insufficient advantage zones.
4.1.1.1 Multi-functional balanced advantage zones
The multi-functional balanced advantage zones included three provincial-level regions, namely Shandong Province, Inner Mongolia Autonomous Region, and Hebei Province. The food security capability of this zoning and the food security capability of each subsystem in this district were significantly higher than those in the other provincial-level regions. There was no obvious lack of function in this zoning.
4.1.1.2 Single-functional insufficient advantage zones
The single-insufficient advantage zones included a total of 10 provincial-level regions, namely Liaoning Province, Heilongjiang Province, Jiangsu Province, Anhui Province, Jiangxi Province, Henan Province, Hubei Province, Guangdong Province, Sichuan Province, and Yunnan Province. Both the overall food security capability and that of each subsystem were strong. However, one specific subsystem function was found to be absent in this particular zone. Among them, Liaoning Province, Heilongjiang Province, Jiangsu Province, and eight other provincial-level regions lacked the energy subsystem function. Anhui Province and Henan Province lacked the ecological subsystem function.
4.1.1.3 Dual-functional insufficient advantage zones
The dual-functional insufficient advantage zones included Hunan Province and Guangxi Autonomous Region. Both the overall food security capability and that of each subsystem were strong. However, two specific subsystem functions were found to be absent in this particular zone. Between them, the change range of the energy subsystem and ecological subsystem in the Guangxi autonomous region was highly consistent with the average change range of 31 provincial-level regions. The increase of the energy subsystem in Hunan Province was far more than the average of 31 provincial-level regions. Both provincial-level regions had good functions to make up for expectations.
4.1.1.4 Three-functional insufficient advantage zones
The three-functional insufficient advantage zones category comprised only the Xinjiang Autonomous Region. The assessment results of the water subsystem in this province were significantly higher than those in other provincial-level regions. Consequently, despite the insufficiency of the three functions, the food security capability remained at a relatively high level. In recent years, the ecological and food subsystem guarantee capacity of Xinjiang Autonomous Region has been improved significantly, while its energy security guarantee capacity has weakened.
4.1.2 Disadvantaged zones
In disadvantaged zones, food security capability from the perspective of WEFE is relatively weak. Specifically, they were in the bottom 15 provincial-level regions in the food security capability, including all municipalities directly under the central government. Based on the assessment results of each subsystem, they were categorized as dual-functional insufficient disadvantaged zone, three-functional insufficient disadvantaged zone, and multi-functional insufficient disadvantaged zone.
4.1.2.1 Dual-functional insufficient disadvantaged zones
The dual-functional insufficient disadvantage zones included a total of four provinces, namely, Jilin, Gansu, Shanxi, and Guizhou Provinces. There were certain insufficiencies in the food security capability. However, two specific subsystem functions were found to be absent in this particular zone. Among them, Jilin Province had deficiencies in the functions of the water resources subsystem as well as the ecological subsystem. Gansu Province, Shanxi Province and Guizhou Province had deficiencies in the functions of the water resources subsystem as well as the food subsystem.
4.1.2.2 Three-functional insufficient disadvantaged zones
The three-functional insufficient disadvantaged zones included a total of 10 provincial-level regions, namely Zhejiang Province, Shaanxi Province, Ningxia Autonomous Region, Chongqing Municipality, Shanghai Municipality, Hainan Province, Tianjin Municipality, Beijing Municipality, Tibet Autonomous Region and Qinghai Province. The food security capability of this functional zoning was insufficient, with three specific subsystem functions being absent. Among the regions in this functional zoning, Zhejiang Province, Shaanxi Province, and Chongqing Municipality had deficiencies in the water resources, energy, and food subsystems. The remaining provincial-level regions had deficiencies in the water, food, and ecology subsystems.
4.1.2.3 Multi-functional insufficient disadvantage zones
Only Fujian Province was categorized as a Multi-functional Insufficient Advantage Zone. It had deficiencies in all its water resources, energy, food, and ecological subsystems, which placed it at a relative disadvantage in terms of food security capability. In recent years, the growth of its multiple subsystems has stagnated, remaining below the national average. It is, therefore, imperative for this zone to develop comprehensive improvement schemes for the WEFE.
4.2 Food security strategy and policy options
At present, there is a clear trend of the major grain-producing regions in China moving northward. Continued southward transportation of food from the north will also continue to increase the resource constraints on regional food production and will inevitably build up food security risks (Lu et al., 2022). Based on this, the study attempted to formulate a holistic strategy and policy options. These strategic and policy plans were formulated based on the layout of food security guarantee functional zoning from the perspective of the WEFE. Under the goal orientation of increasing the per-unit yield level and ensuring the stable growth of the total output, comprehensive considerations were given to the characteristics of each regional zoning and technological potential, combined with the coupling schemes of departments and policies (Table 7).
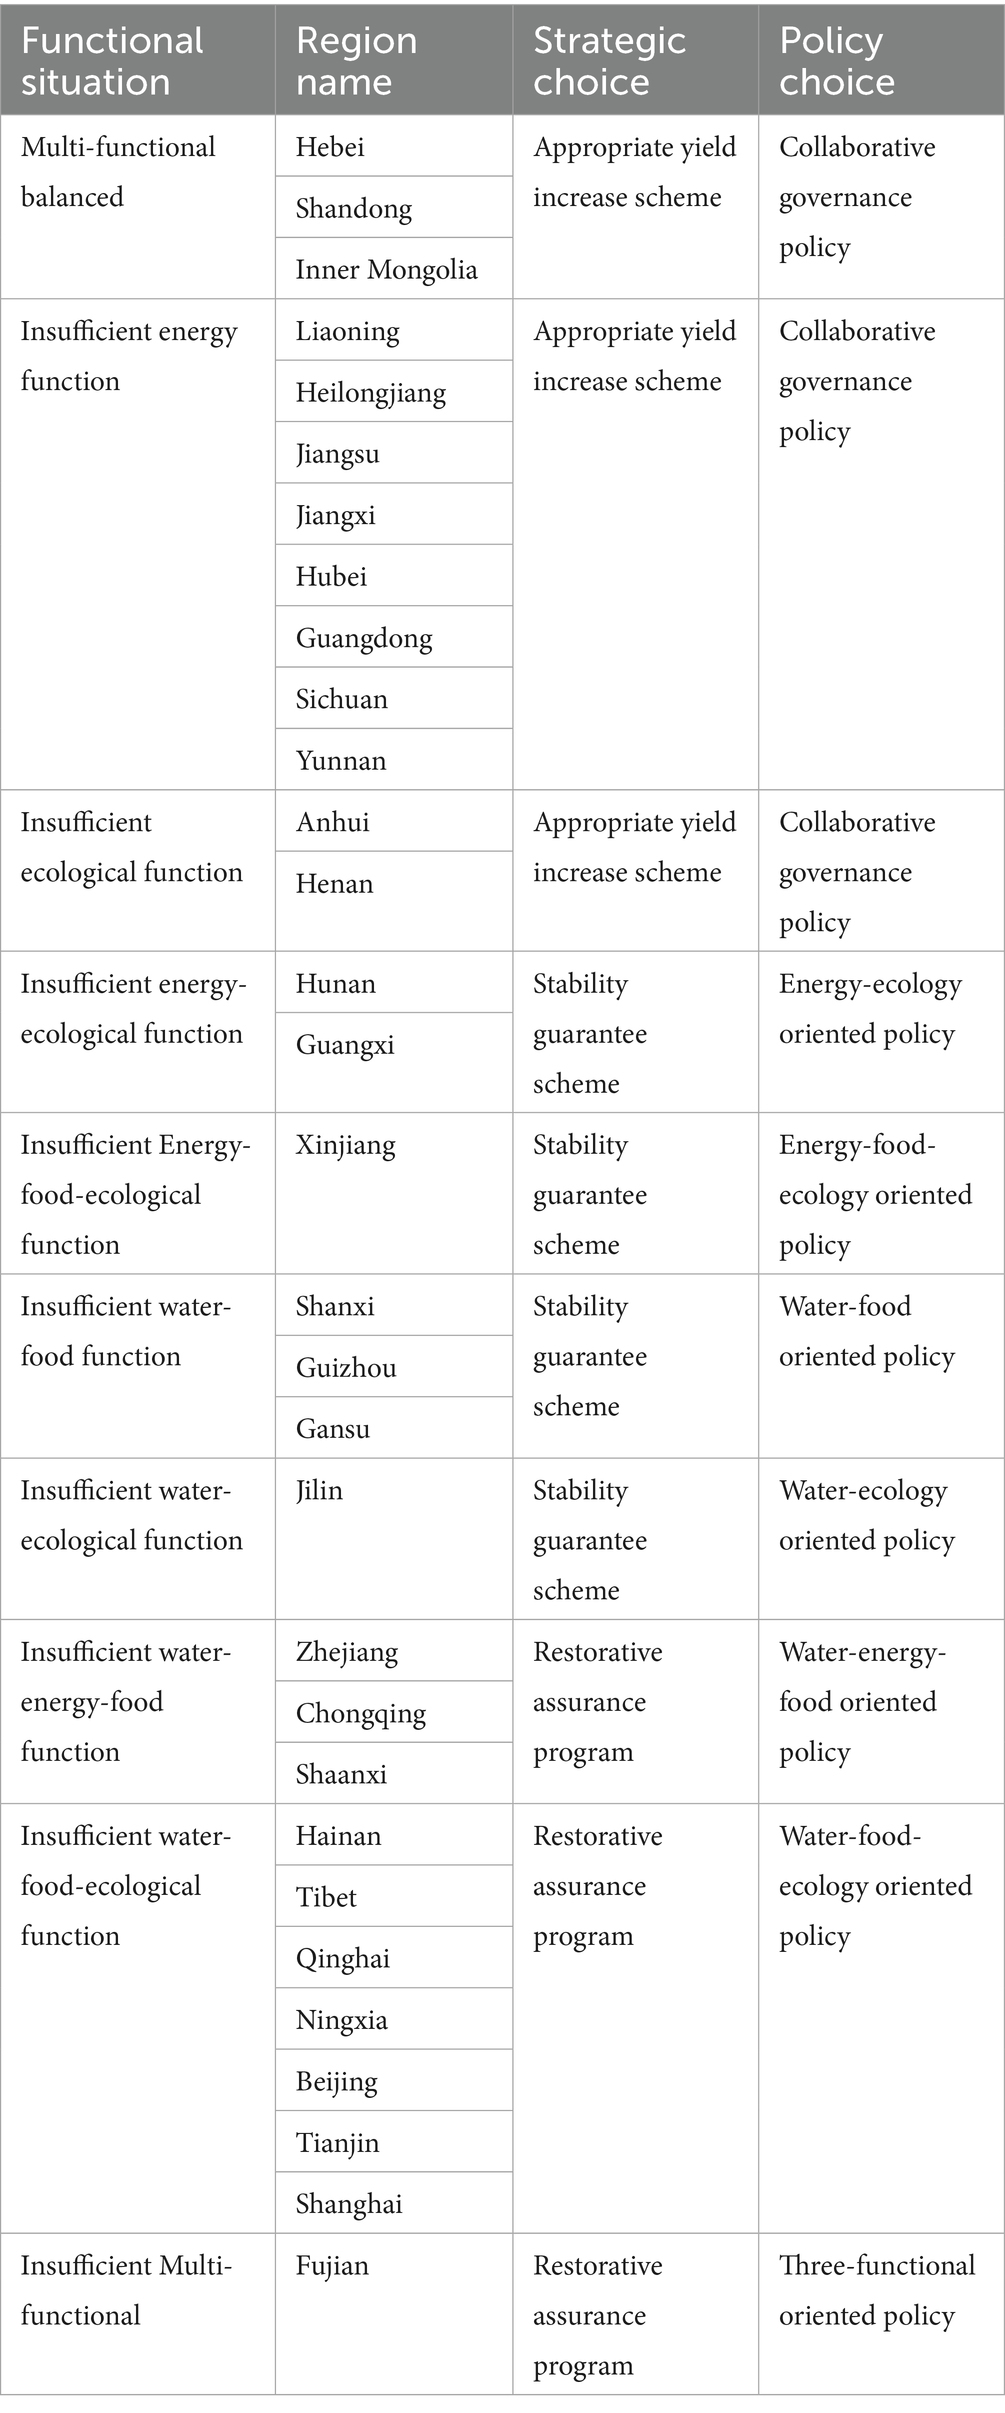
Table 7. Food security strategy and policy choices based on functional zoning.
There were 13 provincial-level regions in the multi-functional balanced advantage zones and the single-functional insufficient advantage zones. The moderate production increase scheme should be implemented. Specifically, they should increase production moderately, within the limits of the affordability of resource subsystems and the ecological subsystem. In addition, they should adopt synergistic governance policies. Based on maintaining the current WEFE food security guarantee capacity, the 13 provincial-level regions should strengthen the synergies within the system and promote the improvement of regional food yields and total production. This will contribute to the guarantee of food security in China.
The dual-functional insufficient advantage zones, the three-functional insufficient advantage zones, and the dual-functional insufficient disadvantage zones encompassed a total of seven provincial-level regions. These seven provincial-level regions should implement the stability assurance plans, with the core goal of maintaining the current food security guarantee capacity, focusing on enhancing the levels of weakly functions. In addition, they should also adopt governance policies oriented toward missing functions to ensure the overall assurance capacity of the system. By taking these measures, the regional grain output will be promoted to maintain a steady increase, thus contributing to ensuring food security in China.
There are 11 provincial-level regions in the three-functional insufficient disadvantage zones and the multi-functional insufficient disadvantage zones. These 11 provincial-level regions should implement a restorative security program, with the core goal of preventing food security risks, and focus on restoring the subsystem with weakly functions. At the same time, governance policies that lack functional orientation should be adopted. These measures are taken to prevent the potential threat to regional food security and help the region to make up for the missing function. In this way, they can focus on improving the overall level of security capabilities and help China’s food security.
Taking into account the WEFE, the food subsystem and the ecological subsystem are more complex. Its manifestation is reflected in the results of water resources and energy input. Therefore, the study suggested that the specific policy formulation to improve the status quo of insufficient functions should mainly consider how to affect water resources and energy input to promote food output and improve ecological friendliness. The policy recommendations are as follows:
In terms of agricultural water use: Firstly, it is necessary to implement water pricing standards that classify crops by type and tier water usage (Xu et al., 2019; Chen et al., 2013). The relative economic returns from grain crops are lower than those from cash crops. Offering relatively lower water prices can help reduce the cost of growing grain crops. A reasonable standard should be set for water usage requirements for crops of the same type. Farmers whose water usage exceeds this standard should be charged a relatively higher rate, while those whose usage is below the standard should be charged a relatively lower rate. This approach encourages farmers to proactively improve the efficiency of their irrigation water use. Secondly, planning and design for improving water resources utilization efficiency should be prioritized. On the one hand, exploring a more reasonable crop planting structure and cultivating crops better suited to local natural conditions is essential. On the other hand, constructing high-standard farmland, accelerating the development of agricultural water-saving facilities, and promoting the application of water-saving technologies such as drip irrigation and sprinkler irrigation are critical steps forward. Use policy support measures to encourage farmers to adopt water-saving technologies and build water-saving facilities. Explore water-saving facility construction plans that combine fiscal and financial support. Finally, encouraging market operators to actively adopt water-saving practices is key to ensuring the continued improvement of water resource utilization efficiency. Cultivating a water-saving industry can effectively promote the adoption of water-saving technologies in the region and reduce the cost of applying water-saving facilities.
In terms of agricultural energy: Firstly, strengthening subsidies for agricultural energy products such as agricultural diesel, fertilizers, plastic mulch, and pesticides is necessary to promote regional agricultural economic development and maintain national food security (Fan P. F. et al., 2023). Agricultural energy has always been a key component of China’s agricultural production costs. Reducing the cost of agricultural energy use will help increase farmers’ incomes (Li et al., 2014). Subsidies for agricultural energy should be viewed as a systematic project. Subsidizing agricultural energy will benefit the entire industry. The agricultural energy industry is part of the chemical industry, and its development will greatly help investment, imports and exports, and employment. In addition, the upstream and downstream industries of agricultural energy have certain requirements for storage and transportation. Local governments can use financial support to address these key issues, which will greatly improve the operating costs of local enterprises and benefit various industries, including agriculture. Secondly, it is also essential to integrate new technologies and concepts into the use of agricultural energy. Determining appropriate quantities and methods for the use of fertilizers, agricultural films, and other agricultural energy sources can significantly enhance the efficiency of agricultural energy utilization, not only reducing costs but also minimizing the ecological impact of agriculture. The application of new agricultural technologies is also a key means of developing environmentally friendly agriculture. Government policies, such as subsidies for organic fertilizers, intensive agriculture development, and clean energy integration, can boost farmers’ confidence, promote the efficient use of agricultural energy, and foster the growth of regional technology industries.
5 Discussion
5.1 Data sample
The panel data used in this study were sourced from official Chinese government agencies (the National Bureau of Statistics and the Ministry of Water Resources), providing a reliable and scientific foundation for the study findings. The panel data cover the time period from 2014 to 2021, spanning a total of 8 years. This selection was made after considering factors such as data availability, representativeness, and regional characteristics, and may have certain implications for this study. For example, the limited eight-year panel data may struggle to capture long-term trends, potentially leading to data biases that result in lower estimated values for some regions (this may be one of the reasons why Fujian Province is the only “multi-functional disadvantageous region”). However, the researchers consider that this choice is sufficient to support the conduct of the study, and the reasons are primarily twofold: On the one hand, in 2014–2021, the Chinese government promulgated a series of policies closely related to the research topic of the WEFE. Examples are as follows: At the end of 2015, the Central Rural Work Conference proposed the concept of an “all-encompassing approach to food” and the agricultural policy of “Agricultural Supply-Side Structural Reform.” The Ministry of Agriculture and Rural Affairs of China also issued policies on the control of non-point source pollution in the same year (Fan S. G. et al., 2023). The 13th Five-Year Plan (2016–2020) of the People’s Republic of China on National Economic and Social Development proposed a food crop production strategy based on farmland management and technological application (Wei, 2022). In 2016, China proposed a series of policies to promote adjustments to the agricultural production mix and support comprehensive price reform of water used for agricultural purposes (Zhang and Oki, 2023). The Central Committee of the Communist Party of China and the State Council released a package of policies in 2018, charting the roadmap for rural revitalization (Geng et al., 2023). In 2021, the “Opinions of the Central Committee of the Communist Party of China and the State Council on Comprehensively Promoting Rural Revitalization and Accelerating the Modernization of Agriculture and Rural Areas” emphasized that the Communist Party of China will regard work concerning agriculture, rural areas and farmers as its top priority. These key policy changes affecting China’s WEFE have been included in the time range of the study, indicating that the data are representative. On the other hand, compared with the long-term, the medium and long-term time range avoids the impact of major changes in policies or changes in data statistical caliber on the study results, which is conducive to increasing the scientific nature of the study.
5.2 Overall level
The issues to be considered in the functional zoning of food security are multifaceted (Li et al., 2022). It is necessary to conduct a systematic analysis and examination of various material elements that affect food production, as well as to comprehensively consider the humanistic elements that influence food security (Xu et al., 2023). This paper explored the functional zoning for food security guarantee from the perspective of the WEFE. At least four aspects need to be considered, and it must start from the organic unity of all factors. Therefore, based on the previous results, this study constructed an indicator system from four aspects of water resources, energy, food, and ecology, and incorporated various influencing factors. The principal component analysis method was introduced to screen the indicators again from the perspective of data information. To a certain extent, it reduced the redundancy of the measurement system and enhanced the scientificity and representativeness of the measurement system.
It is in line with the frontier and development trend of the academic circle to explore food security from the perspective of the WEFE. The research on food security from the perspective of multi-dimensional is innovative and valuable (Qin et al., 2022). On the one hand, studying food security from the perspective of resources has a certain innovative perspective and practical value (Van Vuuren et al., 2019). On the other hand, the study of incorporating ecosystems into food security has reference value for the development of sustainable agriculture (Huang et al., 2015). In terms of the evaluation results of each province, except for Jilin Province in 2014 and 2015, the evaluation scores of food security capacity of 13 major grain-producing regions were ranked in the top 17, which was more in line with expectations. This was more consistent with the reality of the higher level of food security capacity in the main producing areas. It is worth noting that the Xinjiang Autonomous Region, Guangdong Province, Yunnan Province, and Guangxi Autonomous Region were non-major food-producing areas with high scores in evaluating multi-year food security capabilities. The Xinjiang Autonomous Region’s multi-year food production was at the national forefront of non-major grain-producing zones (Zhao et al., 2025). The food production of Guangdong, Yunnan, and Guangxi autonomous regions was also higher food production in the non-major grain-producing areas. Moreover, they are located in the south with abundant water resources. It was in line with the reality that these areas have obtained a relatively high evaluation score in the calculation of the ability to ensure food security with the WEFE. In terms of overall results, from 2014 to 2021, the cumulative value of the evaluation results of food security capacity in 31 provincial-level regions showed positive growth. This is consistent with the reality of the rising overall capacity of China’s food security. On the other hand, the changing trend of the cumulative value of the evaluation results of the food security guarantee capacity of 31 provincial-level regions was also highly correlated with the changing trend of the total food output of 31 provincial-level regions. Although there were differences in values, the changing trend had a high consistency, which further proved the reliability of the indicator system and the calculation results (Figure 5). In terms of influencing factors, the total amount of water supply (A1), the number of water-saving irrigation machinery (A4), and the effective irrigation area of cultivated land (A5) had the highest multi-year obstacle degree. The obstacle degree of the total agricultural water (A2) indicator increased the most. The above indicators are closely related to the development of water-saving agriculture. It confirmed that the guarantee level of food security is restricted by the utilization level of regional water resources (De Laurentiis et al., 2016). The agricultural fertilizer application amount (A7), the amount of agricultural diesel oil used in various regions (A8), and the amount of pesticide used (A9) had the highest multi-year contribution to the food security guarantee capacity. They are all agricultural material inputs for food production. It is consistent with the reality that China’s agricultural economic development has relied on a large amount of agricultural materials in recent years (Zhang et al., 2019). The contribution of water-saving irrigation area (A3), cumulative soil erosion control area (A15), and green coverage area (A16) to food security capacity has been increasing. It revealed that the level of food security in the future may be closely related to regional ecology. It also confirmed the necessity of incorporating ecology into the water-energy-food system to carry out food security research in this paper. And it should be explored in more details in the future (Gu et al., 2025).
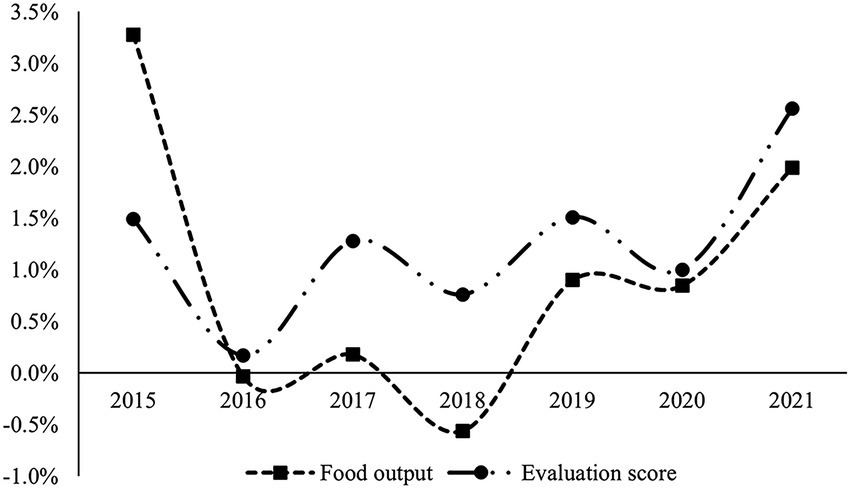
Figure 5. Change curves of food output and evaluation score.
5.3 Empirical models
The zoning scheme based on the calculation results of the empirical model is a scientific method, and the reliability of the results has been confirmed in research and practice (Teng et al., 2021). Due to the lack of zoning research in the field of link relationships, this study attempted to refer to the zoning research model in related fields such as agricultural zoning and water resources zoning (Ma and Niu, 2009; Liu and Tu, 2018). This study researched on the food security function zoning related to the water-energy-food-ecological system. Specifically, this study integrated the principal component analysis, the entropy weight method, the coefficient of variation method, the mean square deviation method, the analytic hierarchy process, the obstacle degree model, and the contribution degree model to study and judge the food security guarantee ability of the region. From the function of the model, the influencing factors of support capability can be effectively identified. It considered the need for empirical judgment and objective data redundancy elimination in the selection of indicators, which was innovative. It can provide reference and inspiration for the research of bond relationships. However, the model makes it difficult to describe the cyclical interaction between the links fully. There are still some deficiencies in showing the mutual transformation between the four elements. At this stage, it is necessary to introduce a multi-domain empirical model to improve it, so as to show this complex relationship better.
5.4 Functional zoning
The results of the functional zoning designed by this study may not be consistent with the conventional understanding of the distribution of resources in different regions, such as some regions with net energy output were judged to be energy-dysfunctional. There are many reasons for this, and the limitation of data and indicator selection is one of the important reasons. However, the results of this study on food security oriented to the WEFE are reasonable and scientific. The reasons are as follows (taking Fujian Province as an example): On the one hand, this study emphasized food security from the perspective of the WEFE and favored food-related water, energy, and ecology indicators in indicator construction, which is unfavorable for Fujian Province, a non-major grain-producing region. For example, from the perspective of total water resources and per capita water resources, Fujian Province is not a water shortage region, but from the perspective of agriculture, the investigation of water resources has become agricultural water consumption and investment in water conservancy facilities. Fujian Province is not so advantageous in quantity (Chen et al., 2007). On the other hand, the judgment basis of functional advantage and regional advantage mainly lies in its assessment results. Fujian Province was evenly dispersed in the four subsystems due to the low assessment results of some indicators in non-major grain-producing regions. Therefore, the evaluation scores of the four functions in Fujian Province were all in a state of deficiency.
The potential impact of extreme climate on functional zoning is difficult to ignore (Chavez et al., 2015; Beer, 2018). In the long run, extreme climate will affect the function of regionalization by affecting the ecosystem and water circulation system of the region, but this effect will not rapidly transform the advantageous area into the disadvantageous area in the short term (Fanzo et al., 2025). Therefore, improving the resilience of the regional WEFE is still an ideal strategy to deal with this impact (Liu et al., 2022). In practice, the improvement of resilience can be promoted by strengthening policy support and innovating engineering technology. In terms of policy support, first, local governments should formulate reasonable emergency response plans to ensure that appropriate response strategies are in place when disasters occur (Xie et al., 2024). In addition, an inter-departmental emergency management mechanism should be established to ensure the effective implementation of emergency response programs and the rational scheduling of emergency supplies. Second, innovate policy support methods to provide farmers with disaster recovery capabilities in the form of insurance, loans, etc. In the engineering foundation innovation program, first, we must continue to promote the construction of water conservancy facilities, ensure the maintenance of existing facilities, and minimize the probability of predictable disasters (Zhao et al., 2022). In addition, it is also necessary to pay attention to the water level monitoring of the whole basin, which helps to reduce the flood risk caused by the reservoir water level problem, even if the reservoir water level is regulated. Second, high-standard farmland has stronger resilience than ordinary farmland. In the face of flood disasters, the impact is relatively small. Continuously promoting the construction of high-standard farmland is also a powerful measure to improve the resilience of the WEFE (Ren et al., 2024).
5.5 Policy impact
Food production is affected by natural conditions and socio-economic factors. However, there are significant differences in social economy and natural endowments in China’s vast regions. To achieve comprehensive protection of China’s food security, it is necessary to make an overall plan (Cottrell et al., 2019). Therefore, they should effectively take advantage of the geographical advantages and carry out scientific planning based on food (Liu et al., 2018). In recent years, with the rapid development of agriculture and the rural economy, different regions have formulated agricultural zoning work according to different target needs. However, food security zoning from the perspective of multi-dimensional resources is still scarce, and there are few research results in related fields. On the one hand, it is due to the short time of the nexus. On the other hand, there are many competent departments involved (Chen Y. S. et al., 2024), and it is difficult to carry out supervision in the process of zoning implementation. Food production needs agricultural inputs, land elements, water resources, and related infrastructure investment. The input of various factors will involve the overall coordination of multiple competent departments (García-Martín et al., 2016). This study divided the guarantee ability and function of food security from the perspective of multi-dimensional resources. It can form the basis and reference for decision-making in the coordinated governance of food security by multiple departments. In the future, we will continue to explore in detail based on this direction. We will also explore the specific measures of multi-sectoral participation in food security governance to form more specific policy recommendations.
Regarding the impact of regional differences on policies, the study argued that the sustainable development of the WEFE is of great significance to any region. However, in the process of promotion, we should comprehensively consider the local economic level, natural endowment, functional positioning and other factors to formulate policies suitable for local development (Wichelns, 2017). First, there are areas with certain differences in economic levels. For relatively rich areas, the form of performance appraisal can be adopted. The resource footprint of regional resource utilization efficiency or grain output is taken as part of the assessment content of officials (Halpern et al., 2022). The performance incentive and promotion incentive are taken as the enthusiasm to promote regional self-governance. For relatively poor areas, the central government should give relatively tolerant financial support. It can help the government in relatively poor areas to deal with the financial problems of related projects and policies in the form of special subsidies or a fixed number of project support each year. In addition, financial forces can also be introduced for the construction of large-scale engineering facilities, such as the Real Estate Investment Trust (REIT) and other forms to raise funds from society (Tang and Sun, 2022). Second, there are areas with certain differences in natural endowments. No crop is suitable for all environments, and the optimization of crop planting structure is an effective solution to the differences of resource endowment (Qiu et al., 2024). The core idea is to make the land more suitable for crops, which includes both the yield and value of the fit, but also the sustainability of the fit. Scientific and reasonable crop planting structure optimization can effectively improve the utilization efficiency of resources. For example, the tea planting industry in Fujian. Third, there are some differences in functional positioning. According to the regional grain flow, China has designated the main production area, the main sales area and the production and sales balance area, which correspond to the net outflow, net inflow and relative balance of grain, respectively. Such a division provides a reference for the formulation of a benefit compensation mechanism for grain production (Delang and Yuan, 2015). Specifically, the net inflow area of grain should be compensated for the net inflow area. This compensation should consider the resource footprint generated by the production of grain, the impact of the production of grain on the local ecosystem, and the impact of a large number of labor and land factors on economic development.
5.6 Cost-benefit for policies
In the part of Food Security Strategy and Policy Options, this study proposed a package of policy recommendations to promote the sustainable development of the WEFE. The cost–benefit of these policy recommendations is directly related to the feasibility of the policy, so it is necessary to discuss further.
From the perspective of water circulation, agricultural economic development always has a negative impact on the regional water circulation and water conservation (exploring regional ecological compensation of cultivated land from the perspective of the mismatch between grain supply and demand) (Sterling et al., 2013). This cost is necessary from the perspective of food security, because human beings must rely on food to obtain energy. However, we can reduce the impact on the ecological environment within our ability (Jägermeyr et al., 2015). A series of measures to improve the utilization efficiency of water resources are a response to the above problems. It can not only reduce the demand for natural resources in agricultural development, but also reduce the risk of soil loss (Perrone and Hornberger, 2014). In addition, it should be noted that the process of improving the utilization efficiency of water resources is also the process of cultivating water-saving industries. While improving the utilization efficiency of resources, it can also create new jobs, thus promoting the high-quality development of the social economy.
From the perspective of ecological agriculture, the problems of non-point source pollution and carbon emissions brought by agricultural development have reached a level that is difficult to ignore, and action must be taken to deal with them (Xian et al., 2020). It is a low-cost but very effective means to promote the rational and efficient use of agricultural materials such as fertilizers, pesticides and plastic films. The reason is that the manufacturing process of these materials will produce carbon emissions and pollution. The excessive use of these materials will not only fail to achieve effective yield increase of crops, but also bring pollution (Sun et al., 2012). The direct reason is that it is difficult for farmers to accurately grasp the demand of crops for nitrogen, phosphorus and potassium. This requires the government to build a reasonable platform to promote effective communication between universities, scientific research institutions and other professionals and farmers. Such platform construction is a win-win situation for farmers, scientific research institutions and the government. Farmers can reduce procurement costs, such as fertilizer. Scientific research institutions can obtain relevant data for research. The government can achieve achievements such as increasing farmers’ income, and can achieve lower costs and higher benefits.
From the perspective of the sustainability of the food system, the construction of high-standard farmland and related functional facilities has multiple values (Peng et al., 2022). Food security is of great strategic significance to China. Ensuring food security is an important guarantee for safeguarding national sovereignty. Under the background of frequent extreme disasters, intensified geographical contradictions and challenges to global security governance, the construction of high-standard farmland not only has the function of reducing resource consumption and increasing food production, but also has the important value of maintaining national food security (Xu et al., 2025).
6 Conclusion
This study constructed a measurement system consisting of four subsystems and 17 indicators and used 2014–2021 panel data from 31 provincial-level regions (excluding Hong Kong, Macao, and Taiwan) to assess food security capability from the perspective of WEFE. The conclusions are as follows: Firstly, From 2014 to 2021, the food security guarantee capacity had improved. The food security guarantee capacity value of 31 provincial-level regions showed an upward trend. The provincial average support capacity value increased by 8.48%. The scores of Yunnan, Hubei, Gansu, and 12 other provincial-level regions increased significantly by more than 10%. The 13 major grain-producing regions in China were ranked in the top 16 in terms of security capacity in 2021. Secondly, From 2014 to 2021, a small number of indicators contribute more significantly to food security capacity. Specifically, the average annual contribution of agricultural fertilizer application, agricultural diesel fuel use, and pesticide use reached 46.71%, which may be unsustainable and pose potential environmental risks. Furthermore, the contribution of some indicators to food security guarantee capacity has significantly increased. Specifically, over 8 years, the water-saving irrigation area, cumulative soil erosion control area, and green coverage area have increased by 27.17, 22.29, and 25.93%, which has shown the important role of ecological environment and resource elements in the food system. Thirdly, From 2014 to 2021, the indicator obstacle degree to food security capacity changed little. While pesticide use decreased significantly by 22.17%, all other indicators changed by less than 10%. Differences in the degree of obstacles between indicators were slight, and the horizontal deviation of all indicators from the mean value was not more than 5%. The obstacle degree of the water resources system indicator was generally high. In the future, attention should be paid to the constraints of water resources on the development of the WEFE. Lastly, based on the assessment results of food security capability from the perspective of WEFE, this study designed functional zoning for the studied regions. This functional zoning includes seven types, and the difference between them is mainly the degree of perfection of the WEFE system function in the assessment results. Furthermore, it proposed response strategies and policy recommendations to improve food security in the region, which were tailored to the characteristics of different functional areas.
Data availability statement
The raw data supporting the conclusions of this article will be made available by the authors without undue reservation.
Author contributions
KW: Methodology, Data curation, Project administration, Supervision, Conceptualization, Visualization, Writing – original draft, Funding acquisition, Investigation, Formal analysis, Writing – review & editing, Resources. FZ: Resources, Writing – original draft, Investigation, Formal analysis, Visualization, Funding acquisition, Conceptualization, Project administration, Data curation, Supervision, Writing – review & editing, Methodology. YN: Data curation, Conceptualization, Methodology, Investigation, Resources, Formal analysis, Writing – review & editing, Project administration, Funding acquisition, Supervision, Visualization. CL: Methodology, Writing – review & editing, Formal analysis, Project administration, Data curation, Supervision, Writing – original draft, Investigation, Conceptualization, Visualization, Funding acquisition, Resources. XG: Visualization, Resources, Funding acquisition, Project administration, Data curation, Formal analysis, Conceptualization, Supervision, Writing – review & editing, Writing – original draft, Methodology, Investigation.
Funding
The author(s) declare that financial support was received for the research and/or publication of this article. This research was funded by the Innovation Project of AII, CAAS, grant number CAAS-ASTIP-2025-AII.
Conflict of interest
The authors declare that the research was conducted in the absence of any commercial or financial relationships that could be construed as a potential conflict of interest.
Correction note
A correction has been made to this article. Details can be found at: 10.3389/fsufs.2025.1709041.
Generative AI statement
The authors declare that no Gen AI was used in the creation of this manuscript.
Any alternative text (alt text) provided alongside figures in this article has been generated by Frontiers with the support of artificial intelligence and reasonable efforts have been made to ensure accuracy, including review by the authors wherever possible. If you identify any issues, please contact us.
Publisher’s note
All claims expressed in this article are solely those of the authors and do not necessarily represent those of their affiliated organizations, or those of the publisher, the editors and the reviewers. Any product that may be evaluated in this article, or claim that may be made by its manufacturer, is not guaranteed or endorsed by the publisher.
References
Abdi, H., and Williams, L. J. (2010). Principal component analysis. WIREs Comput. Stat. 2, 433–459. doi: 10.1002/wics.101
Beer, T. (2018). “The impact of extreme weather events on food security” in Climate change, extreme events and disaster risk reduction. Sustainable development goals series. eds. S. Mal, R. Singh, and C. Huggel (Cham Press: Springer), 121–133.
Béné, C. (2020). Resilience of local food systems and links to food security –a review of some important concepts in the context of COVID-19 and other shocks. Food Secur. 12, 805–822. doi: 10.1007/s12571-020-01076-1
Bidoglio, G., and Brander, L. (2016). Enabling management of the water-food-energy-ecology system services nexus. Ecosyst. Serv. 17, 265–267. doi: 10.1016/j.ecoser.2016.02.001
Bousbaine, A., Akkari, C., and Bryant, C. (2017). What can agricultural land use planning contribute to food production and food policy? Int. J. Avian Wildl. Biol. 2, 13–20. doi: 10.15406/ijawb.2017.02.00009
Cao, Y. X., and Huang, X. (2021). A deep learning method for building height estimation using high-resolution multi-view imagery over urban areas: a case study of 42 Chinese cities. Remote Sens. Environ. 264:112590. doi: 10.1016/j.rse.2021.112590
Chavez, E., Conway, G., Ghil, M., and Sadler, M. (2015). An end-to-end assessment of extreme weather impacts on food security. Nat. Clim. Chang. 5, 997–1001. doi: 10.1038/nclimate2747
Chen, Q., Mao, Y., and Cheng, J. Q. (2023). Temporal and spatial evolution of agricultural carbon emissions and their impact on functional zoning: evidence from Hubei Province. Front. Sustain. Food Syst. 7:1286567. doi: 10.3389/fsufs.2023.1286567
Chen, Y. S., Sun, Z. F., Wang, Y. M., Ma, Y., and Yang, W. L. (2024). Seeds of cross-sector collaboration: a multi-agent evolutionary game theoretical framework illustrated by the breeding of salt-tolerant rice. Agriculture 14:300. doi: 10.3390/agriculture14020300
Chen, Z. S., Wang, H. M., and Qi, X. T. (2013). Pricing and water resource allocation scheme for the south-to-north water diversion project in China. Water Resour. Manag. 27, 1457–1472. doi: 10.1007/s11269-012-0248-1
Chen, J. F., Wei, S. Q., Chang, K. T., and Tsai, B. W. (2007). A comparative case study of cultivated land changes in Fujian and Taiwan. Land Use Policy 24, 386–395. doi: 10.1016/j.landusepol.2006.05.002
Chen, Z. X., Zhang, M., Dong, R. K., and Wang, S. P. (2024). Building resilient food security against global crisis: new evidence from China. Food Energy Secur. 13:e70008. doi: 10.1002/fes3.70008
Cottrell, R. S., Nash, K. L., Halpern, B. S., Remenyi, T. A., Corney, S. P., Fleming, A., et al. (2019). Food production shocks across land and sea. Nat. Sustain. 2, 130–137. doi: 10.1038/s41893-018-0210-1
De Laurentiis, V., Hunt, D. V. L., and Rogers, C. D. F. (2016). Overcoming food security challenges within an energy/water/food nexus (EWFN) approach. Sustainability 8:95. doi: 10.3390/su8010095
Deconinck, K., Gregg, D., Henderson, B., and Hill, D. (2023). Towards resilient food systems: Implications of supply chain disruptions and policy responses. OECD food, agriculture and fisheries papers., vol. 205. Paris: OECD Publishing.
Delang, C. O., and Yuan, Z. (2015). China’s grain for green program. A review of the largest ecological restoration and rural development program in the world. Switzerland: Springer International Publishing, 51–66.
Eakin, H., Connors, J. P., Wharton, C., Bertmann, F., Xiong, A., and Stoltzfus, J. (2017). Identifying attributes of food system sustainability: emerging themes and consensus. Agric. Hum. Values 34, 757–773. doi: 10.1007/s10460-016-9754-8
Fan, P. F., Mishra, A. K., Feng, S. Y., and Su, M. (2023). The effect of agricultural subsidies on chemical fertilizer use: evidence from a new policy in China. J. Environ. Manag. 344:118423. doi: 10.1016/j.jenvman.2023.118423
Fan, J., Wang, Y. F., Wang, C. S., Chen, T., Jin, F. J., Zhang, W. Z., et al. (2019). Reshaping the sustainable geographical pattern: a major function zoning model and its applications in China. Earths Future 7, 25–42. doi: 10.1029/2018EF001077
Fan, S. G., Zhu, Y. C., and Fang, X. M. (2023). Big food vision and food security in China. Agric. Rural Stud. 1:7. doi: 10.59978/ar01010001
Fang, T. T., Zhu, Y., Wang, S. X., Xing, J., Zhao, B., Fan, S. J., et al. (2021). Source impact and contribution analysis of ambient ozone using multi-modeling approaches over the Pearl River Delta region, China. Environ. Pollut. 289:117860. doi: 10.1016/j.envpol.2021.117860
Fanzo, J., Carducci, B., Louis-Jean, J., Herrero, M., Karl, K., and Rosenzweig, C. (2025). Climate change, extreme weather events, food security, and nutrition: evolving relationships and critical challenges. Annu. Rev. Nutr. 45, 335–360. doi: 10.1146/annurev-nutr-111324-111252
Frantsisko, O. Y., Ternavshchenko, K. О., Molchan, A. S., Ostaev, G. Y., Ovcharenko, N. A., and Balashova, I. V. (2020). Formation of an integrated system for monitoring the food security of the region. Amazonia Investiga 9, 59–70.
Fu, N., Liu, D. F., Liu, H., Pan, B. Z., Ming, G. H., and Huang, Q. (2024). Evaluation of the coupled coordination of the water–energy–food–ecology system based on the sustainable development goals in the upper Han River of China. Agronomy 14:706. doi: 10.3390/agronomy14040706
Gao, M. W., Hu, Y. C., Liu, X. W., and Liang, M. Y. (2025). Revealing multi-scale characteristics of ecosystem services supply and demand imbalance to enhance refined ecosystem management in China. Ecol. Indic. 170:112971. doi: 10.1016/j.ecolind.2024.112971
García-Martín, M., Bieling, C., Hart, A., and Plieninger, T. (2016). Integrated landscape initiatives in Europe: multi-sector collaboration in multi-functional landscapes. Land Use Policy 58, 43–53. doi: 10.1016/j.landusepol.2016.07.001
Ge, D. Z., Long, H. L., Zhang, Y. N., Ma, L., and Li, T. T. (2018). Farmland transition and its influences on grain production in China. Land Use Policy 70, 94–105. doi: 10.1016/j.landusepol.2017.10.010
Geng, Y., Liu, L., and Chen, L. (2023). Rural revitalization of China: a new framework, measurement and forecast. Soc. Econ. Plan. Sci. 89:101696. doi: 10.1016/j.seps.2023.101696
Greenacre, M., Groenen, P. J. F., Hastie, T., D’Enza, A. L., Markos, A., and Tuzhilina, E. (2022). Principal component analysis. Nat. Rev. Methods Primers 2:100. doi: 10.1038/s43586-022-00184-w
Gu, X. Y., Jin, H. J., and Luo, J. C. (2025). The associated ecological risks identification and optimal management of basin “water-energy-food-ecology” nexus: a case study of the yellow river basin. J. Clean. Prod. 520:146129. doi: 10.1016/j.jclepro.2025.146129
Haji, M., Govindan, R., and Al-Ansari, T. (2022). A computational modelling approach based on the ‘energy-water-food nexus node’ to support decision-making for sustainable and resilient food security. Comput. Chem. Eng. 163:107846. doi: 10.1016/j.compchemeng.2022.107846
Halpern, B. S., Frazier, M., Verstaen, J., Rayner, P. E., Clawson, G., Blanchard, J. L., et al. (2022). The environmental footprint of global food production. Nat. Sustain. 5, 1027–1039. doi: 10.1038/s41893-022-00965-x
He, S., Lin, L., Xu, Q., Hu, C. X., Zhou, M. M., Liu, J. H., et al. (2021). Farmland zoning integrating agricultural multi-functional supply, demand and relationships: a case study of the Hangzhou metropolitan area, China. Land 10:1014. doi: 10.3390/land10101014
Huang, J., Tichit, M., Poulot, M., Darly, S., Li, S. C., Petit, C., et al. (2015). Comparative review of multifunctionality and ecosystem services in sustainable agriculture. Journal of Environmental Management. 149. doi: 10.1016/j.jenvman.2014.10.020
Huan, H. F., Wang, L., and Zhang, Y. (2025). Regional differences, convergence characteristics, and carbon peaking prediction of agricultural carbon emissions in China. Environ. Pollut. 366:125477. doi: 10.1016/j.envpol.2024.125477
Jägermeyr, J., Gerten, D., Heinke, J., Schaphoff, S., Kummu, M., and Lucht, W. (2015). Water savings potentials of irrigation systems: global simulation of processes and linkages. Hydrol. Earth Syst. Sci. 19, 3073–3091. doi: 10.5194/hess-19-3073-2015
Jiang, L. J., Liu, Y., and Yang, C. (2024). Trade-off between the future water resource utilization and grain production in a water-deficient region from the perspective of the water−land−grain nexus. J. Hydrol. 640:131697. doi: 10.1016/j.jhydrol.2024.131697
Jiang, Z. M., Wu, H., Lin, A. Q., Shariff, A. R. M., Hu, Q., Song, D. X., et al. (2022). Optimizing the spatial pattern of land use in a prominent grain-producing area: a sustainable development perspective. Sci. Total Environ. 843:156971. doi: 10.1016/j.scitotenv.2022.156971
Kertolli, E., Prosperi, P., Harbouze, R., Moussadek, R., Echchgadda, G., and Belhouchette, H. (2024). The water–energy–food–ecosystem nexus in North Africa dryland farming: a multi-criteria analysis of climate-resilient innovations in Morocco. Agric. Econ. 12:34. doi: 10.1186/s40100-024-00327-5
Li, C. X., Wang, X. L., Ji, Z. X., Li, L., and Guan, X. K. (2022). Optimizing the use of cultivated land in China’s main grain-producing areas from the dual perspective of ecological security and leading-function zoning. Int. J. Environ. Res. Public Health 19:13630. doi: 10.3390/ijerph192013630
Li, S., Zhang, Y. Q., Nadolnyak, D., Wesley, J. D., and Zhang, Y. F. (2014). Fertilizer industry subsidies in China: who are the beneficiaries? China Agric. Econ. Rev. 6, 433–451. doi: 10.1108/CAER-12-2012-0134
Liu, S. K., Lin, Z. E., and Chiueh, P. T. (2022). Improving urban sustainability and resilience with the optimal arrangement of water-energy-food related practices. Sci. Total Environ. 812:152559. doi: 10.1016/j.scitotenv.2021.152559
Liu, X. L., and Tu, Z. Z. (2018). Water environment safety evaluation method and its application in Beijing-Tianjin-Hebei region. China Manag. Sci. 26, 160–168. doi: 10.16381/j.cnki.issn1003-207x.2018.03.017
Liu, Y. S., Zhang, Z. W., and Wang, J. Y. (2018). Agricultural territorial differentiation and modern agricultural zoning program. Acta Geograph. Sin. 73, 203–218. doi: 10.11821/dlxb201802001
Lu, S. B., Bai, X., Zhang, J., Li, J. K., Li, W., and Lin, J. (2022). Impact of virtual water export on water resource security associated with the energy and food bases in Northeast China. Technol. Forecast. Soc. Change 180:121635. doi: 10.1016/j.techfore.2022.121635
Ma, Y. H., and Niu, W. Y. (2009). Core design of main functional areas for grain production in China--constructing a safe line for national survival. Proc. Chin. Acad. Sci. 24, 241–247. doi: 10.16418/j.issn.1000-3045.2009.03.011
McMichael, P. (2011). Food system sustainability: questions of environmental governance in the new world (dis) order. Glob. Environ. Chang. 21, 804–812. doi: 10.1016/j.gloenvcha.2011.03.016
Peng, J. Q., Zhao, Z. H., and Chen, L. L. (2022). The impact of high-standard farmland construction policy on rural poverty in China. Land 11:1578. doi: 10.3390/land11091578
Perrone, D., and Hornberger, G. M. (2014). Water, food, and energy security: scrambling for resources or solutions? WIREs Water 1, 49–68. doi: 10.1002/wat2.1004
Qin, J. X., Duan, W. L., Chen, Y. N., Dukhovny, V. A., Sorokin, D., Li, Y. P., et al. (2022). Comprehensive evaluation and sustainable development of water-energy-food-ecology systems in Central Asia. Renew. Sust. Energ. Rev. 157:112061. doi: 10.1016/j.rser.2021.112061
Qin, G. Y., Zhang, M. J., Yan, Q. Y., Xu, C. B., and Kammen, D. M. (2021). Comprehensive evaluation of regional energy internet using a fuzzy analytic hierarchy process based on cloud model: a case in China. Energy 228:120569. doi: 10.1016/j.energy.2021.120569
Qiu, T. Y., Shi, Y., Peñuelas, J., Liu, J., Cui, Q. L., Sardans, J., et al. (2024). Optimizing cover crop practices as a sustainable solution for global agroecosystem services. Nat. Commun. 15:10617. doi: 10.1038/s41467-024-54536-z
Ren, F. W., Xia, Z. H., Huang, Y., Chi, J. T., Gai, H., and Wang, Y. W. (2024). The impact of high-standard farmland construction (HSFC) on China's agricultural resilience. Res. Square. doi: 10.21203/rs.3.rs-4495317/v1
Shi, W. J., Liu, H. L., Steinberger, Y., Hu, Y. C., Yang, Y., Meng, Q. F., et al. (2025). Water and land use in China's food systems: exploring potential mitigation strategies. Sustain. Prod. Consum. 53, 28–39. doi: 10.1016/j.spc.2024.12.001
Shi, H. Y., Luo, G. P., Zheng, H. W., Chen, C. B., Bai, J., Liu, T., et al. (2020). Coupling the water-energy-food-ecology nexus into a Bayesian network for water resources analysis and management in the Syr Darya River basin. J. Hydrol. 581:124387. doi: 10.1016/j.jhydrol.2019.124387
Sterling, S. M., Ducharne, A., and Polcher, J. (2013). The impact of global land-cover change on the terrestrial water cycle. Nat. Clim. Chang. 3, 385–390. doi: 10.1038/nclimate1690
Sun, B., Zhang, L. X., Yang, L. Z., Zhang, F. S., Norse, D., and Zhu, Z. L. (2012). Agricultural non-point source pollution in China: causes and mitigation measures. Ambio 41, 370–379. doi: 10.1007/s13280-012-0249-6
Tan, S. K., Hu, B. X., Kuang, B., and Zhou, M. (2021). Regional differences and dynamic evolution of urban land green use efficiency within the Yangtze River Delta, China. Land Use Policy 106:105449. doi: 10.1016/j.landusepol.2021.105449
Tang, F. H. M., Lenzen, M., McBratney, A., and Maggi, F. (2021). Risk of pesticide pollution at the global scale. Nat. Geosci. 14, 206–210. doi: 10.1038/s41561-021-00712-5
Tang, Y. F., Lu, X. H., Yi, J. L., Wang, H. Z., Zhang, X. P., and Zheng, W. B. (2021). Evaluating the spatial spillover effect of farmland use transition on grain production–an empirical study in Hubei Province, China. Ecol. Indic. 125:107478. doi: 10.1016/j.ecolind.2021.107478
Tang, L., and Sun, S. Y. (2022). Fiscal incentives, financial support for agriculture, and urban-rural inequality. Int. Rev. Financ. Anal. 80:102057. doi: 10.1016/j.irfa.2022.102057
Tang, C., Xie, X. L., Wei, G., Pan, L. L., and Qi, Z. H. (2024). Exploring the evolutionary characteristics of food security in China and the United States from a multidimensional perspective. Foods 13:2272. doi: 10.3390/foods13142272
Tebaldi, L., and Vignali, G. (2023). Is it possible to quantify the current resilience level of an agri-food system? A review of the literature. Agric. Econ. 11:45. doi: 10.1186/s40100-023-00286-3
Teng, X., Zhao, Q. W., Zhang, P. P., Liu, L., Dong, W. E., Hu, H., et al. (2021). Implementing marine functional zoning in China. Mar. Policy 132:103484. doi: 10.1016/j.marpol.2019.02.055
Van Vuuren, D. P., Bijl, D. L., Bogaart, P., Stehfest, E., Biemans, H., Dekker, S. C., et al. (2019). Integrated scenarios to support analysis of the food–energy–water nexus. Nat. Sustain. 2, 1132–1141. doi: 10.1038/s41893-019-0418-8
Van Wesenbeeck, C. F. A., Keyzer, M. A., Van Veen, W. C. M., and Qiu, H. (2021). Can China's overuse of fertilizer be reduced without threatening food security and farm incomes? Agric. Syst. 190:103093. doi: 10.1016/j.agsy.2021.103093
Wang, H. D., Cheng, M. H., Zhang, S. H., Fan, G. L., Feng, H., Zhang, F. C., et al. (2021). Optimization of irrigation amount and fertilization rate of drip-fertigated potato based on analytic hierarchy process and fuzzy comprehensive evaluation methods. Agric. Water Manag. 256:107130. doi: 10.1016/j.agwat.2021.107130
Wang, Y. N., Fang, X. L., Yin, S. W., and Chen, W. (2021). Low-carbon development quality of cities in China: evaluation and obstacle analysis. Sustain. Cities Soc. 64:102553. doi: 10.1016/j.scs.2020.102553
Wang, M. C., and Huang, X. J. (2024). Inhibit or promote: spatial impacts of multifunctional farmland use transition on grain production from the perspective of major function-oriented zoning. Habitat Int. 152:103172. doi: 10.1016/j.habitatint.2024.103172
Wang, Q., Yu, H., Zhong, L. S., and Wang, H. (2023). Optimising the relationship between ecological protection and human development through functional zoning. Biol. Conserv. 281:110001. doi: 10.1016/j.biocon.2023.110001
Wei, H. K. (2022). China's rural development in the 14th five-year plan period. China Econ. 17, 2–11. doi: 10.19602/j.chinaeconomist.2022.01.01
Wichelns, D. (2017). The water-energy-food nexus: is the increasing attention warranted, from either a research or policy perspective? Environ. Sci. Pol. 69, 113–123.
Wu, F. F., Yang, X. H., Lian, B., Wang, Y., and Kang, J. (2023). Suitability evaluation of human settlements using a global sensitivity analysis method: a case study in China. Sustainability 15:4380. doi: 10.3390/su15054380
Xian, J. L., Xia, C. Q., and Cao, S. X. (2020). Cost-benefit analysis for China's grain for green program. Ecol. Eng. 151:105850. doi: 10.1016/j.ecoleng.2020.105850
Xie, S. H., Zhang, J. Z., Li, X. J., Xia, X. L., and Chen, Z. (2024). The effect of agricultural insurance participation on rural households' economic resilience to natural disasters: evidence from China. J. Clean. Prod. 434:140123. doi: 10.1016/j.jclepro.2023.140123
Xiong, Y. L., Lin, Y. C., Zhang, S. H., Xing, T. Y., and Wen, X. W. (2025). Digital literacy and food consumption structure: evidence from rural China. Nutrients 17:2207. doi: 10.3390/nu17132207
Xu, D. D., Chen, M. X., and Li, R. S. (2025). How high-standard farmland construction can affect farmers' grain cultivation behavior: evidence from rural China. Habitat Int. 160:103384. doi: 10.1016/j.habitatint.2025.103384
Xu, F., Shao, Y. P., Xu, B. G., Li, H., Xie, X. F., Xu, Y., et al. (2023). Evaluation and zoning of cultivated land quality based on a space–function–environment. Land 12:174. doi: 10.3390/land12010174
Xu, J., Xiao, Y., Xie, G. D., and Jiang, Y. (2019). Ecosystem service flow insights into horizontal ecological compensation standards for water resource: a case study in Dongjiang Lake basin, China. Chin. Geogr. Sci. 29, 214–230. doi: 10.1007/s11769-019-1025-3
Yang, T., Zhou, K. L., and Zhang, C. (2022). Spatiotemporal patterns and influencing factors of green development efficiency in China's urban agglomerations. Sustain. Cities Soc. 85:104069. doi: 10.1016/j.scs.2022.104069
Yin, D. Y., Yu, H. C., Shi, Y. Y., Zhao, M. Y., Zhang, J., and Li, X. H. (2023). Matching supply and demand for ecosystem services in the Yellow River Basin, China: a perspective of the water-energy-food nexus. J. Clean. Prod. 384:135469. doi: 10.1016/j.jclepro.2022.135469
Zeng, R., Abate, M. C., Cai, B. Z., Addis, A. K., and Dereso, Y. D. (2025). A systematic review of contemporary challenges and debates on Chinese food security: integrating priorities, trade-offs, and policy pathways. Foods 14:1057. doi: 10.3390/foods14061057
Zhang, C. Y., and Oki, T. (2023). Water pricing reform for sustainable water resources management in China’s agricultural sector. Agric. Water Manag. 275:108045. doi: 10.1016/j.agwat.2022.108045
Zhang, L., Pang, J. P., Chen, X. P., and Lu, Z. M. N. (2019). Carbon emissions, energy consumption and economic growth: evidence from the agricultural sector of China's main grain-producing areas. Sci. Total Environ. 665, 1017–1025. doi: 10.1016/j.scitotenv.2019.02.162
Zhang, X. Y., Wang, Y., Bao, J., Wei, T. D., and Xu, S. W. (2022). A research on the evaluation of China’s food security under the perspective of sustainable development—based on an entropy weight TOPSIS model. Agriculture 12:1926. doi: 10.3390/agriculture12111926
Zhao, M. X., Liu, Y. Y., Wang, Y., Chen, Y., and Ding, W. F. (2022). Effectiveness assessment of reservoir projects for flash flood control, water supply and irrigation in Wangmo Basin, China. Sci. Total Environ. 851:157918. doi: 10.1016/j.scitotenv.2022.157918
Keywords: factors analysis, food security, functional zoning, guarantee capacity, water-energy-food-ecology
Citation: Wei K, Zhang F, Nie Y, Lou C and Guan X (2025) Assessing China’s food security functional zoning for the water-energy-food-ecology system. Front. Sustain. Food Syst. 9:1662844. doi: 10.3389/fsufs.2025.1662844
Edited by:
Abdellatif Boutagayout, Moulay Ismail University, MoroccoReviewed by:
Rafael G. Araújo, Autonomous University of Coahuila, MexicoZiqiang Li, Huazhong Agricultural University, China
Atman Adiba, National Institute for Agricultural Research (Morocco), Morocco
Copyright © 2025 Wei, Zhang, Nie, Lou and Guan. This is an open-access article distributed under the terms of the Creative Commons Attribution License (CC BY). The use, distribution or reproduction in other forums is permitted, provided the original author(s) and the copyright owner(s) are credited and that the original publication in this journal is cited, in accordance with accepted academic practice. No use, distribution or reproduction is permitted which does not comply with these terms.
*Correspondence: Xin Guan, Nzg1NTk3MzA3QHFxLmNvbQ==
†These authors have contributed equally to this work and share first authorship