 Marshall D. McDaniel
 Parvin Mohammadiarvejeh3†
- 1Department of Agronomy, Iowa State University, Ames, IA, United States
- 2DOE Center for Advanced Bioenergy and Bioproducts Innovation, ISU, Ames, IA, United States
- 3Department of Industrial and Manufacturing Systems Engineering, Iowa State University, Ames, IA, United States
- 4Digital Ag Innovation Lab, Iowa State University, Boone, IA, United States
Litter decomposition is a critical Earth process, recycling nutrients and setting a portion of plant tissue on a path toward soil organic matter. Despite this importance, we still lack a good understanding of local factors that regulate decomposition, especially in agroecosystems where management plays an outsized role. Using a narrow range of climate and soils, we buried 1,308 pre-manufactured “litter bags” of differing residue quality (i.e., green and rooibos tea leaves) in 109 plots across several management practices to (1) explore the local controls on decomposition in agroecosystems and (2) test the robustness of the Tea Bag Index (TBI). We found that management practices intended to increase soil ecosystem services, that is, soil health, altered the decomposition of both teas. For example, adding nitrogen fertilizer and implementing perennial cropping decreased the extent of green tea decomposition (carbon-to-nitrogen ratio, or C:N = 12.8). No-tillage increased, but perennial cropping decreased, the rate of rooibos tea decomposition (C:N = 50.1). Cropped prairie accelerated green tea decomposition and increased the extent of red tea decomposition. A random forest regression model showed that soil temperature was the strongest predictor of green tea decomposition, but a soil health score also played a significant role in predicting the mass remaining. Soil texture and nutrient availability best predicted rooibos tea decomposition. Finer textured soils seemed to decelerate rooibos decomposition but increased the extent of decomposition. Furthermore, we demonstrated that the TBI metrics correlated somewhat well with empirically derived decomposition constants and were similarly sensitive to the effects of management. Still, the green tea stabilization factor had a substantial prediction bias. Our study increased our basic understanding of what regulates decomposition in agroecosystems. It also showed that the TBI can be a scientifically rigorous citizen science approach to monitoring changes in soil health.
1 Introduction
Litter decomposition is a critical function of ecosystems around the world. As a snapshot, approximately 286 petagrams (Pg), or 1015 grams, of carbon (C) and 13 Pg of nitrogen (N) are stored in global plant litter stocks (Potter and Klooster, 1997). This massive stock of decomposing plant material plays a vital role in terrestrial carbon (C) sequestration, regulating soil fertility, and providing habitat for biota (Jenkinson et al., 1991; Freschet et al., 2013). It is no wonder that researchers have spent decades decomposing litter in many environments and under a plethora of experimental conditions, all to better understand decomposition and improve predictions in biogeochemical models.
Currently, we know that litter decomposition is a function of three major factors: litter quality (usually expressed as C-to-N ratio), climate, and decomposer organisms (Swift et al., 1979; Bradford et al., 2016). Regional- to global-scale studies are critical toward improving our understanding of temperature and litter quality as primary drivers of decomposition (Parton et al., 2007; Adair et al., 2008; Bontti et al., 2009; Tuomi et al., 2009; Djukic et al., 2018; Ball et al., 2022); however, these large-scale studies miss the mark on more nuanced, local factors (< 1 km distances) that regulate decomposition where climate may be similar. Agroecosystems are a prime example, where farmer decision-making at the field-scale will change many regulating factors such as soil microclimate, legacy residue quality, nutrient availability, and decomposer organisms. How agroecosystem management affects decomposition has received less attention compared to natural ecosystem counterparts, despite the strong influence that management decisions have on litter (or residue) decomposition (Beare et al., 1992; Wickings et al., 2012; McDaniel et al., 2023).
Most decomposition studies, whether in natural or managed ecosystems, use the “litter bag” method to estimate a decomposition rate and study nutrient composition/release of remaining litter (Wider and Lang, 1982; Karberg et al., 2008). The litter bag method involves placing plant litter in a plastic mesh bag, deploying several “sacrificial samples” for removal at specific time intervals, and measuring the mass remaining at each time point. Many methodological variations will affect the final modeled decomposition rate and mass remaining, including time intervals of retrieval and total time of decomposition, decomposition model selection, changing the size of holes in the mesh, whether litter bags are buried or placed on the surface of the soil, and size and quality of the litter (Santos et al., 1984; Bradford et al., 2002; Karberg et al., 2008; Bokhorst and Wardle, 2013; Cornwell and Weedon, 2014). These decisions should be tailored to best answer specific research questions.
Although burying manufactured materials as common, decomposable substrates has been done for decades—cotton strips probably being the most familiar (Latter and Howson, 1977; Harrison et al., 1988)—a seminal 2013 study introduced new “pre-made” litter bags to the world. These researchers introduced the concept of decomposing tea bags of green (Camellia sinensis) and rooibos tea (Aspalathus linearis) to better understand what factors are regulating decomposition in soils (Keuskamp et al., 2013). Decomposing both teas of differing quality allowed for the calculation of a Tea Bag Index (TBI) that estimated the decomposition rate and a “stabilization” factor without the onerous task of deploying several sacrificial samples (Keuskamp et al., 2013; Sarneel et al., 2024). Both the pre-manufacture teas and TBI made measuring decomposition more accessible—even to citizen scientists. The TBI method was groundbreaking for improving our understanding of decomposition, as evidenced by the many studies following the original 2013 study (Houben et al., 2018; Petraglia et al., 2019; Duddigan et al., 2020a; Pino et al., 2021), even including some aquatic decomposition studies (Marley et al., 2019; Mori et al., 2023).
Agroecosystems are an excellent venue for using tea bags and the TBI method to better understand decomposition for a few reasons. First, agroecosystems are highly managed by humans, and the emerging soil health movement has increased interest in on-farm, citizen science monitoring after a change in management practice (Karlen et al., 2021). Indeed, decomposing tea, among other inexpensive and accessible materials (e.g., cotton and birch tong depressors), proved to be comparable in their ability to detect differences among soil health-promoting practices from long-term experiments in Iowa, USA (Middleton et al., 2021). Second, the two teas are at opposite ends of the residue quality spectrum, with green being “high” and similar to leguminous crop residue (C:N = 12–14) and rooibos being “low” and more similar to the chemical composition of high-N-demanding crop residues (C:N = 43–78) (Keuskamp et al., 2013; Marley et al., 2019; Duddigan et al., 2020b; Middleton et al., 2021). Finally, from a fundamental science perspective, agroecosystems are also ideal because it is the norm for plant residues to be mixed with disturbed soil. This is unlike many natural ecosystems, where it is atypical for aboveground plant material to get mixed with disturbed soil.
Given the importance of residue decomposition in agroecosystems, the intimate contact that residue has with agricultural soils, and our lack of understanding of local controls on decomposition, we set up a study decomposing green and rooibos teas across a variety of management practices in the USA Corn Belt. Notably, these management practices all occurred on similar soils and under a relatively identical climate. Our primary research questions were as follows:
1. Do the easy-to-deploy TBI decomposition metrics correlate with empirically measured decomposition metrics, and are management treatment effects consistent across both methods?
2. How do management practices alter empirically derived decomposition kinetics of both teas (green and rooibos)?
3. What are the overarching regulators, at a local scale, on decomposition of a high- and low-quality residue?
We predict that the TBI index (kTBI) estimated with just one 68-day mass loss measurement of both teas will correlate with observed decomposition rates measured the traditional way of using seven sacrificial samples. We hypothesized that increasing the soil health-promoting practices—minimizing disturbance, increasing plant inputs, increasing plant diversity, and adding animal manure—will increase decomposition rate (k) but especially of rooibos tea, which is poorer “quality” (i.e., lower C:N and more lignin) because of enhanced biological activity and increased labile resources in the soil matrix (McDaniel et al., 2014). To answer the third question, we measured 67 variables across nine long-term experiments and used a machine learning random forest regression (RFR) model to determine what soil and management properties best predict decomposition under similar climate and inherent soil conditions.
2 Materials and methods
2.1 Site characteristics and experimental design
We carried out this study in 2018 in Iowa, USA, at nine long-term agroecosystem experiments. Iowa has a humid continental climate with hot summers and cold winters. Soils under these nine long-term experiments were developed under glacial deposits and/or a loess cap. All soils were classified under the Mollisol soil order under the United States Department of Agriculture (USDA) classification (Soil Survey Staff, 2024). Basic soil properties (mean ± standard error) include: 29 ± 4% clay, 3.8 ± 0.9% soil organic matter, 6.6 ± 0.8 pH, and 24.3 ± 7.8 meq 100 g−1 cation exchange capacity. See Table 1 for more details on soil properties.
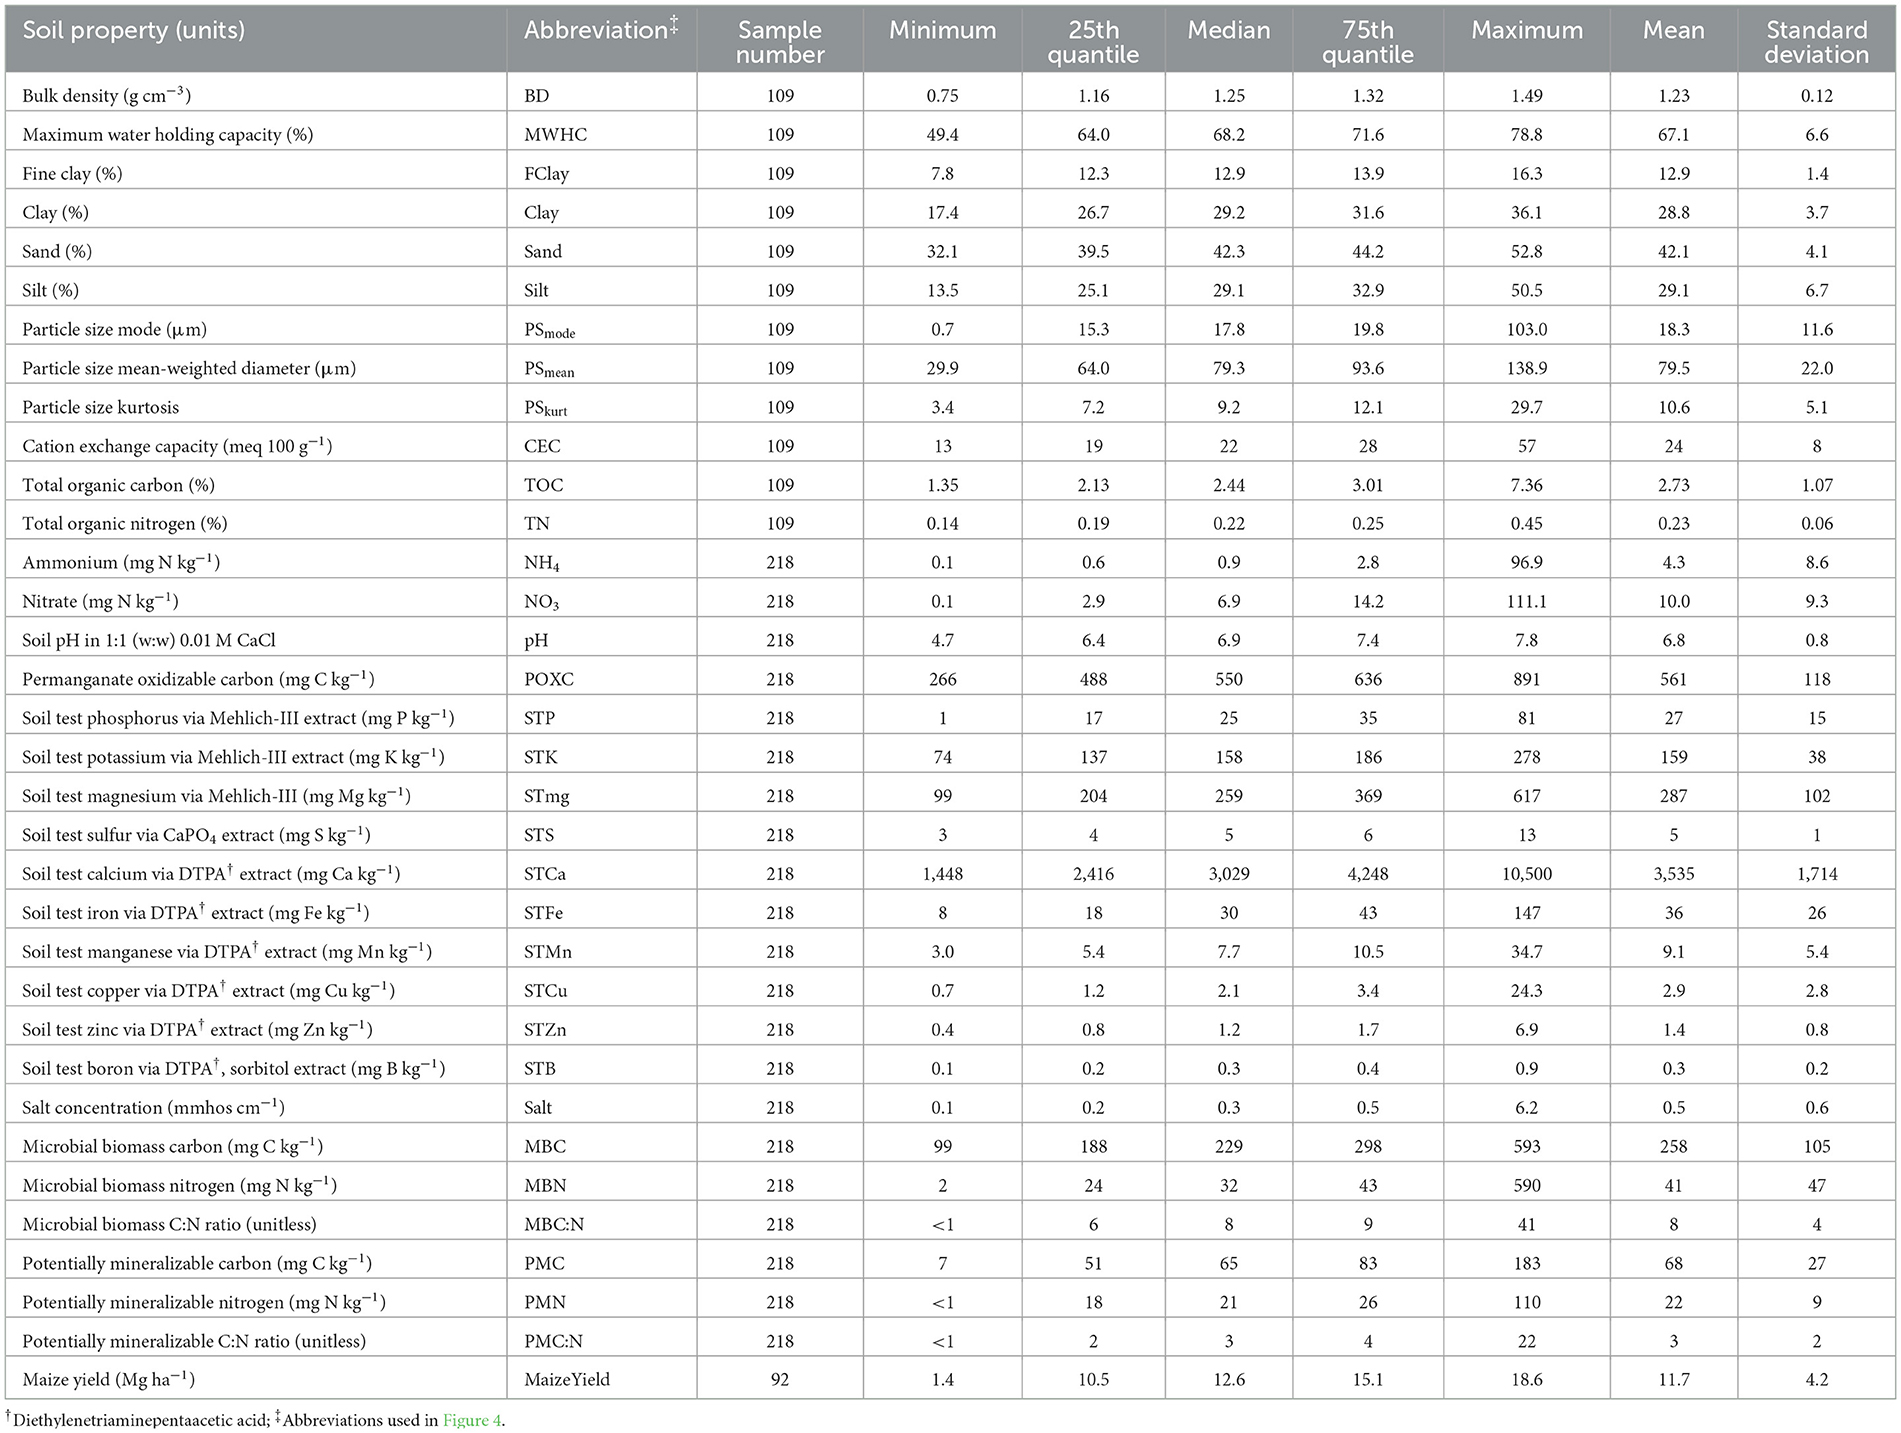
Table 1. Summary statistics of select soil properties and crop yield used as random forest regression predictor variables.
We grouped nine long-term experiments into categories based on eight management interventions (Table 2; Supplementary Table S1; Supplementary Figure S1). The nine long-term experiments making up these management interventions were all randomized complete block design experiments with three to six randomized, blocked replications (Supplementary Table S1). Most experiments had four replications, and in total, there were 109 individual plots. At the time we buried tea and sampled soils, these experiments were established at different times, ranging from three (Tejera et al., 2019) up to 20 years since establishment (Liebman et al., 2008). Soil properties and tea decomposition were both measured at the plot level.
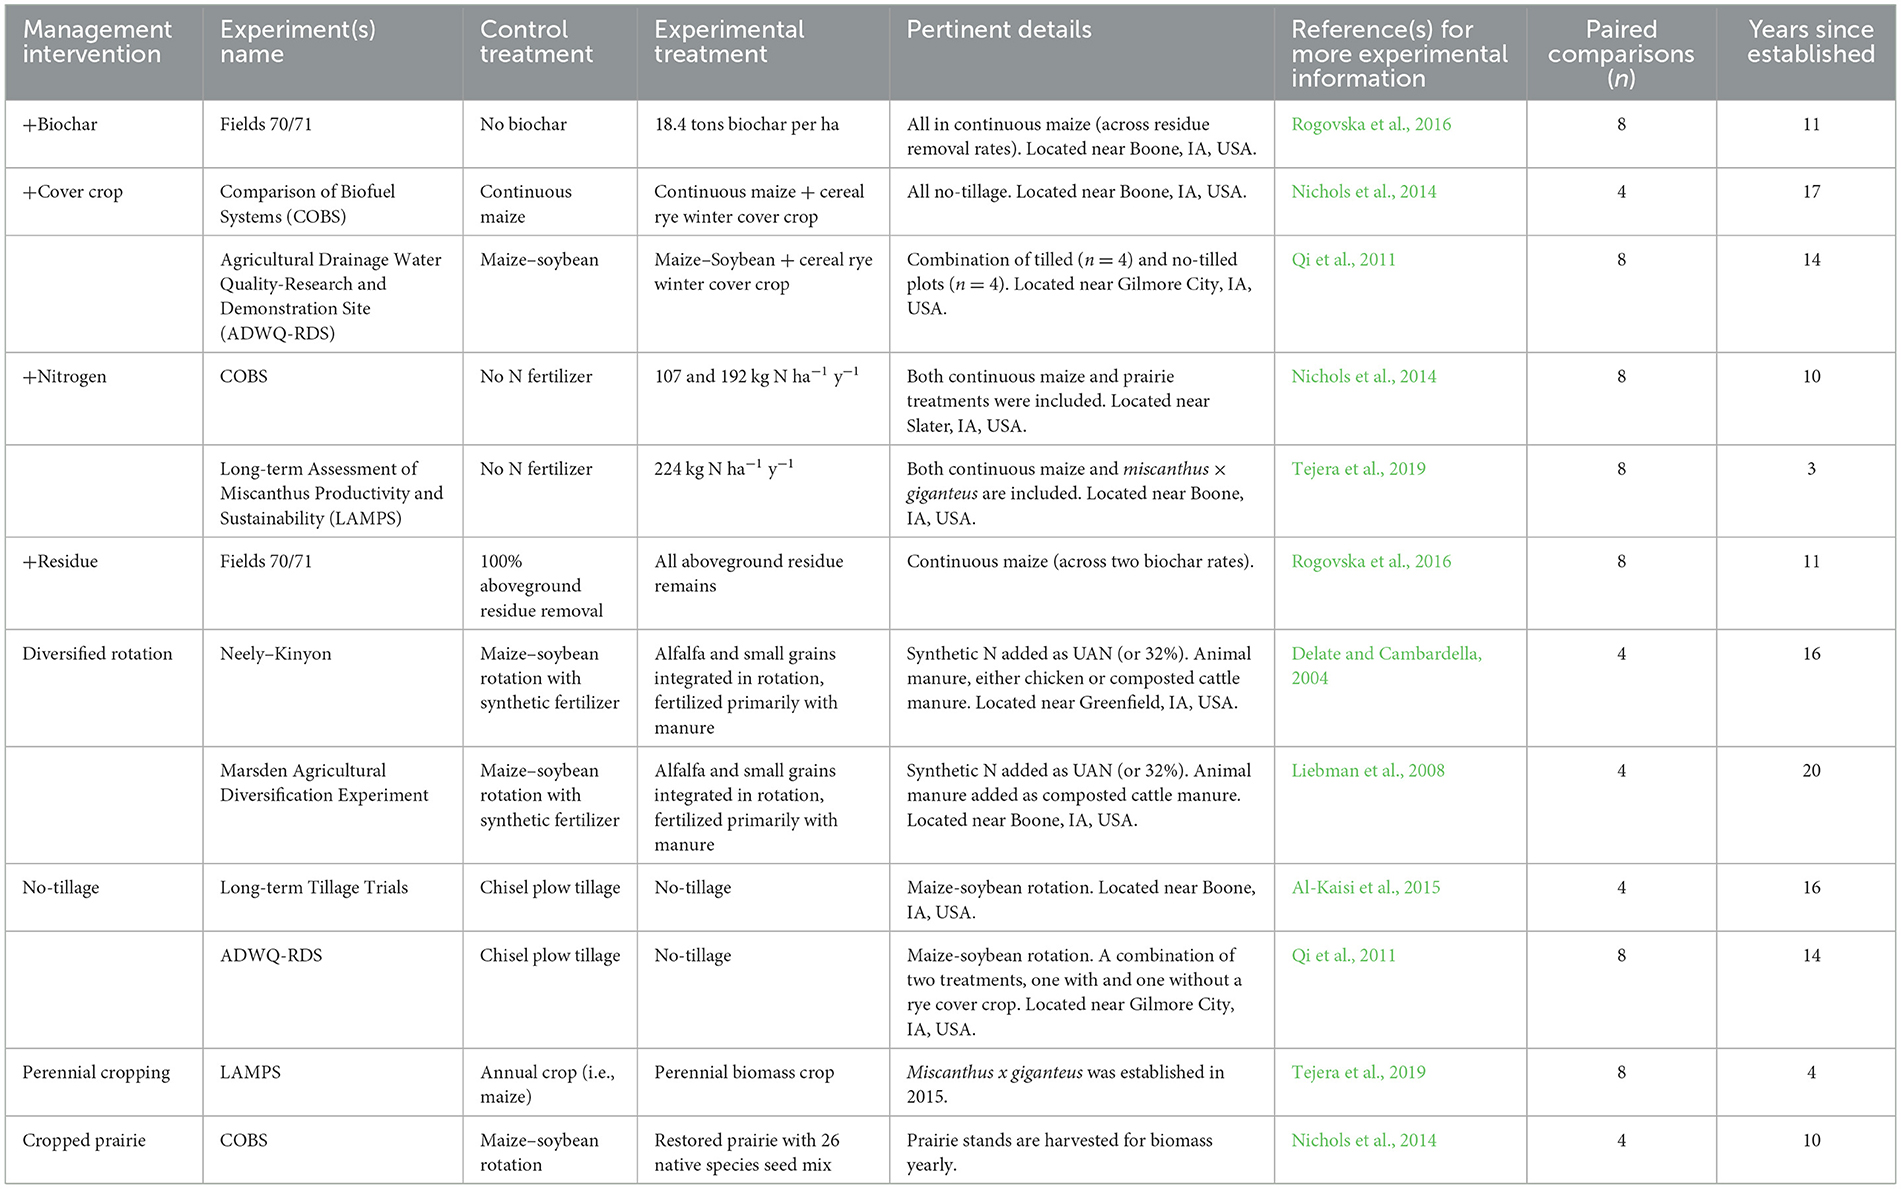
Table 2. Description of long-term agricultural experiments in Iowa, USA, used for management intervention contrasts.
A snapshot of how these management practices affect tea, birch tongue depressors, and cotton decomposition at isolated points in time was previously published in Middleton et al. (2021). Here, we focus on the decomposition dynamics of the tea only, including seven time points to model the decomposition rate and mass remaining. Most importantly, here, we explore mechanisms that regulate the decomposition of the two teas with machine learning.
2.2 Decomposition of green and rooibos teas
We measured mass loss of green (C. sinensis) and rooibos (A. linearis) tea leaves during the 2018 growing season (Supplementary Figure S2A). Chemical composition and moisture content of the off-the-shelf Lipton® teas were analyzed previously (Supplementary Table S2; Middleton et al., 2021), and confirmed similarity with other TBI studies (Keuskamp et al., 2013; Marley et al., 2019; Duddigan et al., 2020b).
The pre-manufactured tea bags (mesh = 0.25 mm) were reinforced with nylon string and labels with electrical tape to make them easier to find. We buried 756 tea bags to a depth of 8 cm in the soil after any spring tillage and/or spraying between 12 June and 20 July (Supplementary Figure S2). The tea bags were buried in the plot to get good coverage and randomly assigned a retrieval date. All tea bags were buried equidistant from the center of the crop row and the interrow to equally assess both more root-influenced and less root-influenced soils. In other words, for maize, which was the majority of plots, crops are 76 cm apart, and tea bags are buried of the distance (19 cm) in either direction.
The tea bags were retrieved at 4, 7 ± 1, 14 ± 1, 30 ± 2, 68 ± 2, and 130 ± 10 days after burial, depending on the weather conditions (Supplementary Figure S2). We used a trowel and a soil knife to gently excavate the tea bags from their location. Only 15 tea bags were lost out of all deployed, mostly due to wildlife damage. In the field, tea bags were placed in a Ziploc bag and stored in a cooler with icepacks. Back at the laboratory, tea bags were temporarily stored, 3–7 days, at 4 °C until processing to prevent further mass loss.
To process, we gently cleaned the soil off the tea bags. The entire tea bag was then dried in a forced air oven at 50 °C for 3 days to stabilize mass for storage until weighing. We weighed the tea bag and reinforcement materials, then gently cut them, and weighed the contents (the tea and any soil particle contamination) alone. The contents were transferred to a crucible and heated in a muffle furnace at 530 °C for 8 h to measure combustible organic material by subtracting the remaining ash content.
2.3 Soil and crop measurements
Soil temperature and moisture were measured within every plot during every site visit, from burial to final retrieval (n = 7 through time). Volumetric water content (VWC) was measured at 0–4.5 cm using an ML3 ThetaProbe Soil Moisture Sensor (Delta-T Devices; Cambridge, UK). Soil temperature was measured with a digital stem thermometer to a depth of 5 cm. We collected three measurements in close proximity to the tea bags per plot for a plot average at each sampling event.
We collected two soil samples from each plot—at burial and final tea bag retrieval (18 October to 20 November)—by compositing 10–15 soil cores (0–15 cm deep and 2 cm diameter). From here on, these two separate sampling events will be referred to as spring and autumn sampling, respectively. After collecting, soil samples were stored on ice until they could be transported to the laboratory, where they were refrigerated at 4 °C until they could be processed and analyzed. Soils were sieved fresh through a 2-mm sieve. Then, only a few analyses were conducted on fresh soils (e.g., microbial biomass, inorganic nitrogen, and gravimetric water content). The remainder of the analyses were conducted on soils that were air dried for 1 month at room temperature (~25 °C, Table 1).
Microbial biomass C and N (MBC and MBN) were analyzed using the chloroform-fumigation, extraction method with 5 g soil and 20 ml 0.5 M K2SO4 extractant [Vance et al., 1987; modified according to Middleton et al. (2021)]. Extracts were stored frozen at −20 °C until analysis. Extracts were analyzed for non-purgeable organic C and total N (TN) via combustion on a Shimadzu TOC-L analyzer with TN capabilities (Shimadzu Corporation, Kyoto, Japan). MBC and MBN were calculated by the differences between fumigated and non-fumigated samples and corrected by the extraction efficiency factors of 0.45 (MBC) and 0.54 (MBN) (Brookes et al., 1985; Joergensen, 1996). Soil inorganic nitrate () and ammonium () N were analyzed using colorimetric microplate methods with same non-chloroformed extracts using the vanadium (III) chloride method read at a wavelength of 540 nm (Doane and Horwáth, 2003), while used the cyanurate and salicylate method at 595 nm (Sinsabaugh et al., 2000), and both colorimetric reactions were measured on a Biotek SynergyHTXTM plate reader (BioTek Winooski, Vermont).
Other indicators of soil biological activity or labile pools of C and N were analyzed on air-dried soils. Permanganate oxidizable C (POXC) was measured using a modified method of Weil et al. (2003) with 2.5 g of soil and 18 ml of deionized (DI) water, as well as 2 ml of 0.2 M KMnO4, and the end reaction absorbance was measured on the microplate reader (Middleton et al., 2021). Potentially mineralizable C and N (PMC, PMN) were calculated by measuring carbon dioxide (CO2) and inorganic N produced during an incubation (Middleton et al., 2021). Briefly, 5 g of soil brought to 50% maximum water holding capacity (MWHC) was incubated in 50 ml conical centrifuge test tubes for 14 days, and in addition to nitrate and ammonium produced at the end of the incubation, we measured CO2 production in a test tube headspace on a LI-830 CO2 gas analyzer (LI-COR, Lincoln, NE) (sensu McDaniel and Grandy, 2016).
Dried soils were analyzed for bioavailable nutrients using extracts commonly used in agroecosystems for predicting plant-available nutrients. We assume that measuring these labile pools of macro/micronutrients will also reflect availability to soil microorganisms decomposing plant materials. Soil test phosphorus (STP), soil test potassium (STK), calcium (STCa), and magnesium (STMg) were all extracted using 2 g per 20 ml Mehlich-III extractant (Mehlich, 1984). Sulfur (STS) was extracted with 10 g of soil using 25 ml of monocalcium phosphate extractant (Combs et al., 1998). Soil test iron (STFe), manganese (STMn), zinc (STZn), copper (STCu), and boron (STB) were all measured using 10 g of soil to 20 ml of diethylenetriaminepentaacetic acid extractant, with sorbitol included in the STB extract to complex with B (Lindsay and Norvell, 1978; Miller et al., 2000). All bioavailable plant extracts were then analyzed on an ICP-OES 7300 (Perkin Elmer, Waltham, MA, USA) using calibration curves and check standards. Soil pH was measured using 0.01 M CaCl in a 1:1 (w:w) ratio with a HQ440D Hach pH meter with IntelliCAL PHC281 probe (Hach; Loveland, CO, USA).
We also analyzed dried soils for more slow-to-change variables such as soil texture, soil organic matter (SOM), MWHC, soil organic C (SOC), and total N (TN). Soil texture was analyzed using laser diffractometry (Miller and Schaetzl, 2012) with a Malvern Mastersizer 2000E laser particle size analyzer and a Hydro 2000MU pump accessory (Malvern Instruments Ltd., Worcestershire, UK). MWHC was measured using the “filter-funnel paper and drainage” method described by Nelson et al. (2023). Soil organic matter was measured using loss on ignition for 12 h at 450 °C. Soil samples were oven-dried, fumigated with HCl if pH >7.2, and rolled in tin and analyzed for SOC and TN on a Vario Max elemental analyzer (Elementar Americas, Inc., Ronkonkoma, NY, USA).
Maize yield was generally measured for the four center rows of each plot using combines equipped with yield monitors. At the Boyd Farm, plots were exceptionally small (5 rows) and required a 2-row combine. For the Sorenson Long-term Assessment of Miscanthus Productivity and Sustainability (LAMPS) experiment, maize yield was determined by hand harvest. Maize yields were adjusted to 155 g kg−1 moisture content and reported as Mg of grain per hectare.
2.4 Calculations
We used the three-parameter exponential decay model for modeling decomposition and calculating decomposition metrics in SigmaPlot v15 (Grafiti LLC; Palo Alto, CA). Decomposition metrics—rate (k), predicted final mass loss (Y0), and “initial mass” of decomposable material (a)—were calculated at the plot level to allow us to do statistics on these metrics. The equation is presented as follows:
where M(t) is the ash-free dry mass at any given day, Y0 is the predicted final mass remaining or asymptote of the exponential decay curve, a is the final mass loss from the initial of decomposable material when t = 0, k is the decomposition rate in % mass loss per day, and t is time measured in the unit of day.
We also calculated the TBI metrics using only the 68-day time point for all plots for comparison (Keuskamp et al., 2013). The TBI stabilization factor (STBI) is calculated as follows:
where ag is the decomposable fraction and Hg is the hydrolysable fraction of the green tea (Keuskamp et al., 2013). The STBI is similar to the mass remaining of the green tea, but is thus estimated from the hydrolysable fraction and the extent of decomposition. Accordingly, the TBI decomposition rate (kTBI) is calculated the same as Equation 1, but with 68-day mass remaining, and Y0 is estimated from the decomposable fraction of the rooibos tea.
To provide a cumulative measure of soil temperature and moisture, we used eight measurements at burial (0 days) to final retrieval (130 days). The area under the curve between measurements was used to create a 130-day cumulative temperature and soil moisture for each plot. For soil temperature, this ranged from 1,749 to 2,329 °C. For volumetric soil moisture, this ranged from 1.947 to 3.634 cm3 cm−3.
We used a novel index of the coverage or adoption of the USDA Natural Resources Conservation Service's (NRCS) five soil health principles—maximize presence of living roots, minimize disturbance, maximize soil cover, and maximize biodiversity—as a predictive factor in the RFR model. This novel index, called the Soil Health Principle Score (or SHPS), was calculated on a scale from 0 to 5 (Supplementary Table S3; McDaniel and Middleton, 2024).
2.5 Data handling and statistical analyses
Statistical analyses were conducted in R (version 4.3.1). Data were checked for normality and heterogeneity of variances using the ggResidpanel package (version 0.3.0). All data, before further processing, were checked for normality and heterogeneity of variances (Zuur et al., 2010). Outliers (>2 × standard deviation) were removed, and transformations were made to any non-conforming datasets. No transformations were needed, and fewer than five of our outlier values were removed per site. Data were visualized using SigmaPlot version 15.0 (Inpixon; Palo Alto, CA, USA).
We used a simple, one-way ANOVA using the aov function in R to determine differences in management practices on tea decomposition and set α = 0.1. For each management intervention or practice (Table 2), we compared the business-as-usual, or control treatment, vs. the experimental treatment. Management practices occurred at multiple sites, sometimes crossed with other management practices. For example, no-tillage and cereal rye cover crops were both individual but also combined factorially at the Gilmore City, IA experiment (Qi et al., 2011). The conventional tillage practice of disc tillage, both with and without cover crops, was aggregated with those disc tilled experiments near Boone, IA, USA, increasing the sample number for comparisons. This is reasonable for sites that had the same or similar soil series (McDaniel and Middleton, 2024), and a somewhat narrow range of soil properties (Table 1).
To compare the applicability of TBI to agroecosystem soils and a wide range of management practices, we used TBI calculations from Keuskamp et al. (2013). The TBI allows greater citizen scientist involvement by making decomposition measurement easier and more accessible. Using TBI, one can calculate a decay rate (kTBI) and stabilization factor (STBI) using mass loss of green and rooibos teas at only one time point. We used a 68-day time point because the green tea mass remaining begins to plateau at 20–40 days at moderate temperatures (Keuskamp et al., 2013; Duddigan et al., 2020b). We used the cor function in R to analyze linear correlations, specifically examining the relationship between TBI and empirically derived values to determine the Pearson correlation coefficient and corresponding p-value. Bias was calculated by subtracting the predicted TBI value from the observed value, using a full decomposition curve. Relative bias was calculated by dividing the observed value by the predicted value and multiplying by 100.
Random forest regression is an ensemble learning algorithm that develops several individual regression trees with training and test datasets to provide an overall prediction using the average of their outcomes (Breiman, 2001, 2017). In this study, we used four RFR models to predict k and Y0 for green and rooibos teas individually using NumPy, Pandas, and Scikit-learn in Python. For each of these four models, the data included 110 observations and 67 predictor variables (Supplementary Table S4). We split the observations into 75% for the training set and 25% for the testing set. Then, the set of RFR hyperparameters was tuned using Bayesian Optimization in the training phase. The Bayesian function uses the training set to find the best hyperparameters for the RFR model. We minimized the MSE in the objective function. The number of iterations was set to 100, and we used five-fold cross-validation to estimate RFR's performance.
3 Results
3.1 Soil microclimate and predictor variables
Compared to the past 50 years of precipitation at these sites in Iowa, 2018 was on the wetter end. For example, in 2018, precipitation ranged from 1,033 to 1,328 mm across all sites compared to the 50-year mean annual rainfall of 850–900 mm (+15 to +56%; Mesonet, 2024). Soil temperature and moisture varied over the length of the experiment (Supplementary Figure S2). Soil temperature ranged from 0.0 to 32.3 °C, with a low at the end of November and a peak in late June. The soil temperature mean ± standard deviation was 20.4 ± 5.3 °C. Soil volumetric water content ranged from 0.045 to 0.479 cm3 cm−3 with a low at the end of July and a peak in early July. The VWC mean ± standard deviation was 0.261 ± 0.090 cm3 cm−3.
Some soil properties varied greatly even though this study was conducted in a narrow geographic range (Table 1). There were some soil properties with CVs greater than 100% (e.g., ammonium, soil pH, and microbial biomass N), while other soil properties did not vary as much with CVs less than 25% (e.g., clay content, pH, STS, and STK). The treatment effects on select soil properties can be found in Middleton et al. (2021). Briefly, restored prairie had the greatest effect on MBC both in spring and autumn, increasing it by 116 and 104%, respectively, compared to annual cropping systems on average. Interestingly, adding more crop residue decreased PMC (−33%), POXC (−13%), and MBN (−23%) during the spring only, possibly because the increased crop residues cooled the soil. There were some other, smaller, inconsistent treatment effects on soil properties (Middleton et al., 2021).
3.2 Decomposition dynamics measured empirically and Tea Bag Index values
Decomposition rates varied across soils, but green tea decomposed much more quickly than rooibos tea and reached a more discernible plateau across all treatments during our 130-day study (Figure 1; Table 3). Green tea decomposed at a mean rate of 0.19% d−1 and reached Y0 of 24%. Rooibos tea, on the other hand, decomposed at a mean rate of 0.028% d−1 and Y0 of 53%. Green tea was better predicted by the three-parameter, exponential decay model (Equation 1) with a range in R2 from 0.87 to 1.00 (mean R2 = 0.96), which compares to rooibos tea that had an R2 range from 0.63 to 0.99 (mean R2 = 0.90; Table 3).
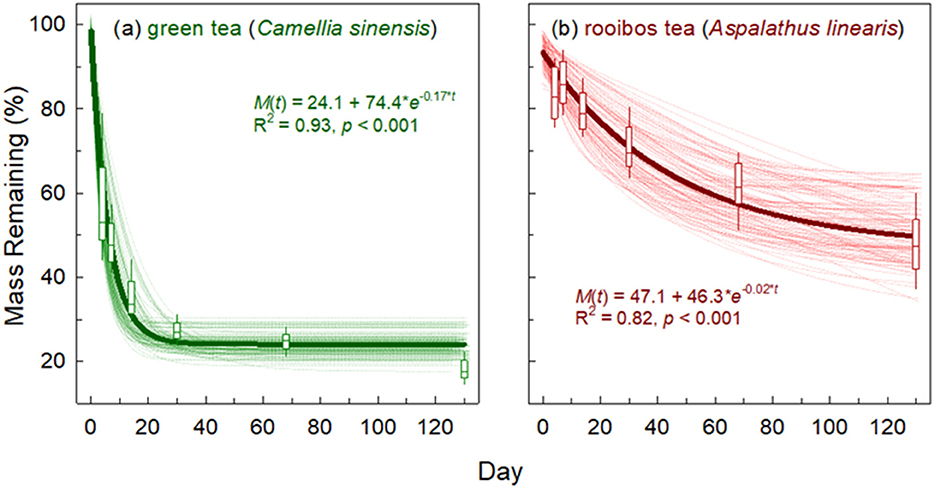
Figure 1. Individual, plot-level decomposition curves and mass loss values for (a) green tea (Camellia sinensis) and (b) rooibos tea (Aspalathus linearis). A total of n = 109 for individual decomposition curves and boxplots. Boxplots show 90th, 75th, 50th (median), 25th, and 10th percentiles. The thicker, dark line is that of the global model through all plot-level data.
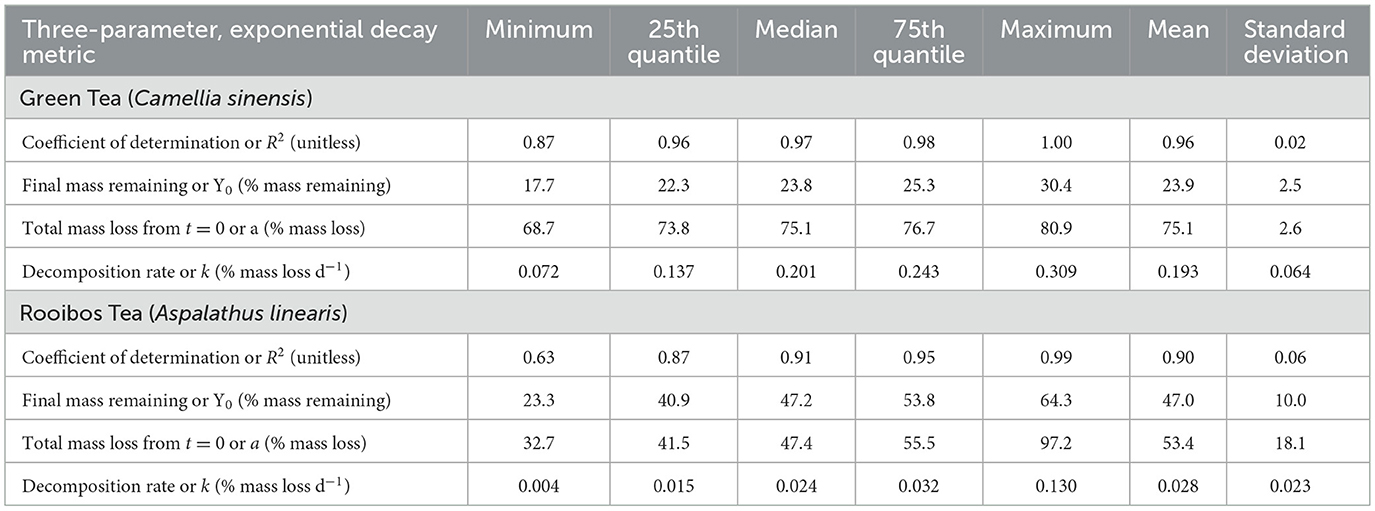
Table 3. Summary statistics of green and rooibos tea decomposition.
Due to interest in using the TBI as an easy and more accessible way to monitor management effects on decomposition, we correlated modeled coefficients (from Equation 1) to the kTBI and STBI at 68 days (Figure 2). The STBI is supposed to predict the asymptote, or Y0, of the green tea and did correlate (r = 0.65), but there was a systematic bias of −13% with measured Y0 (Figure 2A, −56% relative bias). The kTBI is supposed to predict the decomposition rate of the rooibos tea. This correlation with rooibos k was closer to 1:1, albeit weaker than STBI, but smaller relative bias (Figure 2B, 25% relative bias).
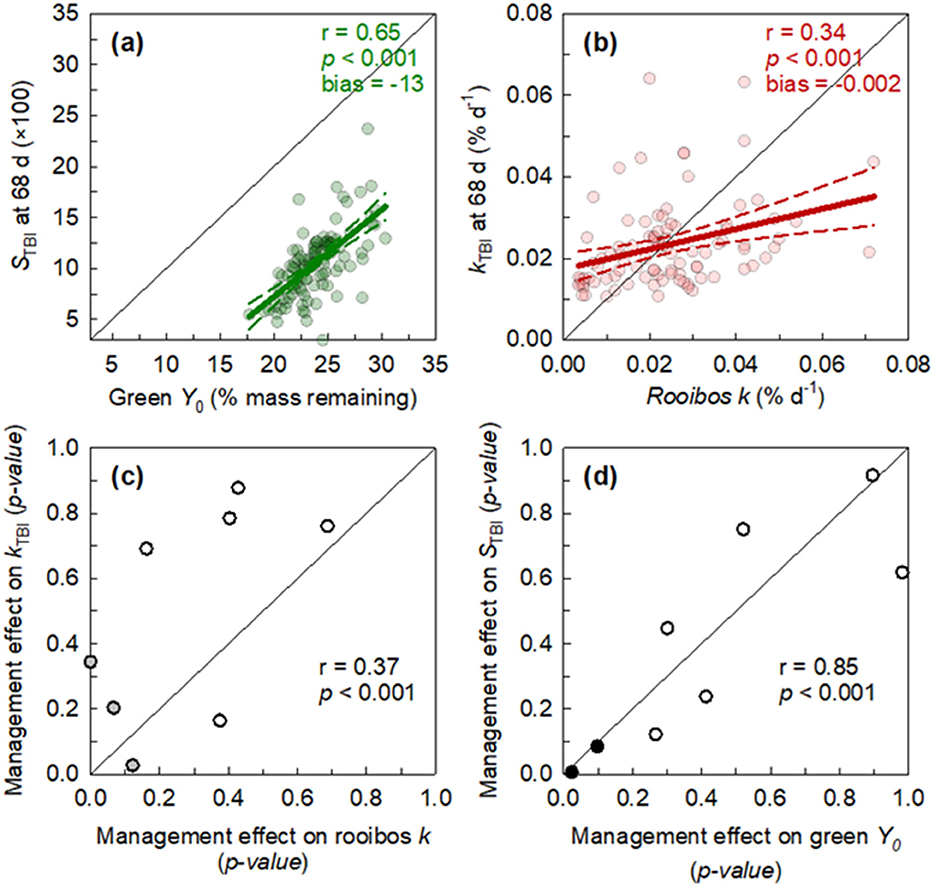
Figure 2. Correlation between 3-parameter, exponential decay model constants and Tea Bag Index (TBI) metrics from one timepoint (68 d). (a) Green tea final mass remaining (Y0) correlated with Tea Bag Index stabilization factor (STBi) multiplied by 100. (b) Rooibos tea decomposition rates (k) correlated with that estimated from TBI (kTBV). Correlation of p-values from one-way ANOVAs across management practices between (c) kTBi and k and (d) Y0 and STBi (see Table 2 for management interventions). Data points are color coded where white for both metrics are insignificant (p-value >0.1), gray when one of the two is significant, and black for when both are significant. Pearson correlation coefficients (r), p-value, and 1:1 line are shown.
Management had little effect on individual treatment contrasts at an α < 0.1 (Figure 3; Supplementary Table S5). There were some exceptions for particular management practices and decomposition metrics. Adding synthetic N fertilizer, for example, slightly increased green Y0 by 7% compared to conventional tilled soils (p < 0.001). Adding perennial plants—like perennial cropping and restoring prairie—strongly altered decomposition dynamics (Figure 3; Supplementary Table S5). Perennial cropping with miscanthus × giganteus both lowered green and rooibos k (−24 and −27%) and also increased green Y0 (+11%) compared to annual crops (p < 0.067). Restoring native prairie both increased green k (+31%) and decreased rooibos Y0 (−19%) compared to annual cropping (p < 0.071). By far, the strongest treatment effect was no-tillage (based on magnitude), which increased rooibos k by 75% compared to conventional tilled soils (p < 0.001).
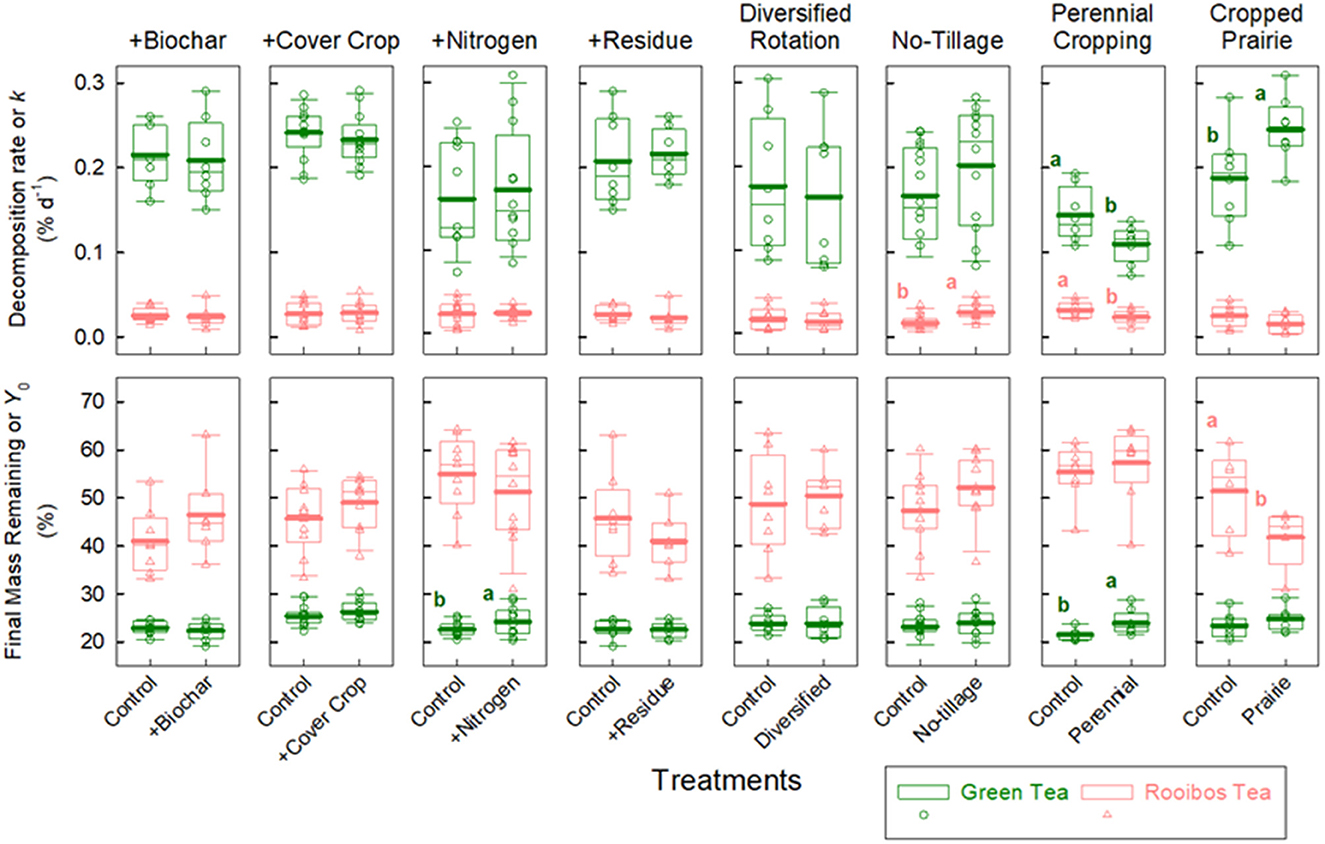
Figure 3. Comparing management interventions on green and rooibos tea decomposition metrics. Lower-case letters indicate significant treatment differences between treatment and control via one-way ANOVA (See Supplementary Table S6 for more details on ANOVA).
To further examine the utility of the TBI, from the aspect of detecting treatment effects, we compared the management effect on empirically derived decomposition metrics (k and Y0) with those derived from TBI (kTBI and STBI; Figures 2C, D; Supplementary Table S6). The one-way ANOVA p-values from both methods correlated relatively well (r > 0.37), especially between the green Y0 and STBI (r = 0.85; Figure 2D). However, there was some inconsistency on which management intervention had significant treatment effects on both empirically and TBI-derived metrics (Supplementary Tables S5, S6).
3.3 Predicting tea decomposition with random forest regression
Using RFR, we were able to predict decomposition metrics moderately well (Supplementary Table S7). The lower root mean squared error (RMSE) for green tea indicates that, on the whole, it was better predicted with our 67 variables than rooibos, both in the training and test datasets. We chose to highlight the top 10 predictor variables for both teas' k and Y0 (Figure 4). Generally speaking, for the dynamic soil properties, more autumn measurements ended up on the top 10 list compared to spring. Temperature was a strong predictor of green tea decomposition, but barely made the top 10 list for rooibos tea. Maize yields showed up on all four variables' top 10 lists—indicating the factors regulating maize yield may also regulate decomposition. Particle size features—clay, fine clay (FClay), particle size kurtosis (PSkurt), mean particle size (PSmean), particle size mode (PSmode), sand—were much more important in predicting rooibos tea decomposition compared to green tea.
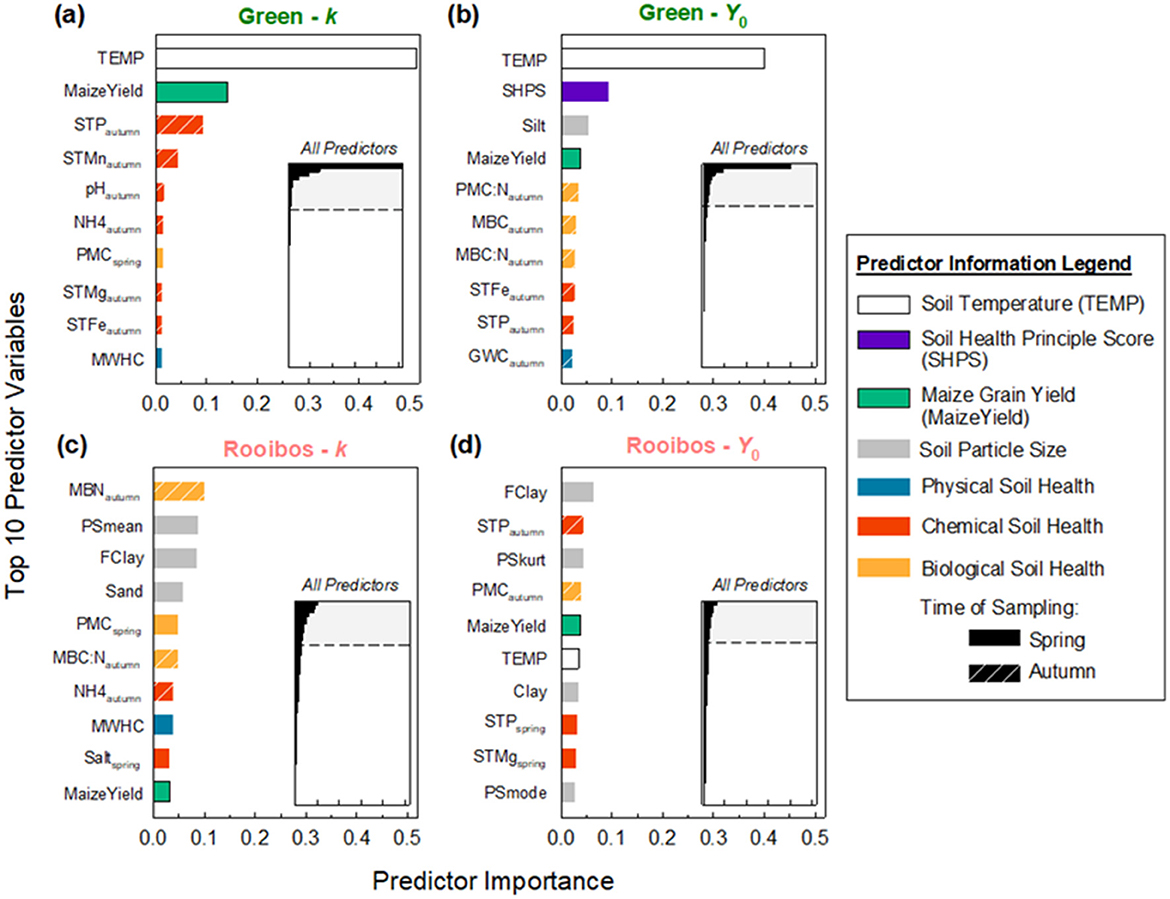
Figure 4. Random forest regression predictor importance for variables regulating green and rooibos tea decomposition. Top 10 predictors and their relative importance are shown for: (a) green tea decomposition rate (k), (b) green tea final, modeled mass remaining (Y0), (c) rooibos tea k, and (d) rooibos tea Y0. Inset graphs show distribution of top 10 (shaded region) relative importance within entire 67 predictors.
We explored the top five predictors in further depth with partial dependency plots to evaluate their relationship with decomposition metrics (Figure 5). Soil temperature was the first and strongest predictor of green k and Y0, with a positive relationship between the variables. In other words, greater temperatures increase both the decomposition rate and the amount remaining at 130 days. Maize yield also positively correlated with green k and Y0, and was the second and fourth predictors, respectively. Interestingly, the combined index for soil health principles (SHPS) was the second-best predictor of green Y0, with a positive relationship, indicating that the more soil health principles included in the management, the greater the mass remaining of the rapidly decomposing tea.
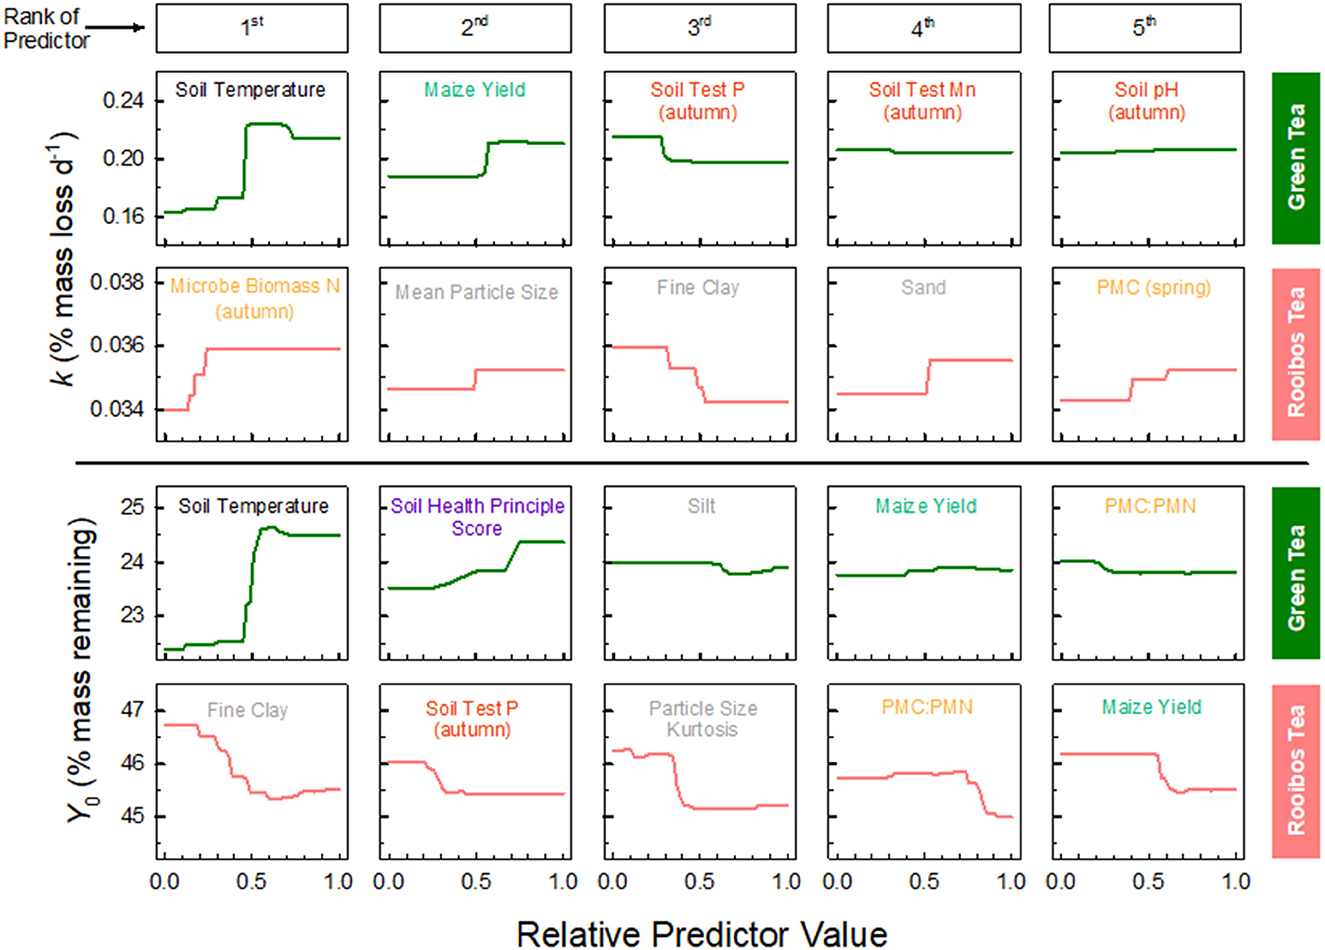
Figure 5. Partial dependency of green and rooibos tea decomposition and top five predictor variables from random forest regression models (from Figure 4). Relative predictor value is in normalized units with raw predicted decomposition rate (k) and final, modeled mass remaining (Y0) for each tea. Predictor variables are color coded according to Figure 4 legend.
Rooibos tea decomposition was strongly predicted by particle size, but some other interesting variables emerged from the RFR and partial dependence plot (Figure 5). Microbial biomass N, collected in the autumn, was the first predictor of rooibos k, indicating that more microbial biomass predicts greater rooibos tea decomposition. Smaller particle sizes tended to predict decreased rooibos k, and vice versa for large particle sizes and mean particle size in general. Fine clay was the first predictor of rooibos Y0, with negative correlation or dependence, indicating that an increase in fine clays decreases the final % mass remaining within the timeframe of our study (< 1 year).
4 Discussion
We used a variety of agroecosystem management practices, while controlling for climate, to elicit localized effects on decomposition of common substrates (well-characterized teas in this case). The accessibility of these common substrates can also facilitate citizen scientists' engagement in monitoring changes in decomposition that may occur after a shift in agroecosystem management. This engagement by farmers, as citizen scientists, can help bolster a soil health movement intent on managing agroecosystems to maximize multiple ecosystem services (Cooper et al., 2007; Grudens-Schuck and Sirajuddin, 2019; Karlen et al., 2021). The following sub-sections will answer our three research questions.
4.1 Does the Tea Bag Index correlate with empirically measured decomposition metrics?
The TBI is a tool for community scientists to derive an index of decomposition by measuring mass loss at just one time point (Keuskamp et al., 2013). It requires using both a high- and low-quality substrate, green and rooibos teas, respectively, and has been used in dozens of studies (Petraglia et al., 2019; Duddigan et al., 2020a; Dossou-Yovo et al., 2021; Pino et al., 2021; Mori, 2022a). Using the original nylon mesh Lipton® tea bags, we found good evidence that the kTBI and STBI do correlate well with three out of four empirically measured decomposition metrics with six time points (Figure 2). The correlations were stronger with green tea, but the decomposition rates were closer to the actual value for rooibos tea (Figure 2B). Furthermore, and maybe most importantly for community science monitoring of soil biological activity after management change, the management practices we tested had similar effects on both empirically measured and TBI-estimated decomposition metrics (Figure 2; Supplementary Tables S6, S7).
The TBI approach, while accounting for substrate quality by using two substrates pre-packaged in Lipton® tea bags, provides an index of decomposition rate and stabilization that can be easily measured at global scales (Keuskamp et al., 2013; Sarneel et al., 2024). However, unfortunately, in 2016, Lipton® changed its tea bags from a 0.25-mm nylon mesh to a non-uniform < 0.2 mm polypropylene mesh that is also more decomposable. This change has hindered the use of the TBI approach, as the new “non-woven” tea bag materials are not as feasible for calculating kTBI or STBI (Mori, 2022a). There are alternative tea brands, however, that still use uniform nylon mesh tea bags that could be used by citizen scientists. These new teas need to be rigorously tested as the original green and red Lipton® teas. This raises the question of whether a TBI is necessary for assessing agroecosystem management in terms of decomposition.
In addition to challenges getting the woven mesh, there has been recent criticism of the TBI method and assumptions (Mori, 2022b, 2025). Future studies should focus on robust measurements of decomposition that are still easy and accessible, allowing engagement by citizen scientists. For example, researchers recently used a simple decomposition ratio that was sensitive to management practices in Canada, similar to the TBI metrics (Hayes et al., 2024). Alternatively, citizen scientists could simply monitor management effects on mass loss after a given duration of any, or a few, common pre-packaged substrates (i.e., teas, tongue depressors, or cotton strips). The “soil your undies” campaign, which involves decomposing bleached cotton underwear, is a good example and has the added benefit of being humorous.
4.2 Do soil health-promoting practices consistently alter decomposition kinetics?
While not consistent across management practices, there was some evidence for management altering decomposition (Figure 3). Duddigan et al. (2020a), using the same TBI approach with 511 samples within the UK, found that adding soil amendments greatly increased kTBI, so much so that it overrode any geographical (i.e., soil and climate) effects. We did not find as strong effects of management on decomposition, even with our soil amendment practices (+Biochar and +Nitrogen). However, some salient management effects on decomposition were apparent in our study.
First, adding N fertilizer increased green Y0 by 7% (Figure 3), or decreased green tea mass loss. Because green tea has greater N content and a narrow C:N of ~13 (Supplementary Table S2), it is a rapidly available net source of N for soil microbes. One might reasonably expect this finding, and that adding supplemental fertilizer N could alleviate N demand and thus slow decomposition of this high-quality residue. But this generalization is complicated by previous findings. A meta-analysis on mostly forest litter showed that the effect of supplemental N on decomposition depended on both the rate and litter quality (Knorr et al., 2005). Overall, according to this meta-analysis, adding N can stimulate decomposition of high-quality residues but inhibit decomposition of low-quality residues (a finding opposite to ours). However, when the meta-analysis results were split into three N fertilizer rate categories (< 75, 75–125, and >125), the low and high N rates (< 75, >125) had inhibitory effects on decomposition regardless of litter quality. More than 50% of our research plots received N rates in these two categories, but even those plots that received some in the intermediate category were close to these somewhat arbitrary cut-offs. In agroecosystems, researchers have also found mixed results with fertilizer N inputs inhibiting decomposition (Le Guillou et al., 2011), some finding no effect (Grandy et al., 2013), and others finding that both management and residue quality are key determinants of regulating decomposition (McDaniel et al., 2014). These studies collectively illustrate that the rate and source of N fertilizer, the quality of residue, and other management factors will all regulate whether and to what extent decomposition is affected by N fertilizer.
Second, we found that no-tillage increased rooibos k by 75% compared to conventional tillage, and this was the largest magnitude of a management effect that we observed (Figure 3). This was also the only management practice that confirmed our hypothesis that soil health-promoting practices would increase the decomposition of poorer quality litter (i.e., rooibos tea). Although no-tillage has been shown to alter soil microclimatic conditions, namely increasing soil moisture and decreasing temperature (Licht and Al-Kaisi, 2005; Potter et al., 1985), it is not likely a factor explaining increased decomposition since neither microclimatic variable emerged to predict rooibos decomposition (Figure 4). Instead, other mechanisms may explain the strong effect of increasing the decomposition rate of this relatively low-quality tea.
Perhaps the most parsimonious explanation is the positive effects of no-tillage on soil microbiota, as documented in a meta-analysis (Zuber and Villamil, 2016), and their indirect effect on the decomposition of more-difficult-to-decompose substrates. In other words, enhanced microbial biomass and activity in the no-tilled soils increased rooibos k. To add additional evidence for this hypothesis, microbial biomass N was the best predictor of rooibos k (Figure 5). However, the direct effects of no-tillage on either soil microbial biomass or potential mineralization were not as strong. We found that no-tillage generally increases these measures of soil biological activity, but the difference is not statistically significant (Middleton et al., 2021). It could be that one-way ANOVAs are a blunt tool that is not as sensitive to measuring decomposition and using RFR to tease apart treatment effects.
Third, and finally, perennializing agroecosystems altered the decomposition of both substrates in interesting and countervailing ways. Using perennial crops, for example, miscanthus × giganteus, for just 3 years decreased green and rooibos k, and also increased green Y0 (Figure 3). In contrast, 10 years of cropping native prairie biomass had opposite effects on the teas—increasing green k but decreasing rooibos Y0. Both perennial cropping and restored prairie treatments have year-round cover; however, we lack a clear explanation for the interesting, unexpected, and opposing effects observed between the two practices. Perhaps it may be due to differences in the effects of these perennial plantings on either soil microclimate via plant–water demand, C, and nutrient cycling, or both (Daigh et al., 2014; Ye and Hall, 2020; Studt et al., 2021). These divergent effects on decomposition may be ultimately due to the inherent differences in rooting structure, morphology, phenology, and even diversity under miscanthus and prairie.
A mature stand of miscanthus can decrease soil temperatures by 16% on average during the growing season, but has a variable impact on water content, sometimes increasing and decreasing depending on the time of year (Studt et al., 2021). The decrease in both tea's decomposition rate, and perhaps an increase in green Y0, is likely due to the perennial crops' effect on soil microclimate. However, miscanthus does also alter other soil properties that may further explain our findings—like increasing proportion of amino compounds (Khaleel, 2023), increasing water holding capacity (Studt, 2019), and generally improving efficiency of N cycling compared to annual crops (Davis et al., 2013; Smith et al., 2013; Studt et al., 2021). Native, perennial prairie, in contrast, increased green k and decreased Y0. Previous studies from this site show that restored prairie increased soil microbial biomass and altered extracellular enzyme activities depending on the N fertilizer rate (Bach and Hofmockel, 2015; Middleton et al., 2021).
4.3 What are the overarching regulators, at a local scale, on decomposition of high- and low-quality residue?
By isolating local factors from broader factors, such as climate and litter quality, we can improve our mechanistic understanding of what regulates decomposition. While we showed that some management practices affect decomposition, it does not provide mechanistic explanations to the previous question—do soil health-promoting practices consistently alter decomposition kinetics? This is why we chose to also use RFR with our large data set to better tease apart mechanisms within and across management practices in this relatively localized network of long-term experiments in Iowa, USA.
Despite this study's local approach, we still found soil temperature, or at least the cumulative thermal units, to be the primary driver in green tea decomposition (Figure 4). The magnitude of this first predictor's importance was 3.6 × and 4.3 × greater than that of the second-best predictors for green k and Y0, respectively; and greater soil temperatures increased both green k and Y0 (Figure 5). This upholds the primacy of temperature in driving decomposition rate, at least for this high-quality, narrow-C:N litter. We think there are local, unaccounted-for factors affecting soil temperature that are not entirely explained by our one-way ANOVA or RF approaches. This could range from something as subtle as farm-level nuances in residue management, differences in maize hybrids—varying in canopy closure speed, or even nearby tree lines acting as windbreaks. In contrast to strong control on green tea, temperature barely made an appearance in regulating rooibos tea decomposition (Figure 4). The reason soil moisture may not have played an important factor is that 2018 was one of the wetter years in recent Iowa history across all sites (Mesonet, 2024).
It is quite remarkable that soil particle size played such a strong role in rooibos tea decomposition. All particle size predictors pointed to decreased k and Y0 when rooibos tea is buried in soils with finer particles (Figure 5). Or in other words, more clayey soils tend to decrease the rate but increase the extent of rooibos tea decomposition. This contrasts with results from a recent multi-site investigation of cover crop residue decomposition in agroecosystems, where researchers found that finer textured soils increased k (Thapa et al., 2022). The authors attributed this effect to finer textured soils being wetter and accelerating cover crop residue decomposition in these potentially water-limited site-years. Our substrates were decomposed while buried in heavier textured soil (mean clay content 28.8% vs. 16.5%), instead of litter bags placed on the soil surface, and decomposing in a less water-limited year for Iowa. Supporting these differences, an incubation experiment tested this question of buried vs. incorporated residues, and showed diverging trends in decomposition between surface and incorporated residues (Scott et al., 1996).
This intriguing finding of smaller particle sizes slowing the rate, but increasing the extent, of rooibos tea decomposition may be indicative of the widely accepted trend of finer textured soils having greater SOM (Burke et al., 1989; Plante et al., 2006; Grandy et al., 2009). Soils with smaller particles (i.e., more reactive surfaces) will have greater contact with low-quality residue, providing more reactive surfaces for efficient decomposition and greater SOM stabilization capacity (Kleber et al., 2007; Poeplau et al., 2015). It has also been shown that soil texture relates to SOM quality, and that finer textured soils have a greater relative abundance of N-bearing compounds (Grandy et al., 2009) and “biochemically protected” C (Plante et al., 2006). Our results demonstrate the value in using a large, local decomposition study—combined with RFR—to connect decomposition (early stages of SOM formation) to important soil processes like long-term C accrual.
Soil health-promoting practices regulate decomposition in both direct and indirect ways. The second best predictor of green Y0, second only to soil temperature, was the SHPS derived from the NRCS principles of soil health (USDA-NRCS, 2023; McDaniel and Middleton, 2024). The greater adoption of principles like reducing disturbance (e.g., no-till), increasing cover (e.g., residue), diversifying (e.g., manure input and extended rotations), and extending the length of plant from annual crops (e.g., perennial crops or prairie) increased green Y0. This also highlights and connects our findings with applications for citizen science in agroecosystems. If, for example, growers wanted to track soil improvements from adopting soil health-promoting practices, then they may want to monitor the final mass of green tea. Due to Y0 and STBI being so strongly correlated, as well as the treatment effect measured empirically and with STBI (Figure 2), it may be sufficient to use TBI to monitor changes in soil health. Thus, the TBI appears to be an inexpensive approach to monitor changes in soil health (Figure 3), further inform growers of changes in their soil, and expand the soil health movement.
5 Conclusion
We used multiple long-term experiments within relatively narrow environmental conditions to tease apart more local regulators driving decomposition of common substrates. Our use of “pre-packaged,” common substrates (i.e., manufactured nylon tea bags) made monitoring decomposition more accessible in these highly managed agroecosystems, and we were able to confirm the scientific robustness of the Tea Bag Index approach for monitoring changes in management practices. This is good news for farmers who want to measure changes in soil biological activity due to a management intervention.
From a basic science perspective, we found that management practices do affect decomposition and not always in explainable or predictable ways. While the decomposition paradigm suggests that climate and residue quality are the ultimate regulators of decomposition, we show that more local factors, such as soil particle size, microbial biomass nitrogen, crop yield, bioavailable nutrients, and management practices, can also predict decomposition. These findings expand our knowledge of the regulators of decomposition, especially in agroecosystems, and are critical to improving our basic understanding of decomposition. Measuring and modeling decomposition can help inform ways to manage agroecosystems to be more environmentally sustainable and climate-smart.
Data availability statement
The raw data supporting the conclusions of this article will be made available by the authors, without undue reservation. The data are also available at Iowa State University DataShare or at https://doi.org/10.25380/iastate.30104761.
Author contributions
MM: Conceptualization, Data curation, Formal analysis, Funding acquisition, Investigation, Methodology, Project administration, Resources, Supervision, Visualization, Writing – original draft, Writing – review & editing. PM: Conceptualization, Methodology, Software, Validation, Writing – original draft, Writing – review & editing. GH: Conceptualization, Investigation, Methodology, Project administration, Supervision, Writing – review & editing. TM: Data curation, Formal analysis, Investigation, Methodology, Resources, Validation, Writing – original draft, Writing – review & editing.
Funding
The author(s) declare that financial support was received for the research and/or publication of this article. This study was funded by the DOE Center for Advanced Bioenergy and Bioproducts Innovation (U.S. Department of Energy, Office of Science, Biological and Environmental Research Program under Award Number DE-SC0018420). Any opinions, findings, and conclusions or recommendations expressed in this publication are those of the author(s) and do not necessarily reflect the views of the U.S. Department of Energy. This study is further supported by the USDA National Institute of Food and Agriculture, Hatch Multistate project 7000755. We would also like to thank the Leopold Center for Sustainable Agriculture and Iowa Nutrient Research Center for funding this research (grant number: E2017-10).
Acknowledgments
We extend a special thanks to Iowa Learning Farms, the Practical Farmers of Iowa, and the Iowa Soybean Association, along with their cooperator farmers, for allowing us to access and sample their fields and assist in data collection. We would like to thank members of the McDaniel Lab who helped with collecting and analyzing soils and decomposing household substrates. Finally, we would like to thank Ala Khaleel, Cole Dutter, Hyeonji Song, Jared Flater, and Toby Adjuik for valuable feedback on earlier drafts of this manuscript.
Conflict of interest
The authors declare that the research was conducted in the absence of any commercial or financial relationships that could be construed as a potential conflict of interest.
Generative AI statement
The author(s) declare that no Gen AI was used in the creation of this manuscript.
Any alternative text (alt text) provided alongside figures in this article has been generated by Frontiers with the support of artificial intelligence and reasonable efforts have been made to ensure accuracy, including review by the authors wherever possible. If you identify any issues, please contact us.
Publisher's note
All claims expressed in this article are solely those of the authors and do not necessarily represent those of their affiliated organizations, or those of the publisher, the editors and the reviewers. Any product that may be evaluated in this article, or claim that may be made by its manufacturer, is not guaranteed or endorsed by the publisher.
Supplementary material
The Supplementary Material for this article can be found online at: https://www.frontiersin.org/articles/10.3389/fsufs.2025.1665233/full#supplementary-material
References
Adair, E. C., Parton, W. J., Del Grosso, S. J., Silver, W. L., Harmon, M. E., Hall, S. A., et al. (2008). Simple three-pool model accurately describes patterns of long-term litter decomposition in diverse climates. Glob. Chang. Biol. 14, 2636–2660. doi: 10.1111/j.1365-2486.2008.01674.x
Al-Kaisi, M. M., Archontoulis, S. V., Kwaw-Mensah, D., and Miguez, F. (2015). Tillage and crop rotation effects on corn agronomic response and economic return at seven Iowa locations. Agron. J. 107, 1411–1424. doi: 10.2134/agronj14.0470
Bach, E. M., and Hofmockel, K. S. (2015). Coupled carbon and nitrogen inputs increase microbial biomass and activity in prairie bioenergy systems. Ecosystems. 18, 417–427. doi: 10.1007/s10021-014-9835-8
Ball, B. A., Christenson, L. M., and Wickings, K. G. (2022). A cross-system analysis of litter chemical dynamics throughout decomposition. Ecosystems 25, 1792–1808. doi: 10.1007/s10021-022-00749-6
Beare, M. H., Parmelee, R. W., Hendrix, P. F., Cheng, W., Coleman, D. C., Crossley Jr, D. A., et al. (1992). Microbial and faunal interactions and effects on litter nitrogen and decomposition in agroecosystems. Ecol. Monogr. 62, 569–591. doi: 10.2307/2937317
Bokhorst, S., and Wardle, D. A. (2013). Microclimate within litter bags of different mesh size: Implications for the “arthropod effect” on litter decomposition. Soil Biol. Biochem. 58, 147–152. doi: 10.1016/j.soilbio.2012.12.001
Bontti, E. E., Decant, J. P., Munson, S. M., Gathany, M. A., Przeszlowska, A., Haddix, M. L., et al. (2009). Litter decomposition in grasslands of central North America (US Great Plains). Glob. Chang. Biol. 15, 1356–1363. doi: 10.1111/j.1365-2486.2008.01815.x
Bradford, M. A., Berg, B., Maynard, D. S., Wieder, W. R., and Wood, S. A. (2016). Understanding the dominant controls on litter decomposition. J. Ecol. 104, 229–238. doi: 10.1111/1365-2745.12507
Bradford, M. A., Tordoff, G. M., Eggers, T., Jones, T. H., and Newington, J. E. (2002). Microbiota, fauna, and mesh size interactions in litter decomposition. Oikos 99, 317–323. doi: 10.1034/j.1600-0706.2002.990212.x
Brookes, P. C., Landman, A., Pruden, G., and Jenkinson, D. S. (1985). Chloroform fumigation and the release of soil nitrogen: a rapid direct extraction method to measure microbial biomass nitrogen in soil. Soil Biol. Biochem. 17, 837–842. doi: 10.1016/0038-0717(85)90144-0
Burke, I. C., Yonker, C. M., Parton, W. J., Cole, C. V., Schimel, D. S., Flach, K., et al. (1989). Texture, climate, and cultivation effects on soil organic matter content in US grassland soils. Soil Sci. Soc. Am. J. 53, 800–805. doi: 10.2136/sssaj1989.03615995005300030029x
Combs, S. M., Denning, J. L., and Frank, K. D. (1998). “Sulfate-sulfur,” in Recommended Chemical Soil Test Procedures for the North Central Region (Columbia, MO: Missouri Agricultural Experiment Station, University of Missouri-Columbia.), 35–40.
Cooper, C. B., Dickinson, J., Phillips, T., and Bonney, R. (2007). Citizen science as a tool for conservation in residential ecosystems. Ecol. Soc. 12:11. doi: 10.5751/ES-02197-120211
Cornwell, W. K., and Weedon, J. T. (2014). Decomposition trajectories of diverse litter types: a model selection analysis. Methods Ecol. Evol. 5, 173–182. doi: 10.1111/2041-210X.12138
Daigh, A. L., Zhou, X., Helmers, M. J., Pederson, C. H., Ewing, R., Horton, R., et al. (2014). Subsurface drainage flow and soil water dynamics of reconstructed prairies and corn rotations for biofuel production. Vadose Zone J. 13:vzj2013-10. doi: 10.2136/vzj2013.10.0177
Davis, M. P., David, M. B., and Mitchell, C. A. (2013). Nitrogen mineralization in soils used for biofuel crops. Commun. Soil Sci. Plant Anal. 44, 987–995. doi: 10.1080/00103624.2012.747607
Delate, K., and Cambardella, C. A. (2004). Agroecosystem performance during transition to certified organic grain production. Agron. J. 96, 1288–1298. doi: 10.2134/agronj2004.1288
Djukic, I., Kepfer-Rojas, S., Schmidt, I. K., Larsen, K. S., Beier, C., Berg, B., et al. (2018). Early stage litter decomposition across biomes. Sci. Total Env. 628, 1369–1394. doi: 10.1016/j.scitotenv.2018.01.012
Doane, T. A., and Horwáth, W. R. (2003). Spectrophotometric determination of nitrate with a single reagent. Anal. Lett. 36, 2713–2722. doi: 10.1081/AL-120024647
Dossou-Yovo, W., Parent, S-. É., Ziadi, N., Parent, É., and Parent, L-. É. (2021). Tea bag index to assess carbon decomposition rate in cranberry agroecosystems. Soil Syst. 5:44. doi: 10.3390/soilsystems5030044
Duddigan, S., Alexander, P. D., Shaw, L. J., Sandén, T., and Collins, C. D. (2020a). The Tea Bag Index—UK: Using Citizen/Community Science to Investigate Organic Matter Decomposition Rates in Domestic Gardens. Sustainability 12:6895. doi: 10.3390/su12176895
Duddigan, S., Shaw, L. J., Alexander, P. D., and Collins, C. D. (2020b). Chemical underpinning of the tea bag index: an examination of the decomposition of tea leaves. Appl. Environ. Soil Sci. 2020:6085180. doi: 10.1155/2020/6085180
Freschet, G. T., Cornwell, W. K., Wardle, D. A., Elumeeva, T. G., Liu, W., Jackson, B. G., et al. (2013). Linking litter decomposition of above-and below-ground organs to plant–soil feedbacks worldwide. J. Ecol. 101, 943–952. doi: 10.1111/1365-2745.12092
Grandy, A. S., Salam, D. S., Wickings, K., McDaniel, M. D., Culman, S. W., Snapp, S. S., et al. (2013). Soil respiration and litter decomposition responses to nitrogen fertilization rate in no-till corn systems. Agricult. Ecosyst. Environ. 179, 35–40. doi: 10.1016/j.agee.2013.04.020
Grandy, A. S., Strickland, M. S., Lauber, C. L., Bradford, M. A., and Fierer, N. (2009). The influence of microbial communities, management, and soil texture on soil organic matter chemistry. Geoderma 150, 278–286. doi: 10.1016/j.geoderma.2009.02.007
Grudens-Schuck, N., and Sirajuddin, Z. (2019). Social impacts of citizen science water monitoring programs. J. Soil Water Conserv. 74, 49A−54A. doi: 10.2489/jswc.74.3.49A
Harrison, A. F., Latter, P. M., and Walton, D. W. H. (1988). Cotton Strip Assay: An Index of Decomposition in Soils. Huntingdon: ITE.
Hayes, E. B., Norris, C. E., and Volpe, J. P. (2024). A field assessment to validate the assumptions of the Tea Bag Index (TBI) as a measure of soil health. Appl. Soil Ecol. 195:105256. doi: 10.1016/j.apsoil.2023.105256
Houben, D., Faucon, M-. P., and Mercadal, A-. M. (2018). Response of organic matter decomposition to no-tillage adoption evaluated by the tea bag technique. Soil Syst. 2:42. doi: 10.3390/soilsystems2030042
Jenkinson, D. S., Adams, D. E., and Wild, A. (1991). Model estimates of CO2 emissions from soil in response to global warming. Nature 351, 304–306. doi: 10.1038/351304a0
Joergensen, R. G. (1996). The fumigation-extraction method to estimate soil microbial biomass: calibration of the kEC value. Soil Biol. Biochem. 28, 25–31. doi: 10.1016/0038-0717(95)00102-6
Karberg, N. J., Scott, N. A., and Giardina, C. P. (2008). “Methods for estimating litter decomposition,” in Field Measurements for Forest Carbon Monitoring: A Landscape-Scale Approach (Berlin: Springer), 103–111.
Karlen, D. L., De, M., McDaniel, M. D., and Stott, D. E. (2021). “Evolution of the soil health movement,” in Soil Health. Madison, WI: Soil Science Society of America. doi: 10.1002/9780891189817.ch2
Keuskamp, J. A., Dingemans, B. J. J., Lehtinen, T., Sarneel, J. M., and Hefting, M. M. (2013). Tea Bag Index: a novel approach to collect uniform decomposition data across ecosystems. Methods Ecol. Evol. 4, 1070–1075. doi: 10.1111/2041-210X.12097
Khaleel, A. (2023). Potential enzyme activities in soils as affected by perennial cropping and nitrogen rates in central Iowa (Ph.D. Dissertation). Iowa State University. doi: 10.31274/td-20240617-206
Kleber, M., Sollins, P., and Sutton, R. (2007). A conceptual model of organo-mineral interactions in soils: self-assembly of organic molecular fragments into zonal structures on mineral surfaces. Biogeochemistry 85, 9–24. doi: 10.1007/s10533-007-9103-5
Knorr, M., Frey, S., and Curtis, P. (2005). Nitrogen additions and litter decomposition : a meta-analysis. Ecology 86, 3252–3257. doi: 10.1890/05-0150
Latter, P. M., and Howson, G. (1977). The use of cotton strips to indicate cellulose decomposition in the field. Pedobiologia 17, 145–155. doi: 10.1016/S0031-4056(23)00158-0
Le Guillou, C., Angers, D. A., Leterme, P., and Menasseri-Aubry, S. (2011). Differential and successive effects of residue quality and soil mineral N on water-stable aggregation during crop residue decomposition. Soil Biol. Biochem. 43, 1955–1960. doi: 10.1016/j.soilbio.2011.06.004
Licht, M. A., and Al-Kaisi, M. (2005). Strip-tillage effect on seedbed soil temperature and other soil physical properties. Soil Tillage Res. 80, 233–249. doi: 10.1016/j.still.2004.03.017
Liebman, M., Gibson, L. R., Sundberg, D. N., Heggenstaller, A. H., Westerman, P. R., Chase, C. A., et al. (2008). Agronomic and economic performance characteristics of conventional and low-external-input cropping systems in the central Corn Belt. Agron. J. 100, 600–610. doi: 10.2134/agronj2007.0222
Lindsay, W. L., and Norvell, W. A. (1978). Development of a DTPA soil test for zinc, iron, manganese, and copper. Soil Sci. Soc. Am. J. 42, 421–428. doi: 10.2136/sssaj1978.03615995004200030009x
Marley, A. R. G., Smeaton, C., and Austin, W. E. N. (2019). An assessment of the tea bag index method as a proxy for organic matter decomposition in intertidal environments. J. Geophys. Res. Biogeosci. 124, 2991–3004. doi: 10.1029/2018JG004957
McDaniel, M. D., Bird, J. A., Pett-Ridge, J., Marin-Spiotta, E., Schmidt, T. M., and Grandy, A. S. (2023). Diversifying and perennializing plants in agroecosystems alters retention of new C and N from crop residues. Ecol. Appl. 33:e2784. doi: 10.1002/eap.2784
McDaniel, M. D., and Grandy, A. S. (2016). Soil microbial biomass and function are altered by 12 years of crop rotation. Soil Discuss. 3, 77–101. doi: 10.5194/soil-2016-39
McDaniel, M. D., Grandy, A. S., Tiemann, L. K., and Weintraub, M. N. (2014). Crop rotation complexity regulates the decomposition of high and low quality residues. Soil Biol. Biochem. 78, 243–254. doi: 10.1016/j.soilbio.2014.07.027
McDaniel, M. D., and Middleton, T. A. (2024). Putting the soil health principles to the test in Iowa. Soil Sci. Soc. Am. J. 88, 2238–2253. doi: 10.1002/saj2.20761
Mehlich, A. (1984). Mehlich 3 soil test extractant: a modification of Mehlich 2 extractant. Commun. Soil Sci. Plant Anal. 15, 1409–1416. doi: 10.1080/00103628409367568
Mesonet, I. (2024). ISU Mesonet - Iowa State University Iowa Environmental Mesonet Climate Data. Available online at: https://mesonet.agron.iastate.edu/ (Accessed September 5, 2025).
Middleton, T. E., McCombs, A. L., Gailans, S. R., Carlson, S., Karlen, D. L., Moore, K. J., et al. (2021). Assessing biological soil health through decomposition of inexpensive household items. Appl. Soil Ecol. 168, 104099. doi: 10.1016/j.apsoil.2021.104099
Miller, B. A., and Schaetzl, R. J. (2012). Precision of soil particle size analysis using laser diffractometry. Soil Sci. Soc. Am. J. 76, 1719–1727. doi: 10.2136/sssaj2011.0303
Miller, R. O., Vaughan, B., and Kutoby-Amacher, J. (2000). Extraction of soil boron with DTPA-sorbitol. Soil-Plant Anal. 4, 10–12.
Mori, T. (2022a). Can nonwoven tea bags be used to determine the tea bag index? Ecologies 3, 175–182. doi: 10.3390/ecologies3020014
Mori, T. (2022b). Validation of the Tea Bag Index as a standard approach for assessing organic matter decomposition. bioRxiv, 2022–2025. doi: 10.1101/2022.05.02.490129
Mori, T. (2025). Does extending the incubation period really improve the accuracy of the Tea Bag Index as a measure of soil health? Appl. Soil Ecol. 206:105837. doi: 10.1016/j.apsoil.2024.105837
Mori, T., Ono, K., and Sakai, Y. (2023). Testing the Tea Bag Index as a potential indicator for assessing litter decomposition in aquatic ecosystems. Ecol. Indic. 152:110358. doi: 10.1016/j.ecolind.2023.110358
Nelson, J. T., Adjuik, T. A., Moore, E. B., VanLoocke, A. D., Ramirez Reyes, A., McDaniel, M. D., et al. (2023). A simple, affordable, do-it-yourself method for measuring soil maximum water holding capacity. Commun. Soil Sci. Plant Anal. 54, 1–15. doi: 10.1080/00103624.2023.2296988
Nichols, V. A., Miguez, F. E., Jarchow, M. E., Liebman, M. Z., and Dien, B. S. (2014). Comparison of cellulosic ethanol yields from midwestern maize and reconstructed tallgrass prairie systems managed for bioenergy. Bioenergy Res. 7, 1550–1560. doi: 10.1007/s12155-014-9494-9
Parton, W., Silver, W. L., Burke, I. C., Grassens, L., Harmon, M. E., Currie, W. S., et al. (2007). Global-scale similarities in nitrogen release patterns during long-term decomposition. Science 315, 361–364. doi: 10.1126/science.1134853
Petraglia, A., Cacciatori, C., Chelli, S., Fenu, G., Calderisi, G., Gargano, D., et al. (2019). Litter decomposition: effects of temperature driven by soil moisture and vegetation type. Plant Soil 435, 187–200. doi: 10.1007/s11104-018-3889-x
Pino, V., McBratney, A., O'Brien, E., and Ng, W. (2021). Boosting soil citizen-science using Tea Bag Index method towards soil security in Australia. Soil Secur. 5:100016. doi: 10.1016/j.soisec.2021.100016
Plante, A. F., Conant, R. T., Stewart, C. E., Paustian, K., and Six, J. (2006). Impact of soil texture on the distribution of soil organic matter in physical and chemical fractions. Soil Sci. Soc. Am. J. 70, 287–296. doi: 10.2136/sssaj2004.0363
Poeplau, C., Kätterer, T., Bolinder, M. A., Börjesson, G., Berti, A., Lugato, E., et al. (2015). Low stabilization of aboveground crop residue carbon in sandy soils of Swedish long-term experiments. Geoderma 237, 246–255. doi: 10.1016/j.geoderma.2014.09.010
Potter, C. S., and Klooster, S. A. (1997). Global model estimates of carbon and nitrogen storage in litter and soil pools: response to changes in vegetation quality and biomass allocation. Tellus B 49, 1–17. doi: 10.3402/tellusb.v49i1.15947
Potter, K. N., Cruse, R. M., and Horton, R. (1985). Tillage effects on soil thermal properties. Soil Sci. Soc. Am. J. 49, 968–973. doi: 10.2136/sssaj1985.03615995004900040035x
Qi, Z., Helmers, M. J., Christianson, R. D., and Pederson, C. H. (2011). Nitrate-nitrogen losses through subsurface drainage under various agricultural land covers. J. Environ. Qual. 40, 1578–1585. doi: 10.2134/jeq2011.0151
Rogovska, N., Laird, D. A., and Karlen, D. L. (2016). Corn and soil response to biochar application and stover harvest. Field Crops Res. 187, 96–106. doi: 10.1016/j.fcr.2015.12.013
Santos, P. F., Elkins, N. Z., Steinberger, Y., and Whitford, W. G. (1984). A comparison of surface and buried Larrea tridentata leaf litter decomposition in North American hot deserts. Ecology 65, 278–284. doi: 10.2307/1939480
Sarneel, J. M., Hefting, M. M., Sandén, T., van den Hoogen, J., Routh, D., Adhikari, B. S., et al. (2024). Reading tea leaves worldwide: decoupled drivers of initial litter decomposition mass-loss rate and stabilization. Ecol. Lett. 27:e14415. doi: 10.1111/ele.14415
Scott, N. A., Cole, C. V., Elliott, E. T., and Huffman, S. A. (1996). Soil textural control on decomposition and soil organic matter dynamics. Soil Sci. Soc. Am. J. 60, 1102–1109. doi: 10.2136/sssaj1996.03615995006000040020x
Sinsabaugh, R. L., Reynolds, H., and Long, T. M. (2000). Rapid assay for amidohydrolase (urease) activity in environmental samples. Soil Biol. Biochem. 32, 2095–2097. doi: 10.1016/S0038-0717(00)00102-4
Smith, C. M., David, M. B., Mitchell, C. A., Masters, M. D., Anderson-Teixeira, K. J., Bernacchi, C. J., et al. (2013). Reduced nitrogen losses after conversion of row crop agriculture to perennial biofuel crops. J. Environ. Qual. 42, 219–228. doi: 10.2134/jeq2012.0210
Soil Survey Staff (2024). Web Soil Survey: Natural Resources Conservation Service, United States Department of Agriculture. Amsterdam: Elsevier.
Studt, J. E. (2019). Contrasting soil nitrogen dynamics under Zea mays and Miscanthus × giganteus: A story of complex interactions among site, establishment year, and nitrogen fertilization (Master of Science), Iowa State University, Ames, IA, United States.
Studt, J. E., McDaniel, M. D., Tejera, M. D., VanLoocke, A., Howe, A., Heaton, E. A., et al. (2021). Soil net nitrogen mineralization and leaching under Miscanthus × giganteus and Zea mays. GCB Bioenergy 13, 1545–1560. doi: 10.1111/gcbb.12875
Swift, M. J., Heal, O. W., Anderson, J. M., and Anderson, J. M. (1979). Decomposition in terrestrial ecosystems. Berkeley, CA: University of California Press.
Tejera, M., Boersma, N., Vanloocke, A., Archontoulis, S., Dixon, P., Miguez, F., et al. (2019). Multi-year and multi-site establishment of the perennial biomass crop miscanthus × giganteus using a staggered start design to elucidate N response. Bioenergy Res. 12, 471–483. doi: 10.1007/s12155-019-09985-6
Thapa, R., Tully, K. L., Reberg-Horton, C., Cabrera, M., Davis, B. W., Fleisher, D., et al. (2022). Cover crop residue decomposition in no-till cropping systems: Insights from multi-state on-farm litter bag studies. Agricult. Ecosyst. Environ. 326:107823. doi: 10.1016/j.agee.2021.107823
Tuomi, M., Thum, T., Järvinen, H., Fronzek, S., Berg, B., Harmon, M., et al. (2009). Leaf litter decomposition—Estimates of global variability based on Yasso07 model. Ecol. Modell. 220, 3362–3371. doi: 10.1016/j.ecolmodel.2009.05.016
USDA-NRCS (2023). Soil Health. Available online at: https://www.nrcs.usda.gov/conservation-basics/natural-resource-concerns/soils/soil-health (Retrieved September 6, 2025).
Vance, E. D., Brookes, P. C., and Jenkinson, D. S. (1987). An extraction method for measuring soil microbial biomass C. Soil Biol. Biochem. 19, 703–707. doi: 10.1016/0038-0717(87)90052-6
Weil, R. R., Islam, K. R., Stine, M. a., Gruver, J. B., and Samson-Liebig, S. E. (2003). Estimating active carbon for soil quality assessment: a simplified method for laboratory and field use. Am. J. Altern. Agricult. 18, 3–17. doi: 10.1079/AJAA200228
Wickings, K., Grandy, A. S., Reed, S. C., and Cleveland, C. C. (2012). The origin of litter chemical complexity during decomposition. Ecol. Lett. 15, 1180–1188. doi: 10.1111/j.1461-0248.2012.01837.x
Wider, R. K., and Lang, G. E. (1982). A critique of the analytical methods used in examining decomposition data obtained from litter bags. Ecology 63, 1636–1642. doi: 10.2307/1940104
Ye, C., and Hall, S. J. (2020). Mechanisms underlying limited soil carbon gains in perennial and cover-cropped bioenergy systems revealed by stable isotopes. GCB Bioenergy 12, 101–117. doi: 10.1111/gcbb.12657
Zuber, S. M., and Villamil, M. B. (2016). Meta-analysis approach to assess effect of tillage on microbial biomass and enzyme activities. Soil Biol. Biochem. 97, 176–187. doi: 10.1016/j.soilbio.2016.03.011
Keywords: machine learning, nutrient cycling, regenerative agriculture, random forest regression, soil organic carbon, Tea Bag Index (TBI)
Citation: McDaniel MD, Mohammadiarvejeh P, Hu G and Middleton TE (2025) What regulates decomposition in agroecosystems? Insights from reading the tea leaves. Front. Sustain. Food Syst. 9:1665233. doi: 10.3389/fsufs.2025.1665233
Received: 13 July 2025; Accepted: 01 September 2025;
Published: 14 October 2025.
Edited by:
Liming Ye, Ghent University, BelgiumReviewed by:
Sarah Nanyiti, National Crops Resources Research Institute (NaCRRI), UgandaRichard Coe, World Agroforestry Centre, Kenya
Copyright © 2025 McDaniel, Mohammadiarvejeh, Hu and Middleton. This is an open-access article distributed under the terms of the Creative Commons Attribution License (CC BY). The use, distribution or reproduction in other forums is permitted, provided the original author(s) and the copyright owner(s) are credited and that the original publication in this journal is cited, in accordance with accepted academic practice. No use, distribution or reproduction is permitted which does not comply with these terms.
*Correspondence: Marshall D. McDaniel, bWFyc2hAaWFzdGF0ZS5lZHU=
†ORCID: Marshall D. McDaniel orcid.org/0000-0001-6267-7293
Parvin Mohammadiarvejeh orcid.org/0009-0004-3294-3115
Guiping Hu orcid.org/0000-0001-8392-8442
Teresa E. Middleton orcid.org/0000-0002-5036-5417