 Abbey L. Whitney1
 Kristina M. Chomiak1,2
 Callie W. Babbitt2
 Nathan C. Eddingsaas3
 Anna Christina Tyler1*
- 1Thomas H. Gosnell School of Life Sciences, Rochester Institute of Technology, Rochester, NY, United States
- 2Golisano Institute for Sustainability, Rochester Institute of Technology, Rochester, NY, United States
- 3School of Chemistry and Materials Science, Rochester Institute of Technology, Rochester, NY, United States
Microplastics (MP) are an emerging contaminant in organic waste recycling, yet their occurrence and fate in anaerobic digestion (AD) systems remain poorly understood due to challenges in isolating MP from complex matrices. This study developed and validated a novel extraction method using peroxide oxidation and an EDTA–Triton X-100 solution that achieved >96% recovery without polymer degradation. This method was applied to characterize MP in manure, digester effluent (digestate), and lagoon storage at a full-scale food waste–manure co-digestion facility. MP were consistently detected across all sources, with concentrations ranging from 120 MP kg−1 (manure) to >3,300 MP kg−1 (lagoon). Abundance was highly variable over time, shaped by feedstock composition and digester management practices. The MP observed likely stemmed from multiple pathways, including food waste inputs, packaging residues, on-farm sources, atmospheric deposition, and fragmentation of larger plastics during digestion. Polyethylene terephthalate (PET) fibers dominated across all samples. These findings provide the first quantitative evidence of microplastic (MP) occurrence throughout the AD process and highlight how management decisions influence contamination. By advancing extraction methods and generating new field-scale data, this study establishes a foundation for assessing the risks of MP release from AD systems to agricultural soils and downstream ecosystems.
1 Introduction
Food waste is a growing sustainability challenge facing global food systems. An estimated 30–40% of food produced in the United States is never consumed (ReFED, 2023; US EPA, 2023a), equivalent to $218 billion annually in lost value (United Nations Environment Programme, 2021). In the United States, the majority of wasted food is ultimately discarded in landfills, leading to greenhouse gas emissions and climate impact (US EPA, 2021b). In an effort to reduce impacts of food waste, recent policy and research efforts have focused on alternative technologies, such as anaerobic digestion (AD), to divert waste from landfills while recovering the energy, carbon, and nutrients contained in discarded food. AD systems are well suited for many food waste feedstocks (Paritosh et al., 2017), as they capitalize on the naturally occurring microbial breakdown of organic matter in the absence of oxygen, leading to the production of biogas, which can displace fossil fuel energy sources, and liquid digestate, a nutrient-rich soil amendment that can be land-applied as a fertilizer replacement.
Despite the promise of AD as a food waste solution, increased adoption of this technology may lead to new risks of plastic contamination within food systems (Sobhi et al., 2024). AD feedstocks may include source-separated food waste from commercial, institutional, and industrial sources, which may contain plastic contaminants originating from upstream use of plastic packaging, containers, produce stickers, and serviceware (Dybka-Stępień et al., 2021; Kenny, 2021; Ruggero et al., 2021; US EPA, 2024; US EPA, 2021a). Existing contaminant control methods, such as manual picking and mechanical screening and de-packaging, have limited effectiveness for complete plastic removal (Washington State Organics Contamination Reduction Workgroup, 2017). Therefore, contaminated food waste feedstocks likely serve as a vector for plastic debris to enter the environment (Weithmann et al., 2018; Schwinghammer et al., 2020), particularly in the form of microplastics, which are plastic particles <5 mm in any one dimension. MP released from AD would likely include secondary particles resulting from breakdown of larger plastic pieces (Yang et al., 2022), as well as both primary and secondary MP already contained in the food being treated (e.g., Rochman et al., 2015; Kosuth et al., 2018; Oliveri Conti et al., 2020).
Ensuring the sustainability of AD systems will require proactive evaluation and minimization of environmental and human health risks associated with MP releases (Winiarska et al., 2024; Rashid et al., 2025). For example, when liquid digestate is land applied as a soil amendment, MP may migrate via wind, surface runoff, soil erosion, and movement of soil organisms (Rillig, 2012; Rillig et al., 2017; Li et al., 2020). Agricultural practices like plowing and tillage can drive MP deeper into the soil, leading to accumulation and altered soil characteristics (Khalid et al., 2020). MP typically has a large surface area and is highly hydrophobic, with potential to adsorb heavy metals, antibiotics, and pesticides and modify nutrient levels in soil (Wijesooriya et al., 2023). Aged MP, such as that exiting a digester, may have additional surface heterogeneity that enhances pollutant adsorption (Lan, 2022) and may exhibit increased release of pigments and additives into the soil, posing a threat to soil organisms and waterways through runoff (Luo et al., 2020). Once MP contaminates agricultural soils, particles may accumulate in edible plant parts (Lian et al., 2020; Li et al., 2021), impact plant health, and ultimately lead to food safety and human health risks (Wang et al., 2021).
There is clearly a need to better understand the potential for MP releases from food waste management systems. However, little data currently exists to characterize MP size, polymer type, or other physical and chemical parameters that would influence plastic transport and fate in digester and agricultural systems. Further, isolating MP from organic matrices, such as digestate or manure, presents significant analytical challenges (Thornton Hampton et al., 2023). Digestate is a heterogeneous mixture of organic matter and microbial biomass, which hinders effective separation, identification and quantification of MP, particularly because organic particles and MP often have similar sizes and densities (Hurley et al., 2018). Digestate itself may vary across facilities, depending on feedstocks and digester type, further confounding filtration and extraction methods. To date, standardized methods for measuring MP in food waste or digestate have yet to be developed.
Existing studies for highly organic samples use extraction methods that include digestion of organic material, density separation, and centrifugation or sieving (Yan et al., 2020; Maw et al., 2022; Motiejauskaitė and Barčauskaitė, 2025). For example, in a method developed for fecal matter from various species, Yan et al. (2020) uses Fenton’s reagent [consisting of hydrogen peroxide and iron (II) sulfate] to degrade solids for 5 h below 40°C, followed by filtration onto a mixed cellulose ester membrane filter, treatment with nitric acid to further remove non-plastic organic material, and sonication in absolute ethyl alcohol to remove residue from the surface of the MP. While this method successfully removes recalcitrant materials, we note a number of potential issues associated with applying this method to digestate and manure samples. The iron in Fenton’s reagent may stain MP, preventing accurate assessment of particle color that in turn may preclude the ability to track potential sources. While nitric acid was successful in removing residual material, more recent studies raise concerns about nitric acid degradation of some plastics, including polyamide (PA6), polyurethane (PU), and polyethylene terephthalate (PET) films (Schrank et al., 2022). After digestion, MP are typically identified visually using fluorescence microscopy followed by fourier transform infrared (FTIR) and Raman spectroscopy (Porterfield et al., 2023a). When analyzing MP abundance, most studies report on a count per weight basis (Weithmann et al., 2018; Schwinghammer et al., 2020; Ruggero et al., 2021); few studies use a weight/weight (Müller et al., 2020; Braun et al., 2021) or mass/volume (Xu et al., 2023; Zuri et al., 2025) basis. Count/weight methods (e.g., MP kg−1) are increasingly preferred because they normalize particle abundance to the actual mass of the sample, which reduces variability caused by differences in water content, density, or sample size. Methodological variability poses challenges for inter-comparison because there is no way to easily convert between measurements (Leusch and Ziajahromi, 2021) and underscores the need for improved methods and greater standardization to fully understand challenges of MP contamination from AD systems (Munno et al., 2023; Porterfield et al., 2023a).
Therefore, this study aimed to (1) develop and validate methods for the isolation and characterization of MP from AD systems and (2) to perform the first systematic assessment of MP abundance in an anaerobic food waste and cow manure co-digestion system over a one-year period. Quantification and characterization of MP present in digestate and manure streams will help establish risks of downstream releases to agricultural soils and aquatic ecosystems. These contributions to method development and data generation will be valuable for the proactive evaluation of MP risks in food waste management systems and to broader study of MP releases in complex matrices.
2 Methods
2.1 Facility description
Digestate and manure were obtained from an anaerobic co-digestion facility in New York State co-located with a 2,000 head dairy farm. The digester, a continuously stirred tank reactor, operates in the mesophilic temperature range (35 °C–39 °C). According to supplied facility records, in 2023, feedstock was approximately 48% manure and 52% food waste sourced from dairy and process waste, fats, oils and grease (FOG), and other materials. No post-consumer or household waste was accepted. There was substantial variability in the proportion of food waste (5–67%) over the study period associated with management decisions aimed at maintaining digester stability (Supplementary Table S1). There were no pre-processing steps for the food waste, but manure was separated via screw press prior to digestion, with the solid fraction removed for on-farm use and the liquid fraction stored in a manure pit onsite. The combined daily loading rate of food waste and manure was approximately 0.24 million L with an average retention time of 29 ± 7 days, resulting in roughly 7.57 million L digestate mo−1. Digestate is diverted to uncovered lagoons where it is mixed with excess raw manure from the manure pit and stored until application onto agricultural fields. Retention time in the pond is highly variable depending on seasonality and field capacity.
2.2 Sample collection
Three types of samples were collected in triplicate every other month from January to November 2023: (1) digestate from the exit of the digester (“Digester”), (2) mixtures of digestate and excess fresh manure held in a storage lagoon prior to field application (“Lagoon”), and (3) fresh manure from the storage pit (“Manure”). All sampling materials and storage containers were triple rinsed with MP-free water before use. At each sample point, roughly 8 L of material was collected using a 9 L metal bucket. A metal ladle was used to transfer approximately 250 mL into each of 3 glass mason jars. Each month, one control blank was also collected by leaving a mason jar open near the sampling site, mimicking the sampling process over the jar, and then sealing it on-site and returning it to the lab for processing using the same procedure as the samples. Samples and blanks were kept at 4°C until analysis.
2.3 Microplastic extraction
Samples were shaken for 30 s to homogenize and a 30 mL subsample was added to a clean, MP-free water rinsed Erlenmeyer flask. We followed the method of Yang et al. (2022), with some notable exceptions. To fully oxidize the samples without the problematic staining of particles by Fenton’s reagent, we used only 30% hydrogen peroxide (J. T. Baker, Electronics industry grade), but extended the reaction time in order to more fully remove recalcitrant material. 100 mL 30% hydrogen peroxide was added to the flask and this mixture was placed in an ice bath to avoid potential foam over during the initial reaction (1–2 h). The flask was then moved to a 40°C water bath and the digestion took place over the next 5–7 d with additional aliquots of hydrogen peroxide added to the flask daily. At the end of the 5–7 d period, the reaction was complete if there was no visible bubbling when the flask was swirled. The contents of the flask were then filtered through a 25 μm stainless-steel mesh sieve using MP-free DI water.
We assessed the impact of nitric acid on MP in boiling nitric acid for 2 h prior to analysis. We repeated this analysis of Schrank et al. (2022) on pristine PET fragments and fibers, but lowered the incubation temperature from boiling to 40 °C. After 2 h, we had 100% recovery of both PET morphologies, but the blue color was lost from the fragments. After 24 h, the recovery rate was 94%, but both fragments and fibers lost all color, and when prodded with tweezers PET fragments began to break apart. After 48 h, the recovery rate was 56% and both fragments and fibers broke apart easily when prodded. Because of these potential losses of color and degradation, we eliminated the nitric acid step altogether.
However, elimination of the nitric acid step resulted in the formation of an abundant white powder on the filter following the wet peroxide oxidation, preventing accurate detection of MP (Supplementary Figure S1A). This residual material was identified by Energy Dispersive X-ray Fluorescence (ED-XRF) to be 97% calcium by weight, and Fourier transform infrared spectroscopy (FTIR) confirmed a match closest to calcium stearate. Calcium stearate is a common anti-caking agent added to animal feeds. Calcium stearate is most soluble at high pH in the presence of a chelating agent and amphoteric surfactant (Soontravanich et al., 2010). Following peroxide oxidation, solids retained on the sieve were transferred to a clean beaker with 100 mL of 0.1 M EDTA (Sigma Aldrich, ACS reagent grade)/Triton X-100 (Sigma Aldrich, analysis grade) adjusted to a pH of approximately 9 using sodium hydroxide (Sigma Aldrich, reagent grade). The beaker was stirred well and left to sit in the hot water bath overnight which successfully removed the leftover calcium material (Supplementary Figure S1B). Finally, the solution was vacuum filtered onto a 8 μm gridded mixed cellulose ester (MCE) filter (Tisch Scientific) which was subsequently transferred to a triple-rinsed petri dish, taped down using double-sided tape, and left to dry covered (Supplementary Figure S2).
2.4 Microplastic characterization
To identify and characterize potential MP from digestate samples, filters were examined under an AmScope stereo microscope with ZM-4 optics and a 20 MP CMOS back-illuminated camera (MU2003-BI) and images of potential MP are captured using Motic Images software. Each potential MP was recorded with location on the filter, morphology (spheres, films, foams, fragments, and fibers), and color. The filter was also examined under black light to better observe clear plastic as they tend to either fluoresce or reflect blue light when exposed (Supplementary Figure S2).
Once optical analysis was complete, a 20% subset of each particle grouping from each sample (ex. black fibers) was randomly selected for polymer identification by FTIR microscopy (Shimadzu AIM-9000 IR microscope; Brandt et al., 2021). Any unique particles were also selected for analysis. The selected particles were then transferred one-by-one to an aluminum tape coated glass microscope slide with a layer of Skin-tac adhesive to fix the particles to the slide and denoted using marker (Supplementary Figure S3). Slides were placed into a petri dish to dry.
The polymer type of suspected particles was confirmed with a Shimadzu AIM-9000 infrared microscope. The optical mode of the microscope is set to reflection and measures absorbance with a scan number of 32 in the range of 4,000 to 700 cm−1. To confirm polymer type from the sample scans, we created a spectral library of over 30 standards including plastic (PET, PP, PE, PU, polyvinyl chloride [PVC], etc.) and naturally occurring nonplastic materials (cotton, grass, cow hair, sand, etc.). The spectra of these standards were collected both with and without Skin-tac adhesive to account for any interference from the adhesive. We considered match scores over 700 as a positive ID and then corroborated by overlaying the sample and standard spectra for visual inspection. For each type of particle, a correction factor was applied based on the proportion of particles in that group confirmed as plastic. This value was then converted to particles kg−1 wet weight using the bulk density of liquid digestate, 1,430 kg m3 (Shrestha, 2020).
2.5 Quality control, recovery, and blanks
We followed a number of standard quality control measures to prevent or account for contamination, as detailed in (Gilbert et al., 2024). All equipment used, including sieves, beakers, graduated cylinders and reaction flasks were first washed with soapy water then triple rinsed with MP-free water. MP-free water was prepared by filtering in-house reverse osmosis water through a MCE filter with a pore size of 8 μm. When not in use, all equipment was covered with aluminum foil to prevent contamination. Dyed pink cotton lab coats were worn when working with samples to cover personal clothing and be able to easily identify pink fibers under the microscope. Each control blank collected in the field was run through the extraction protocol alongside the respective samples by adding MP-free water to the jar, and then running it through all subsequent extraction and analysis steps. This served as a combined field and laboratory blank. Potential plastic particles in the blanks were evaluated in the same manner as digestate samples. Blank results are summarized in Supplementary Table S2. The mean abundance of MP was 0.2 ± 0.4 HDPE fragments, 0.2 ± 0.4 PET fragments, and 0.5 ± 0.5 PET fibers per blank. Because of these low numbers of MP found in blanks, no blank correction was applied to the samples.
We evaluated the recovery rate for this final method by spiking a 30 mL digestate samples with 25 pristine PET, polypropylene (PP), and polystyrene (PS) fragments and 25 PET fibers. These spiked samples were run through the full digestion process and counted on the final filter. Recovery was 100% for PET fibers, PET fragments, and PS fragments, and 96% for PP fragments. The color of the particles remained unchanged. FTIR analysis confirmed this process was not degradative to the particles by examining the carbonyl region of the spectra, 1,800–1,670 cm −1, to look for signs of oxidation. As the filters were extremely clean following the EDTA/Triton X-100 (Supplementary Figures S1, S2), the need to sonicate in ethanol was eliminated, making the MP easily identifiable in fewer steps.
2.6 Statistical analysis
Statistical data analysis was completed using JMP 15.0 Pro software. Prior to analysis all data were assessed for normality and heterogeneity of variance to meet assumptions for analysis of variance (ANOVA). To examine differences in MP abundance among sources over time, we ran a two-way ANOVA with month, sample source, and their interaction term as fixed factors. When significant effects (p < 0.05) were found, Tukey’s HSD post-hoc analysis was used to identify significant differences. A Non-Metric Multidimensional Scaling (NMDS) analysis was used to assess variability in polymer morphology and composition over the six-month period. The NMDS was based on Bray-Curtis dissimilarities to quantify differences between samples. The results of the NMDS were visualized in two-dimensional ordination plots, where each point represents the polymer or morphology profile of a sample.
3 Results
3.1 Microplastic abundance and characteristics
MP were identified in all but one manure replicate and concentrations varied substantially among sources and months (Figure 1). The effects of Month (F5,36 = 10.6; p < 0.0001), Location (F2,36 = 47.2; p < 0.0001), and their interaction (F10,36 = 6.3; p < 0.0001) were all highly significant, with complex patterns in significance based on pairwise comparisons (Tukey’s HSD; Supplementary Table S3). Throughout the year, MP concentration in manure was relatively consistent, with an average of 120 ± 39 particles kg−1 wet weight. However, this mean does not include an extreme found in January of 1,587 ± 66 particles kg−1. The number of particles in the digester averaged 723 ± 84 particles kg−1, ranging from 255 ± 37 particles kg−1 in March to 985 ± 46 particles kg−1 in January. Lagoon MP values were most variable, with higher values in January (1,542 ± 102 particles kg−1) and March (3,376 ± 354 particles kg−1), and a low in May (474 ± 166 kg−1). The relative patterns across locations varied significantly over time. In January, Manure and Lagoon concentrations were similar and higher than the Digester. In March, an anomalously high Lagoon value dwarfed both Manure and Digester. In May, all locations were statistically similar; thereafter Digester and Lagoon concentrations were similar, and always greater than Manure. The significant interaction term was driven by the apparently anomalous values in January and March, which were coincident with shifts in digester management.
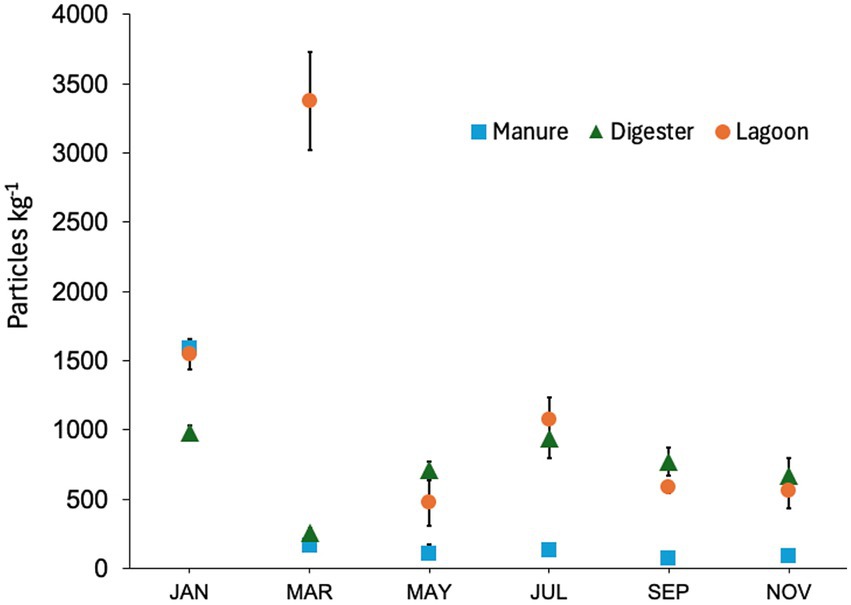
Figure 1. MP abundance in particles per kg wet weight sampled bimonthly from three sampling locations at a co-digestion facility in NYS. Error bars represent the standard error of the mean; n = 3 per time point.
Fibers were the dominant morphology (Figure 2) in all samples, predominantly PET (Figure 2). PET accounted for >60% of polymers in all samples. This was followed by PE and PU films, then fragments of various polymers including PE, PET, PP, and PVC. A smaller number of PP and acrylic fibers, PS foams, and PE spheres were found. The NMDS illustrates the morphological similarities between Digester and Lagoon samples, as indicated by their close clustering and the significant overlap of ellipses relative to Manure, which is more variable (Figure 3A). In the polymer NMDS, strong clustering and overlap of the ellipses showcase polymeric similarity across all sites, likely driven by the consistent dominance of PET in all samples (Figure 3B).
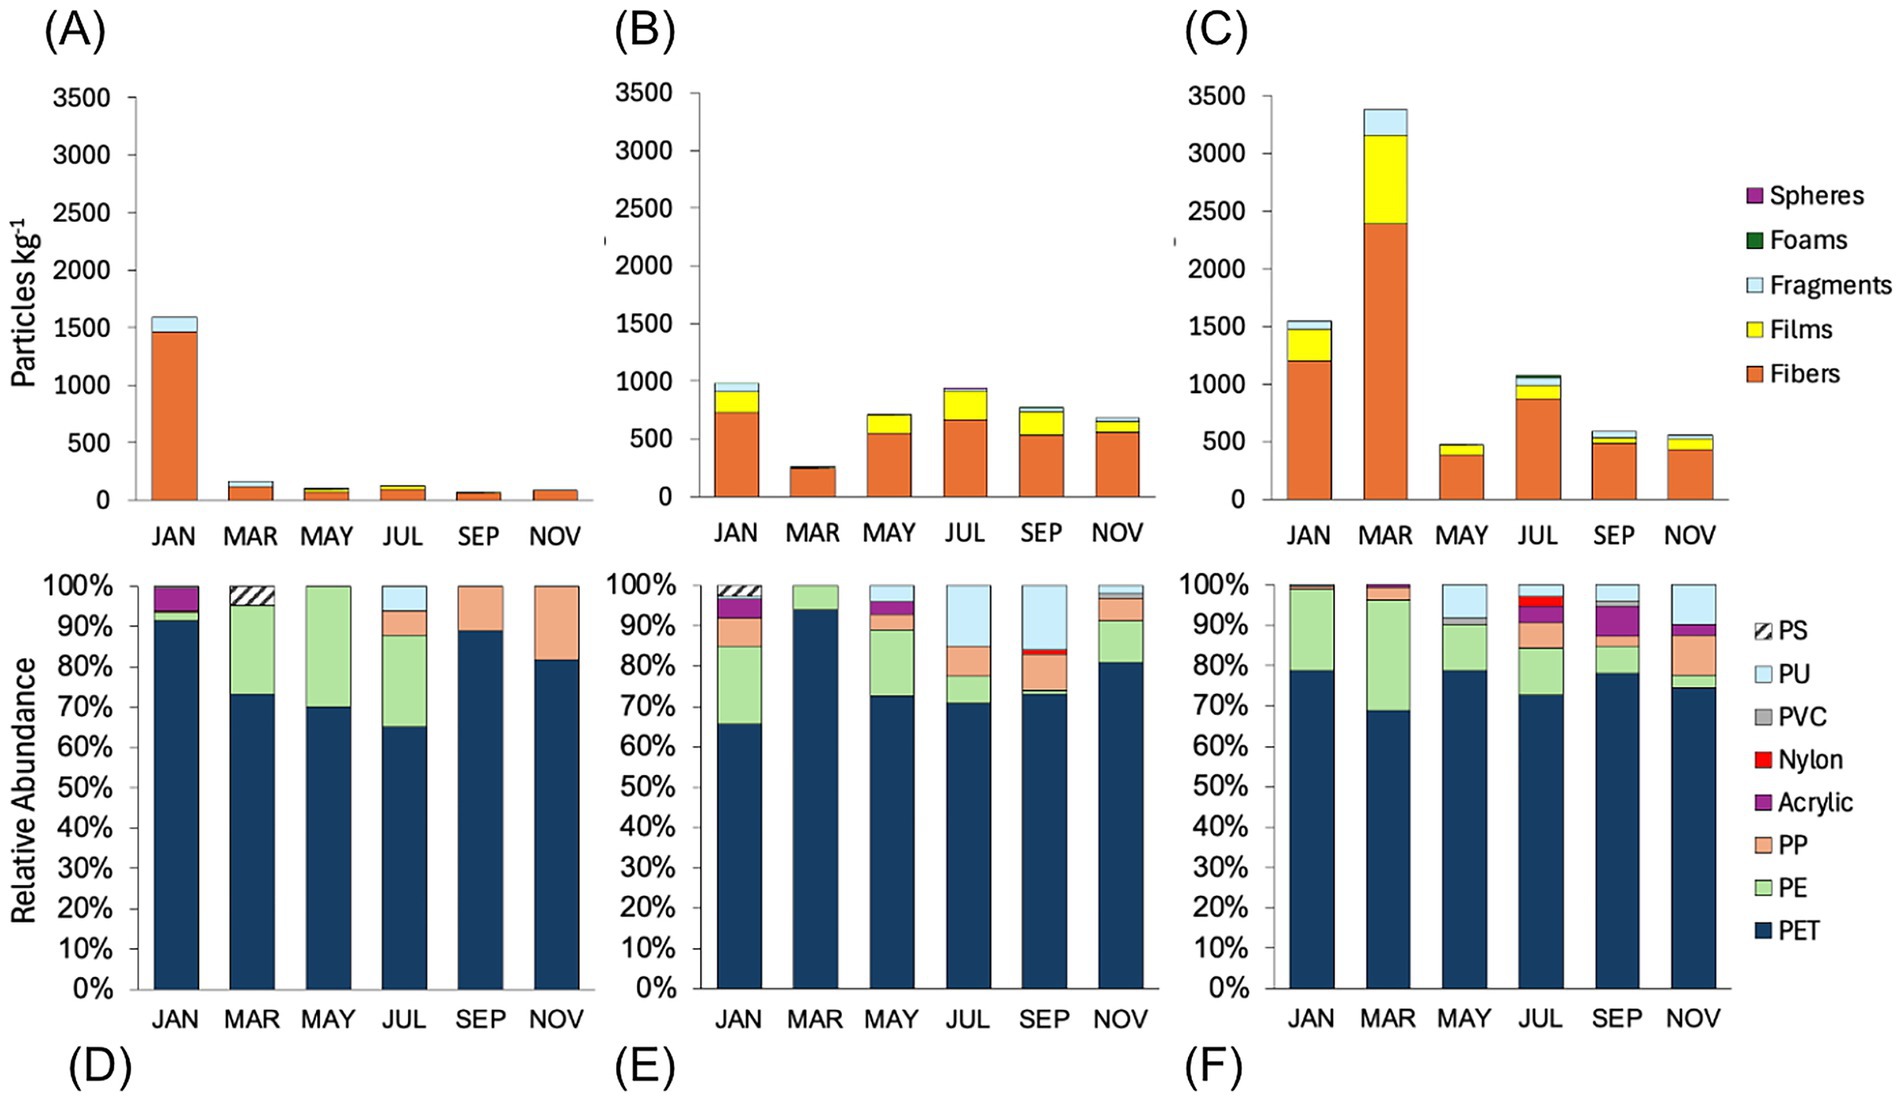
Figure 2. Morphological composition (top row) and relative abundance of plastic polymers (bottom row) of confirmed MP particles from (A,D) Manure, (B,E) Digester, and (C,F) Lagoon samples. Polymers identified included: polystyrene (PS), polyurethane (PU), polyvinylchloride (PVC), nylon, acrylic, polypropylene (PP), polyethylene (PE), and polyethylene terephthalate (PET).
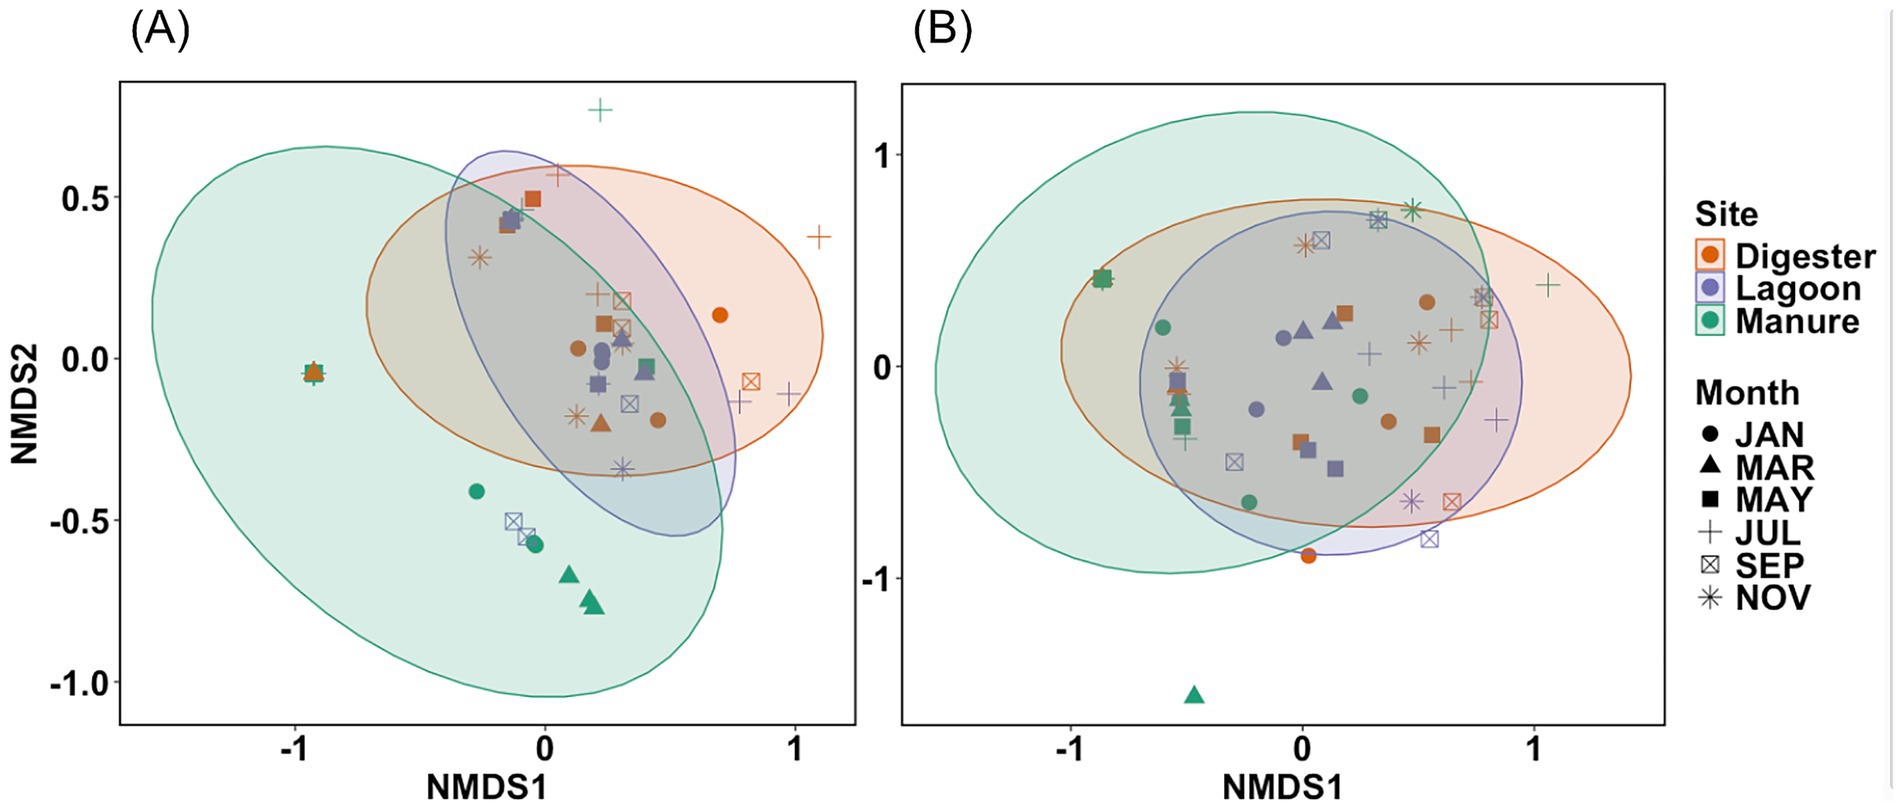
Figure 3. NMDS plot based on Bray-Curtis dissimilarities of (A) plastic morphology (stress = 0.624) and (B) polymer variation (stress = 0.158) across Manure, Lagoon, and Digester sites over the 6 months of samples. Ellipses represent 95% confidence intervals for each site.
4 Discussion
4.1 Development of appropriate methods for AD analysis
Consistent methods for assessing MP in complex aqueous systems, like organic waste effluents, are critical for proactively evaluating and mitigating risks of MP release and ecological impacts (Porterfield et al., 2023a). To accurately characterize MP particles in organic materials associated with anaerobic digestion, we developed a novel method to efficiently and reliably isolate MP from the sample matrix. We adapted previous methods (Yan et al., 2020), eliminated the need for nitric acid (Schrank et al., 2022) and Fenton’s reagent, and were able to successfully remove residual calcium stearate using a high pH chelating agent and surfactant (EDTA/Triton X-100). This streamlined method achieves intact MP extraction with fewer steps, leading to recoveries >96% with little to no laboratory-based contamination. Future studies to clearly delineate the limit of quantification for this procedure in digestate and other highly organic matrices are warranted. We believe these methods will be easily adaptable to other highly organic agricultural materials, especially those derived from co-digestion, as cow manure can be particularly high in calcium (Zhang et al., 2021).
4.2 Variability in MP content of digestate and manure
Reported values for MP in food waste derived digestates range from 75 to 3,298 particles kg−1 (Weithmann et al., 2018; O’Brien, 2019; Schwinghammer et al., 2020; Yang et al., 2022; Porterfield et al., 2023b). However, direct comparisons are complicated by differences in AD feedstock, operational variables, and a lack of standardized methods to report MP values. Previous studies also focus on bigger size fractions (>1 mm). MP abundance in cow manure was previously reported at 74 ± 129 particles kg−1, which is similar to our average monthly value of 120 ± 39 particles kg−1 (Sheriff et al., 2023). To our knowledge, this is the first contribution to establish MP abundance at other environmentally-relevant stages in the AD process, especially storage lagoons, limiting our ability to compare results to literature, but underscoring the importance of these data, as lagoons are the last stage prior to field spreading and potential emission of MP to the environment. When digestate is applied to agricultural fields, potential MP releases may be significant, on the order of 20 million MP particles ha−1. This very rough estimate accounts for the mean MP content of digestate (726 particles kg−1 wet weight) multiplied by a typical digestate application rate to fields of 20 m3 ha−1 (Korba et al., 2024). The ultimate fate of MP following application includes incorporation deeper into soil (Khalid et al., 2020), uptake by plants (Lian et al., 2020; Li et al., 2021), or transport by wind and water to adjacent ecosystems (Rillig, 2012; Rillig et al., 2017; Li et al., 2020) While actual application rates vary, and the fate and impact requires additional study, this first-order approximation highlights the need for better understanding of sources and impacts of MP associated with wasted food valorization.
The variability in food waste feedstocks appears to have a major influence on MP content of digestate, and similarly, alterations in digester management may lead to shifts in contamination levels. For example, in mid-February 2023, the digester experienced a foam overflow event coincident with low pH that was attributed to a change in the type of food waste entering the digester. In response, facility managers increased the manure fraction of the feedstock from 33% in January to roughly 78 and 95% in February and March, respectively (Supplementary Table S1). As a result, the MP concentration in the Digester output for March more closely reflected that of Manure inputs. Following resumption of more typical feedstock ratios (roughly 39% manure), the Digestate MP content returned to a higher and more consistent level. This unexpected ‘experiment’ suggests that most MP can be attributed to food waste, rather than manure. Other anomalously high values were observed in the Manure and Lagoon sites in January, and in the Lagoon in March. We suspect that perhaps seasonality may play a role, with colder temperatures in January changing the density of the stored material and causing MP to float to the surface. In March, the sample obtained from the Lagoon contained a great deal of foam released from the digester during a period of instability. Further work to evaluate the vertical variation of MP in storage, along with more detailed temporal assessment associated with feedstock composition is required to draw conclusions about how management decisions may impact MP abundance.
4.3 Potential sources of MP
The MP found in this study likely originate from a wide array of sources, including primary MP associated with the feedstock (US EPA, 2021a; Thompson et al., 2024), packaging of bulk materials delivered to the facility, on farm sources (Lwanga et al., 2023), and airborne sources (Peñalver et al., 2021; Chen et al., 2024), and as secondary MP formed during digestion (Whitney, 2024). For example, MP have been found in many food products (e.g., Rochman et al., 2015; Oleksiuk et al., 2022; Mamun et al., 2023; Thompson et al., 2024) that could enter an AD system. Other contamination may occur during preprocessing; materials that arrive in large plastic tarps, bins, or other containers that may be cut open and introduced into the digester. While this facility does not utilize a mechanical depackager, use of such a system has been shown to increase MP contamination (Porterfield et al., 2023a). Additionally, the facility’s agricultural practices may contribute to MP observed in manure. For example, we observed PET fibers in all samples, albeit at a much lower level in raw manure, suggesting that on-farm sources contribute to overall MP load. However, much of the plastics associated with a dairy operation are anticipated to be HDPE films used for silage storage and PP woven fabrics used for grain and feed shipment and storage (Malarkey and Babbitt, 2025), neither of which were observed at significant levels in our samples.
While the high abundance of PET likely originates from a number of sources, the food waste fraction of the feedstock is a plausible source. While exact products are difficult to trace as plastics degrade and fragment, PET is one of the most commonly used plastics in the packaging industry (Nisticò, 2020; Soong et al., 2022). The packaging industry is the largest user of plastic, with 36% of the global plastic production going toward packaging (Soong et al., 2022; Soni et al., 2024). With PET being a major material used in this industry, it is likely that PET may enter the food waste stream from a number of places, and enter the digester. Additionally, PET has been identified in a number of digesters and co-digesters using food waste (Schwinghammer et al., 2020; Gui et al., 2021; Yang et al., 2022; Harley-Nyang et al., 2023; Surendran et al., 2023; Lessa Belone et al., 2025) as a feedstock source.
4.4 Limitations and conclusions
The uncertainties and limitations in definitively tracing MP found in our samples to specific sources stems from the inherent challenges of conducting research at a private facility with limited access to detailed operational information about feedstock sources, intake and processing procedures, and on-farm operations. To resolve this uncertainty and determine the greatest sources of primary MP, a detailed analysis across the wasted food and anaerobic digestion life cycle is required. Because there is substantial variability in how food waste is handled, processed, and treated at different facilities (US EPA, 2024), additional sample collection and analysis is needed across AD sites operating in different regions, over longer time periods, with variable feedstocks, and operating under different digester and digestate storage conditions. As new data and MP characterization methods emerge, we will be able to develop a generalizable framework for understanding the source, behavior, and fate of plastics in AD and other food waste management systems.
Anaerobic digestion with beneficial use of digestate is touted as a preferred solution for unavoidable food waste (US EPA, 2023b), but in practice, the sustainability outcomes depend on our ability to minimize and manage MP release. For example, the anaerobic co-digestion system functions as an indirect feedback loop, where introduction of food waste feedstock drives the need for additional manure as a co-digestion substrate, which in turn, increases the overall volume of liquid entering the digester, leading to greater production of digestate. While this process is effective in managing large quantities of organic waste, it inadvertently contributes to the accumulation of contaminants in the digestate product. Reducing risk from end-of-pipe MP releases will require effective contamination minimization strategies at the AD site and systemic solutions deployed upstream in the food supply chain, including reducing the amount of food discarded (Hamilton et al., 2015; Marimuthu et al., 2024; Urugo et al., 2024) and reducing plastic entering the waste stream via improved source separation techniques, worker training, and use of plastic alternatives for food packaging and transport (US EPA, 2021a). While AD offers a sustainable solution for waste management and energy production, sources and pathways of plastic contamination must be adequately addressed and controlled through comprehensive strategies at all stages of the food system.
Data availability statement
The datasets presented in this study can be found in online repositories. The names of the repository/repositories and accession number(s) can be found at: the datasets generated for this study can be found at https://figshare.com/s/e094c5e44437a03601f7.
Author contributions
AW: Conceptualization, Formal analysis, Investigation, Methodology, Visualization, Writing – original draft, Writing – review & editing. KC: Investigation, Methodology, Writing – original draft, Writing – review & editing. CB: Conceptualization, Funding acquisition, Writing – review & editing. NE: Conceptualization, Investigation, Methodology, Supervision, Writing – review & editing. ACT: Conceptualization, Investigation, Project administration, Supervision, Writing – review & editing.
Funding
The author(s) declare that financial support was received for the research and/or publication of this article. This work was supported by the Thomas H. Gosnell School of Life Sciences, and the National Science Foundation under award number 2115405.
Acknowledgments
The authors thank Diana Rodriguez Alberto and RIT’s Collaborative for Plastic and the Environment for their contributions. Any opinions, findings, and conclusions or recommendations expressed in this material are those of the authors and do not necessarily reflect the views of the National Science Foundation.
Conflict of interest
The authors declare that the research was conducted in the absence of any commercial or financial relationships that could be construed as a potential conflict of interest.
Generative AI statement
The author(s) declare that no Gen AI was used in the creation of this manuscript.
Any alternative text (alt text) provided alongside figures in this article has been generated by Frontiers with the support of artificial intelligence and reasonable efforts have been made to ensure accuracy, including review by the authors wherever possible. If you identify any issues, please contact us.
Publisher’s note
All claims expressed in this article are solely those of the authors and do not necessarily represent those of their affiliated organizations, or those of the publisher, the editors and the reviewers. Any product that may be evaluated in this article, or claim that may be made by its manufacturer, is not guaranteed or endorsed by the publisher.
Supplementary material
The Supplementary material for this article can be found online at: https://www.frontiersin.org/articles/10.3389/fsufs.2025.1666814/full#supplementary-material
References
Brandt, J., Fischer, F., Kanaki, E., Enders, K., Labrenz, M., and Fischer, D. (2021). Assessment of subsampling strategies in microspectroscopy of environmental microplastic samples. Front. Environ. Sci. 8. doi: 10.3389/fenvs.2020.579676
Braun, M., Mail, M., Heyse, R., and Amelung, W. (2021). Plastic in compost: prevalence and potential input into agricultural and horticultural soils. Sci. Total Environ. 760:143335. doi: 10.1016/j.scitotenv.2020.143335
Chen, N.-T., Yeh, C.-L., and Jung, C.-C. (2024). Influence of agricultural activity in corn farming on airborne microplastic in surrounding elementary school. Sci. Total Environ. 948:174807. doi: 10.1016/j.scitotenv.2024.174807
Dybka-Stępień, K., Antolak, H., Kmiotek, M., Piechota, D., and Koziróg, A. (2021). Disposable food packaging and serving materials—trends and biodegradability. Polymers 13:3606. doi: 10.3390/polym13203606
Gilbert, D. S., Hayhurst, B. A., Grubisich, S., Schneider, N., Martin, O., DeNyse, C., et al. (2024). A bellwether for microplastic in wetland catchments in the Great Lakes region. J. Great Lakes Res. 50:102411. doi: 10.1016/j.jglr.2024.102411
Gui, J., Sun, Y., Wang, J., Chen, X., Zhang, S., and Wu, D. (2021). Microplastics in composting of rural domestic waste: abundance, characteristics, and release from the surface of macroplastics. Environ. Pollut. 274:116553. doi: 10.1016/j.envpol.2021.116553
Hamilton, H. A., Peverill, M. S., Müller, D. B., and Brattebø, H. (2015). Assessment of food waste prevention and recycling strategies using a multilayer systems approach. Environ. Sci. Technol. 49, 13937–13945. doi: 10.1021/acs.est.5b03781
Harley-Nyang, D., Memon, F. A., Osorio Baquero, A., and Galloway, T. (2023). Variation in microplastic concentration, characteristics and distribution in sewage sludge & biosolids around the world. Sci. Total Environ. 891:164068. doi: 10.1016/j.scitotenv.2023.164068
Hurley, R. R., Lusher, A. L., Olsen, M., and Nizzetto, L. (2018). Validation of a method for extracting microplastics from complex, organic-rich, environmental matrices. Environ. Sci. Technol. 52, 7409–7417. doi: 10.1021/acs.est.8b01517
Kenny, S. (2021). Emerging issues in food waste management plastic contamination. Washington, DC: U.S. EPA Office of Research and Development.
Khalid, N., Aqeel, M., and Noman, A. (2020). Microplastics could be a threat to plants in terrestrial systems directly or indirectly. Environ. Pollut. 267:115653. doi: 10.1016/j.envpol.2020.115653
Korba, J., Šařec, P., Novák, V., Brož, P., Dolan, A., and Dědina, M. (2024). Digestate application methods and rates with regard to greenhouse gas emissions and crop conditions. Agronomy 14:336. doi: 10.3390/agronomy14020336
Kosuth, M., Mason, S. A., and Wattenberg, E. V. (2018). Anthropogenic contamination of tap water, beer, and sea salt. PLoS One 13:e0194970. doi: 10.1371/journal.pone.0194970
Lan, T. (2022). “Contaminant release from aged microplastic” in Handbook of microplastics in the environment (Cham: Springer), 543–562.
Lessa Belone, M. C., Yli-Rantala, E., Sarlin, E., and Kokko, M. (2025). Microplastics in an anaerobic digester treating sewage sludge: occurrence and factors affecting their identification with Raman spectroscopy. J. Hazard. Mater. 491:138015. doi: 10.1016/j.jhazmat.2025.138015
Leusch, F. D. L., and Ziajahromi, S. (2021). Converting mg/L to particles/L: reconciling the occurrence and toxicity literature on microplastics. Environ. Sci. Technol. 55, 11470–11472. doi: 10.1021/acs.est.1c04093
Li, Z., Li, Q., Li, R., Zhou, J., and Wang, G. (2021). The distribution and impact of polystyrene nanoplastics on cucumber plants. Environ. Sci. Pollut. Res. 28, 16042–16053. doi: 10.1007/s11356-020-11702-2
Li, J., Song, Y., and Cai, Y. (2020). Focus topics on microplastics in soil: analytical methods, occurrence, transport, and ecological risks. Environ. Pollut. 257:113570. doi: 10.1016/j.envpol.2019.113570
Lian, J., Wu, J., Zeb, A., Zheng, S., Ma, T., Peng, F., et al. (2020). Do polystyrene nanoplastics affect the toxicity of cadmium to wheat (Triticum aestivum L.)? Environ. Pollut. 263:114498. doi: 10.1016/j.envpol.2020.114498
Luo, H., Li, Y., Zhao, Y., Xiang, Y., He, D., and Pan, X. (2020). Effects of accelerated aging on characteristics, leaching, and toxicity of commercial lead chromate pigmented microplastics. Environ. Pollut. 257:113475. doi: 10.1016/j.envpol.2019.113475
Lwanga, E. H., van Roshum, I., Munhoz, D. R., Meng, K., Rezaei, M., Goossens, D., et al. (2023). Microplastic appraisal of soil, water, ditch sediment and airborne dust: the case of agricultural systems. Environ. Pollut. 316:120513. doi: 10.1016/j.envpol.2022.120513
Malarkey, K. A., and Babbitt, C. W. (2025). The plastic footprint of U.S. agriculture. Resour. Conserv. Recycl. 223:108515. doi: 10.1016/j.resconrec.2025.108515
Mamun, A. A., Prasetya, T. A. E., Dewi, I. R., and Ahmad, M. (2023). Microplastics in human food chains: food becoming a threat to health safety. Sci. Total Environ. 858:159834. doi: 10.1016/j.scitotenv.2022.159834
Marimuthu, S., Saikumar, A., and Badwaik, L. S. (2024). Food losses and wastage within food supply chain: a critical review of its generation, impact, and conversion techniques. Waste Dispos. Sustain. Energy 6, 661–676. doi: 10.1007/s42768-024-00200-7
Maw, M. M., Boontanon, N., Fujii, S., and Boontanon, S. K. (2022). Rapid and efficient removal of organic matter from sewage sludge for extraction of microplastics. Sci. Total Environ. 853:158642. doi: 10.1016/j.scitotenv.2022.158642
Motiejauskaitė, D., and Barčauskaitė, K. (2025). Optimization of a method used for extracting microplastics from an organic matter-rich matrix and isolated particles assessment. Chemosphere 384:144517. doi: 10.1016/j.chemosphere.2025.144517
Müller, A., Goedecke, C., Eisentraut, P., Piechotta, C., and Braun, U. (2020). Microplastic analysis using chemical extraction followed by LC-UV analysis: a straightforward approach to determine PET content in environmental samples. Environ. Sci. Eur. 32:85. doi: 10.1186/s12302-020-00358-x
Munno, K., Lusher, A. L., Minor, E. C., Gray, A., Ho, K., Hankett, J., et al. (2023). Patterns of microparticles in blank samples: a study to inform best practices for microplastic analysis. Chemosphere 333:138883. doi: 10.1016/j.chemosphere.2023.138883
Nisticò, R. (2020). Polyethylene terephthalate (PET) in the packaging industry. Polym. Test. 90:106707. doi: 10.1016/j.polymertesting.2020.106707
O’Brien, B. J. (2019). Physicochemical properties of residuals from anaerobic digestion of dairy manure and food waste: Nutrient cycling implications and opportunities for edible mushroom cultivation. United States -- Vermont: The University of Vermont and State Agricultural College.
Oleksiuk, K., Krupa-Kotara, K., Wypych-Ślusarska, A., Głogowska-Ligus, J., Spychała, A., and Słowiński, J. (2022). Microplastic in food and water: current knowledge and awareness of consumers. Nutrients 14:4857. doi: 10.3390/nu14224857
Oliveri Conti, G., Ferrante, M., Banni, M., Favara, C., Nicolosi, I., Cristaldi, A., et al. (2020). Micro- and nano-plastics in edible fruit and vegetables. The first diet risks assessment for the general population. Environ. Res. 187:109677. doi: 10.1016/j.envres.2020.109677
Paritosh, K., Kushwaha, S. K., Yadav, M., Pareek, N., Chawade, A., and Vivekanand, V. (2017). Food waste to energy: an overview of sustainable approaches for food waste management and nutrient recycling. Biomed. Res. Int. 2017, 1–19. doi: 10.1155/2017/2370927
Peñalver, R., Costa-Gómez, I., Arroyo-Manzanares, N., Moreno, J. M., López-García, I., Moreno-Grau, S., et al. (2021). Assessing the level of airborne polystyrene microplastics using thermogravimetry-mass spectrometry: results for an agricultural area. Sci. Total Environ. 787:147656. doi: 10.1016/j.scitotenv.2021.147656
Porterfield, K. K., Hobson, S. A., Neher, D. A., Niles, M. T., and Roy, E. D. (2023a). Microplastics in composts, digestates, and food wastes: a review. J. Environ. Qual. 52, 225–240. doi: 10.1002/jeq2.20450
Porterfield, K. K., Scarborough, M. J., and Roy, E. D. (2023b). Organics recycling tradeoffs: biogas potential and microplastic content of mechanically depackaged food waste. ACS Sustain. Chem. Eng. 11, 10422–10429. doi: 10.1021/acssuschemeng.3c01710
Rashid, S., Majeed, L. R., Mehta, N., Radu, T., Martín-Fabiani, I., and Bhat, M. A. (2025). Microplastics in terrestrial ecosystems: sources, transport, fate, mitigation, and remediation strategies. Euro-Mediterr. J. Environ. Integr. 10, 2633–2659. doi: 10.1007/s41207-025-00766-6
ReFED. (2023). ReFED - food waste monitor. Available online at: https://insights-engine.refed.org/food-waste-monitor?view=overview&year=2023 (Accessed June 18, 2025).
Rillig, M. (2012). Microplastic in terrestrial ecosystems and the soil? Environ. Sci. Technol. 46, 6453–6454. doi: 10.1021/es302011r
Rillig, M. C., Ingraffia, R., and de Souza Machado, A. A. (2017). Microplastic incorporation into soil in agroecosystems. Front. Plant Sci. 8:1805. doi: 10.3389/fpls.2017.01805
Rochman, C. M., Tahir, A., Williams, S. L., Baxa, D. V., Lam, R., Miller, J. T., et al. (2015). Anthropogenic debris in seafood: plastic debris and fibers from textiles in fish and bivalves sold for human consumption. Sci. Rep. 5, 1–10. doi: 10.1038/srep14340
Ruggero, F., Porter, A. E., Voulvoulis, N., Carretti, E., Lotti, T., Lubello, C., et al. (2021). A highly efficient multi-step methodology for the quantification of micro-(bio)plastics in sludge. Waste Manag. Res. 39, 956–965. doi: 10.1177/0734242X20974094
Schrank, I., Möller, J. N., Imhof, H. K., Hauenstein, O., Zielke, F., Agarwal, S., et al. (2022). Microplastic sample purification methods - assessing detrimental effects of purification procedures on specific plastic types. Sci. Total Environ. 833:154824. doi: 10.1016/j.scitotenv.2022.154824
Schwinghammer, L., Krause, S., and Schaum, C. (2020). Determination of large microplastics: wet-sieving of dewatered digested sludge, co-substrates, and compost. Water Sci. Technol. 84, 384–392. doi: 10.2166/wst.2020.582
Sheriff, I., Yusoff, M. S., Manan, T. S. B. A., and Koroma, M. (2023). Microplastics in manure: sources, analytical methods, toxicodynamic, and toxicokinetic endpoints in livestock and poultry. Environ. Adv. 12:100372. doi: 10.1016/j.envadv.2023.100372
Shrestha, S. (2020). Ecological impacts of food waste Digestate Management in an Agricultural Watershed. Theses.
Sobhi, M., Elsamahy, T., Zakaria, E., Gaballah, M. S., Zhu, F., Hu, X., et al. (2024). Characteristics, limitations and global regulations in the use of biogas digestate as fertilizer: a comprehensive overview. Sci. Total Environ. 957:177855. doi: 10.1016/j.scitotenv.2024.177855
Soni, V., Dinh, D. A., Poonia, K., Kumar, R., Singh, P., Ponnusamy, V. K., et al. (2024). Upcycling of polyethylene terephthalate (PET) plastic wastes into carbon-based nanomaterials: current status and future perspectives. Eur. Polym. J. 215:113249. doi: 10.1016/j.eurpolymj.2024.113249
Soong, Y.-H. V., Sobkowicz, M. J., and Xie, D. (2022). Recent advances in biological recycling of polyethylene terephthalate (PET) plastic wastes. Bioengineering 9:98. doi: 10.3390/bioengineering9030098
Soontravanich, S., Lopez, H. E., Scamehorn, J. F., Sabatini, D. A., and Scheuing, D. R. (2010). Dissolution study of salt of long chain fatty acids (soap scum) in surfactant solutions. Part I: equilibrium dissolution. J. Surfactant Deterg. 13, 367–372. doi: 10.1007/s11743-010-1208-5
Surendran, D., Varghese, G. K., and Zafiu, C. (2023). Characterization and source apportionment of microplastics in Indian composts. Environ. Monit. Assess. 196:5. doi: 10.1007/s10661-023-12177-7
Thompson, R. C., Courtene-Jones, W., Boucher, J., Pahl, S., Raubenheimer, K., and Koelmans, A. A. (2024). Twenty years of microplastic pollution research—what have we learned? Science 386:eadl2746. doi: 10.1126/science.adl2746
Thornton Hampton, L. M., De Frond, H., Gesulga, K., Kotar, S., Lao, W., Matuch, C., et al. (2023). The influence of complex matrices on method performance in extracting and monitoring for microplastics. Chemosphere 334:138875. doi: 10.1016/j.chemosphere.2023.138875
United Nations Environment Programme (2021). Food Waste Index Report 2021. Nairobi: United Nations Environment Programme.
Urugo, M. M., Teka, T. A., Gemede, H. F., Mersha, S., Tessema, A., Woldemariam, H. W., et al. (2024). A comprehensive review of current approaches on food waste reduction strategies. Compr. Rev. Food Sci. Food Saf. 23:e70011. doi: 10.1111/1541-4337.70011
US EPA (2021a). Emerging issues in food waste management: Plastic contamination. (Report No. EPA/600/R-21/116). Available online at: https://www.epa.gov/system/files/documents/2021-08/emerging-issues-in-food-waste-management-plastic-contamination.pdf (Accessed July 15, 2025).
US EPA (2021b). From farm to kitchen: The environmental impacts of U.S. food waste. (EPA 600-R21 171; p. 113): S. Environmental Protection Agency. Available at: https://www.epa.gov/system/files/documents/2021-11/from-farm-to-kitchen-the-environmental-impacts-of-u.s.-food-waste_508-tagged.pdf
US EPA (2023a). From field to bin: The environmental impacts of U.S. food waste management pathways. U. S. Environ. Prot. Agency. Available at: https://www.epa.gov/system/files/documents/2023-10/part2_wf-pathways_report_formatted_no-appendices_508-compliant.pdf (Accessed July 15, 2025).
US EPA. (2023b). Wasted food scale. Available online at: https://www.epa.gov/sustainable-management-food/wasted-food-scale (Accessed July 15, 2025).
US EPA. (2024). Anaerobic digestion facilities processing food waste in the U.S. (2020 & 2021). Available online at: https://www.epa.gov/anaerobic-digestion/anaerobic-digestion-facilities-processing-food-waste-us-2020-2021 (Accessed July 15, 2025).
Wang, C., Zhao, J., and Xing, B. (2021). Environmental source, fate, and toxicity of microplastics. J. Hazard. Mater. 407:124357. doi: 10.1016/j.jhazmat.2020.124357
Washington State Organics Contamination Reduction Workgroup (2017). Washington state organics contamination reduction workgroup: Report and toolkit. Olympia, WA: Washington State Department of Ecology.
Weithmann, N., Möller, J. N., Löder, M. G. J., Piehl, S., Laforsch, C., and Freitag, R. (2018). Organic fertilizer as a vehicle for the entry of microplastic into the environment. Sci. Adv. 4:eaap8060. doi: 10.1126/sciadv.aap8060
Whitney, A. (2024). Plastic abundance and degradation in the anaerobic digestion of food waste. MS Thesis. Rochester Institute of Technology.
Wijesooriya, M., Wijesekara, H., Sewwandi, M., Soysa, S., Rajapaksha, A. U., Vithanage, M., et al. (2023). “Microplastics and soil nutrient cycling” in Microplastics in the ecosphere. eds. M. Vithanage and MNV. Prasad (USA: John Wiley & Sons, Ltd), 321–338.
Winiarska, E., Jutel, M., and Zemelka-Wiacek, M. (2024). The potential impact of nano- and microplastics on human health: understanding human health risks. Environ. Res. 251:118535. doi: 10.1016/j.envres.2024.118535
Xu, Y., Ou, Q., Wang, X., Hou, F., Li, P., van der Hoek, J. P., et al. (2023). Assessing the mass concentration of microplastics and nanoplastics in wastewater treatment plants by pyrolysis gas chromatography–mass spectrometry. Environ. Sci. Technol. 57, 3114–3123. doi: 10.1021/acs.est.2c07810
Yan, Z., Zhao, H., Zhao, Y., Zhu, Q., Qiao, R., Ren, H., et al. (2020). An efficient method for extracting microplastics from feces of different species. J. Hazard. Mater. 384:121489. doi: 10.1016/j.jhazmat.2019.121489
Yang, Z., Lü, F., Hu, T., Xu, X., Zhang, H., Shao, L., et al. (2022). Occurrence of macroplastics and microplastics in biogenic waste digestate: effects of depackaging at source and dewatering process. Waste Manag. 154, 252–259. doi: 10.1016/j.wasman.2022.10.018
Zhang, K., Hamidian, A. H., Tubić, A., Zhang, Y., Fang, J. K. H., Wu, C., et al. (2021). Understanding plastic degradation and microplastic formation in the environment: a review. Environ. Pollut. 274:116554. doi: 10.1016/j.envpol.2021.116554
Keywords: microplastic, anaerobic digestion, wasted food, valorization, manure management
Citation: Whitney AL, Chomiak KM, Babbitt CW, Eddingsaas NC and Tyler AC (2025) Microplastic abundance and characterization in the anaerobic co-digestion of food waste and dairy manure. Front. Sustain. Food Syst. 9:1666814. doi: 10.3389/fsufs.2025.1666814
Edited by:
Sedat Gundogdu, Çukurova University, TürkiyeReviewed by:
İdil Can Tunçelli, Istanbul University, TürkiyeCeyhun Akarsu, Istanbul University-Cerrahpasa, Türkiye
Copyright © 2025 Whitney, Chomiak, Babbitt, Eddingsaas and Tyler. This is an open-access article distributed under the terms of the Creative Commons Attribution License (CC BY). The use, distribution or reproduction in other forums is permitted, provided the original author(s) and the copyright owner(s) are credited and that the original publication in this journal is cited, in accordance with accepted academic practice. No use, distribution or reproduction is permitted which does not comply with these terms.
*Correspondence: Anna Christina Tyler, YWN0c2JpQHJpdC5lZHU=