 Winston Choo
 Shreyaa Raghavan
- 1Singapore American School, Singapore, Singapore
- 2Massachusetts Institute of Technology, Cambridge, MA, United States
Methane (CH4) is the second most prevalent anthropogenic greenhouse gas and a major driver of climate change. In Indonesia, smallholder dairy farms significantly contribute to national CH4 emissions, primarily through enteric fermentation and manure management. However, these farms often lack access to effective tools for monitoring and mitigating emissions. This study introduces a machine learning based framework to predict CH4 emissions from 32 smallholder dairy farms in Lembang, Indonesia. The farms were first clustered using K-means, to find groups of similar farm types. Then, different models were built to predict future CH4 emissions for each cluster by testing six approaches: linear regression, polynomial regression, Random Forest, XGBoost, SVR and ARIMA. Stacked ensemble models–using unclustered, clustered and a hybrid mix of base predictions–were then developed to integrate the strengths of each approach. Performance was evaluated using both time-based train-test splits and cross validation to test for real world deployment and generalizability to other farms. The hybrid stacked model outperformed unclustered individual models in cross validation evaluation, achieving high accuracy across all emission types—enteric, manure, and total. Confidence and prediction interval analyses further confirmed its stability in predictive behavior, independent of measurement uncertainty. Overall, the proposed hybrid ensemble–clustering framework demonstrates the feasibility of machine learning–based CH4 forecasting in smallholder dairy systems, with implications for targeted mitigation and climate-smart policy planning.
1 Introduction
Climate change remains one of the most pressing challenges of the 21st century, driven largely by the accumulation of greenhouse gasses (GHGs) in the atmosphere. While carbon dioxide (CO2) has historically been the primary focus of mitigation strategies, short-lived climate pollutants like methane (CH4) play an equally critical role in near-term warming; CH4 is approximately 80 times more powerful than CO2 as a GHG (Mar et al., 2022).
Behind CO2, CH4 is the second most prevalent and important anthropogenic greenhouse gas to mitigate in order to reduce climate change; as shown in Figure 1, a large portion of global anthropogenic emissions come from agricultural sources (Masson-Delmotte et al., 2021). Livestock is the primary driver of these emissions, from which cows are the largest contributors. Dairy cows, in particular, account for 43.4% of livestock and around 14% of total anthropogenic CH4 emissions (Rojas-Downing et al., 2017). Dairy cow CH4 emissions are largely from enteric fermentation—a digestive process in ruminant animals that generates CH4 as a byproduct—which constitutes 90% of their emissions, while manure management, involving the handling and treatment of animal waste, accounts for the remaining 10% (Rojas-Downing et al., 2017). While dairy emissions also arise from upstream processes such as feed cultivation, transportation, and fertilizer use—this study focuses exclusively on methane emissions from enteric fermentation and manure management (Mech et al., 2023). These two processes represent the dominant and most direct farm-level CH₄ sources, making them the most relevant targets for predictive modeling and mitigation within smallholder systems.
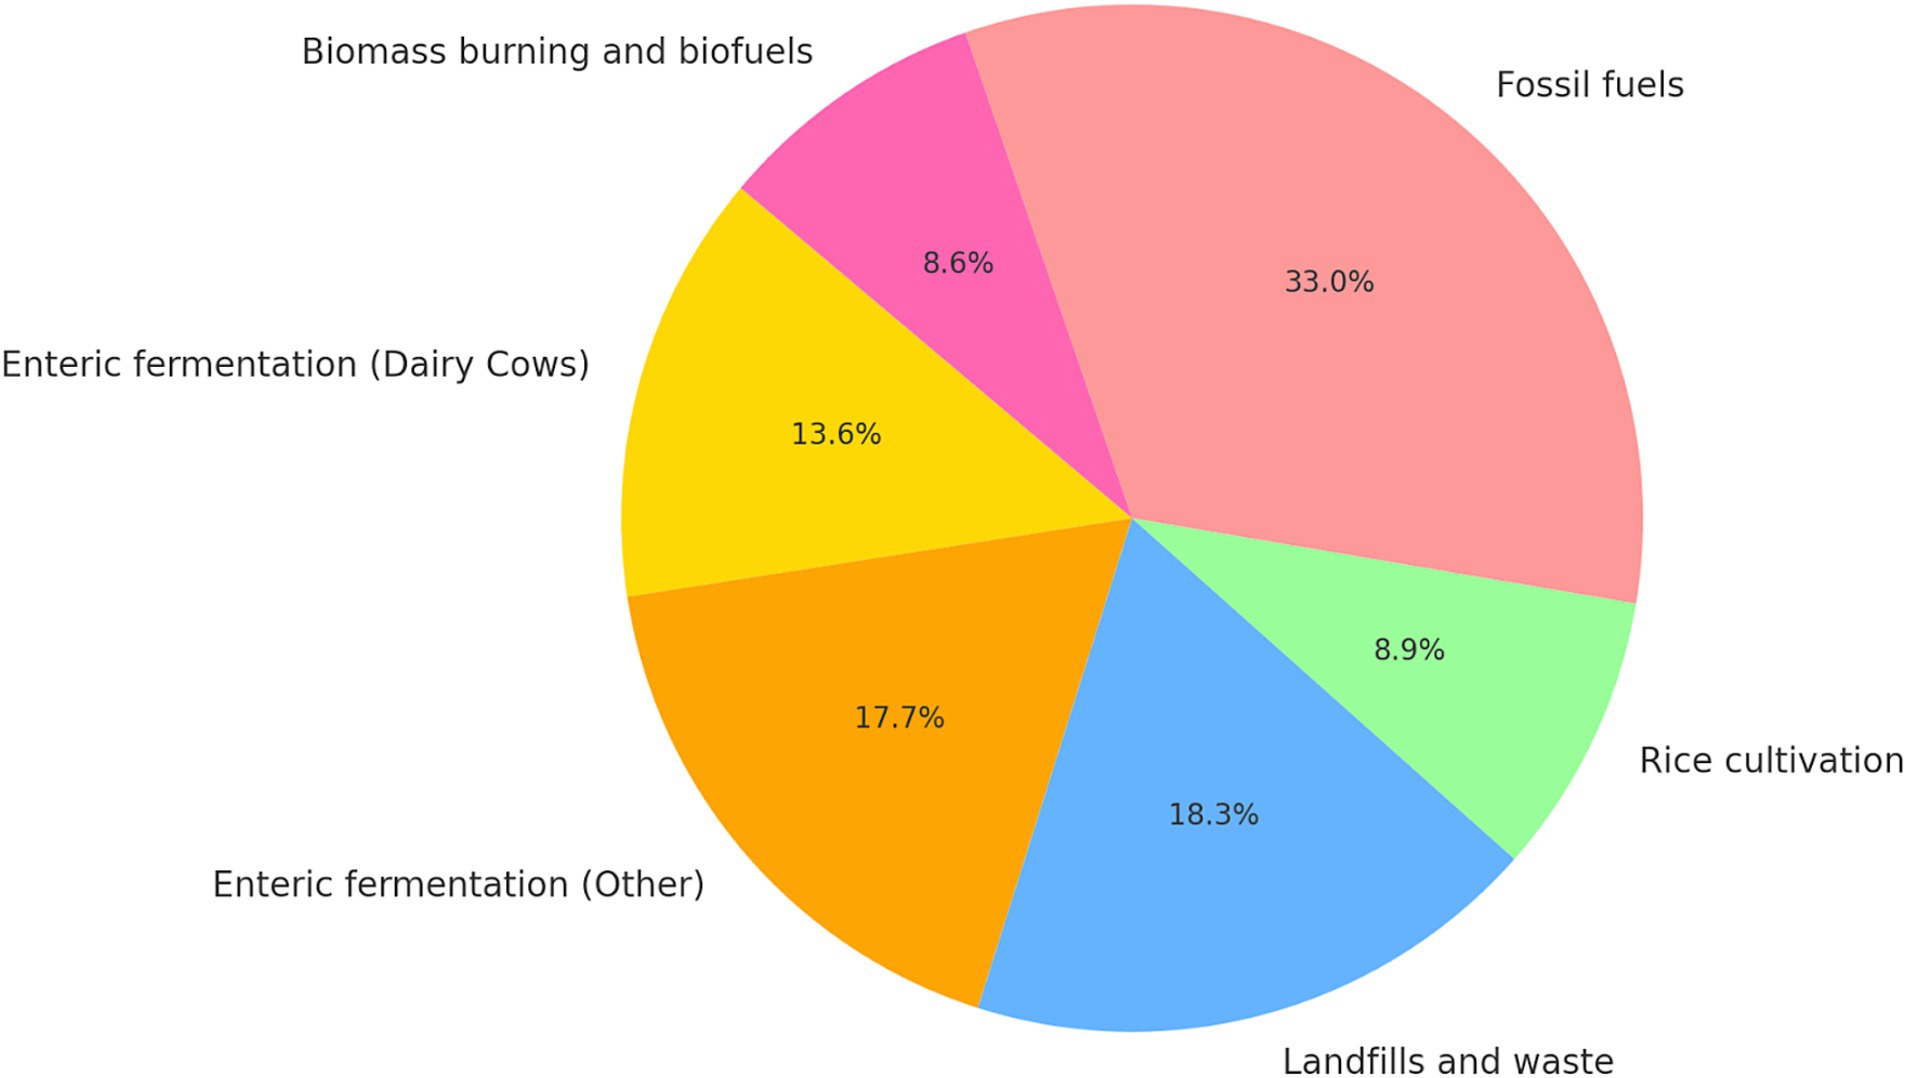
Figure 1. Pie chart of 2008–2017 CH4 emissions from anthropogenic sources (Masson-Delmotte et al., 2021; Rojas-Downing et al., 2017).
Indonesia’s milk production currently satisfies only 17% of domestic demand, leading to increased reliance on dairy farming—particularly smallholder farms, which provide 88% of the nation’s dairy output (Apdini et al., 2021). This has driven the expansion of smallholder farms—an important but environmentally challenging trend, as it is closely associated with rising levels of untreated CH4 emissions. This is largely because, despite their significance, smallholder farms often lack access to the equipment necessary to detect and mitigate emissions effectively. Addressing this issue is critical for climate change mitigation, with an immediate priority to limit emission growth in the short term (Ocko et al., 2021).
Given these challenges, predictive tools are urgently needed to support mitigation at the farm level. To that end, this study proposes a machine learning framework designed to be able to predict emissions from different sources—enteric fermentation, manure management, and total CH4 output—so that each can be aligned with appropriate interventions. For example, enteric CH4 emissions are typically addressed through biological strategies such as dietary modification (Purba and Sangsawad, 2025). In contrast, manure management emissions, which are directly influenced by human-controlled factors like waste storage duration, temperature, and treatment methods, can be mitigated through infrastructure improvements such as anaerobic digestion systems or optimized waste handling (El Mashad et al., 2023). Analyzing total emissions provides a comprehensive estimate of environmental impact, supporting mitigation planning at broader regional and national levels.
To address the variability inherent across different farm conditions, this study applies K-means clustering to group farms based on similar emission patterns, using data from 32 smallholder dairy farms in Lembang, Indonesia. Within each cluster, we developed predictive models using six regression methods—Linear, Polynomial, Random Forest, XGBoost, SVR and ARIMA—based on historical emission data. Models were also trained unclustered on the full dataset. Finally, these models were combined using stacked ensembles (using unclustered, clustered and a hybrid mix of base predictions) to enhance prediction accuracy. The models were evaluated using both time-based train-test splits and leave-one-out cross-validation (LOOCV) to assess real-world applicability and generalizability. The hybrid tacked ensemble model consistently outperformed most individual models, particularly in forecasting total CH4 emissions with LOOCV, demonstrating the potential of machine learning to support CH4 mitigation in smallholder systems. This framework provides a foundation for more scalable and informed emission management strategies in Indonesia and comparable agricultural contexts globally.
2 Background
Over the past decade, there has been significant research into the detection of CH4 emissions in dairy farms, utilizing ground-based data collection and satellite imaging technology.
Ground-based solutions such as Precision Livestock Farming (PLF) technologies, which leverage sensors to detect CH4 emissions at the individual cow level, are used to monitor CH4 emissions from dairy cows (Hulsegge et al., 2022). Additionally, advancements in satellite imaging technologies, such as the TROPOspheric Monitoring Instrument (TROPOMI), enable large scale predictions to be made from space. Although the accuracy of these technologies has been steadily improving, challenges remain in being accessible in developing nations, and detecting precise small-scale CH4 emissions.
These limitations are especially pronounced in Indonesia, where dairy sectors are dominated by smallholder farms with minimal access to advanced and expensive tools. Therefore, it is crucial to develop an accessible solution that can predict emissions. Several other approaches have been taken to predict CH4 emissions in dairy farms all across the world. Linear Mixed Effects statistical models, Random Forest machine learning models, and a combination of both have been applied to predict CH4 emissions from 32 dairy cow experiments conducted at the Agri-Food and Biosciences Institute (AFBI) in Northern Ireland (Ross et al., 2023). Another study used surface and feed data to train a Random Forest regression machine learning model to predict CH4 emissions in 9 barnyards (Wang, 2023). Evidently, there has been progress in the field of CH4 detection and prediction in dairy farms.
Moreover, an ensemble stacking model was previously used to predict CH4 emissions from enteric fermentation using feed composition as input (Wang et al., 2023). While their approach effectively estimates current emission levels, it is limited in two key ways: it does not use historical emissions as an input, and was validated only on farms in Changchun, China. These constraints limit its applicability to smallholder contexts like those in Indonesia, where historical emissions data may be available but detailed feed composition data is not always recorded, and where long-term forecasting is essential for policy and intervention planning. In a separate line of research, K-means clustering was used not for prediction, but to analyze microbial profiles. This demonstrates the method’s potential for grouping dairy systems based on CH4-related characteristics (Slanzon et al., 2022). Despite various efforts, no study has yet combined clustering and stacked ensemble prediction in the context of Indonesian smallholder farms.
It is clear that the current body of research remains inaccessible or inapplicable to smallholder farms in Indonesia and other developing nations, because of the limited data available. Therefore, developing a framework for developing predictive solutions that are effective for these farms is essential to bridging this technological gap in the fight against CH4 emissions.
Recent domestic studies illustrate the potential, but also the limitations, of existing analytical approaches. Within Indonesia, a linear mixed model statistical analysis was used to determine patterns in the 32 smallholder dairy farms. The farms had similar geographical locations in West Lembang, Indonesia and had similar feed compositions. The study found CH4 emissions were less during the dry season because of differences in dietary composition and in manure management practices. The study also showed that the estimated CH4 emissions from forage cultivation was the main source of variability between farms, whereas the estimated CH4 emissions from enteric fermentation was the main source of variability within farms. While this work identified important patterns, it did not attempt to forecast future emissions, which is critical for long-term mitigation planning.
To address this unmet need, we propose a novel machine learning framework that integrates K-means clustering with a hybrid stacked ensemble model to enhance CH₄ emission prediction in smallholder dairy systems. Clustering enables farms to be grouped by similar emission behaviors, allowing for more personalized and stable forecasting, while stacking leverages the complementary strengths of multiple base learners to improve predictive performance. Theoretically, this study advances greenhouse gas modeling by introducing a hybrid framework that jointly applies hierarchical clustering and ensemble learning to temporal emission prediction—a combination not previously implemented in smallholder dairy contexts. This integration contributes to the machine learning literature by demonstrating how cluster-based grouping can enhance ensemble stability and generalization under limited-sample conditions. Practically, the framework provides a scalable, data-efficient alternative for low-resource methane monitoring, relying solely on historical emission data rather than expensive feed or sensor inputs. Compared to prior studies that applied stacked ensembles or clustering independently (Wang et al., 2023; Slanzon et al., 2022), our model demonstrates superior adaptability and interpretability within a real-world Indonesian setting. Readers will find this study valuable for both its methodological innovation and its tangible implications for policymakers and smallholder stakeholders seeking cost-effective, scientifically grounded pathways to CH₄ mitigation planning.
3 Materials and methods
3.1 Evaluation strategy
In order to capture both real-world deployment effectiveness and the generalizability of our models, two evaluation strategies were employed: a time-based train-test split and leave-one-out cross-validation (LOOCV). These strategies assess different aspects of model performance—time-split simulates real-world deployment on farms with historical data, while LOOCV rigorously tests the model’s ability to generalize to entirely unseen farms and across different temporal conditions. Together, they provide a robust framework for evaluating predictive performance in both operational and exploratory settings.
3.1.1 Time-based train-test split
The time-based train-test split strategy is implemented to reflect realistic forecasting conditions, where CH4 emissions from past farm visits are used to predict future visits. In this approach, the dataset is partitioned chronologically: earlier observations are used for training, while later observations are reserved for testing. This is to ensure no data leakage occurs, so that “future” values aren’t used in model training. The resulting metrics reflect the model’s ability to forecast future values based on historical trends and patterns. However, a key limitation of this approach is that it evaluates model performance on only a single future time point (visit 6), which may not capture the model’s effectiveness across different temporal conditions.
3.1.2 Leave-one-out cross validation (LOOCV)
The LOOCV is used to evaluate the model’s ability to generalize to new, unseen farms. In each iteration, one farm is held out entirely, and the model is trained on data from all other farms in the same cluster (or the full dataset for unclustered models). This process is repeated such that each observation is used exactly once as a validation instance. At each iteration, performance metrics are calculated, and the final scores are averaged across all folds. LOOCV offers a stringent assessment of how the predictive model performs on a completely new farm, because each validation point is entirely excluded from training once. A limitation of LOOCV, however, is that while the test farm is unseen, the temporal structure (e.g., visit numbers and time-related emission trends) has been encountered before, meaning the evaluation does not fully reflect forecasting into an unknown future. However, LOOCV provides a more comprehensive and demanding benchmark than the time-split setup, as it tests the model’s performance across diverse farm conditions and temporal variations.
3.2 Dataset
The dataset was provided by Dr. Windi Alzahra, Ph. D., a lecturer at IPB University. It comprises data collected from smallholder farms in Lembang, Indonesia–the country’s second-largest dairy production region–contributing 14% of the national milk supply (Apdini et al., 2021). Lembang experiences a rainy season from October to March and a dry season from April to September, with an average daily temperature exceeding 18 °C. Data collection was conducted over six farm visits at two-month intervals between December 2017 and October 2018. The first three visits occurred during the rainy season, while the remaining three visits were conducted in the dry season. The dataset consists of 192 samples (32 farms x 6 visits), each with seven features; only four features were used, as seen in Table 1.
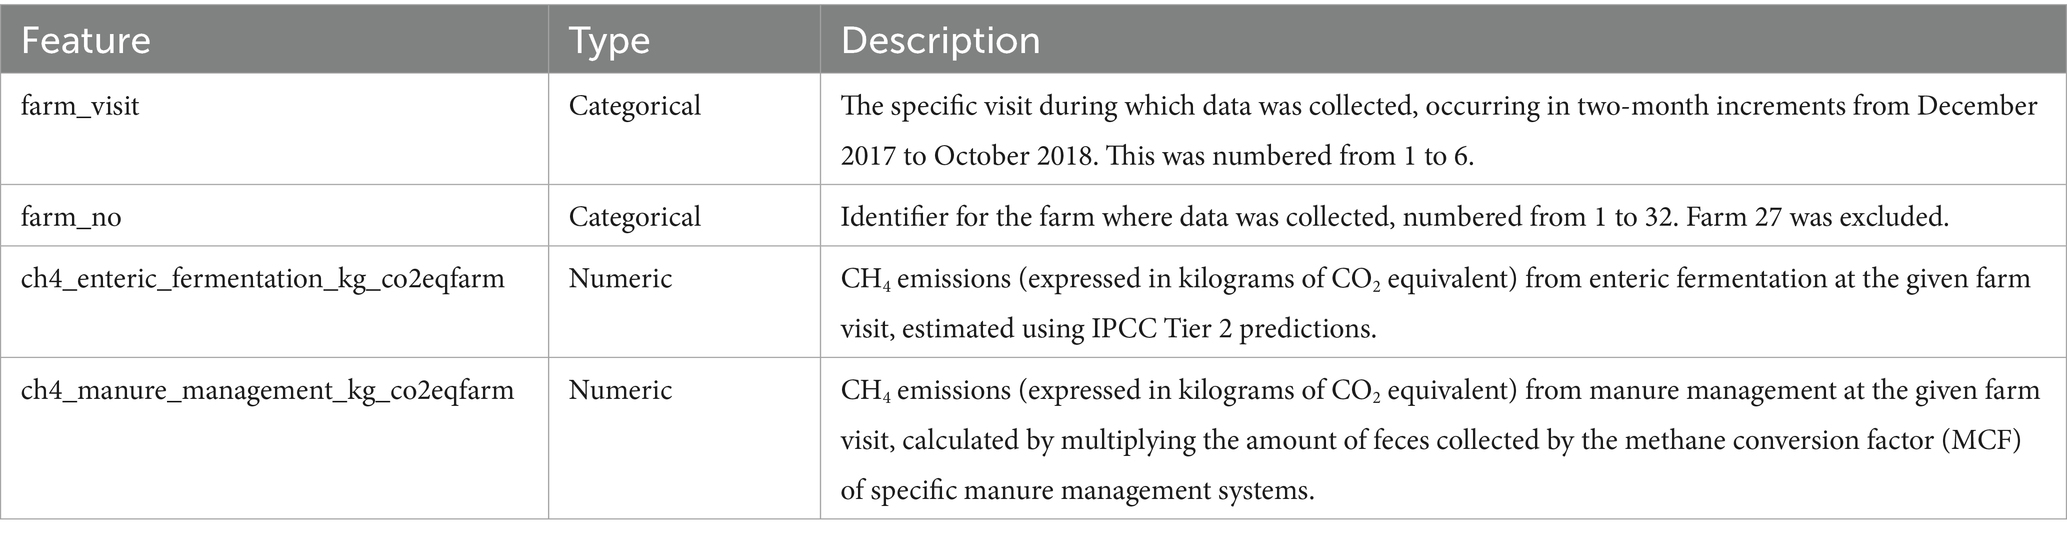
Table 1. Feature, type and description of all used original features in dataset.
3.2.1 Original features
To refine the dataset and focus on relevant features, we excluded the CH₄ systems expansion (bioslurry) variable due to a high proportion of null values. Additionally, the percent contributions to GHG variables were removed, as they did not provide specific or actionable insights into CH4 emissions. Farm 27 was excluded from the dataset because it lacked data from farm visits 2 and 6, making it unsuitable for a comprehensive analysis.
3.2.2 Derived features
As seen in Table 2, multiple features were derived to train the predictive model. Including total emissions per farm as the prediction target enables the development of a more generalized model that captures overarching patterns across emission sources, as well as provides insight into large-scale policy decisions that can be made. First and second order lag features were generated using raw emission values to leverage recent time-series trends in the data. The use of only two lags was a strategic choice: due to the small number of farm visits available in the dataset, longer lag sequences would have resulted in excessive data loss. Empirically, preliminary tests including a third lag (lag-3) indicated diminishing returns in accuracy beyond lag-2. However, restricting the temporal window to two prior visits limits the model’s ability to capture longer-term seasonal effects between rainy and dry periods, a limitation further discussed in Section 5.3 on multi-year generalizability.

Table 2. Feature, type and description of all derived features in dataset.
3.3 Clustering
Clustering was conducted using raw CH₄ emissions from each farm’s first five recorded visits, representing each farm with a five-dimensional vector for each emission type. Specifically, for the enteric and manure clustering, each vector comprised the raw CH₄ emission values from Visits 1 through 5 for that respective emission source. For the total emissions clustering, each farm was represented by a five-dimensional vector containing total CH₄ emissions (the sum of enteric and manure emissions) from Visits 1 through 5. This method allowed farms with similar emission magnitudes to be grouped together, enabling more meaningful modeling across diverse emission patterns and scales.
Only the first five visits were used as input for clustering to simulate real-world deployment, where future data (e.g., the sixth visit) would not be available at prediction time. This approach helps prevent data leakage and ensures that clusters are constructed using only information that would be accessible in practice. Moreover, restricting the input to early visits supports the generalizability of the pipeline, allowing it to be applied to other smallholder farms that may have limited historical data.
To identify the optimal number of clusters ( ), the Within-Cluster Sum of Squares (WCSS) was calculated and analyzed using the elbow method. While minimizing WCSS leads to tighter clusters, selecting an excessively high value reduces interpretability and diminishes the practical utility of the grouping. As shown in Figure 2, the elbow in the WCSS curve appeared at for enteric and total emissions and for manure emissions. Thus, three clusters were used for enteric and total emissions and two were used for manure emissions. The use of different cluster values reflects the distinct emission behaviors across enteric, manure, and total CH₄ patterns, allowing the modeling process to capture emission-specific dynamics effectively.

Figure 2. (A) Enteric WCSS elbow method graph. (B) Manure WCSS elbow method graph. (C) Total WCSS elbow method graph.
3.4 Model development
To predict farm-level CH4 emissions, we developed an ensemble of six regression models: linear regression (LR), polynomial regression (PR), random forest regression (RF), XGBoost regression (XGB), support vector regression (SVR) and autoregressive integrated moving average (ARIMA).
For LR, PR, RF, XGB, and SVR, the input features consisted of first- and second-order lag values of CH₄ emissions from enteric fermentation, manure management, and total emissions. In contrast, the ARIMA model used each farm’s full historical time series as input.
It is important to note that clustering was performed independently for each emission type—enteric, manure, and total—because patterns across these sources are not necessarily interconnected. As a result, each emission type produced its own set of clusters, and models were trained separately for each emission category rather than jointly.
For the clustered models, each base model was trained only on lag features corresponding to the emission type being predicted (e.g., ch4_enteric_lag1, ch4_enteric_lag2 for enteric CH₄). Cross-emission lag features (such as manure or total lags when predicting enteric CH₄) were excluded to preserve emission-specific specialization and to ensure that each cluster captured intrinsic patterns unique to that emission source. Similarly, for unclustered models, training was also conducted separately for each emission type—enteric, manure, and total—but on the full dataset without cluster grouping.
For the time-based evaluation, all models excluding ARIMA were trained on visit 3–5 data from the individual farm, as visit 1 and 2 had null lag values. ARIMA was trained on visits 1–5 for the individual farm. The target output for this evaluation method was emissions at visit 6, however predictions for visits 3–5 were also generated to train the stacking model. Data leakage is still prevented here because the model is assessed on its performance on visit 6; the true value of value 6 is never seen in training.
For LOOCV, the model was instead trained using the time series of all other farms in the same cluster (the farm being evaluated on was removed). Similarly, all models excluding ARIMA were trained on visit 3–6 data. ARIMA was excluded from LOOCV evaluations, as it is only able to model sequential patterns in its own individual farm. The target outputs for this evaluation method were emissions from visit 3–6 for the farm being tested on.
Each non-ARIMA model was trained both within and outside cluster-specific groups to benchmark the effectiveness of clustering. Separate models were also developed per emission type (enteric, manure, and total), enabling each model to specialize in localized emission dynamics.
3.5 Model tuning
To enhance model performance and mitigate overfitting, hyperparameter tuning was applied to the PR, RF, XGB, SVR, and ARIMA models. Given the limited dataset size and the computational demands of repeated cross-validation, grid search was used with bounded parameter ranges to ensure tractable model selection.
For the Polynomial Regression models, the degree of the polynomial was tuned using a grid of candidate values ranging from 1 to 5. This approach allowed the model to flexibly capture nonlinear patterns while minimizing overfitting, particularly in smaller clusters where higher-order polynomials could otherwise lead to poor generalization.
For the Random Forest models, tuning was performed using grid search to find the most optimal hyperparameters for n_estimators, max_depth, min_samples_split, min_samples_leaf, and max_features. Similarly, the XGBoost models were tuned using grid search for the following hyperparameters: n_estimators, max_depth, learning_rate, subsample, and colsample_bytree. The SVR models were also tuned using grid search for the following hyperparameters: C, epsilon and kernel.
For the ARIMA model, a fixed configuration of (1, 0, 0) was selected, representing a first-order autoregressive model without differencing or moving-average terms. This order was identified through a grid search across candidate configurations (p = 0–3, d = 0–1, q = 0–2) using time-based cross-validation on each farm’s series. ARIMA (1, 0, 0) consistently achieved the lowest Akaike Information Criterion (AIC) and RMSE while maintaining stable convergence, whereas higher-order models often overfit or fail to converge due to the limited six-visit time span. This minimal specification preserved temporal structure while maintaining robustness across farms. The same order was used for both time-based and LOOCV evaluations.
All tuning procedures were executed independently for each emission source—enteric, manure, and total emissions—and within each of the four identified clusters. This design allowed each model to specialize in the emission dynamics of its respective subgroup while maintaining generalizability for deployment across smallholder farms.
3.6 Ensemble integration
To synthesize the predictive capabilities of the individual models, we implemented a neural network (NN) stacking ensemble. This approach combines the outputs of the six base models— LR, PR, RF, XGB, SVR, and ARIMA—into a unified meta-model. Each base model brings distinct strengths: tree-based models (RF, XGB) capture nonlinear interactions and abrupt changes; regression models (LR, PR) extrapolate linear and polynomial patterns; SVR is robust to outliers and flexible in modeling complex relationships; and ARIMA specializes in modeling temporal trends within each farm’s emission history.
The meta-learner is a feedforward neural network trained on the base models’ predicted CH4 emissions as input features, with the actual observed emissions as the target. Unlike a linear model that assigns static weights, the NN meta-model can learn nonlinear combinations of base predictions, enabling more nuanced and adaptive integration of base model outputs.
Three stacked ensemble models were developed: one trained on the clustered predictions from all six base models, one trained on the unclustered predictions from all six base models, and a hybrid model trained using unclustered predictions from LR and PR, and clustered predictions from the remaining models. The rationale for the hybrid approach is that simpler models like LR and PR, which capture general linear and polynomial trends, benefit from being trained on the full dataset. In contrast, more complex models such as RF, XGB, and SVR perform better when trained on clusters of farms with similar emission patterns, allowing them to exploit localized structure and homogeneity.
In the time-based evaluation, the meta-model was trained using base predictions for visits 3 to 5 from all base models, and then used to predict visit 6. Separate neural networks were trained for each emission type (enteric, manure, and total) using the respective base model predictions per farm. In the LOOCV setting, the stacking ensemble was constructed using predictions from visits 3 to 6 for all farms (in cluster if applicable) except the one being tested on. The meta-learner was trained on these predictions and then used to forecast emissions on the held-out farm. Again, ARIMA was excluded from LOOCV ensembles due to its reliance on farm-specific temporal patterns, making it unsuitable for generalization to unseen farms.
Importantly, during training, the meta-model had no direct access to the true values of the prediction targets–visit 6 in time-based and the held-out farm in LOOCV–preventing data leakage. It learned how to optimally combine the base model predictions based on past performance alone. Figure 3 illustrates the neural network-based stacking architecture used for the clustered, unclustered and hybrid stacking model, where emissions predicted by each base model are passed through a multi-layer perceptron to yield the final CH₄ emission forecast.
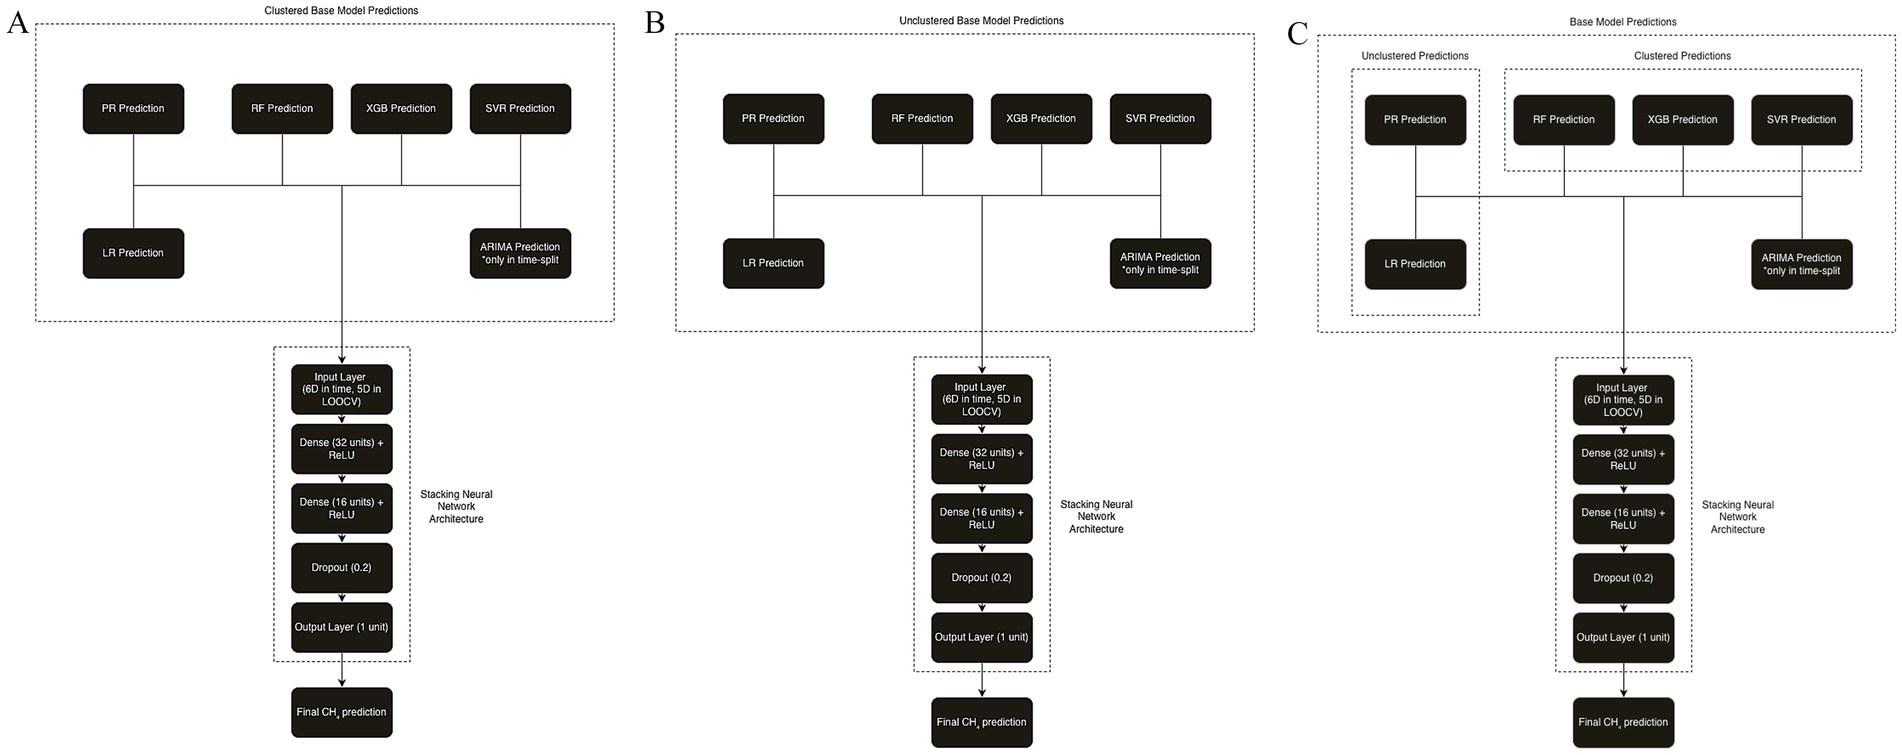
Figure 3. (A) Architecture of clustered stacked ensemble model. (B) Architecture of unclustered stacked ensemble model. (C) Architecture of hybrid stacked ensemble model.
3.7 Evaluation protocol
To evaluate model accuracy and compare performance across different modeling approaches, four standard regression metrics were used: (1) Root Mean Squared Error (RMSE), (2) Normalized RMSE (nRMSE), (3) Mean Absolute Error (MAE), and the (4) Coefficient of Determination (R2) (Equations 1–4). These metrics assess various aspects of predictive performance, including overall error magnitude, model bias, and explanatory power.
To quantify model uncertainty, both confidence intervals (CIs) and prediction intervals (PIs) were computed. The 95% CI represents uncertainty in the mean model prediction (i.e., the expected CH4 emission level across farms) and was derived from 1,000 bootstrap resamples of the model residuals. This bootstrapping procedure estimates the sampling variability of the average forecast and produces a parametric-free CI around the mean prediction.
The 95% PI represents uncertainty in individual farm-level predictions. It was computed using a global conformal prediction approach that aggregates residuals from calibration folds—visits 3–5 for time-based evaluation and all test farms for LOOCV. The 2.5th and 97.5th percentiles of these residual distributions define the model-specific offsets:
This conformal method provides distribution-free, model-agnostic uncertainty bounds that complement the bootstrapped mean-level CIs. PI coverage was evaluated on the held-out visit 6 for the time-based split and on excluded farms for LOOCV.
4 Results
4.1 RMSE, nRMSE (%), MAE, R2
Model performance was assessed under both time-based train-test splits and Leave-One-Out Cross-Validation (LOOCV), with evaluation metrics including RMSE, normalized RMSE (nRMSE), MAE, and R2. Tables 3, 4 show the results for predictions of total emissions using both the time-based and LOOCV evaluation metrics. Clustered (C) and unclustered (U) results are also shown. Results for the unclustered (U) hybrid configuration are omitted by design, since the hybrid model incorporates unclustered predictions only for linear and polynomial regressions and does not have a fully unclustered equivalent. ARIMA is excluded from LOOCV evaluations because it cannot predict without prior data from the test farm. Error metrics for enteric and manure emissions can be found in Supplementary Table 1.
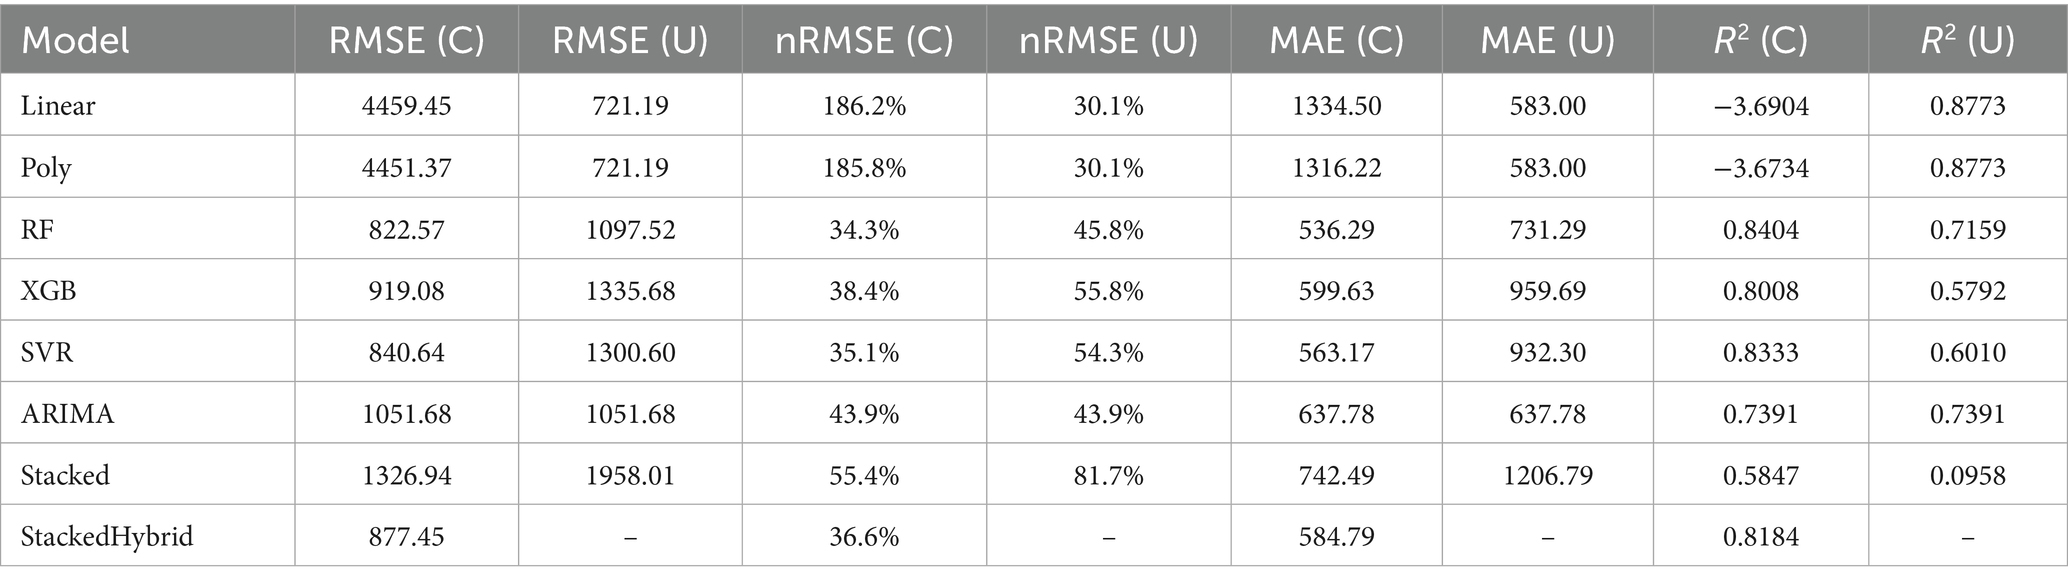
Table 3. Time-based error metrics for total emissions.
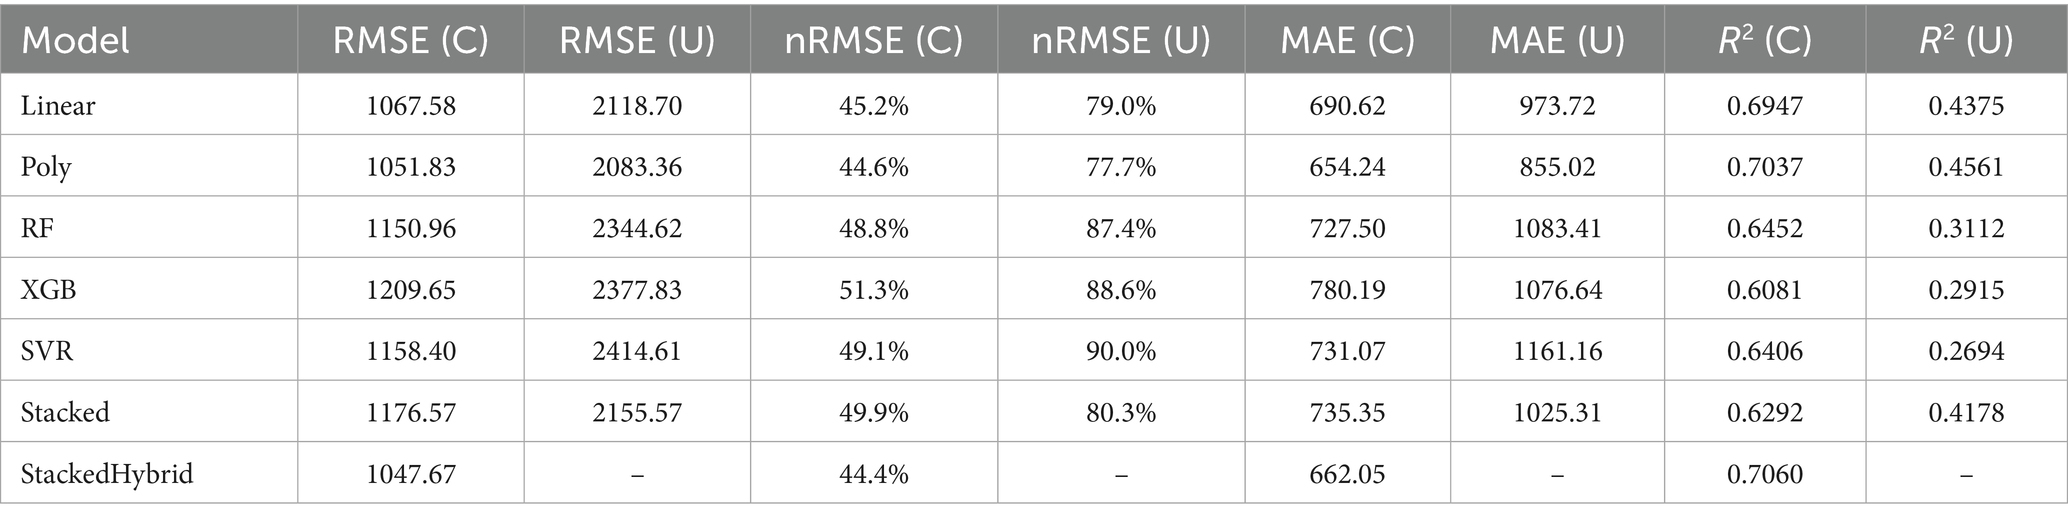
Table 4. LOOCV error metrics for total emissions.
Across both evaluation protocols, the hybrid stacked ensemble exhibited consistently strong performance, outperforming most individual base models (clustered and unclustered) in terms of RMSE, nRMSE, MAE, and R2. Under the time-based setup, it achieved an RMSE of 877.45, only 6.7% higher than the best-performing model (RF). Under LOOCV, it yielded the lowest overall RMSE of 1047.67, improving upon the best nonlinear base model (RF) by 9.0% and the top linear model (PR) by 0.4%. Moreover, the results are consistent with the enteric fermentation and manure management predictions, with the hybrid stacked model performing consistently well. The promising performance across both temporal (time-split) and spatial (farm-level) evaluation schemes highlights the hybrid model’s superior predictive reliability, underscoring its potential as a robust and scalable framework for CH₄ emission forecasting in smallholder dairy systems.
4.2 Error distribution and model stability
While summary metrics like RMSE, MAE, and R2 provide an overall assessment of model performance, they do not capture the nuances of prediction reliability across different emission levels. Examining the distribution of errors helps evaluate model stability, particularly when deployed in diverse real-world settings. Figure 4 presents scatter plots of predicted versus actual total CH₄ emissions using the hybrid stacked ensemble model under two evaluation schemes: (A) time-based split and (B) LOOCV.
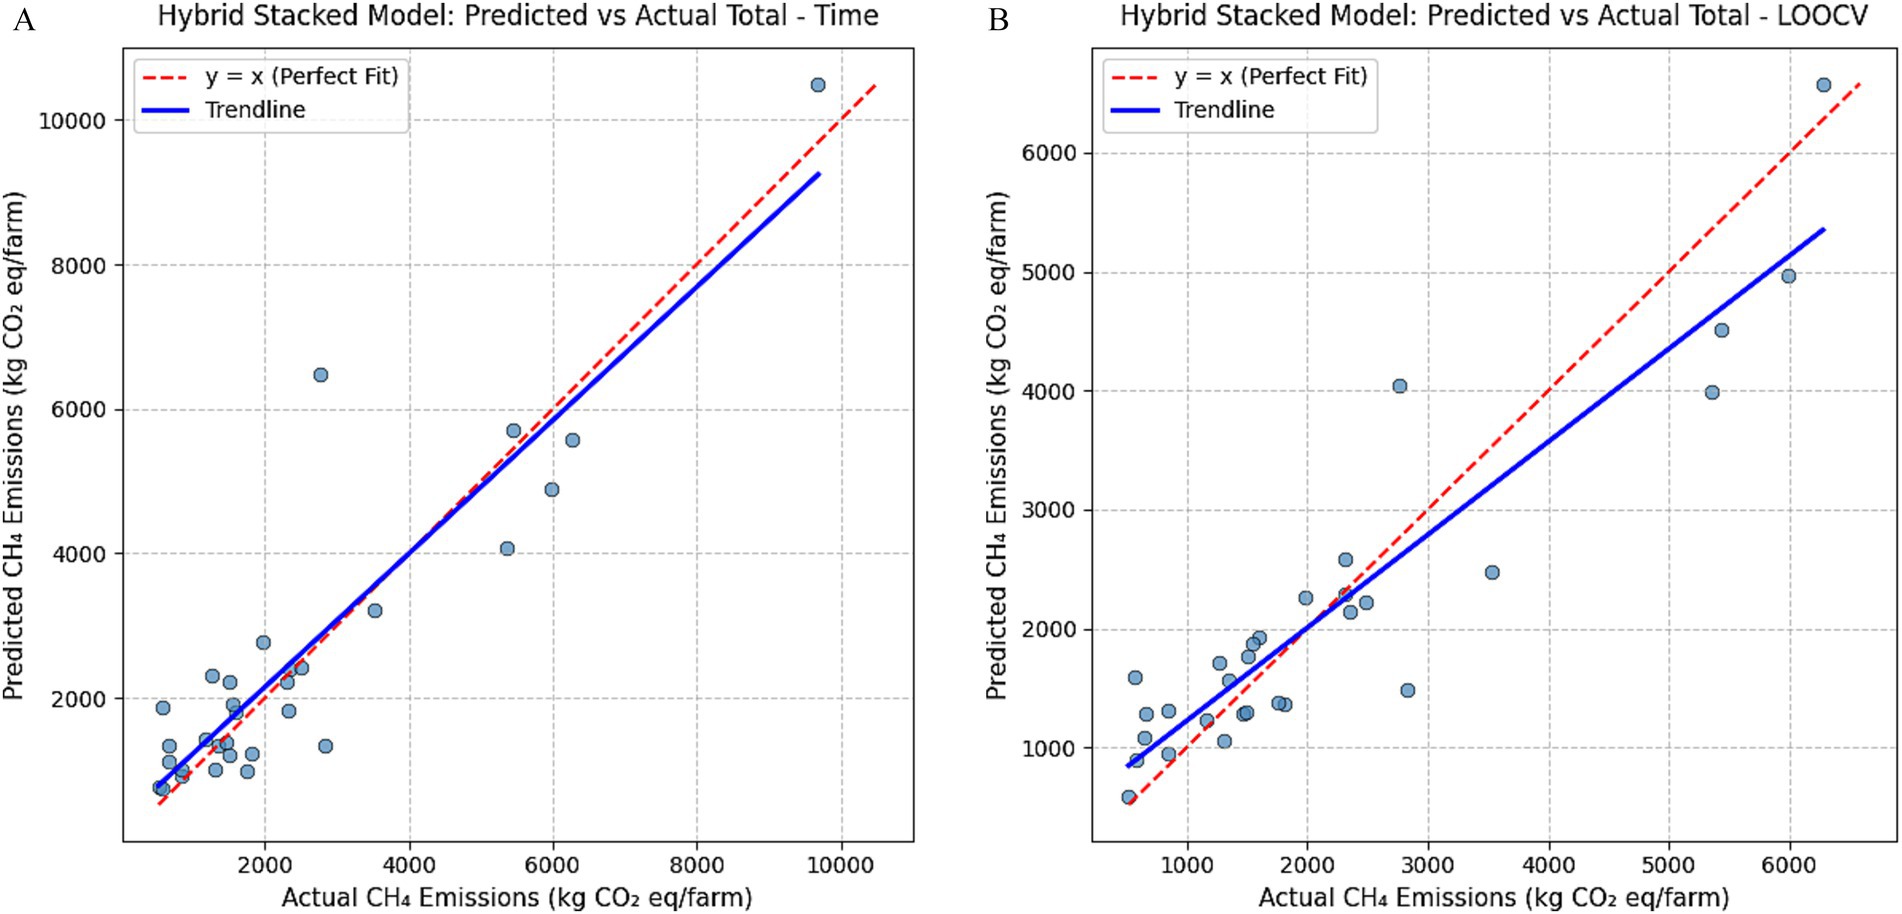
Figure 4. (A) Scatterplots of predicted vs. actual emissions of hybrid stacked model by time split on total emissions. (B) Scatterplots of predicted vs. actual emissions of hybrid stacked model by LOOCV on total emissions.
In both evaluation schemes, predictions and the trendline align closely with the y = x reference line, demonstrating that the hybrid stacked ensemble captures farm-level emission patterns with high fidelity. The coefficients of determination (R2 = 0.82 for the time-based split and R2 = 0.71 for LOOCV) quantitatively confirm this agreement, reinforcing the model’s strong predictive capacity and generalizability. However, the LOOCV plot shows a mild downward deviation of the trendline at higher emission values, indicating an underestimation of high-emitting farms—likely a result of limited representation of such cases in training folds. This pattern highlights an important direction for future refinement, discussed further in Section 5.3.
To further evaluate prediction reliability, Tables 5, 6 report the mean predicted total CH4 emissions, the corresponding 95% confidence intervals (CIs), and prediction intervals (PIs) for each model under the time-based and LOOCV evaluations. Here, q_lower and q_upper represent the model-specific residual quantiles (2.5th and 97.5th percentiles) used to construct the prediction intervals. CI widths capture variability in the mean model estimate, while the quantile offsets (q) describe the expected range of deviation in individual farm-level predictions. Confidence and prediction intervals for enteric and manure emissions can be found in Supplementary Table 2.

Table 5. Time-based confidence and prediction intervals for total emissions.
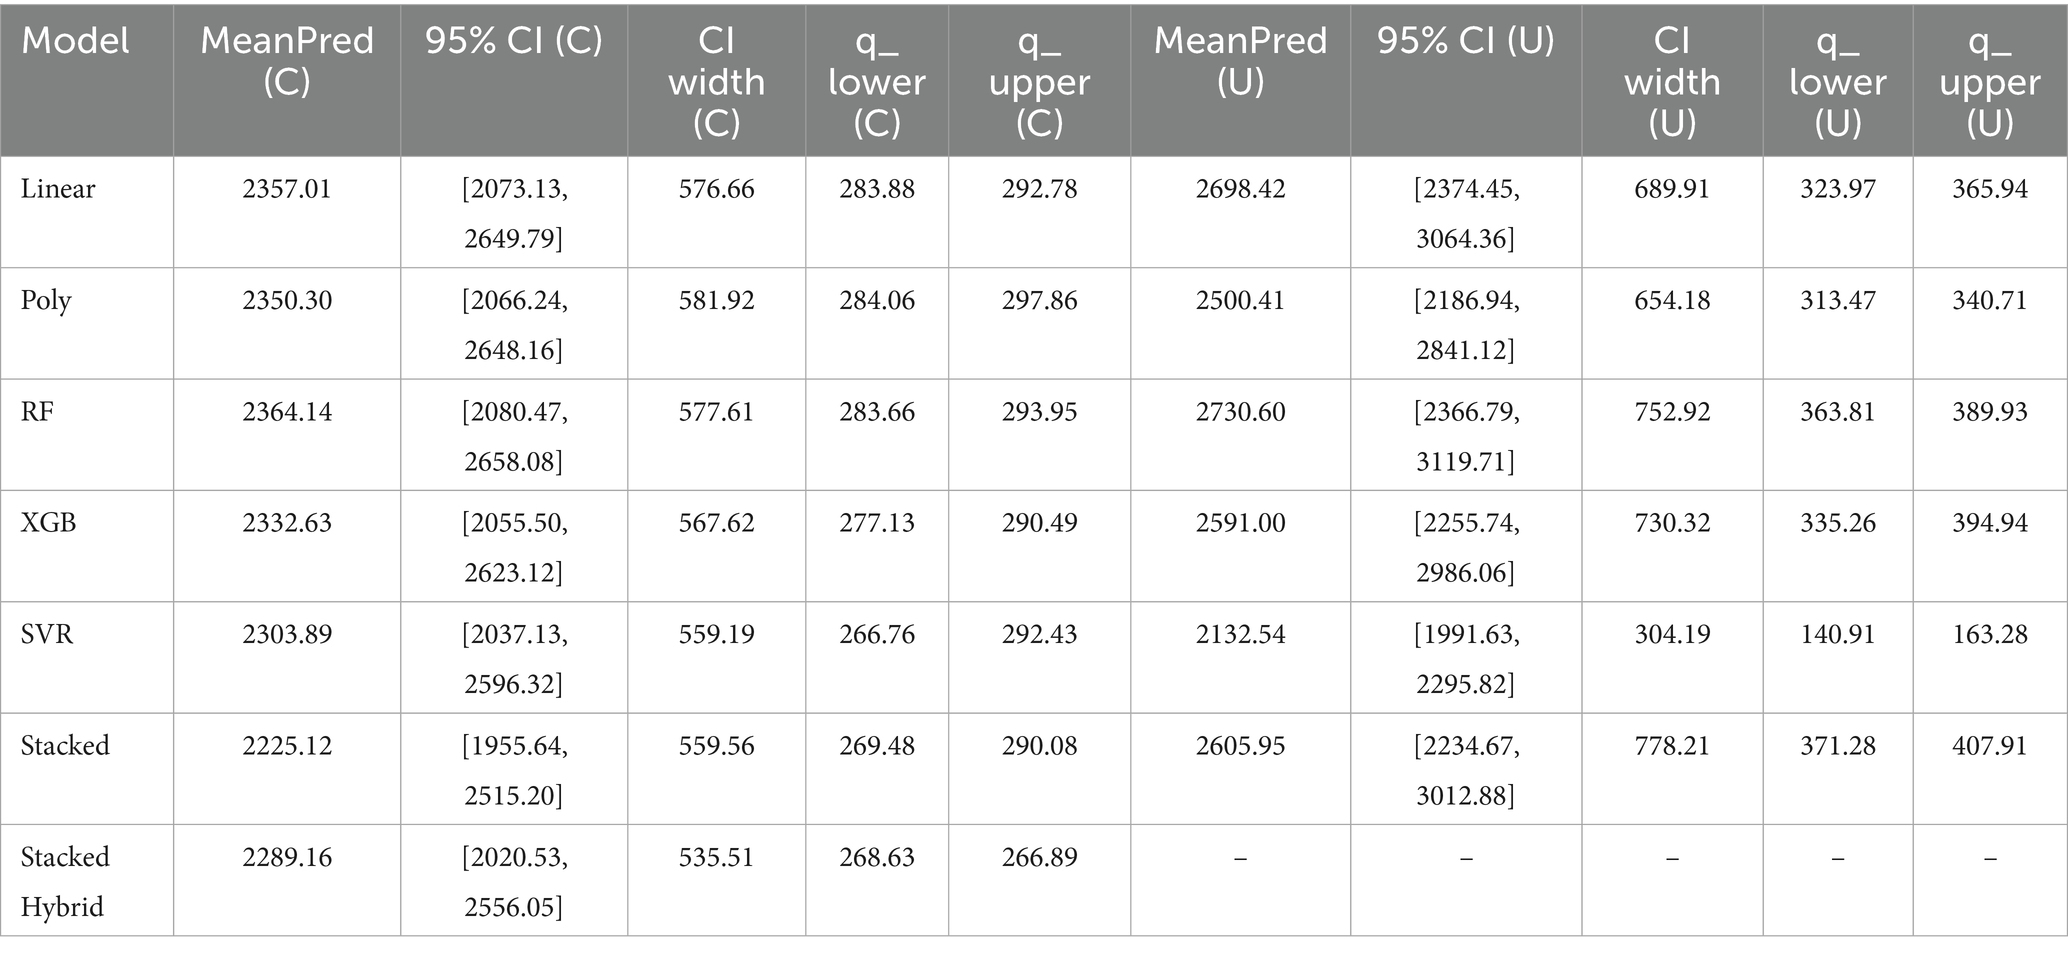
Table 6. LOOCV confidence prediction intervals for total emissions.
Evaluating the CI and PI, the hybrid stacked ensemble exhibited strong predictive stability with well-calibrated uncertainty ranges. Its interval widths under time-based evaluation and LOOCV remained within a practical range, and its mean predictions (2289–2,419) closely matched observed emission levels. These results indicate that the hybrid model effectively balances bias and variance, producing reliable forecasts across both temporal and spatial evaluations. The presence of a few high-emitting farms likely contributes to slightly broader intervals, as limited samples in that range can amplify variability; however, the model still maintains consistent coverage and calibration.
However, the SVR model also performed better than the hybrid model, yielding narrower intervals. Nonetheless, its higher RMSE and lower R2 suggest that this precision does not always translate to better generalization, especially for high-emission cases.
Overall, both models demonstrate strong predictive capability, but the hybrid ensemble offers the most balanced performance—combining accurate mean estimates, appropriate interval widths, and stable uncertainty representation suitable for CH4 forecasting in smallholder systems.
5 Discussion
5.1 Evaluation schemes and clustering
The evaluation results demonstrate that the ensemble models effectively predict CH4 emissions from smallholder dairy farms under both time-based and LOOCV schemes, confirming their applicability in real-world scenarios—both for seen farms (deployment) and unseen farms (generalization). Similar findings have been reported in agricultural and environmental modeling studies, where ensemble learning improves predictive accuracy and robustness over single models (Jiang et al., 2023). Among the three ensemble approaches, the hybrid stacked model consistently outperformed both the fully clustered and fully unclustered stacked models across evaluation settings.
This superior performance highlights the benefit of selectively combining unclustered predictions from simpler models (e.g., Linear and Polynomial Regression) with clustered predictions from more complex models (e.g., RF, XGB, and SVR). The hybrid model leverages the broad generalization capacity of linear models trained on the full dataset, while allowing complex models to specialize within clusters of similar farms. The consistent gains in performance validate the utility of clustering in improving prediction accuracy. Previous work in climate modeling has similarly demonstrated that clustering heterogeneous landscapes can enhance model specialization and interpretability (Wang et al., 2025).
While some base models individually perform slightly better in the time-based split, this setting only evaluates predictions on one farm visit (the 6th), limiting its reliability for deployment to new farms. In contrast, LOOCV offers a more comprehensive evaluation, testing across most time visits of a held-out farm. The hybrid model achieved the best results in LOOCV, indicating it generalizes well across both spatial (different farms) and temporal (different visits) variations.
All clustered models also outperformed unclustered models in LOOCV evaluations. This further reinforces the value of clustering, particularly in the context of high variability in farm-scale emissions and limited training data. By grouping farms with similar emission patterns, clustering enables the models to learn more stable, localized dynamics—leading to greater robustness and accuracy despite the constraints of small sample sizes and diverse operational contexts.
Beyond predictive accuracy, model stability was assessed through the spread of confidence and prediction intervals, which quantify variability in the models’ forecasts rather than uncertainty in measurement or data-collection processes. These intervals therefore reflect only how consistently a model predicts, not the accuracy of the underlying emission data which may include errors in measurements, especially in smallholder contexts. Across both evaluation schemes, most base models displayed moderate instability in their predictive distributions, with wider or uneven intervals indicating fluctuating performance across farms and time periods. In contrast, the hybrid stacked ensemble maintained narrower and more consistent intervals, suggesting greater reliability and reduced volatility in its predictions. This stability, confined strictly to model behavior, underscores the hybrid model’s ability to produce reproducible forecasts even when faced with heterogeneous farm conditions and limited training samples.
5.2 Implications
The high accuracy achieved by the hybrid stacked ensemble model in both time-split and LOOCV evaluations underscores its suitability for real-world deployment. To contextualize the model’s accuracy, the hybrid ensemble’s RMSE of roughly 900–1,000 kg CO2 eq per farm corresponds to about 30% of the mean total CH4 emissions per farm (around 3,000 kg CO2 eq) in the dataset, equivalent to roughly 3 weeks of CH4 output over a typical two-month production cycle.
The strong performance on time-based splits supports the model’s use in forecasting future emissions from farms with historical data, enabling timely and targeted interventions. Meanwhile, its robustness in LOOCV settings confirms its ability to generalize to previously unseen farms, making it a valuable tool for scaling interventions across diverse regions with minimal retraining or customization.
In addition to overall performance, the model’s ability to accurately predict enteric, manure, and total CH4 emissions allows for differentiated policy insights. Forecasts of enteric emissions inform biologically focused mitigation strategies, such as dietary modifications or selective breeding to reduce CH4 production in ruminants. Accurate manure emission predictions enable better planning around waste management infrastructure, such as anaerobic digesters. Total CH₄ emission predictions offer a holistic view of environmental impact, providing key metrics for designing and evaluating broader national-level policies—such as subsidy allocation, regional GHG targets, or emissions trading schemes for the agricultural sector.
Finally, the modeling framework developed in this study shows potential for adaptation to other contexts, though its transferability remains limited. While the framework’s relatively modest data requirements suggest possible applicability to other smallholder dairy systems in Southeast Asia or Sub-Saharan Africa, such extrapolation should be undertaken cautiously. The current models were trained on farms in West Java under tropical, smallholder conditions; applying them to regions with different management practices, climatic conditions, or production intensities may lead to biased or unreliable estimates. Nevertheless, the underlying framework of clustering combined with stacking is expected to remain robust across settings, as it captures both shared and localized emission dynamics. Partnering with local cooperatives for region-specific validation will therefore be essential before broader implementation. Future extensions may incorporate longer-term or higher-resolution data—such as weather, feed composition, and animal health metrics—to refine predictive accuracy and better support decision-making, but these improvements will depend on context-specific calibration rather than universal transferability.
5.3 Limitations and future work
Despite strong performance, several limitations remain. While the model effectively captures short-term emission patterns, its reliance on a single year of data (six visits per farm) limits its ability to generalize across multi-year variability. Future work should incorporate longitudinal data to validate robustness over time. Additionally, important contextual variables—such as temperature, rainfall, feed composition, and cow health—were unavailable, potentially constraining prediction accuracy. In addition, the model’s predictive reliability is inherently bounded by the quality of the input data: inaccuracies or inconsistencies in measured CH4 values or farm records directly limit the precision of the resulting forecasts. Improving data accuracy and expanding variable coverage will therefore be essential to further enhance model performance and interpretability.
Another limitation observed under the LOOCV evaluation is the model’s tendency to underpredict higher-emission farms. Since high emitters are the primary targets for mitigation efforts, addressing this bias is essential for real-world deployment. Future work could mitigate this by implementing data augmentation or resampling strategies to balance emission distributions, or by incorporating weighted loss functions that assign greater penalties to underpredicted high-emission cases (Steininger et al., 2021). Expanding the dataset to include more high-emitting farms across seasons would also improve the model’s exposure to extreme emission profiles and enhance generalization.
There is also a minor caveat in the LOOCV evaluation of the stacked model: while each farm is held out during meta-model testing, the meta-model is trained on predictions that include visit 6 data from other farms. This introduces a small degree of temporal leakage. However, because the test farm remains completely unseen during the training of the stacked ensemble, and because emission dynamics vary significantly between farms, this leakage is unlikely to bias results meaningfully. The LOOCV setup remains a valid and informative evaluation framework.
Future research should prioritize building multi-year, multi-source datasets and validating the model in real-world pilot deployments. Multi-year data will likely improve performance by capturing the seasonal and cyclical nature of agricultural emissions. Furthermore, directly integrating environmental and weather variables may enhance predictive capability and help mitigate underprediction of high-emission farms. To address data imbalance, resampling techniques could be applied to better represent rare, high-emission cases during training. In parallel, developing accessible tools—such as farmer-friendly dashboards or mobile applications—could bridge the gap between technical performance and practical adoption.
5.4 Concluding remarks
This paper presents a novel framework for predicting CH4 emissions from enteric fermentation, manure management, and total CH4 output in smallholder dairy farms in Indonesia. By integrating K-means clustering with a hybrid stacked ensemble of six regression models, the framework substantially advances beyond traditional statistical methods currently used in Indonesia and improves upon single-model approaches prevalent in CH4 prediction literature.
The hybrid stacked ensemble model consistently outperformed most individual and stacked models across both time-split and LOOCV evaluations. The dual evaluation approach ensures both effective deployment on farms with existing data and reliable generalization to new, unmonitored farms. Modeling enteric, manure, and total emissions separately enables alignment with varied mitigation strategies: biological interventions for enteric emissions, infrastructural and operational improvements for manure management, and broader emissions tracking and reduction strategies through total CH4 predictions. Importantly, the total emissions model offers a scalable pathway for informing provincial or national climate policy.
Real-world implications are significant. At the farm level, the framework empowers cooperatives and extension agencies to identify high-emitting farms and recommend tailored interventions, even with limited data inputs. At the regional level, time-based predictions support longitudinal tracking of emissions to evaluate policy effectiveness over time. Nationally, predictive tools like this can inform subsidy programs, emissions reporting systems, or eligibility for climate finance mechanisms. With Indonesia seeking to expand its dairy sector while meeting environmental commitments, data-driven tools like this are essential for balancing growth and sustainability.
Overall, this study provides a robust, scalable framework for CH4 emission predictions in smallholder dairy systems. It contributes to the growing body of research at the intersection of machine learning, climate action, and sustainable agriculture—offering actionable insights for policymakers, researchers, and practitioners alike.
Data availability statement
The data analyzed in this study is subject to the following licenses/restrictions: the dataset used in this study was provided by Dr. Windi Alzahra (IPB University) and is not publicly available due to institutional restrictions. Access to the data may be granted by the data provider upon reasonable request and with appropriate permission. Requests to access these datasets should be directed to Windi Alzahra, d2luZGlhbHphaHJhQGFwcHMuaXBiLmFjLmlk.
Author contributions
WC: Writing – review & editing, Writing – original draft. SR: Writing – review & editing.
Funding
The author(s) declare that no financial support was received for the research and/or publication of this article.
Acknowledgments
We’d like to thank Windi Al Zahra for providing the dataset used in this experiment.
Conflict of interest
The authors declare that the research was conducted in the absence of any commercial or financial relationships that could be construed as a potential conflict of interest.
Generative AI statement
The authors declare that Gen AI was used in the creation of this manuscript. Generative AI tools, specifically OpenAI’s ChatGPT, were used solely for language editing and proofreading during manuscript preparation. All content was written, reviewed, and verified by the author to ensure accuracy and originality. No AI tools were used for data analysis, modeling, or result interpretation.
Any alternative text (alt text) provided alongside figures in this article has been generated by Frontiers with the support of artificial intelligence and reasonable efforts have been made to ensure accuracy, including review by the authors wherever possible. If you identify any issues, please contact us.
Publisher’s note
All claims expressed in this article are solely those of the authors and do not necessarily represent those of their affiliated organizations, or those of the publisher, the editors and the reviewers. Any product that may be evaluated in this article, or claim that may be made by its manufacturer, is not guaranteed or endorsed by the publisher.
Supplementary material
The Supplementary material for this article can be found online at: https://www.frontiersin.org/articles/10.3389/fsufs.2025.1668517/full#supplementary-material
References
Apdini, T., Al Zahra, W., Oosting, S. J., de Boer, I. J. M., de Vries, M., Engel, B., et al. (2021). Understanding variability in greenhouse gas emission estimates of smallholder dairy farms in Indonesia. Int. J. Life Cycle Assess. 26, 1160–1176. doi: 10.1007/s11367-021-01923-z
El Mashad, H. M., Barzee, T. J., Franco, R. B., Zhang, R., Kaffka, S., and Mitloehner, F. (2023). Anaerobic digestion and alternative manure management technologies for methane emissions mitigation on Californian dairies. Atmos. 14:120. doi: 10.3390/atmos14010120
Hulsegge, I., Schokker, D., Klandermans, G. G. J., and Kamphuis, C. (2022). A data-architecture to monitor and collect cow-individual methane emissions real-time from commercial dairy farms. In: Proc. 12th World Congress on Genetics Applied to Livestock Production (WCGALP), 3307–3310.
Jiang, Z., Yang, S., Smith, P., and Pang, Q. (2023). Ensemble machine learning for modeling greenhouse gas emissions at different time scales from irrigated paddy fields. Field Crop Res. 292:108821. doi: 10.1016/j.fcr.2023.108821
Mar, K. A., Unger, C., Walderdorff, L., and Butler, T. (2022). Beyond CO2 equivalence: the impacts of methane on climate, ecosystems, and health. Environ. Sci. Pol. 134, 127–136. doi: 10.1016/j.envsci.2022.03.027
Masson-Delmotte, V., Zhai, P., Pirani, A., Connors, S. L., Péan, C., Berger, S., et al. (2021). “Climate change 2021: the physical science basis” in Contribution of working group I to the sixth assessment report of the intergovernmental panel on climate change (Cambridge, UK: Cambridge University Press). doi: 10.1017/9781009157896
Mech, A., Devi, G., Sivaram, M., Smita Sirohi, S., Dhali, A., and Kolte, A. P. (2023). Assessment of carbon footprint of milk production and identification of its major determinants in smallholder dairy farms in Karnataka, India. J. Dairy Sci. 106, 8847–8860. doi: 10.3168/jds.2022-22153
Ocko, I. B., Sun, T., Shindell, D., Oppenheimer, M., Hristov, A. N., Pacala, S. W., et al. (2021). Acting rapidly to deploy readily available methane mitigation measures by sector can immediately slow global warming. Environ. Res. Lett. 16:054042. doi: 10.1088/1748-9326/abf9c8
Purba, R. A. P., and Sangsawad, P. (2025). Meta-analysis of dietary interventions for enteric methane mitigation in ruminants through methodological advancements and implementation pathways. Vet. Sci. 12:372. doi: 10.3390/vetsci12040372
Rojas-Downing, M. M., Nejadhashemi, A. P., Harrigan, T., and Woznicki, S. A. (2017). Climate change and livestock: impacts, adaptation, and mitigation. Clim. Risk Manag. 16, 145–163. doi: 10.1016/j.crm.2017.02.001
Ross, S., Wang, H., Zheng, H., Yan, T., and Shirali, M. (2023). A novel mixed effects random forest approach for predicting dairy cattle methane emissions. 2023 IEEE International Conference on Bioinformatics and Biomedicine (BIBM), Istanbul, Turkiye. Ulster Univ Res Portal, 3125–3132. doi: 10.1109/BIBM58861.2023.10385563
Slanzon, G., Sischo, W., and McConnel, C. (2022). Contrasting fecal methanogenic and bacterial profiles of organic dairy cows located in Northwest Washington receiving either a mixed diet of pasture and TMR or solely TMR. Animals 12:2771. doi: 10.3390/ani12202771
Steininger, M., Kobs, K., Davidson, P., Krause, A., and Hotho, A. (2021). Density-based weighting for imbalanced regression. Mach. Learn. 110, 2187–2211. doi: 10.1007/s10994-021-06023-5
Wang, P. (2023). Predictive machine learning models of methane emissions using farm environmental data. In proc. 2023 5th int. conf. Internet things, autom. Artif. Intell. (IoTAAI ‘23), 881–887.
Wang, M., Hu, Z., Liu, X., and Hou, W. (2025). A cluster-based local modeling paradigm for high spatiotemporal resolution VPD prediction using multi-source data and machine learning. Int J Digital Earth 18:1105. doi: 10.1080/17538947.2025.2491105
Keywords: smallholder dairy farm, ensemble learning, clustering, methane emissions, sustainable agriculture, Indonesia, machine learning, methane emission forecast
Citation: Choo W and Raghavan S (2025) Predicting methane emissions in smallholder dairy systems: a clustering and ensemble learning approach. Front. Sustain. Food Syst. 9:1668517. doi: 10.3389/fsufs.2025.1668517
Edited by:
Roberto Valdivia, Oregon State University, United StatesReviewed by:
Anjumoni Mech, National Institute of Animal Nutrition and Physiology (ICAR), IndiaMokhammad Ridwan Yudhanegara, Universitas Singaperbangsa Karawang, Indonesia
Copyright © 2025 Choo and Raghavan. This is an open-access article distributed under the terms of the Creative Commons Attribution License (CC BY). The use, distribution or reproduction in other forums is permitted, provided the original author(s) and the copyright owner(s) are credited and that the original publication in this journal is cited, in accordance with accepted academic practice. No use, distribution or reproduction is permitted which does not comply with these terms.
*Correspondence: Winston Choo, d2luc3RvbmNob28uempjQGdtYWlsLmNvbQ==