 Yan Wang1†
 Liujie Hu
- 1Chongqing Academy of Agricultural Sciences, Chongqing, China
- 2Chongqing Agro-Tech Extension Station, Chongqing, China
- 3Agricultural Technology Extension Center of Nanchuan District, Chongqing, China
Widespread paddy field acidification in China has made many medium- and low-yield fields unsustainable due to excessive fertilization. This study determined optimal NPK fertilizer quotas for rice production in Chongqing by integrating yield levels with principles of matching total nitrogen (N), maintaining soil phosphorus (P), and adjusting potassium (K) to yield. Results showed recommended NPK quotas ranged from 104 to 185 kg N/ha, 44–84 kg P₂O₅/ha, and 18–35 kg K₂O/ha (lower limits) to 143–224 kg N/ha, 50–98 kg P₂O₅/ha, and 56–111 kg K₂O/ha (upper limits). Implementation of these quotas could reduce fertilizer use by 1,862 tons of N, 524 tons of P₂O₅, and 1,275 tons of K₂O, with the highest reduction potential in low-yield regions (2,109 tons N, 654 tons P₂O₅, and 268 tons K₂O). Notably, low-yield rice paddy fields exhibited significantly higher fertilizer application rates than medium- and high-yield fields. Excessive N and P use increases soil acidification, reactive nitrogen (Nr) loss, greenhouse gas (GHG) emissions, and water eutrophication, exacerbating soil degradation. To address these issues, we propose revised N and P quotas (104–141 kg N/ha and 44–60 kg P₂O₅/ha), which reduced Nr loss, GHG emissions, soil acidification potential (SAP), and water eutrophication potential (WEP) by 18, 6, 18, and 14%, respectively. This study proposes new NPK fertilizer application thresholds tailored to mitigating agricultural land degradation while improving agricultural productivity.
1 Introduction
Rice (Oryza sativa L.), a staple food for over 3 billion people worldwide—especially in Asia—is predominantly produced in China, where the south plays a major role due to its favorable climatic conditions and advanced agricultural practices (Custodio et al., 2016; Sha et al., 2019). Over the past three decades, the growth in rice production in China has been largely driven by the increased use of chemical fertilizers and the widespread adoption of hybrid rice technology (Huang et al., 2017; Ash, 2018). However, the soil pH of hilly regions in southern China has decreased by 0.3 units, with 91.72% of areas showing acidification between 1984 and 2018 (Han et al., 2022). Soil acidification has become a serious challenge, negatively affecting rice yields (Dong et al., 2025). The excessive application of chemical fertilizers is considered a primary contributing factor (Wu et al., 2022). This overuse has also resulted in a series of other soil degradation processes, including nutrient imbalances, disruption of soil microbial community structures, and deterioration of soil physical properties (Zhang et al., 2024). These changes not only exacerbate soil acidification and reduce soil fertility but also trigger secondary environmental issues such as heavy metal mobilization and water eutrophication, further undermining the sustainability of agricultural systems (Ahvo et al., 2023; Chakraborty et al., 2017). Without effective fertilizer regulation and nutrient management, the trend of agricultural soil degradation will become irreversible.
Reducing chemical fertilizer use while maintaining stable yields and soil fertility has become a key focus in both research and policy. One potential approach involves developing precise fertilization recommendations for higher efficacy. For example, Zhang et al. (2019) demonstrated that precision fertilization, based on soil fertility assessments and crop nutrient requirements, can significantly enhance fertilizer use efficiency and reduce application rates while maintaining or even increasing crop yields. However, the practical implementation of this strategy faces challenges in real-world farming systems. Ren et al. (2021) found that many smallholder farmers often over-apply fertilizers to avoid the risk of low yields, making it difficult to reduce overall fertilizer use. Another option is the implementation of environmental taxes on fertilizers. Rougoor et al. (2001) showed that raising fertilizer prices effectively reduced their usage. However, this may lower farmers’ incomes and reduce their motivation to grow crops. Additionally, Botterweg et al. (1994) also noted that low-level fertilizer taxes have little effect on reducing fertilizer overuse. These findings suggest that relying solely on economic and tax means cannot provide an effective solution to the fertilizer overuse issue. Consequently, it is imperative to establish science-based fertilization strategies and better crop management practices to support sustainable agricultural practices.
Setting usage quotas for agricultural inputs has proven to be an effective measure for limiting pesticide and insecticide use (Skevas et al., 2012). However, applying quotas to fertilizer is more complex because fertilizer needs vary with yield levels and soil fertility. Despite this, fertilizer quotas can still help control regional fertilizer input, maintain soil fertility, and support agricultural production. For example, policies like the Nitrate Decree and the Agricultural Environment Regulation in Europe have reduced nitrogen fertilizer use by 30% and phosphate fertilizer use by 50% since the 1980s, helping to address environmental issues such as water eutrophication (Dowd et al., 2008). On the other hand, excessive restrictions on chemical fertilizers can also lead to disasters. For instance, in Sri Lanka, the ban on the use of chemical fertilizers resulted in food shortages and skyrocketing prices (Drechsel et al., 2025). China has recently begun exploring fertilizer quota policies. In 2019, Zhejiang Province introduced the first local standard for fertilizer application limit as “The Limit Standard of Fertilizer Quota System for Major Crops” (Qiu et al., 2022). Subsequently, other provinces, such as Guangdong, Anhui, and Fujian, adopted the fertilizer quota system and proposed establishing N fertilizer quotas for major crops, including rice, corn, wheat, and rapeseed, while enforcing legal limits on total fertilizer use (Yang et al., 2023). Based on agronomic benefits analysis, Li et al. (2019) analyzed nitrogen fertilizer quotas in Fujian’s rice systems and found that formulated fertilizer use increased yields by 4–12.5% and net income by 875–2,616 yuan/ha on average. Moreover, Chen et al. (2023) also found that optimized fertilizer management boosts rice yields in China while reducing greenhouse gas emissions. Zuo et al. (2023) also found that the strategies of targeted nitrogen reduction and crop straw return can effectively alleviate soil acidification and soil degradation in Chinese farmland over the next 30 years. Although traditional soil improvement (Li B. et al., 2022), biochar (Geng et al., 2022) and organic fertilizer substitution (Ye et al., 2022) techniques can effectively adjust soil pH in the short term, the primary cause of increasing soil acidity in China over the past three decades remains excessive fertilizer application and an imbalanced nutrient replenishment in the cropping-soil system (Guo and wang, 2021; Norse and Ju, 2015). Overall, precision agriculture techniques for fertilizer management are essential for improving crop productivity, preserving soil health, and minimizing environmental impacts.
Excessive and unbalanced fertilizer use has caused soil acidification and increased environmental costs in China’s major rice-growing regions. However, current fertilizer standards only regulate nitrogen and overlook other nutrients, attainable yield, soil fertility, and acidification risks. How can precise N/P/K fertilizer quotas for the rice production system in Chongqing be formulated based on soil fertility, target yield, and environmental thresholds, in order to quantify the synergistic effects on yield maintenance, fertilizer reduction, and acidification mitigation, as well as multi-media environmental impacts? In this study, we developed a region-specific and yield-tiered NPK quota method, which sets an upper limit on environmental load while meeting the lower limit of stable yield requirements. Based on 3,414 site-year field trials, with comprehensive collection and analysis of soil fertility and crop nutrient requirements, we integrated NPK quotas, region- and yield-specific optimization strategies, fertilizer reduction potential, and life cycle assessment (LCA) for rice production in the Chongqing region. We employed principles including nitrogen fertilizer recommendation based on soil fertility testing and crop nutrient requirements, P building-up and maintenance, and yield response to K. By setting upper and lower limits for NPK quotas, we assessed the potential for fertilizer reduction and used LCA to compare the environmental impacts—such as soil acidification, reactive nitrogen loss, greenhouse gas emissions, and water eutrophication—of current farmer practices and our quota model. This study aims to (i) reconfirm NPK fertilizer quotas across different regions and yield levels, (ii) calculate the potential reduction in NPK fertilizer use, and (iii) evaluate the mitigation potential for soil acidification and environmental costs under the new standards. This research provides a scientific basis for developing regional fertilizer policies that support sustainable rice production.
2 Materials and methods
2.1 Data acquisition and screening
We developed a comprehensive database to support fertilizer quota establishment by including rice N/P/K uptake data from 3,414 field trials, soil nutrient data from 503 soil samples, and rice yield and chemical fertilizer input information from 6,895 farmer surveys. These data were used to assess regional variation in rice yield, soil fertility, and topography across Chongqing.
2.2 Division of the regional and yield level
2.2.1 Division of the region
Chongqing is geographically classified into two main producing regions: western-central Chongqing and southern-northeastern Chongqing (Figure 1). Temperature and precipitation data for these regions in 2020 are provided in the supplementary materials (Supplementary Figure S1). The western-central area of Chongqing is mainly characterized by soils developed from purple mudstone and shale. Due to the relatively low altitude, fertile soil, and suitable climate conditions, they are more conducive to rice cultivation, and thus the yield is relatively high. It includes Fuling District, Changshou District, Liangping County, Fengdu County, Dianjiang County, Zhong County, Dazu District, Yubei District, Banan District, Jiangjin District, Hechuan District, Yongchuan District, Tongnan County, Tongliang County, Rongchang County, Bishan District, and Beibei District. The southern-northeastern area is mainly characterized by soil developed from limestone. Due to higher altitudes, poorer soil quality and harsher climatic conditions, the rice yield is relatively low. Based on these findings, Chongqing was divided into two major sub-regions: the central-western region and the northeastern part of the south. It includes Nanchuan District, Qijiang District, Qianjiang District, Wulong District, Pengshui Miao Tujia Autonomous County, Shizhu Tujia Autonomous County, Youyang Tujia Miao Autonomous County, Xiushan Tujia Miao Autonomous County, Wanzhou District, Kai County, Chengkou County, Yunyang County, Fengjie County, Wushan County, and Wuxi County.
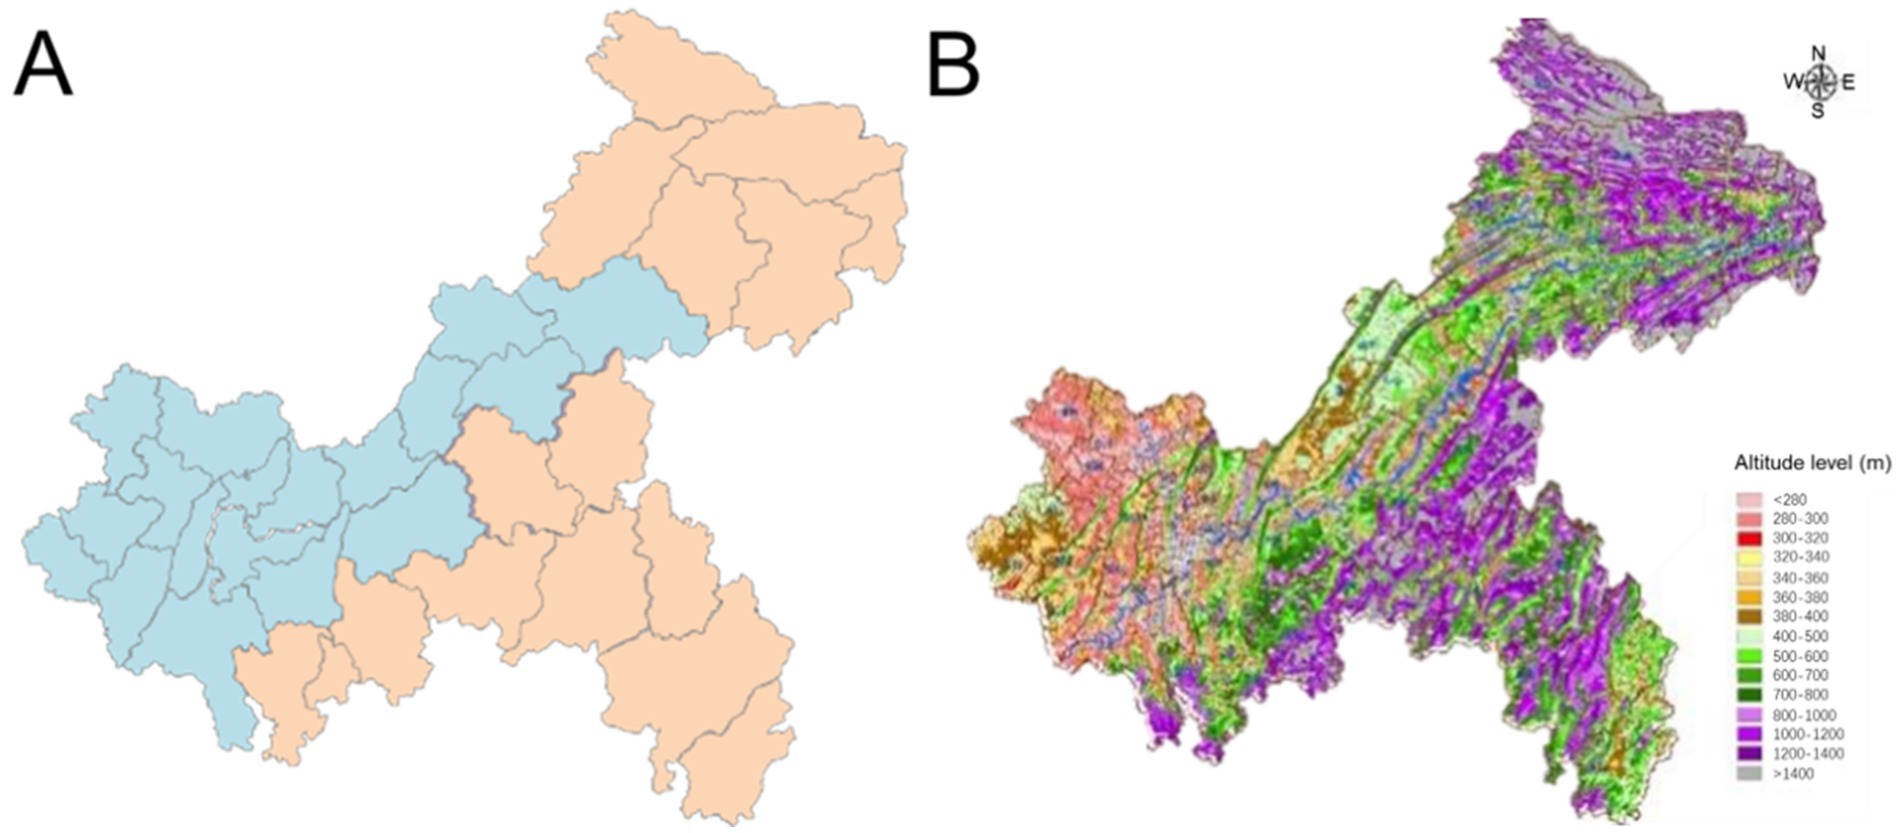
Figure 1. Regional distribution map (A) and geomorphic distribution map (B) of Chongqing: the blue area includes western-central region, and the orange area includes southern-northeastern region.
2.2.2 Yield level division
Rice yield levels were classified using field trials and survey data published by the Chongqing Agro-Tech Extension Station. In western-central Chongqing, the median yield (achieved by over 50% of surveyed farmers) was used as the mid-yield reference. Approximately half of the 2,978 rice farmers in this region achieved yields ranging from 7.5 to 9.0 t/ha, which corresponds to the mid-yield level (Supplementary Figure S2). Based on this reference level, an increase or decrease of 0.15 t/ha was used as the criteria to define high- or low-yield levels, respectively (Table 1). Similarly, in southern-northeastern Chongqing, based on data from 3,917 farmers, the mid-yield level was 6.75–8.25 t/ha, with high-yield at 8.25–9.75 t/ha and low-yield at 5.25–6.75 t/ha.
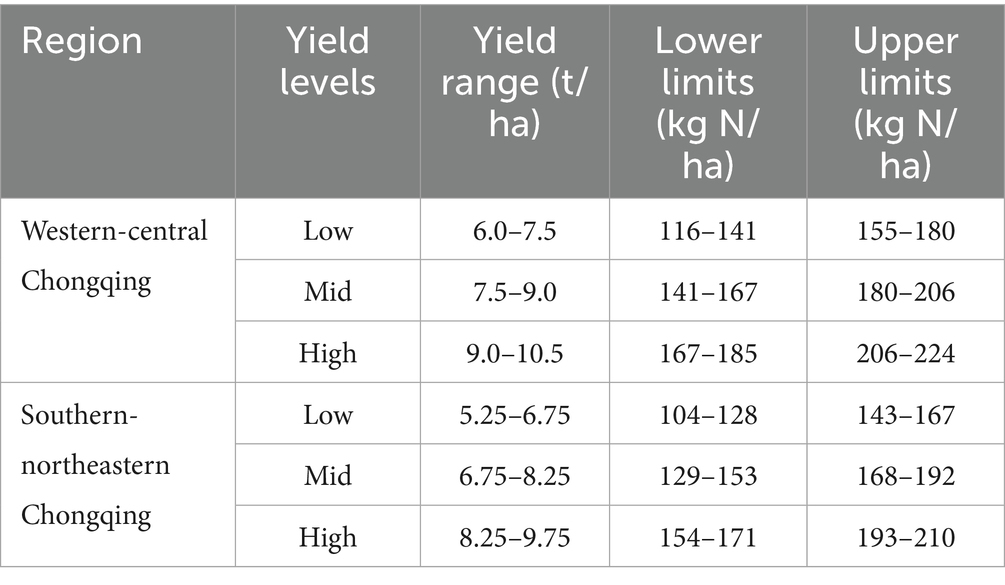
Table 1. Nitrogen fertilizer limits in rice production regions of Chongqing.
2.3 Principles for establishing fertilizer quota standards
Fertilizer rates for rice must simultaneously secure stable yields, maintain soil fertility, and protect the environment. The recommended N, P, and K inputs were calculated based on (i) the nutrients removed by the harvested crop, (ii) the intrinsic fertility of the paddy soil, and (iii) regional climatic and ecological constraints. To operationalize this balance, a scientifically derived upper limit is set to avoid the ecological risks of over-application, while a lower limit safeguards grain production and prevents rapid soil nutrient depletion.
2.3.1 Nitrogen fertilizer quota
The determination of the nitrogen fertilizer quota is made by considering both nitrogen uptake and nitrogen loss, refer to Wu et al. (2015). The formula for calculating N fertilizer quota was as follows Equations 1–3.
The N uptake per 100 kg of grain produced was calculated as the sum of the N contents in straw and grain at different yield levels (Supplementary Tables S1–S3). For N loss, we estimated that active N loss during the rice growing season was approximately 38.55 kg N/ha, or 25.7% of N fertilizer input, based on a N15 study conducted in Chongqing by Su et al. (2016).
2.3.2 Phosphate fertilizer quota
Phosphate fertilizer quotas were established to ensure a consistent phosphorus supply to crops by monitoring soil-available phosphorus through soil tests (Wu et al., 2015, 2016). By accounting for the difference between rice P uptake and soil available P content, we moderately increased the lower/upper limit of phosphate fertilizer for areas with low fertility by applying different compensation coefficients, to refine the approach initially proposed by Wu et al. (2016, 2015) (Supplementary Table S2). This approach helped to enhance soil fertility without exceeding environmental thresholds. The formula for calculating P fertilizer quota was as follow Equations 4–6:
The P uptake per 100 kg of grain produced was calculated as the sum of the P contents in the straw and grain at different yield levels (Supplementary Tables S1–S3). The soil fertility maintenance coefficient was set at 1.15, and the soil improvement coefficient was set at 1.3 (Supplementary Table S4; Wu et al., 2015, 2016).
2.3.3 Potassium fertilizer quota
Potassium fertilizer quotas were established based on crop yield response considering grain uptake and fertilization coefficients for potassium fertilizers, and the optimal economic return (Wu et al., 2015, 2016). The lower limit was determined by grain potassium uptake, while the upper limit was calculated based on the fertilization coefficient derived from the optimal economical return. The formula for calculating K fertilizer quota was as follows Equations 7–9:
The K uptake per 100 kg of grain produced was calculated as the sum of the K content in the straw and grain at different yield levels (Supplementary Tables S1–S3). To refine the approach initially proposed by Wu et al. (2016, 2015), the amount of potassium fertilizer applied should take into account the potassium application coefficient (0.42) to meet the sufficient nutrient requirements of crops in potassium-deficient areas. When soil available K content are sufficient, only the amount of potassium fertilizer taken away by crops needs to be considered.
2.4 Analysis of fertilizer reduction potentiality
All 6,895 farmer survey data were divided into three categories based on rice yield level as defined above for the two sub-regions, and then fertilizer reduction potential was calculated by comparing the actual N/P/K inputs with those based on the fertilizer quotas at respective yield levels. The formula for calculating fertilizer reduction potentiality was as follows Equations 10–12:
ai indicates the actual amount (kg/ha) of NPK fertilizer applied by a farmer, which is below the lower limit of the NPK fertilizer quota. ak indicates the actual amount (kg/ha) of NPK fertilizer application by a farmer, which exceeds the upper limit of the NPK fertilizer quota. In western-central Chongqing, the median application rates of N, P₂O₅, and K₂O were 159 kg/ha, 54 kg/ha, and 36 kg/ha, respectively, covering 494 thousand ha. The low-, middle-, and high-yield farmer counts were 697, 1,488, and 522, respectively. In southern-northeastern Chongqing, the median application rates of N, P₂O₅, and K₂O were 144 kg/ha, 54 kg/ha, and 19.5 kg/ha, covering 161 thousand ha. The low-, middle-, and high-yield farmer counts were 692, 1,488, and 857, respectively.
2.5 Evaluation of environmental costs for fertilizer reduction
Environmental cost assessment employed the LCA method (Li et al., 2021) to quantify soil acidification, reactive nitrogen (Nr) emissions, greenhouse gas (GHG) emissions, and water eutrophication in Chongqing’s rice production system. The study compared environmental benefits of reducing chemical fertilizer use under quota standards versus actual agricultural practices. The system boundary for this study encompassed the entire rice production process, from sowing to harvest, including the agricultural supplies stage and the farming stage. The agricultural materials stage (AMS) addressed emissions from producing and transporting inputs like fertilizers, pesticides, and films. The agricultural farming stage (AFS) focused on emissions from fertilizer and pesticide use, fuel consumption, and labor-related energy use. The system boundary and framework of the life cycle assessment (LCA) method in agricultural production were presented in Supplementary Figure S3.
The Soil Acidification Potential (SAP) was calculated using SO2 as the reference (Guan et al., 2022). The SAP for the entire rice production life cycle is determined using the following Equations 13, 14:
SAP was the soil acidification potential (SO2-eq kg/ha). The conversion factors for NH3 volatilization and NO2 emissions to SO2 were 1.88 and 0.7, respectively (Zhang et al., 2021). The factor for converting NH3–N to SO2 was 17/14. SO2–MS refers to SO2 emissions during the production and transportation of chemical fertilizers, calculated as SFi (SO2 emission coefficient) multiplied by Ratei (consumption of input category i). The SO2 emission coefficients of N, P, K fertilizers and other agricultural inputs were 2.52 × 10⁻², 6.00 × 10⁻⁴, 4.80 × 10⁻⁴, etc. (Supplementary Table S7). The application rates of N, P, K fertilizers and other agricultural inputs were presented in Supplementary Table S6.
The method in references (Cui et al., 2018; Wang et al., 2020) calculated Nr emissions using Equations 15–19.
NrMs loss referred to the reactive nitrogen emissions and losses during the production and transportation of agricultural inputs such as fertilizers, pesticides, diesel, and electricity (Supplementary Table S6). i (= 1, 2, 3, …) was the total number of each input item, including fertilizers, pesticides and agricultural films, etc. EFi was the emission factor for active nitrogen emissions or losses during the production and transportation of input i, and the Nr emission coefficients of N, P, K fertilizers and other agricultural inputs were 7.15 × 10⁻³, 1.84 × 10⁻⁴, 1.46 × 10⁻⁴, etc. (Supplementary Table S7); Ratei was the application amount of input i during crop production (Supplementary Table S6). N2O emission direct, N leaching, and NH3 volatilization represent the cumulative N2O emissions, N leaching losses, and NH3 volatilization from crop fertilization in agriculture.
Based on the research in reference (Wang et al., 2020), the formula for calculating GHG emissions in the entire life cycle of rice cultivation was as follows Equations 20–22:
GHGAMS included agricultural materials such as fertilizers, pesticides, and films. PECi denoted the GHG emission coefficient for input item i during production and transport, and the GHG emission coefficients of N, P, K fertilizers and other agricultural inputs were 8.30, 0.79, 0.55, etc. (Supplementary Table S7); Ratei indicated the usage amount of input item i in crop cultivation (Supplementary Table S6). N2O emission total was divided into direct and indirect pathways caused by nitrogen fertilizer application, with indirect coefficients of 1% for NH3 volatilization and 2.5% for NO3 leaching (Zhang et al., 2019). 44/28 was the molecular weight ratio of N2O–N to N2O. CH4 emissions referred to methane released during agriculture. Only rice production-related emissions were considered here, valued at 156.2 kg/ha × Area (CBCSD, 2011). Area represented the planted area of rice in Chongqing in 2020. 265 and 28, respectively, represented the global warming potential of N2O and CH4 (Cui et al., 2018).
Eutrophication Potential (EP) was calculated using PO4 as the reference (He et al., 2018). The eutrophication discharge for the entire rice production life cycle was calculated using Equations 23, 24:
EP was the potential for eutrophication (PO4-eq kg/ha). The conversion coefficients were 0.33 for NH3 volatilization and 0.42 for NO3 leaching to PO4 (Huijbregts et al., 2000). NH3–N converted to PO4 at a ratio of 17/14, and P total (total phosphorus application) converted to PO4 at a ratio of 95/31. PO4-MS represented emissions during fertilizer production and transport, with Pi was the emission coefficient for fertilizer category i and Ratei as its usage in Supplementary Table S6. The EP emission coefficients of N, P, K fertilizers and other agricultural inputs were 3.03 × 10⁻³, 7.67 × 10⁻⁵, 6.13 × 10⁻⁵, etc. (Supplementary Table S7). Leaching and runoff cause P losses of 0.23% of the input volume (Yao et al., 2019).
2.6 Statistical analysis
Data acquisition and statistical analyses were performed using Excel 2021 (Microsoft, USA). ANOVA, LSD, and sources of variation due to yield level and NPK application rate interaction were analyzed using SPSS 15.0 for Windows (IBM Corp., USA). Significance was assessed using the LSD test at p ≤ 0.05. Figures were created using OriginLab 2023b (OriginLab Cor., USA).
3 Results
3.1 Fertilizer quotas in major rice-producing regions of Chongqing
3.1.1 Nitrogen fertilizer limits
Nitrogen fertilizer quotas range from 104 to 224 kg N/ha, adjusted based on regional and yield differences (Table 1). In the western-central regions, for a rice yield level of 7.5–9.0 t/ha, the lower and upper limits of the N fertilizer quota were 141–167 kg N/ha and 180–206 kg N/ha, respectively. For yields of 9.0–10.5 t/ha, quotas range from 167–185 to 206–224 kg N/h. For yields of 6.0–7.5 t/ha, quotas range from 116–141 to 155–180 kg N/ha. In the southern-northeastern region, for rice yields of 6.75–8.25 t/ha, quotas range from 129–153 to 168–192 kg N/h. For yields of 8.25–9.75 t/ha, quotas range from 154–171 to 193–210 kg N/ha. For yields of 5.25–6.75 t/ha, quotas range from 104–128 to 104–128 kg N/ha.
3.1.2 Phosphate fertilizer limits
Phosphate fertilizer quotas for rice production in Chongqing were set between 44 and 98 kg P2O5/ha (Table 2). In the western-central region, for rice yields of 7.5–9.0 t/ha, the lower and upper limits of the phosphate quota were set at 60–72 kg P2O5/ha and 69–84 kg P2O5/ha, respectively. For yields of 6.0–7.5 t/ha, quotas ranged from 48–60 to 56–69 kg P2O5/ha; and for 9.0–10.5 t/ha, quotas ranged from 72–84 to 84–98 kg P2O5/ha. In the southern-northeastern region, for yields of 5.25–6.75 t/ha, quotas ranged from 44–56 to 50–65 kg P2O5/ha; for 6.75–8.25 t/ha, quotas ranged from 56–68 to 65–78 kg P2O5/ha; and for 8.25–9.75 t/ha, quotas ranged from 68–80 to 78–93 kg P2O5/ha.
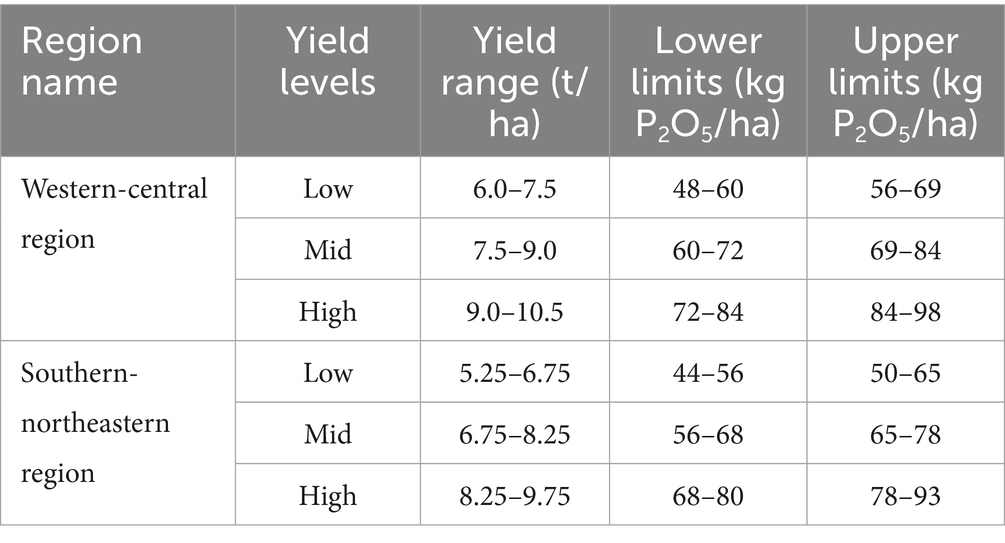
Table 2. Phosphate fertilizer limits in rice production regions of Chongqing.
3.1.3 Potassium fertilizer limits
Potassium fertilizer quotas in rice production in Chongqing were set from 18 to 111 kg K2O/ha, based on regions and yield levels (Table 3). In the western-central region: for yields of 6.0–7.5 t/ha, quotas were 20–80 kg K2O/ha; for 7.5–9.0 t/ha, quotas were 27–96 kg K2O/ha; for 6.0–7.5 t/ha, quotas were 30–111 kg K2O/ha. In the southern-northeastern region: for yields of 5.25–6.75 t/ha, quotas are 18–72 kg K2O/ha; for 6.75–8.25 t/ha, quotas were 23–87 kg K2O/ha; for 8.25–9.75 t/ha, quotas were 27–104 kg K2O/ha.
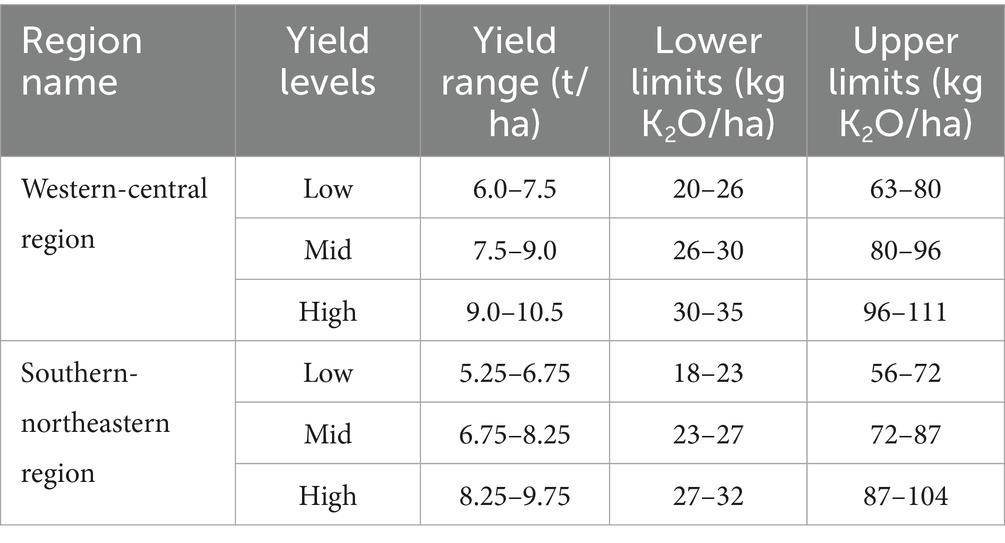
Table 3. Potassium fertilizer limits in rice production regions of Chongqing.
3.2 Analysis of N/P/K fertilizer reduction potentiality
3.2.1 Nitrogen fertilizer reduction potentiality
The potential for reducing nitrogen fertilizer use in rice production was mainly identified among low-yield farms, many of which exceeded the recommended upper limit. Low-yield farms could reduce nitrogen use by 9.7% in the western-central region and 15.7% in the southern-northeastern region. High-yield farms often required increased nitrogen application, while mid-yield farms applied reasonable rates with little reduction potential. Overall, Chongqing’s total N fertilizer use in rice production could be reduced by 1,862 tons, primarily in the western-central region. Specifically, reductions for low-yield farms were 1,424 tons in the western-central region and 439 tons in the southern-northeastern region (Table 4).
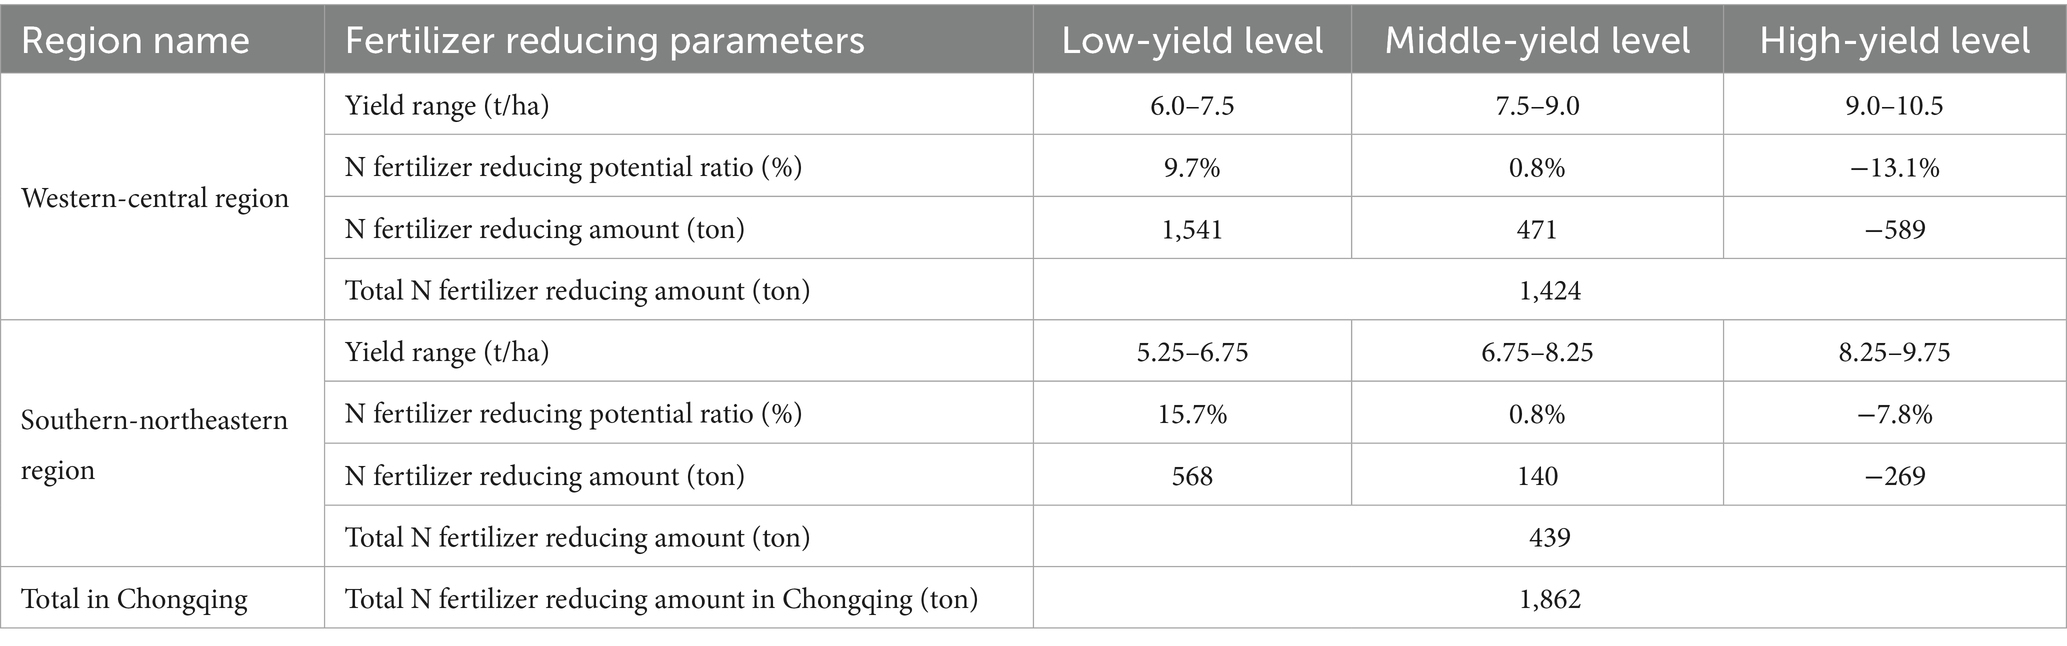
Table 4. Analysis of N fertilizer reduction potential for rice production regions of Chongqing.
3.2.2 Phosphate fertilizer reduction potential
Phosphate fertilizer reduction was feasible primarily on low-yield farms, with potential reductions of 5.9% (266 tons) in the western-central region and 26.6% (388 tons) in the southern-northeastern region (Table 5). High-yield farms required additional phosphate inputs: 133 tons in the western-central region and 167 tons in the southern-northeastern region. Mid-yield farms showed a reduction potential of −1.7% (−351 tons) in the western-central region, but 7.5% (521 tons) in the southern-northeastern region. Overall, the total P fertilizer reduction was −218 tons in the western-central region and 742 tons in the southern-northeastern region, resulting in a net total reduction of 524 tons for Chongqing (Table 5).
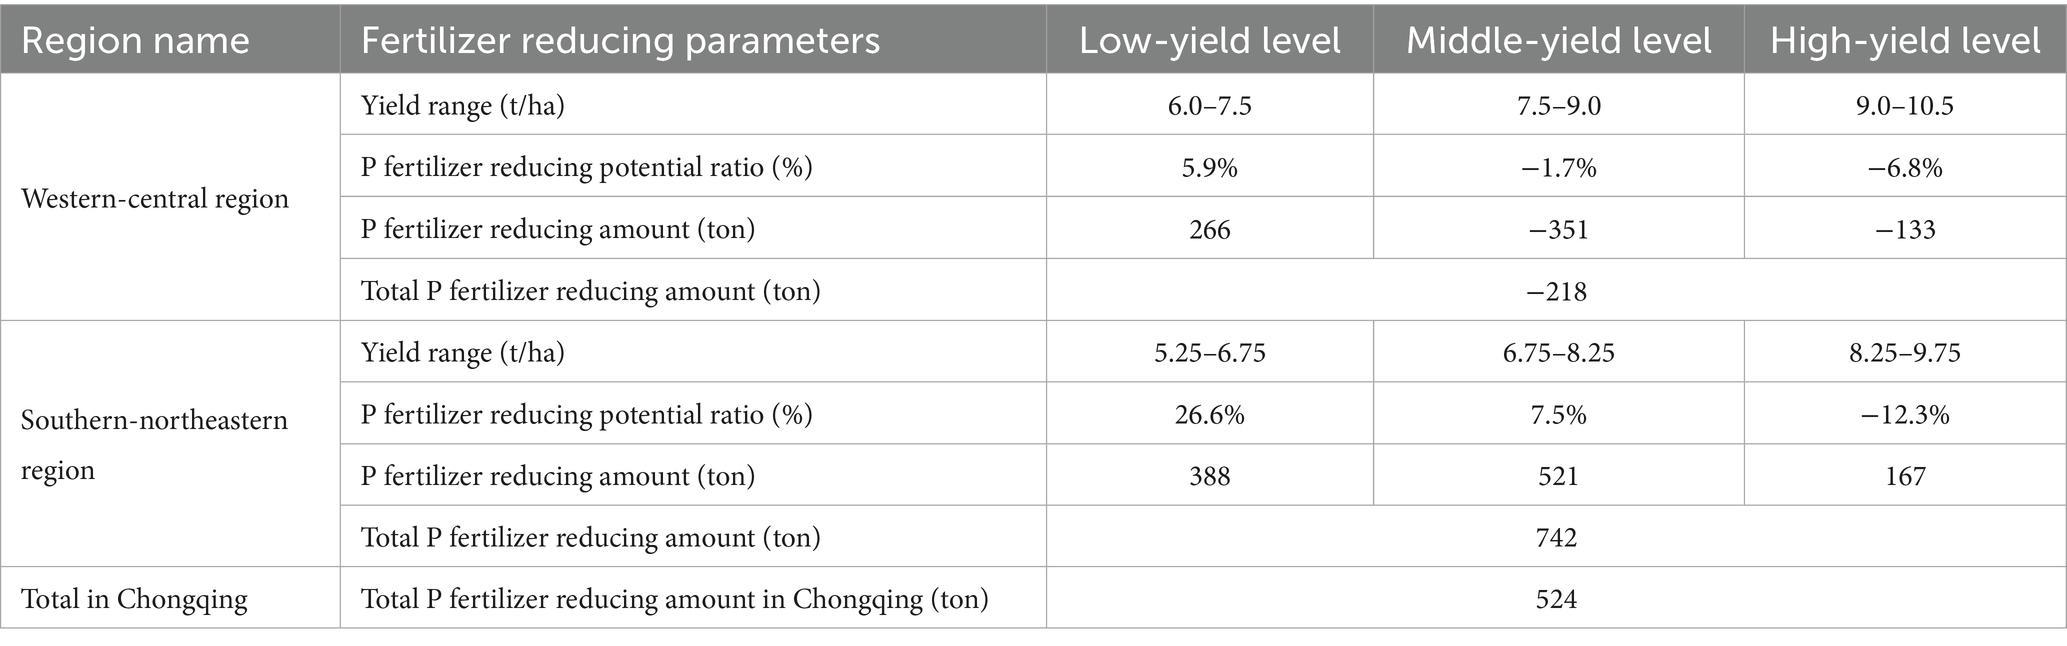
Table 5. Analysis of P fertilizer reduction potential for rice production regions of Chongqing.
3.2.3 Potassium fertilizer limits
The application of potassium fertilizer was slightly high, with significant potential for reduction. A certain amount of potassium fertilizer should be reduced. Specifically, in Western-central region, low-yield, mid-yield, and high-yield farms had reduction potentials of 5.9, 5.1, and 7.2%, respectively. In the southern-northeastern region, low-yield, mid-yield, and high-yield farmers in the same region had reduction potentials of 6.5, 7.1, and 3.4%, respectively. For rice production in Chongqing, the total potassium fertilizer reduction potential was 1,275 tons, with 989 tons in the western-central region and 286 tons in the southern-northeastern region (Table 6).
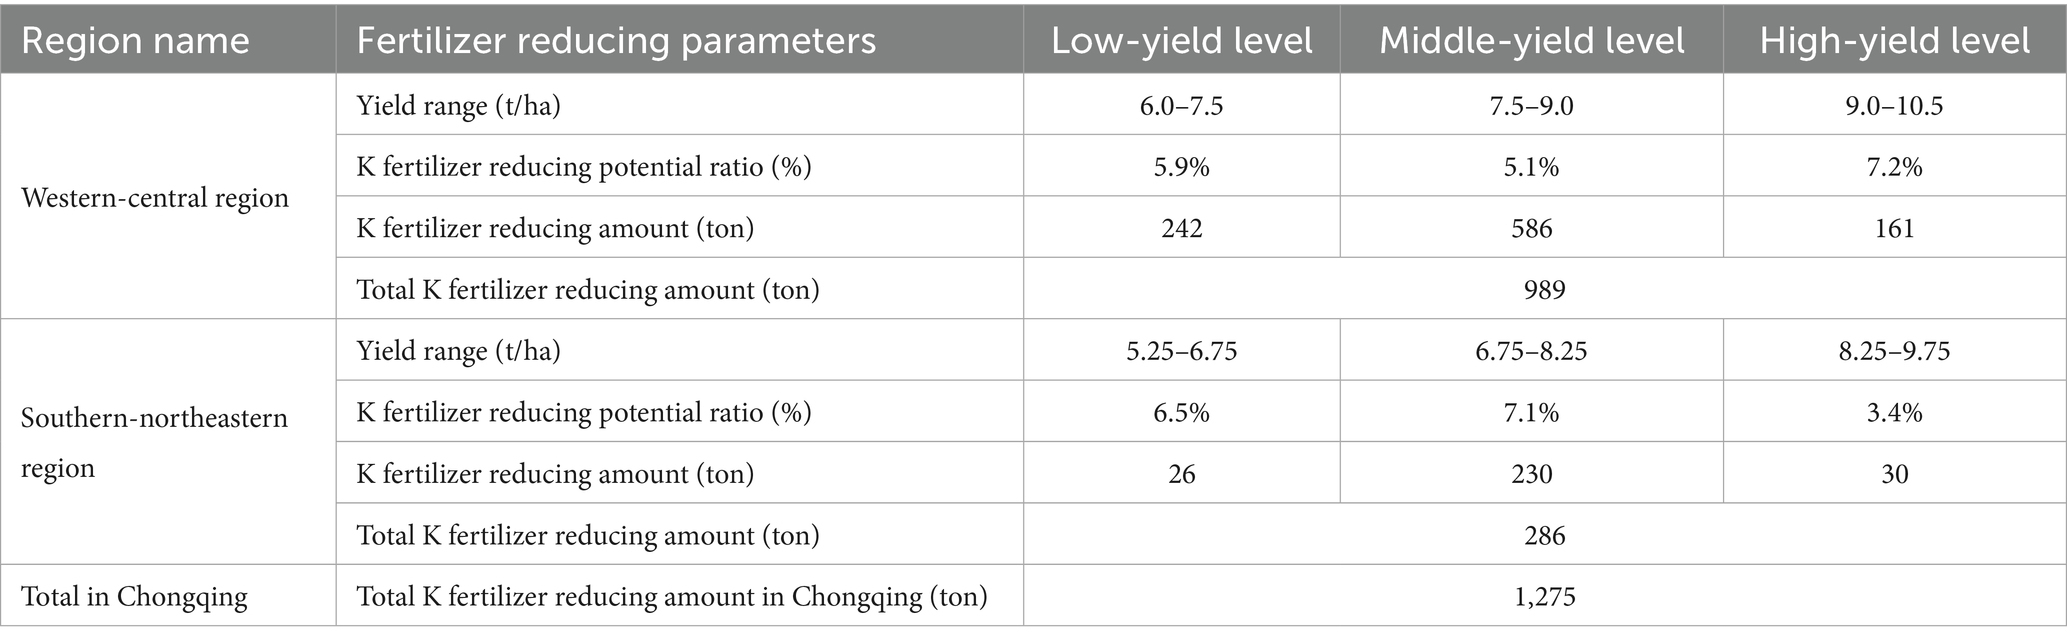
Table 6. Analysis of K fertilizer reduction potential for rice production regions of Chongqing.
3.3 Analysis of environmental costs
3.3.1 Soil acidification
Soil acidification potentials for low-, medium-, and high-yield rice cultivation were 88 SO2-eq kg/ha, 81 SO2-eq kg/ha, and 77 SO2-eq kg/ha in the Western-central Chongqing, and 77 SO2-eq kg/ha, 76 SO2-eq kg/ha, and 79 SO2-eq kg/ha in the Southern-Northeastern Chongqing (Figure 2A). The main contributor to acidification was N fertilizer from fertilizers during arable farming, accounting for 90–92% of the overall potential. The SAP in the low, medium, and high production areas of Chongqing were 1.18 × 10^4 SO2-eq kg/ha, 1.16 × 10^4 SO2-eq kg/ha, and 1.12 × 10^4 SO2-eq kg/ha, respectively (Figure 2B). Similarly, the lower limit fertilization treatment had a significant impact on low-yield areas, where the SAP decreased to 0.96 × 10^4 SO2-eq kg/ha, reducing the contribution rate from 34 to 28% (Figure 2C).
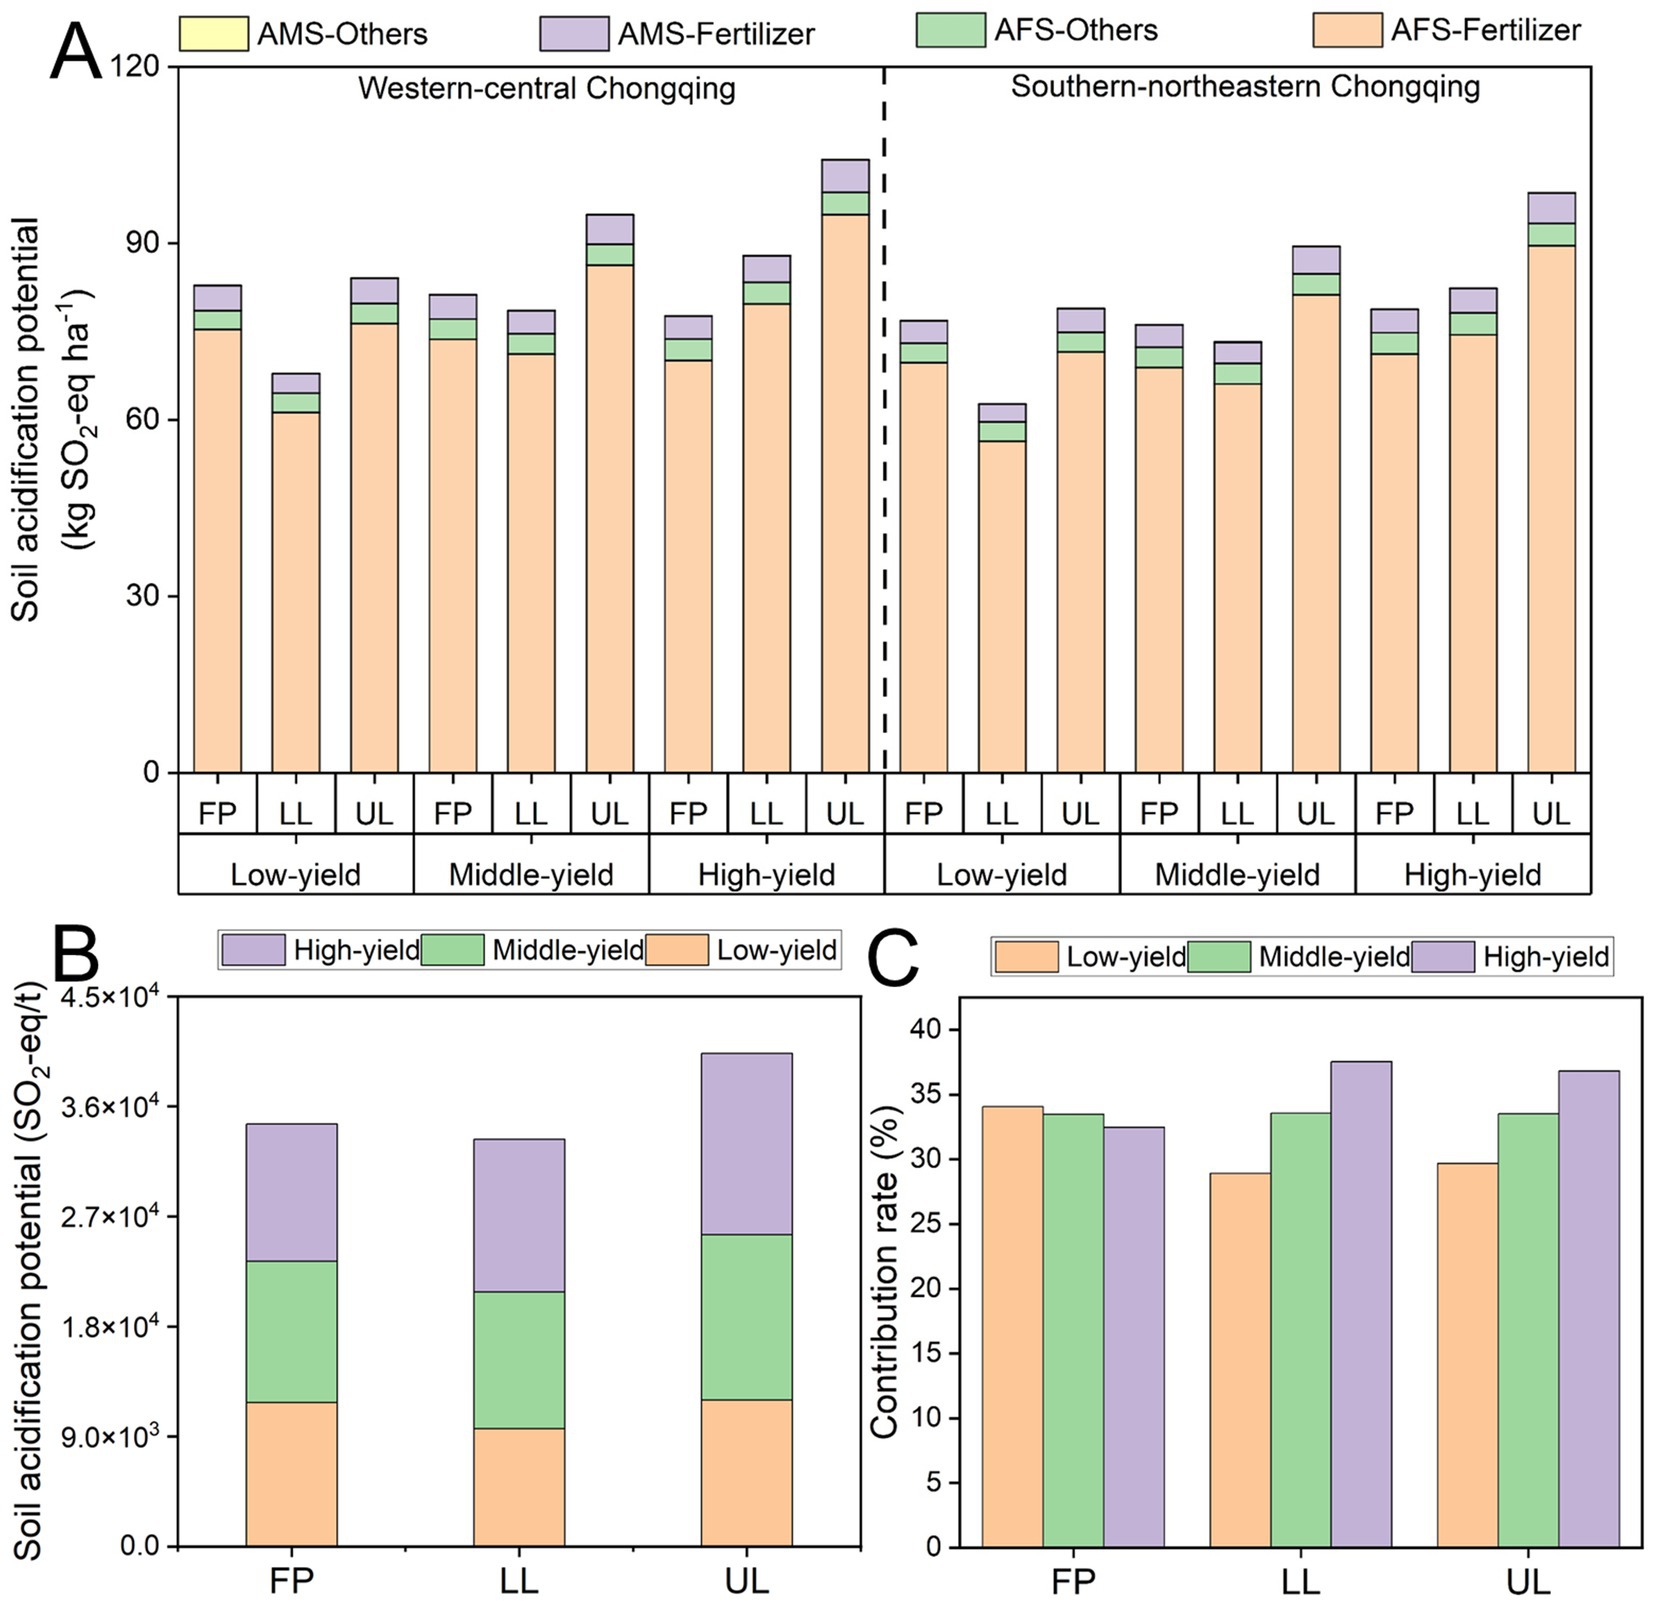
Figure 2. Soil acidification potential (A), varying production levels (B), and contribution rates (C) of the rice cultivation system under different fertilization models across various regions of Chongqing. FP is the farmers’ practice treatment; LL is the lower limit fertilization treatment; UL is the upper limit fertilization treatment. Each environmental impact includes impacts originating in the agricultural materials stage (AMS) and in the agricultural farming stage (AFS).
3.3.2 Nr losses
Currently, the ranking of reactive nitrogen emission intensity in the rice production process in Chongqing was as follows: low yield (39 N kg/ha) > medium yield (38 N kg/ha) > high yield (36 N kg/ha) in the Western-central region (Figure 3A). In the Southern-northeastern region, there was no statistically significant difference in reactive nitrogen emission intensity among low-yield (36 N kg/ha), medium-yield (36 N kg/ha), and high-yield (37 N kg/ha). Notably, the predominant emission source during the agricultural farming stage is NH3 volatilization, which accounts for over 83% of total emissions. The Nr losses in low-yield, medium-yield, and high-yield rice-growing areas in Chongqing were 5,545 N kg/ha, 5,438 N kg/ha, and 5,265 N kg/ha, respectively (Figure 3B). The primary impact of the lower limit fertilization treatment was observed in low-yield areas, where Nr losses decreased to 4,546 N kg/ha, reducing the contribution rate from 34 to 29% (Figure 3C).
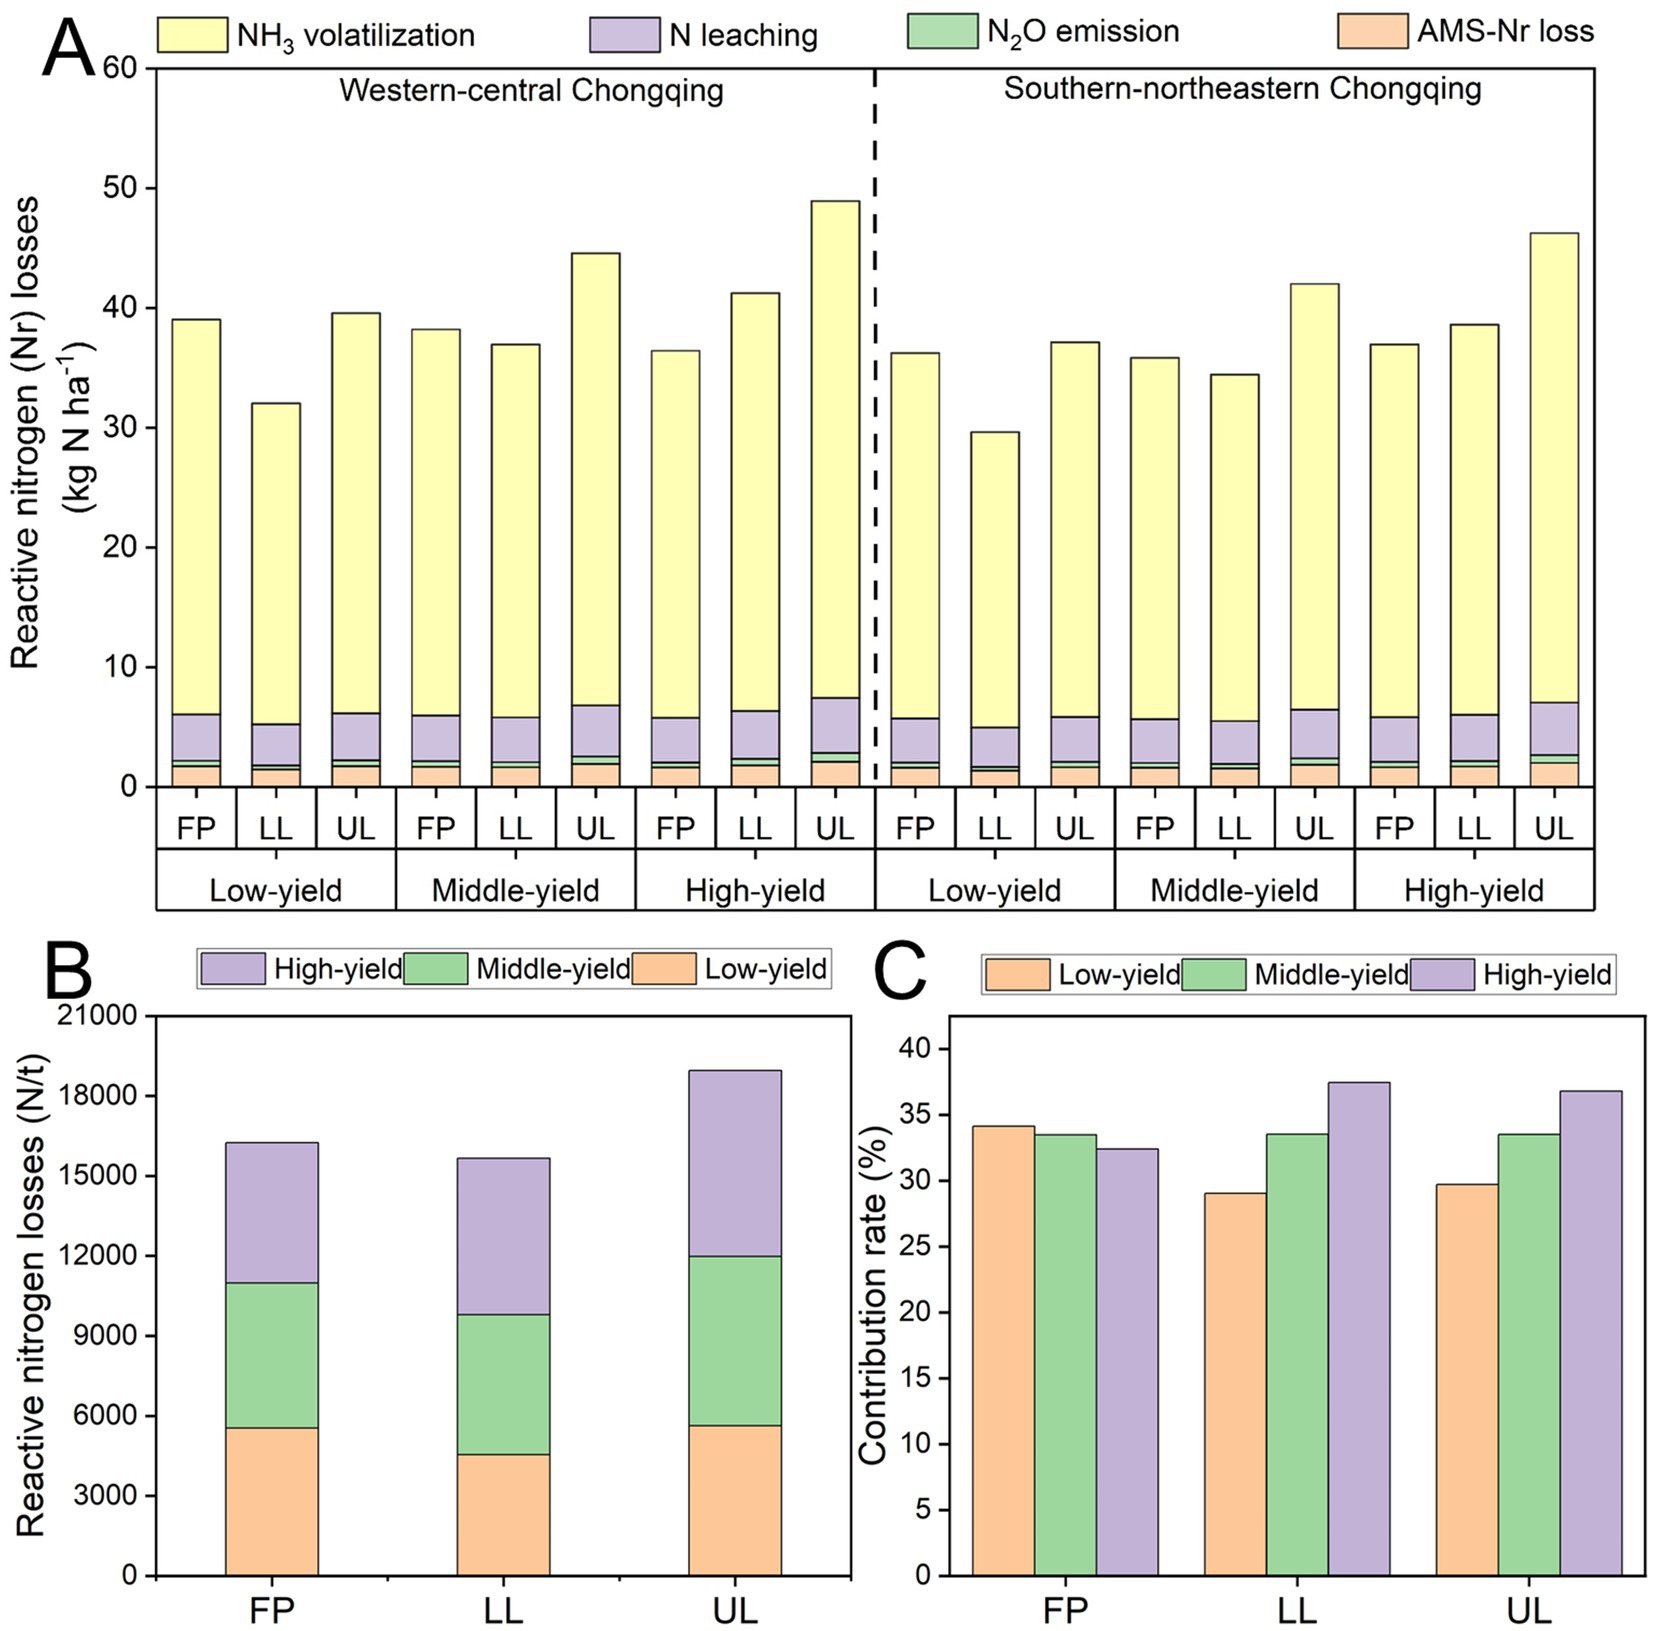
Figure 3. Reactive nitrogen losses (A), varying production levels (B), and contribution rates (C) of the rice cultivation system under different fertilization models across various regions of Chongqing. FP is the farmers’ practice treatment; LL is the lower limit fertilization treatment; UL is the upper limit fertilization treatment. Each environmental impact includes impacts originating in the agricultural materials stage (AMS) and in the agricultural farming stage (AFS).
3.3.3 GHG emission
In Chongqing, GHG emissions for low-, medium-, and high-yield rice cultivation were 6,548 CO2-eq kg/ha, 6,511 CO2-eq kg/ha, and 6,424 CO2-eq kg/ha in the Western-central region, and 6,397 CO2-eq kg/ha, 6,392 CO2-eq kg/ha, and 6,467 CO2-eq kg/ha in the Southern-Northeastern region (Figure 4A). These emissions were primarily driven by CH4 emissions during the agricultural farming stage (62–71%), followed by N fertilizer use during agricultural material production and transportation (16–25%). The GHG emissions in the low, medium, and high production areas of Chongqing were 9.39 × 10^4 CO2-eq kg/ha, 9.36 × 10^4 CO2-eq kg/ha, and 9.30 × 10^4 CO2-eq kg/ha, respectively (Figure 4B). Similarly, the main impact of the lower limit fertilization treatment was observed in low-yield areas, where GHG emission decreased to 8.83 × 10^4 CO2-eq kg/ha, reducing the contribution rate from 33 to 31% (Figure 4C).
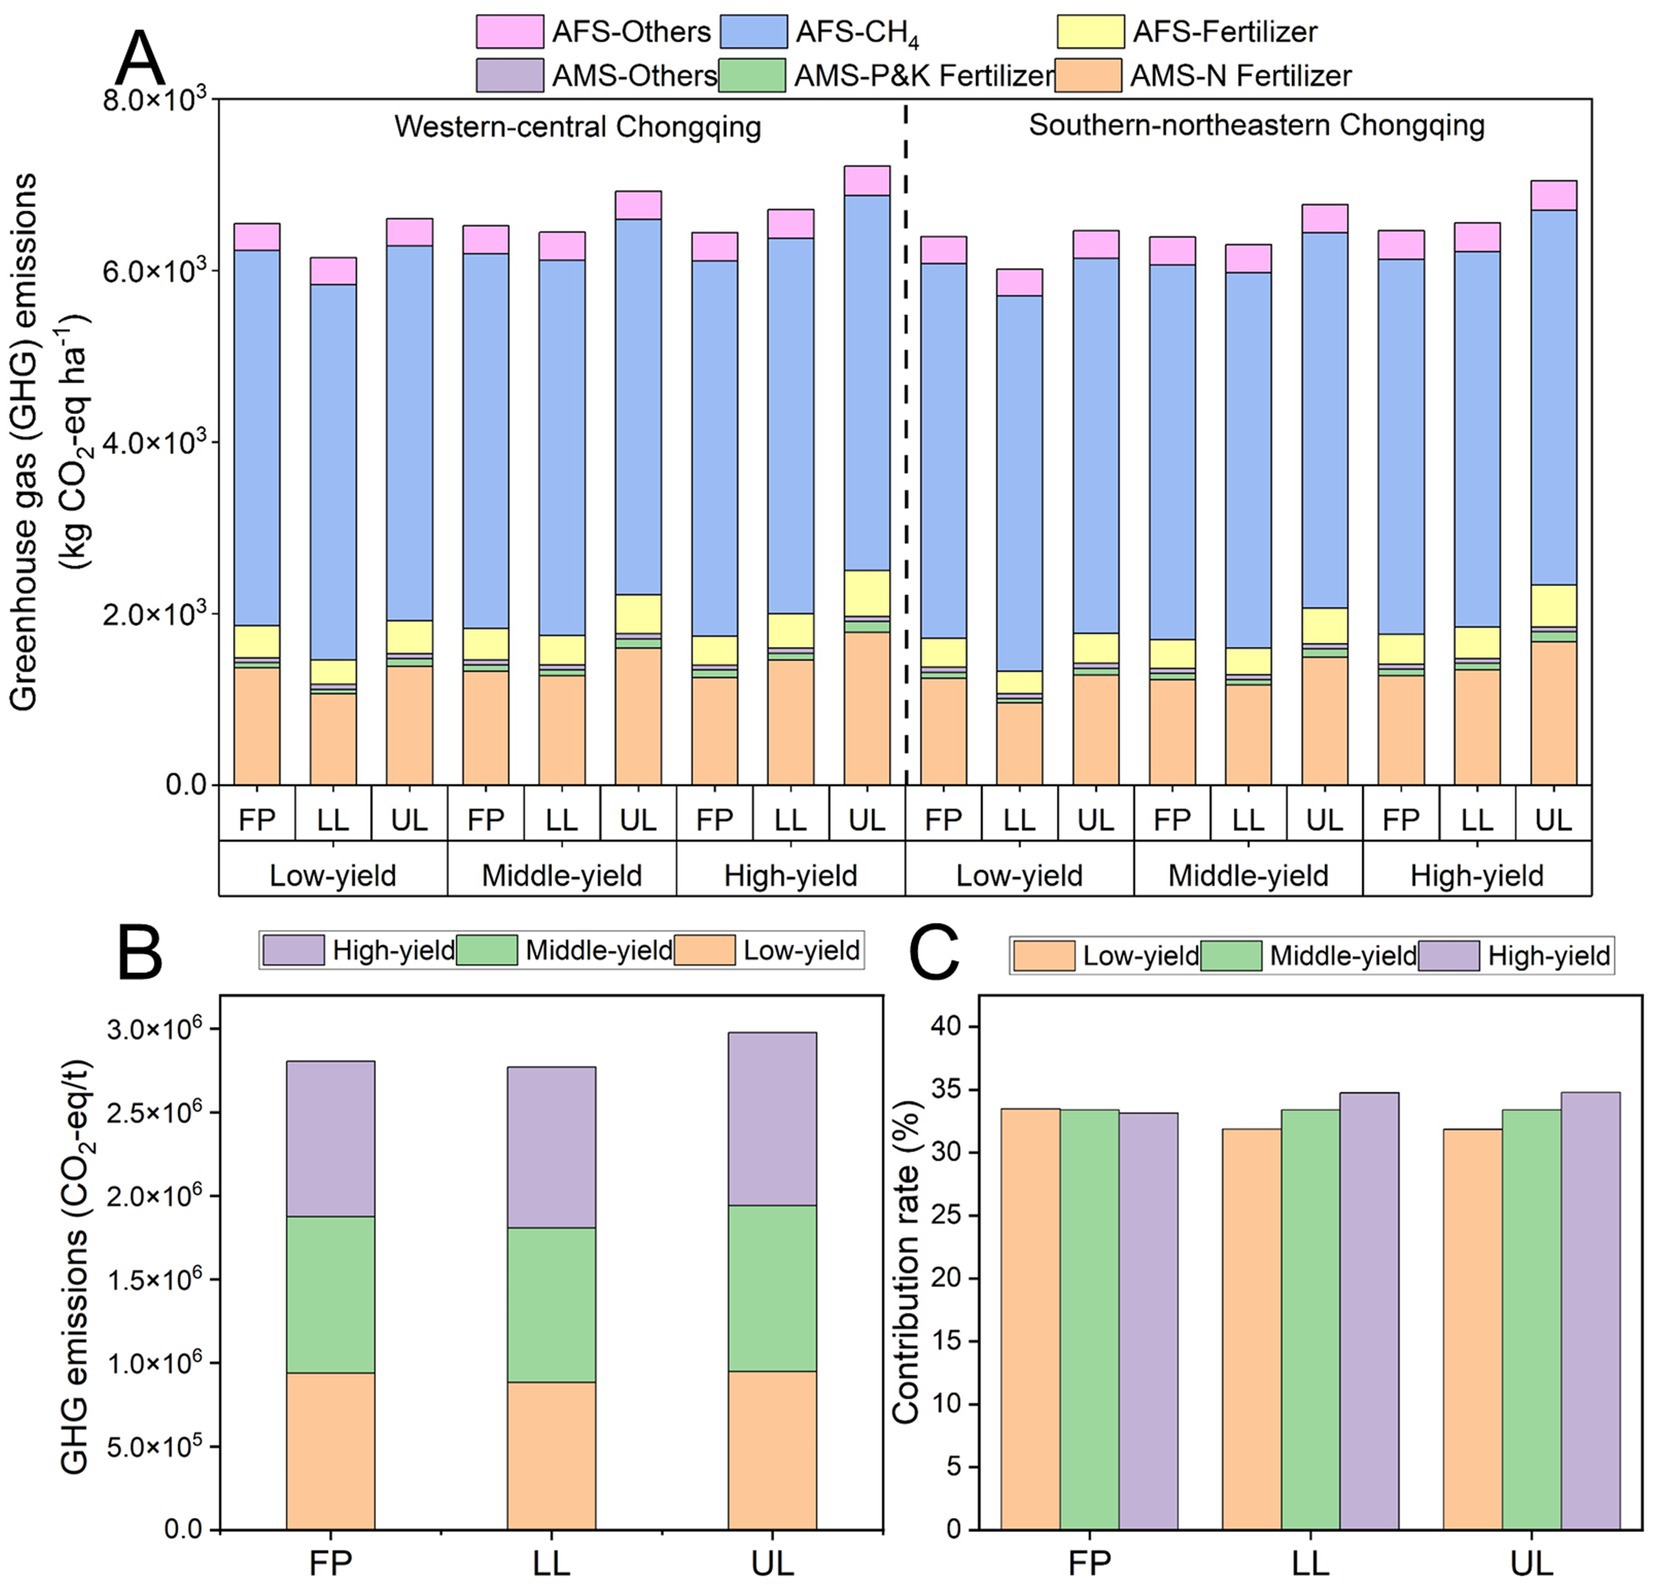
Figure 4. Greenhouse gas emissions (A), varying production levels (B), and contribution rates (C) of the rice cultivation system under different fertilization models across various regions of Chongqing. FP is the farmers’ practice treatment; LL is the lower limit fertilization treatment; UL is the upper limit fertilization treatment. Each environmental impact includes impacts originating in the agricultural materials stage (AMS) and in the agricultural farming stage (AFS).
3.3.4 Water eutrophication
In Chongqing’s rice production, water eutrophication potentials for low-, medium-, and high-yield regions were 21 PO4-eq kg/ha for low- and medium-yield regions and 22 PO4-eq kg/ha for high-yield regions in the Western-central area. In the Southern-Northeastern region, all yields have a potential of 21 PO4-eq kg/ha (Figure 5A). NH₃ volatilization and fertilizer-induced P loss during arable farming were the main sources of eutrophication, accounting for 57–63% and 25–32% of the total, respectively. The WEP in the low, medium and high production areas of Chongqing were 3,020 PO4-eq kg/ha, 3,075 PO4-eq kg/ha and 3,099 PO4-eq kg/ha, respectively, (Figure 5B). Similarly, the lower limit fertilization treatment had a significant impact on low-yield areas, where the SAP decreased to 2,588 PO4-eq kg/ha, reducing the contribution rate from 33 to 28% (Figure 5C).
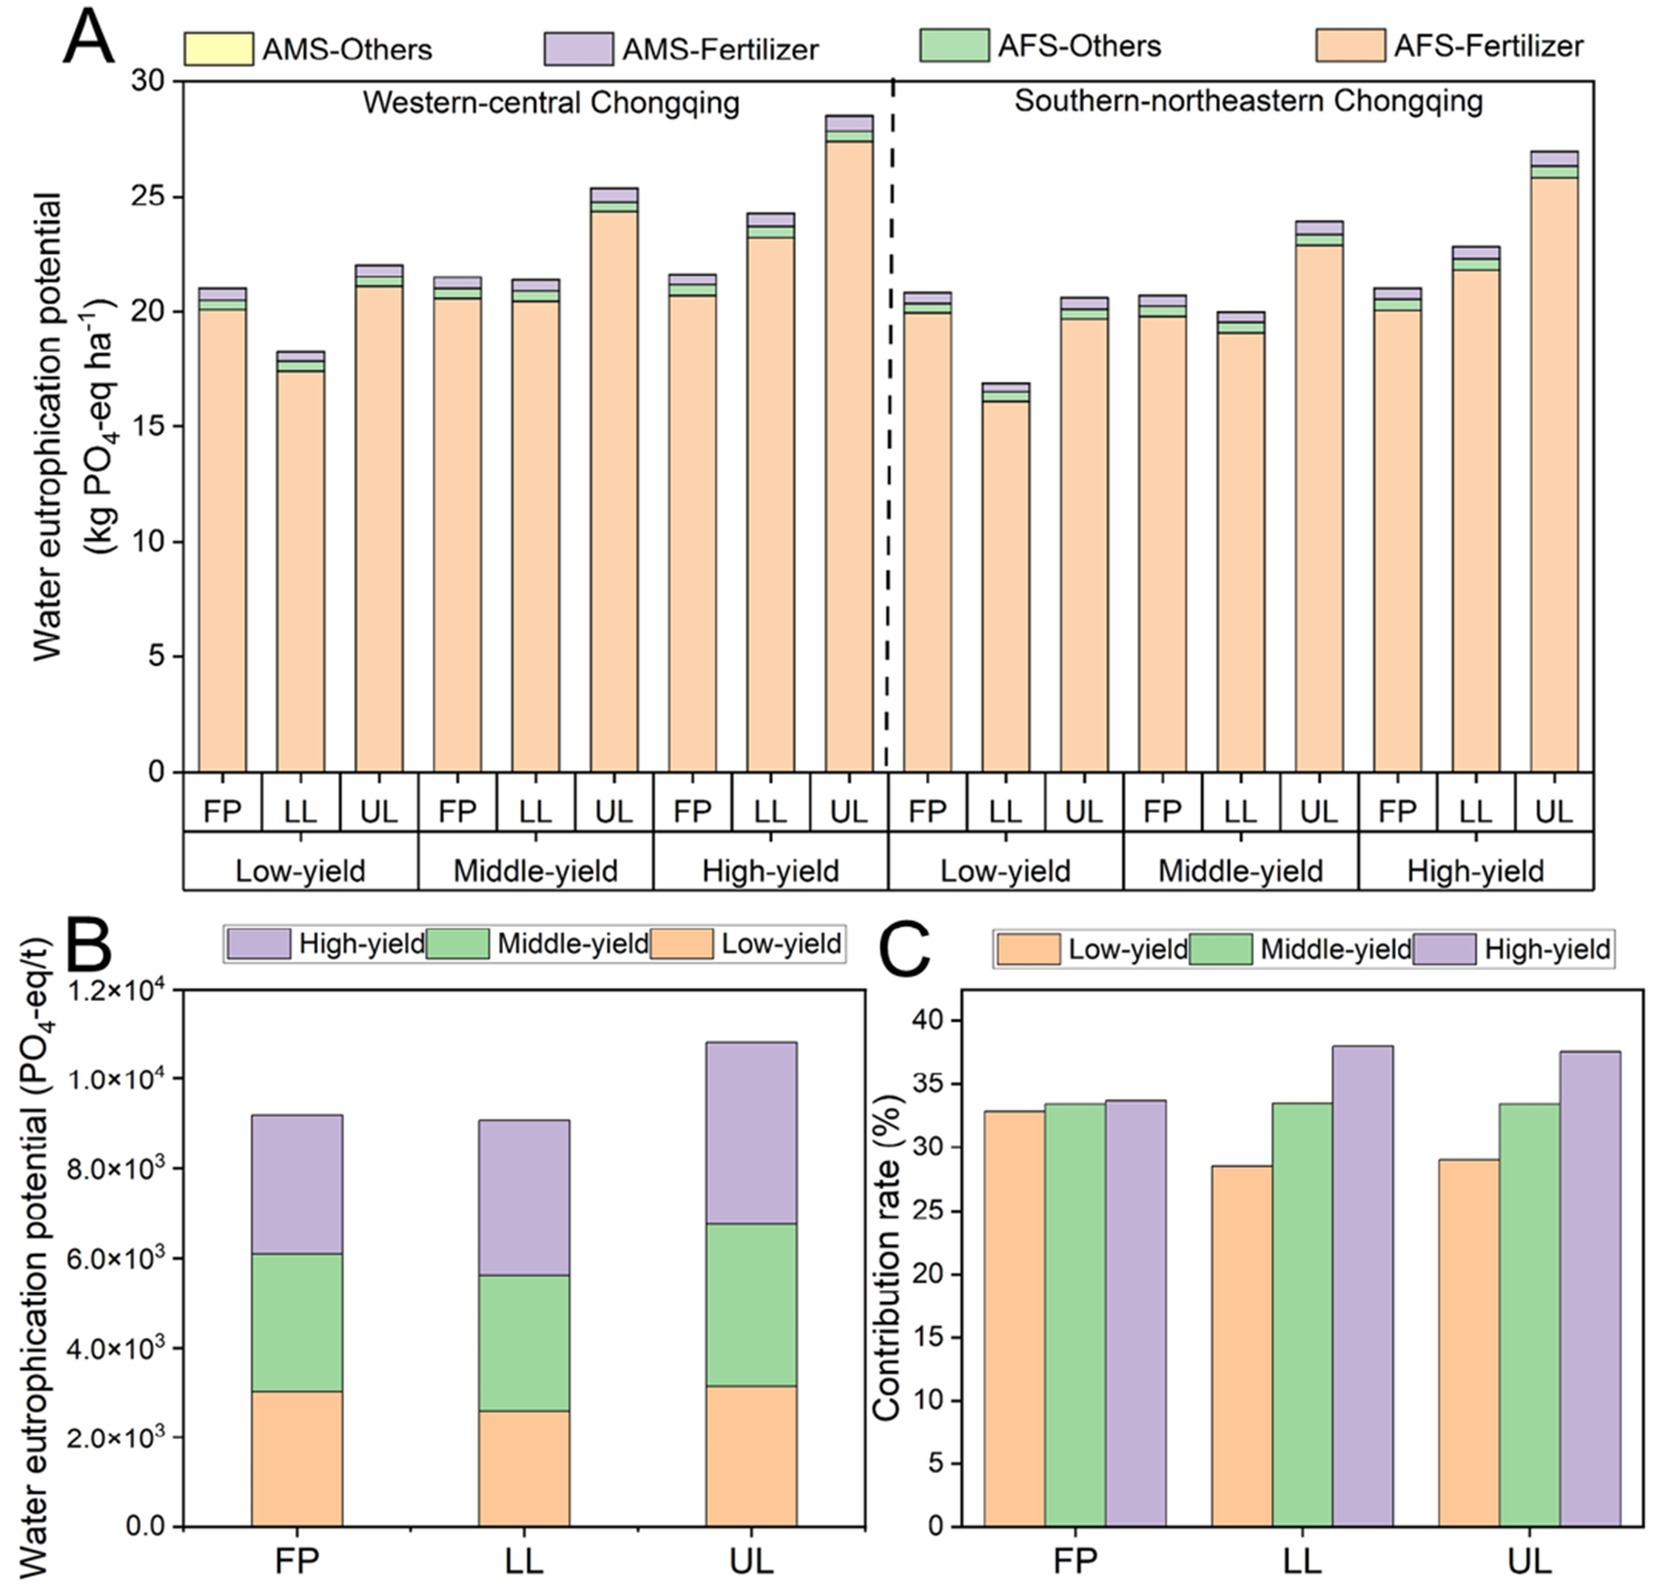
Figure 5. Water eutrophication potential (A), varying production levels (B), and contribution rates (C) of the rice cultivation system under different fertilization models across various regions of Chongqing. FP is the farmers’ practice treatment; LL is the lower limit fertilization treatment; UL is the upper limit fertilization treatment. Each environmental impact includes impacts originating in the agricultural materials stage (AMS) and in the agricultural farming stage (AFS).
4 Discussion
4.1 Effect of N fertilizer quota on optimal fertilizer application, yield and fertilizer reduction potentiality
Recommending fertilizer application rates based on varying regions and yield levels have become a key strategy for controlling chemical fertilizer use. Our study suggested N fertilizer rates of 104–171 kg N/ha as the lower limit and 143–224 kg N/ha as the upper limit in Chongqing (Table 1). The lower limit aligns with recommendations for single-cropping rice in the upper Yangtze region (90–210 kg N/ha) due to similar methods considering total N control and crop yield targets, and the upper limit is slightly higher to account for N loss (Wu et al., 2016). The lower Yangtze has more favorable climate, soil nutrients, and mechanization conditions than Chongqing, resulting in lower nitrogen fertilizer use (Ju et al., 2021). Conversely, it is higher than the range for double-season rice in the middle Yangtze region because single-cropping systems apply more nitrogen per season than double-cropping systems, which split applications twice a year (Shi et al., 2020). Optimizing the quota of nitrogen fertilizer can promote production and enhance fertilizer utilization efficiency. For example, Ren et al. (2022) reported that optimizing nitrogen fertilizer quotas in China could increase rice yield by 13%, reduce nitrogen use by 19%, and improve nitrogen use efficiency by 40%, effectively balancing food security and environmental protection. Under the new fertilizer quota restrictions, N fertilizer use in rice production in Chongqing is estimated to decrease by 1,862 tons, mostly in low-yield areas (2,109 tons) (Table 4). Liang et al. (2024) found a limited reduction potential of only 0.3% (290 tons) in rice fertilizer application. This approach underestimates the reduction potential in low-yield areas because it applies a uniform quota without yield classification. This study shows that high-yield farmers use insufficient fertilizer, while low-yield farmers overuse it. The analysis indicates that low-yield farmers believe increasing chemical fertilizer is the only way to boost yields, resulting in widespread over-application. Therefore, technical training should be prioritized to improve their understanding of scientific fertilization practices.
4.2 Effect of P fertilizer quota on optimal fertilizer application, yield and fertilizer reduction potentiality
Current official recommendations exhibit a lack of precision, which necessitates the re-evaluation of P fertilizer quota and the potential for fertilizer reduction based on regional quotas and yield levels (Chen D. et al., 2024). This study proposes region-specific P fertilizer application limits of 44–84 kg P2O5/ha (lower) and 50–98 kg P2O5/ha (upper), aligning with single-cropping rice guidelines (60–105 kg P2O5/ha) in the upper Yangtze region (Table 3). By integrating regional quota constraints and yield performance levels, this research quantifies region- and yield-specific potentials for reducing chemical fertilizer inputs. For instance, in the Western-Central region, potential reductions were estimated at 5.9, −1.7%, and −12.3% for low, medium, and high yield levels, respectively, while in the Southern-Northeastern region, corresponding reductions were 26.6, 7.5%, and −6.8% (Table 5). Similarly, low-yield farmers need to reduce the application of phosphorus fertilizer, while high-yield farmers need to increase it by a certain amount. In low-yield areas, the fixation of phosphorus fertilizer in paddy soil is often very significant, resulting in extremely poor effects from excessive application of conventional phosphorus fertilizer (Li et al., 2024). Optimizing P fertilizer management not only enhances crop yields but also mitigates environmental risks such as water eutrophication. For example, Mudare et al. (2022) highlighted global phosphorus imbalances and advocated for regional adjustments in fertilizer application to balance yield and ecological sustainability. European countries have successfully reduced agricultural impacts through nitrogen and phosphorus quotas, fertilizer accounting, and taxation policies (Li et al., 2017). Notably, the absence of defined lower phosphorus limits may reduce rice yields below 6.0 t/ha (Bateman et al., 2006; Knox et al., 2016). Therefore, defining appropriate upper and lower P limits based on local production conditions is essential for maintaining productivity and sustainability.
4.3 Effect of K fertilizer quota on optimal fertilizer application, yield and fertilizer reduction potentiality
In this study, the K fertilizer quota for rice in Chongqing ranged from 18 to 35 kg K2O/ha (lower limit) to 56–104 kg K2O/ha (upper limit), with an estimated reduction of 1,275 tons of K2O in rice production (Tables 3, 6). Compared with official guidelines, our proposed quota standard is more precise and better reflects yield variation, supporting further potassium reduction potential. Few studies have focused on potassium quotas and their impact on rice yield. Applying K fertilizer has shown significant benefits in improving rice growth and development, water and nutrient uptake, and ultimately improves rice yield (Liu Z. et al., 2025). Liu A. et al. (2025) also reported that potassium fertilizer not only significantly increased the yield but also improved the quality of grains, such as taste, starch and protein content. Additionally, with the promotion of the policy of returning straw to the fields, more potassium nutrients will return to the soil, leading to a further increase in its potential for reducing fertilizer application. Research on the balance between straw return and chemical fertilizer use indicates that straw incorporation can offset nearly all K2O (70–90%), most P2O5 (30–60%), and part of N (10–30%) from chemical fertilizers (Yin et al., 2018; Shao et al., 2023). Therefore, strengthening straw and agricultural waste recycling in Chongqing can further reduce K fertilizer use and promote green, sustainable agriculture.
4.4 Fertilizer quotas can effectively reduce farmland acidification and environmental impacts, though implementation remains challenging
In this study, we observed that fertilizer application rates in low-yield rice paddy fields were significantly higher compared to those in medium- and high-yield fields (Supplementary Table S6). This finding indicates the greatest potential for fertilizer reduction in this region, particularly for N and P fertilizers (Tables 4, 5). We propose new N and P fertilizer quotas (104–141 kg N/ha and 44–60 kg P₂O₅/ha), which reduced Nr loss, GHG emissions, SAP, and WEP by 18, 6, 18, and 14%, respectively (Figures 2–5). Compared with other alternative strategies, the quota recommendations of chemical fertilizers have certain advantages. Although the controlled-release fertilizer strategy reduces GHG emissions in rice fields by more than 20%, it increases the cost by approximately 40% (Ahmad et al., 2023; Gao et al., 2024). The substitution of organic fertilizers can reduce the emissions of Nr, SAP, and WEP, but significantly increase methane emissions by 33% (Dong et al., 2021). Water management could reduce the global net global warming potential (GWP) by 206%, but in some regions, it is unachievable due to water source and environmental issues (Belenguer-Manzanedo et al., 2022). Excessive N fertilizer degrades soil through nitrification and denitrification, releasing H+ and worsening acidification (Bouman et al., 1995; Ash, 2018). Long-term overuse of N fertilizer lowers soil pH, especially in regions like China where nitrogen use is high (Zhang et al., 2024). In Hainan Island, excessive N and P inputs have lowered soil pH by 0.3 units, reduced soil organic carbon by 20%, and degraded river water quality (Li T. et al., 2022). To address soil degradation and reduced yields caused by excessive fertilization in low-yield rice fields, implement a new fertilizer quota scheme to alleviate soil acidification, decline in land quality, and pollution from chemical fertilizers.
Although the pesticide limit has achieved some success (Skevas et al., 2012), there are still many challenges in the mandatory management of fertilizer quotas, especially in Chongqing. First, Chongqing’s diverse topography, soil types, and soil fertility make a uniform quota difficult to apply effectively across all areas. Second, many farmers still rely on traditional fertilization methods and lack knowledge of scientific practices. Third, there is no complete system or sufficient data for soil nutrient testing to support accurate quota setting. Fourth, the enforcement and supervision of policies are not strong enough. To improve the implementation of fertilizer quotas in Chongqing, local topography, agricultural technology, monitoring systems, and policy enforcement mechanisms should be fully considered. For example, it pilots a “soil-test and rebate” scheme in Chongqing: farmers who upload GPS-linked soil samples receive instant mobile cash transfers and precision-blended fertilizers. This initiative is financed by a levy on excess nitrogen (N) sales, which fosters township-level peer pressure and generates continuous data for adaptive quota adjustments. Although the current quotas are tailored to Chongqing’s agro-environmental conditions, the framework-based on stratified yield data, productivity targets, and environmental loss models-can be readily adapted to other regions by replacing yield curves, soil databases, and emission factors with local data. The experience from implementing fertilizer quota recommendations in Chongqing can inform policy development in other provinces or similar systems. For instance, Guizhou, which is also a mountainous and hilly area with limited arable land resources, can draw on Chongqing’s experience to implement the fertilizer quota recommendations, control the use of fertilizers and protect the ecological environment (Sui et al., 2022). Yunnan can draw on Chongqing’s experience to promote precise fertilization technology, improve the utilization rate of fertilizers and reduce pollution to the environment (Li et al., 2012). However, when promoting the adoption of this system, it is essential to fully consider local conditions and make appropriate adjustments and improvements accordingly. Concurrently, efforts should be directed toward exploring alternative strategies, such as precision fertilization techniques (Dong et al., 2020), the use of organic fertilizers as substitutes (Ashrafi Esfahani et al., 2019), and the broader promotion of advanced agricultural technologies (Chen Y. et al., 2024). These actions will reduce fertilizer use, improve efficiency, decrease paddy field acidification potential, and lower environmental costs.
5 Conclusion
This study established region- and yield-specific NPK fertilizer application quotas for rice production in Chongqing. Recommended ranges are N 104–185 kg/ha (lower limit) to 143–224 kg/ha (upper limit), P₂O₅ 44–84 kg/ha to 50–98 kg/ha, and K₂O 18–35 kg/ha to 56–111 kg/ha. Adoption of these limits could annually curtail fertilizer use by 1,862 tons of N, 524 tons of P2O5, and 1,275 tons of K2O. Notably, low-yield fields exhibited significantly higher fertilizer application rates compared to medium- and high-yield fields. Excessive N and P use exacerbates nitrogen losses, greenhouse gas emissions, soil acidification, and water eutrophication, leading to soil degradation. To address these issues, revised quotas for N (104–141 kg/ha) and P (44–60 kg P₂O₅/ha) were proposed. Implementing this strategy reduced Nr loss, GHG emissions, SAP, and WEP by 18, 6, 18, and 14%, respectively. The fertilizer quota system is a promising approach to mitigate agricultural land degradation in low-yield paddy fields. Furthermore, the fertilizer recommendations, research methodology, and policy instruments developed in this study can be effectively applied to other similar rice-producing regions.
Data availability statement
The original contributions presented in the study are included in the article/Supplementary material, further inquiries can be directed to the corresponding author.
Author contributions
YW: Project administration, Writing – review & editing, Conceptualization. DY: Writing – original draft, Methodology, Validation. SW: Data curation, Writing – original draft, Resources. JZ: Data curation, Resources, Writing – original draft. LC: Visualization, Writing – original draft, Investigation. DF: Validation, Formal analysis, Writing – original draft. TL: Conceptualization, Supervision, Writing – review & editing. LH: Conceptualization, Writing – review & editing, Funding acquisition.
Funding
The author(s) declare that financial support was received for the research and/or publication of this article. This work was supported by Scientific Research Special Project of Chongqing Academy of Agricultural Sciences (cqaas2023siczzd003), the special project of Chongging Municipal research finance (cqaas2022jxj1001) and the municipal fiscal projects of Chongqing municipality (KYLX20240500097).
Acknowledgments
We thank the Chongqing Agricultural Technology Extension Station and the agricultural and rural commissions of various districts and counties for their support in the field experiments and farmers’ surveys.
Conflict of interest
The authors declare that the research was conducted in the absence of any commercial or financial relationships that could be construed as a potential conflict of interest.
Generative AI statement
The authors declare that no Gen AI was used in the creation of this manuscript.
Any alternative text (alt text) provided alongside figures in this article has been generated by Frontiers with the support of artificial intelligence and reasonable efforts have been made to ensure accuracy, including review by the authors wherever possible. If you identify any issues, please contact us.
Publisher’s note
All claims expressed in this article are solely those of the authors and do not necessarily represent those of their affiliated organizations, or those of the publisher, the editors and the reviewers. Any product that may be evaluated in this article, or claim that may be made by its manufacturer, is not guaranteed or endorsed by the publisher.
Supplementary material
The Supplementary material for this article can be found online at: https://www.frontiersin.org/articles/10.3389/fsufs.2025.1669065/full#supplementary-material
References
Ahmad, S., Gao, S., Li, Q., Nadeem, M. Y., Tao, W., Yang, F., et al. (2023). Controlled-release potassium blended fertilizer mitigates greenhouse gas emissions in paddy fields. Nutr. Cycl. Agroecosyst. 127, 317–331. doi: 10.1007/s10705-023-10309-6
Ahvo, A., Heino, M., Sandström, V., Chrisendo, D., Jalava, M., and Kummu, M. (2023). Agricultural input shocks affect crop yields more in the high-yielding areas of the world. Nat. Food 4, 1037–1046. doi: 10.1038/s43016-023-00873-z
Ash, C. (2018). The future of farming. Science 362, 905.10–905.907. doi: 10.1126/science.362.6417.905-j
Ashrafi Esfahani, A., Niknejad, Y., Fallah, H., and Dastan, S. (2019). Integrated Management of Organic Manures and Chemical Fertilizers for Enhancing Paddy Yield and the Nutrient Content of Rice Cultivars. Commun. Soil Sci. Plant Anal. 50, 570–585. doi: 10.1080/00103624.2019.1573248
Bateman, I. J., Brouwer, R., Davies, H., Day, B. H., Deflandre, A., Falco, S. D., et al. (2006). Analysing the agricultural costs and non-market benefits of implementing the water framework directive. J. Agric. Econ. 57, 221–237. doi: 10.1111/j.1477-9552.2006.00049.x
Belenguer-Manzanedo, M., Alcaraz, C., Camacho, A., Ibáñez, C., Català-Forner, M., and Martínez-Eixarch, M. (2022). Effect of post-harvest practices on greenhouse gas emissions in rice paddies: flooding regime and straw management. Plant Soil 474, 77–98. doi: 10.1007/s11104-021-05234-y
Botterweg, P., Bakken, L., and Romstad, E. (1994). Nitrate leaching from agricultural soils: ecological modelling under different economic constraints. Ecol. Model. 75–76, 359–369. doi: 10.1016/0304-3800(94)90032-9
Bouman, O. T., Curtin, D., Campbell, C. A., Biederbeck, V. O., and Ukrainetz, H. (1995). Soil acidification from long-term use of anhydrous ammonia and urea. Soil Sci. Soc. Am. J. 59, 1488–1494. doi: 10.2136/sssaj1995.03615995005900050039x
CBCSD. (2011). Guidelines for Compiling Provincial Greenhouse Gas Inventories (Trial) [EB/OL]. Available at: http://www.cbcsd.org.cn/sjk/nengyuan/standard/home/20140113/download/shengjiwenshiqiti.pdf (accessed July 18, 2025).
Chakraborty, S., Tiwari, P. K., Sasmal, S. K., Misra, A. K., and Chattopadhyay, J. (2017). Effects of fertilizers used in agricultural fields on algal blooms. Eur. Phys. J. Spec. Top. 226, 2119–2133. doi: 10.1140/epjst/e2017-70031-7
Chen, D., Cheng, J., Wang, T., Song, L., Fang, Q., Xu, Z., et al. (2024). Spatial variation characteristics and influencing factors of soil available phosphorus in cultivated land in the Sichuan Basin. J. Plant Nutr. Fertil. 30, 1768–1781. doi: 10.11674/zwyf.2024121
Chen, Z., Li, X., Liu, T., Fu, H., Yuan, X., Cheng, Q., et al. (2023). Strategies for fertilizer management to achieve higher yields and environmental and fertilizer benefits of rice production in China. Sci. Total Environ. 904:166325. doi: 10.1016/j.scitotenv.2023.166325
Chen, Y., Sun, Z., Zhou, Y., Yang, W., and Ma, Y. (2024). The future of sustainable farming: an evolutionary game framework for the promotion of agricultural green production technologies. J. Clean. Prod. 460:142606. doi: 10.1016/j.jclepro.2024.142606
Cui, Z., Zhang, H., Chen, X., Zhang, C., Ma, W., Huang, C., et al. (2018). Pursuing sustainable productivity with millions of smallholder farmers. Nature 555, 363–366. doi: 10.1038/nature25785
Custodio, M. C., Demont, M., Laborte, A., and Ynion, J. (2016). Improving food security in Asia through consumer-focused rice breeding. Glob. Food Secur. 9, 19–28. doi: 10.1016/j.gfs.2016.05.005
Dong, Y., Fu, Z., Peng, Y., Zheng, Y., Yan, H., and Li, X. (2020). Precision fertilization method of field crops based on the wavelet-BP neural network in China. J. Clean. Prod. 246:118735. doi: 10.1016/j.jclepro.2019.118735
Dong, D., Li, J., Ying, S., Wu, J., Han, X., Teng, Y., et al. (2021). Mitigation of methane emission in a rice paddy field amended with biochar-based slow-release fertilizer. Sci. Total Environ. 792:148460. doi: 10.1016/j.scitotenv.2021.148460
Dong, Y., Liu, S., Hu, Y., Mulder, J., Adingo, S., Nie, Y., et al. (2025). Effects of long-term straw application and groundwater management on acidification of paddy soils in subtropical China: insight from a 35-year field experiment. Agric. Water Manag. 309:109337. doi: 10.1016/j.agwat.2025.109337
Dowd, B., Press, D., and Huertos, M. (2008). Agricultural nonpoint source water pollution policy: the case of California’s central coast. Agric. Ecosyst. Environ. 128, 151–161. doi: 10.1016/j.agee.2008.05.014
Drechsel, P., Madhuwanthi, P., Nisansala, D., Ramamoorthi, D., and Bandara, T. (2025). On the feasibility of an agricultural revolution: Sri Lanka’s ban of chemical fertilizers in 2021. Food Sec. 17, 585–602. doi: 10.1007/s12571-025-01528-6
Gao, Y., Shao, Y., Wang, J., Hu, B., Feng, H., Qu, Z., et al. (2024). Effects of straw returning combined with blended controlled-release urea fertilizer on crop yields, greenhouse gas emissions, and net ecosystem economic benefits: a nine-year field trial. J. Environ. Manag. 356:120633. doi: 10.1016/j.jenvman.2024.120633
Geng, N., Kang, X., Yan, X., Yin, N., Wang, H., Pan, H., et al. (2022). Biochar mitigation of soil acidification and carbon sequestration is influenced by materials and temperature. Ecotoxicol. Environ. Saf. 232:113241. doi: 10.1016/j.ecoenv.2022.113241
Guan, X., Liu, C., Li, Y., Wang, X., Liu, Y., Zou, C., et al. (2022). Reducing the environmental risks related to phosphorus surplus resulting from greenhouse cucumber production in China. J. Clean. Prod. 332:130076. doi: 10.1016/j.jclepro.2021.130076
Guo, Y., and Wang, J. (2021). Spatiotemporal Changes of Chemical Fertilizer Application and Its Environmental Risks in China from 2000 to 2019. IJERPH 18, 11911. doi: 10.3390/ijerph182211911
Han, Y., Yi, D., Ye, Y., Guo, X., and Liu, S. (2022). Response of spatiotemporal variability in soil pH and associated influencing factors to land use change in a red soil hilly region in southern China. Catena 212:106074. doi: 10.1016/j.catena.2022.106074
He, X., Qiao, Y., Liang, L., Knudsen, M. T., and Martin, F. (2018). Environmental life cycle assessment of long-term organic rice production in subtropical China. J. Clean. Prod. 176, 880–888. doi: 10.1016/j.jclepro.2017.12.045
Huang, M., Jiang, P., Shan, S., Gao, W., Ma, G., Zou, Y., et al. (2017). Higher yields of hybrid rice do not depend on nitrogen fertilization under moderate to high soil fertility conditions. Rice 10:43. doi: 10.1186/s12284-017-0182-1
Huijbregts, M. A. J., Thissen, U., Guinée, J. B., Jager, T., Kalf, D., Van De Meent, D., et al. (2000). Priority assessment of toxic substances in life cycle assessment. Part I: calculation of toxicity potentials for 181 substances with the nested multi-media fate, exposure and effects model USES–LCA. Chemosphere 41, 541–573. doi: 10.1016/S0045-6535(00)00030-8
Ju, C., Liu, T., and Sun, C. (2021). Panicle nitrogen strategies for nitrogen-efficient rice varieties at a moderate nitrogen application rate in the lower reaches of the Yangtze River, China. Agronomy 11:192. doi: 10.3390/agronomy11020192
Knox, J., Daccache, A., Hess, T., and Haro, D. (2016). Meta-analysis of climate impacts and uncertainty on crop yields in Europe. Environ. Res. Lett. 11:113004. doi: 10.1088/1748-9326/11/11/113004
Li, F., Feng, S., and Qu, F. (2017). Fertilizer reduction policies in developed countries: suitability and implications. J. Agric. Resour. Environ. 34, 15–23. doi: 10.13254/j.jare.2016.015410.11674/zwyf.2023160
Li, Y., Fredrich, K., Pan, J., David, R.-H., Su, Y., Andreas, W., et al. (2012). Fertilizer use patterns in Yunnan Province, China: implications for agricultural and environmental policy. Agric. Syst. 110, 78–89. doi: 10.1016/j.agsy.2012.03.011
Li, T., Hong, X., Liu, S., Wu, X., Fu, S., Liang, Y., et al. (2022). Cropland degradation and nutrient overload on Hainan Island: a review and synthesis. Environ. Pollut. 313:120100. doi: 10.1016/j.envpol.2022.120100
Li, B., Wang, Y., Hu, T., Qiu, D., Francis, F., Wang, S., et al. (2022). Root-associated microbiota response to ecological factors: role of soil acidity in enhancing citrus tolerance to Huanglongbing. Front. Plant Sci. 13:937414. doi: 10.3389/fpls.2022.937414
Li, F., Xiang, M., Liu, S., Lei, K., Shi, Z., Yang, J., et al. (2021). Life cycle assessment and fertilization scheme optimization of paddy field crops in South China. J. Clean. Prod. 325:129339. doi: 10.1016/j.jclepro.2021.129339
Li, Y., Xu, Z., Zhang, L., Chen, W., and Feng, G. (2024). Dynamics between soil fixation of fertilizer phosphorus and biological phosphorus mobilization determine the phosphorus budgets in agroecosystems. Agric. Ecosyst. Environ. 375:109174. doi: 10.1016/j.agee.2024.109174
Li, J., Zhang, M., Zhang, Z., Zhang, L., Yao, B., and Shen, J. (2019). NPK fertilizations recommended based on agronomic benefits on rice in Fujian. J. Agric. Sci. 34, 146–154. doi: 10.19303/j.issn.1008-0384.2019.02.002
Liang, T., Zhao, J., Li, H., Wang, Y., Cao, Z., Zhang, W., et al. (2024). Analysis on driving factors, reduction potential, and environmental effect of inorganic fertilizer input in Chongqing. Environ. Sci. 45, 364–375. doi: 10.13227/j.hjkx.202211280
Liu, A., Ye, T., Zhang, Y., Liao, S., and Li, X. (2025). Effects of potassium fertilization on grain yield, taste quality, and starch characteristics of rice (Oryza sativa L.) grain. J. Sci. Food Agric. 105, 3036–3044. doi: 10.1002/jsfa.14096
Liu, Z., Yuan, X., Zhang, Z., Yang, X., Ai, C., Wang, Z., et al. (2025). Revisiting potassium-induced impacts on crop production and soil fertility based on thirty-three Chinese long-term experiments. Field Crop Res. 322:109732. doi: 10.1016/j.fcr.2024.109732
Mudare, S., Kanomanyanga, J., Jiao, X., Mabasa, S., Lamichhane, J. R., Jing, J., et al. (2022). Yield and fertilizer benefits of maize/grain legume intercropping in China and Africa: a meta-analysis. Agron. Sustain. Dev. 42:81. doi: 10.1007/s13593-022-00816-1
Norse, D., and Ju, X. (2015). Environmental costs of China’s food security. Agriculture, Ecosystems & Environment 209, 5–14. doi: 10.1016/j.agee.2015.02.014
Qiu, M., Guo, Q., Liu, L., Yin, G., Liang, Y., and Zhang, L. (2022). Challenges and countermeasures to promote fertilizer quota use in Jiangsu Province. China Agric. Technol. Extens. 38, 53–56. doi: 10.3969/j.issn.1002-381X.2022.11.023
Ren, H., Han, K., Liu, Y., Zhao, Y., Zhang, L., He, Q., et al. (2021). Improving smallholder farmers’ maize yields and economic benefits under sustainable crop intensification in the North China plain. Sci. Total Environ. 763:143035. doi: 10.1016/j.scitotenv.2020.143035
Ren, K., Xu, M., Li, R., Zheng, L., Liu, S., Reis, S., et al. (2022). Optimizing nitrogen fertilizer use for more grain and less pollution. J. Clean. Prod. 360:132180. doi: 10.1016/j.jclepro.2022.132180
Rougoor, C. W., Van Zeijts, H., Hofreither, M. F., and Bäckman, S. (2001). Experiences with fertilizer taxes in Europe. J. Environ. Plan. Manag. 44, 877–887. doi: 10.1080/09640560120087615
Sha, W., Chen, F., and Mishra, A. K. (2019). Adoption of direct seeded rice, land use and enterprise income: evidence from Chinese rice producers. Land Use Policy 83, 564–570. doi: 10.1016/j.landusepol.2019.01.039
Shao, J., Gao, C., Afi Seglah, P., Xie, J., Zhao, L., Bi, Y., et al. (2023). Analysis of the available straw nutrient resources and substitution of chemical fertilizers with straw returned directly to the field in China. Agriculture 13:1187. doi: 10.3390/agriculture13061187
Shi, X., Hu, K., Batchelor, W. D., Liang, H., Wu, Y., Wang, Q., et al. (2020). Exploring optimal nitrogen management strategies to mitigate nitrogen losses from paddy soil in the middle reaches of the Yangtze River. Agric. Water Manag. 228:105877. doi: 10.1016/j.agwat.2019.105877
Skevas, T., Stefanou, S. E., and Lansink, A. O. (2012). Can economic incentives encourage actual reductions in pesticide use and environmental spillovers? Agric. Econ. 43, 267–276. doi: 10.1111/j.1574-0862.2012.00581.x
Su, M., Kuang, F., Lv, Y., Zhao, Y., Fu, X., Li, Q., et al. (2016). Impact of N fertilization on CH4 emission from paddy field under different rotation systems. J. Plant Nutr. 22, 913–920. doi: 10.11674/zwyf15472
Sui, C., Guan, X., Zhang, W., Zeng, B., Zhang, Q., Luo, L., et al. (2022). Tea plant growth and soil nutrients in response to the application of fertilizer in Guizhou province, China. Agron. J. 114, 2011–2020. doi: 10.1002/agj2.20982
Wang, X., Liu, B., Wu, G., Sun, Y., Guo, X., Jin, G., et al. (2020). Cutting carbon footprints of vegetable production with integrated soil - crop system management: a case study of greenhouse pepper production. J. Clean. Prod. 254:120158. doi: 10.1016/j.jclepro.2020.120158
Wu, Z., Sun, X., Sun, Y., Yan, J., Zhao, Y., and Chen, J. (2022). Soil acidification and factors controlling topsoil pH shift of cropland in Central China from 2008 to 2018. Geoderma 408:115586. doi: 10.1016/j.geoderma.2021.115586
Wu, L., Wu, L., Cui, Z., Chen, X., and Zhang, F. (2015). Basic NPK fertilizer recommendation and fertilizer formula for maize production regions in China. Acta Pedol. Sin. 52, 802–817. doi: 10.11766/trxb201409230480
Wu, L., Wu, L., Cui, Z., Chen, X., and Zhang, F. (2016). Studies on recommended nitrogen, phosphorus and potassium application rates and special fertilizer formulae for different rice production regions in China. J. China Agric. Univ. 21, 01–13. doi: 10.11841/j.issn.1007-4333.2016.09.01
Yang, D., Liu, X., Chen, H., and Yu, Y. (2023). Effect of quota-based fertilization on soil and ecological environment: research progress. Chin. Agric. Sci. Bull. 39, 91–98. doi: 10.11924/j.issn.1000-6850.casb2023-0384
Yao, J., Guo, H., Ni, X., Wang, F., Zheng, H., Yang, H., et al. (2019). Influence of different crop rotations and fertilization methods on nitrogen and phosphorus runoff losses in Erhai Lake basin, China. J. Agric. Resour. Environ. 36, 600–613. doi: 10.13254/j.jare.2019.0039
Ye, J., Wang, Y., Wang, Y., Hong, L., Jia, X., Kang, J., et al. (2022). Improvement of soil acidification in tea plantations by long-term use of organic fertilizers and its effect on tea yield and quality. Front. Plant Sci. 13:1055900. doi: 10.3389/fpls.2022.1055900
Yin, H., Zhao, W., Li, T., Cheng, X., and Liu, Q. (2018). Balancing straw returning and chemical fertilizers in China: role of straw nutrient resources. Renew. Sust. Energ. Rev. 81, 2695–2702. doi: 10.1016/j.rser.2017.06.076
Zhang, W., Qian, C., Carlson, K. M., Ge, X., Wang, X., and Chen, X. (2021). Increasing farm size to improve energy use efficiency and sustainability in maize production. Food Energy Secur. 10:e271. doi: 10.1002/fes3.271
Zhang, G., Sun, B., Zhao, H., Wang, X., Zheng, C., Xiong, K., et al. (2019). Estimation of greenhouse gas mitigation potential through optimized application of synthetic N, P and K fertilizer to major cereal crops: a case study from China. J. Clean. Prod. 237:117650. doi: 10.1016/j.jclepro.2019.117650
Zhang, L., Zhao, Z., Jiang, B., Baoyin, B., Cui, Z., Wang, H., et al. (2024). Effects of long-term application of nitrogen fertilizer on soil acidification and biological properties in China: a meta-analysis. Microorganisms 12:1683. doi: 10.3390/microorganisms12081683
Keywords: N/P/K quota-based fertilization, fertilization reduction, rice, soil fertility maintenance, paddy field acidification, life cycle assessment, nutrient management
Citation: Wang Y, Yu D, Wang S, Zhao J, Chen L, Fu D, Liang T and Hu L (2025) NPK quota-based fertilization: a sustainable strategy for enhancing fertilizer efficiency and mitigating paddy field acidification and environmental costs in Chongqing. Front. Sustain. Food Syst. 9:1669065. doi: 10.3389/fsufs.2025.1669065
Edited by:
Xiaoyu Wang, Hunan Academy of Agricultural Sciences (CAAS), ChinaReviewed by:
Yi Xu, China Agricultural University, ChinaTongcheng Fu, Hunan Agricultural University, China
QIqi Liu, Yueyang Academy of Agriculture Sciences and Research, China
Copyright © 2025 Wang, Yu, Wang, Zhao, Chen, Fu, Liang and Hu. This is an open-access article distributed under the terms of the Creative Commons Attribution License (CC BY). The use, distribution or reproduction in other forums is permitted, provided the original author(s) and the copyright owner(s) are credited and that the original publication in this journal is cited, in accordance with accepted academic practice. No use, distribution or reproduction is permitted which does not comply with these terms.
*Correspondence: Liujie Hu, aHVsaXVqaWVAY3FhYXMuY24=
†These authors have contributed equally to this work