 Raga M. Elzaki
 Mohammed Al-Mahish
 Nahed M. Rashed2
- 1Department of Agribusiness and Consumer Science, College of Agricultural Sciences and Food, King Faisal University, Al-Ahsa, Saudi Arabia
- 2Department of Arid Land Agriculture, College of Agricultural Sciences and Food, King Faisal University, Al-Ahsa, Saudi Arabia
Introduction: Saudi Arabia's agricultural sector has undergone significant transformation over the past few decades, driven by government policies, technological advancements, and changing economic priorities. Despite environmental constraints, Saudi Arabia has achieved notable advances in fruit production; therefore, this study aims to analyze the long-run and short-run dynamics between fruit production and GDP in Saudi Arabia.
Methods: This study investigates the cointegration relationship between GDP and fruit production in Saudi Arabia using annual time series data over 1970–2023. The study applies the Vector Error Correction Model (VECM) to explore long and short-run dynamics.
Results: The results confirm a long-run equilibrium relationship among the variables. Grapes and dates production exhibit significant interactions with GDP in the short and long term, while watermelon production shows mixed effects but potential for long-term contribution. Moreover, the error correction term (ECT) confirmed that short-term disequilibrium between GDP and fruit production is corrected over time.
Conclusion: The GDP is self-driven but also influenced by grapes and dates production shocks. Forecasting performance was strongest for dates and watermelon production. The study recommends enhancing productivity through crop diversification, shifting to higher-value varieties, and improving market integration for dates production. Future research should incorporate variables such as climate change, trade policy, and input costs further to investigate the elasticity of watermelon production relative to GDP.
1 Introduction
Historically, agriculture has been essential to a country's economic growth by promoting trade diversification, job creation, and food security (FAO, 2024; Corigliano et al., 2025). Although Saudi Arabia is traditionally known for its oil-based economy, it has increasingly prioritized agricultural diversification in alignment with its Vision 2030 framework, which seeks to reduce dependence on oil revenues and foster sustainable development (Arabia, 2016; MOEWA, 2023). Climate change poses a serious challenge to Saudi Arabia's agricultural sector, including high temperatures, floods, severe droughts, and reduced agricultural output. To create an agricultural system that can endure climate change, it is crucial to comprehend the vulnerabilities of farm households and associated systems (Alotaibi et al., 2024). In line with the Saudi 2030 Vision, Saudi Arabia is intensifying its efforts to diversify its economy by strengthening the agricultural sector, particularly fruit production. The government has allocated SAR 2 billion to support domestic fruit cultivation through modern irrigation and agriculture technologies (Ken, 2024). These initiatives aim to enhance food security and reduce dependence on imports. By 2020, the country achieved partial or full self-sufficiency in various fruits, notably dates, grapes, mangoes, and cantaloupes (Abdalla, 2024).
According to the FAO (2025), the gross production values of dates, grapes, and watermelon in Saudi Arabia are approximately USD 7.21 billion in 2023. This growth is driven by a rising demand for a healthy lifestyle among the growing population and an increasing awareness of the health benefits. These fruits are particularly suited to the Kingdom's climate and have benefited from technological advances in irrigation and protected agriculture (Alotaibi et al., 2023; Manikandan et al., 2025). Saudi Arabia's agricultural sector has undergone significant transformation over the past few decades, driven by government policies, technological advancements, and changing economic priorities. Despite environmental constraints, Saudi Arabia has achieved notable advances in fruit production, especially in grapes, watermelon, and dates. These crops support local consumption and economic development through exports and related industries (Al-Khayri et al., 2017).
Saudi Arabia is among the world's largest producers and exporters of dates and ranks second globally in dates production after Egypt, contributing approximately 15% of the world's total output (Al-Mssallem et al., 2024). Dates processing industries add value to the raw product, further boosting GDP (Mahomoodally et al., 2023). The dates production in Saudi Arabia has been challenged by many factors, such as rising temperatures and erratic weather patterns, which threaten palm productivity. Besides, inadequate storage facilities and processing infrastructure lead to wastage. Since the demand for foreign workers and tourists in the Kingdom is growing annually, the Kingdom's dates production has not kept up with export activities. As a result, exports make up around 6.8% of domestic production or 8.7% of global exports in 2024 (Saudi Arabia, 2024).
Additionally, grapes cultivation in Saudi Arabia is relatively small compared to other fruits such as dates or watermelons. Grapes production has seen modest growth due to targeted investments in irrigation systems and greenhouse technologies. The limited availability of arable land and scarcity of water remain significant barriers to large-scale grapes farming. Grapes contribute marginally to the agricultural GDP, but it play a role in diversifying the fruit basket for domestic consumption. Watermelon is one of the most widely cultivated fruits in Saudi Arabia due to its adaptability to hot climates and relatively low water requirements compared to other crops. The watermelon cropping system is primarily based on coastal desert rain-fed production (Morgounov et al., 2022). Although watermelon consumption in Saudi Arabia is predominantly domestic, surplus production is increasingly targeted for export to GCC markets (GASTAT, 2019). Seasonal price volatility impacts farmer profitability, but the crop remains economically important, especially in rural regions (Book, 2020). It supports smallholder livelihoods and contributes to agricultural GDP and employment in allied sectors.
Figure 1 illustrates the trends in Saudi Arabia's GDP and the production of grapes, dates, and watermelons from 1970 to 2023. GDP (black bars) demonstrates a steady upward path, especially after 2005, reflecting the country's ongoing economic expansion. Dates production (green line) shows consistent growth, particularly accelerating after 2010, highlighting its increasing agricultural significance. In contrast, grape production (red bars) remains relatively low and stable throughout the period, indicating minimal changes. Watermelon production (blue line) is marked by volatility, with a sharp spike in the early 1970s followed by fluctuations over the years, showing less stable growth compared to dates. We noted that the figure suggests a strong positive trend in economic growth and dates production, while watermelon and grapes outputs follow less consistent tracks.
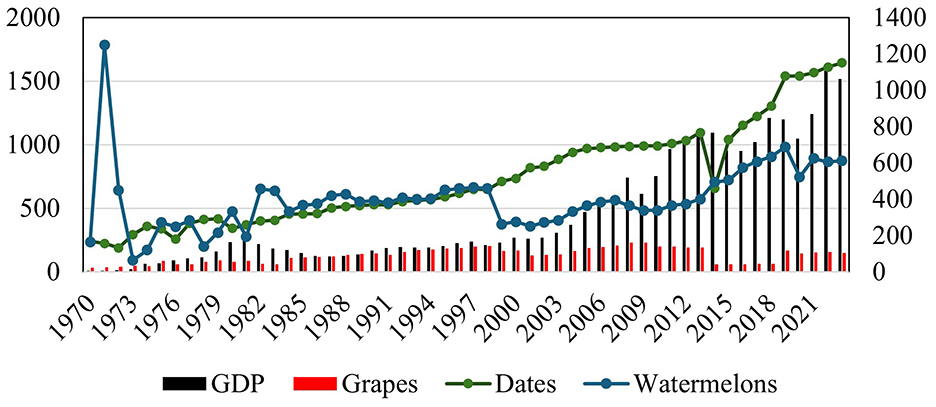
Figure 1. GDP and fruit production trends in Saudi Arabia (1970–2023). The right axis implies GDP in (1,000 million USD), and grapes production in (1,000tons), and the left axis implies dates production and watermelons in (1,000 tons). Source: FAO (2025) and author design (2025).
Accordingly, this study examines whether fruit production and GDP are cointegrated in Saudi Arabia in the long run. Likewise, the study aims to analyze the long-run and short-run dynamics between fruit production and GDP in Saudi Arabia. Based on these dynamic analyses and research objectives, the following hypotheses are established:
H1: Fruit production contributes positively to GDP, and a fruit production shock will generate a stronger and more persistent positive response in GDP.
H2: Changes in fruit production influence GDP dynamics, and the adjustment toward the long-run equilibrium is captured through a significant Error Correction Term (ECT).
The findings will contribute to academic literature and policy-making efforts to achieve agricultural sustainability and economic diversification. It will also offer evidence-based insights that support policy decisions in agricultural investment, rural development, and economic diversification. The results will contribute to the growing body of literature on agroeconomic linkages in the Middle East and provide a foundation for sectoral planning aligned with sustainable development goals (SDGs), particularly SDG 8 (Decent Work and Economic Growth) and SDG 12 (Responsible Consumption and Production).
The article is structured as follows: Section 2 reviews related literature, Section 3 outlines the data and methodology, Section 4 presents the empirical results, Section 5 concludes with policy implications, and Section 6 provides recommendations, future research directions, and acknowledges limitations.
2 Literature review
Numerous studies examined the connections between agriculture and GDP (Awokuse and Xie, 2015; Timmer, 2002). Besides, various econometric approaches, such as Johansen cointegration, VECM, ARDL, and Bayesian estimation. The study performed by (Thirtle et al. 2003) highlights the productivity effects of agricultural outputs on economic growth, particularly in emerging economies. Econometrically, long-run relationships between agricultural production and GDP are often evaluated using time series models such as Johansen cointegration and VECM, as discussed in (Engle and Granger 1987). These methods allow researchers to distinguish between short-term fluctuations and long-term equilibrium trends. (Aye and Edoja 2017) applied such models in Sub-Saharan Africa and confirmed a significant long-run impact of agricultural exports on economic growth, suggesting similar frameworks could be useful for examining Saudi Arabia's fruit sector.
A study conducted in Pakistan using the ARDL model proposes that a long-run co-integration occurs between agricultural GDP and fruit production (Ullah et al., 2018). A similar study applied the Johansen cointegration test alongside a machine learning technique to examine the relationship between agricultural GDP (AGDP) and variables such as apples, citrus, pears, grapes, and banana production. The results showed that banana, citrus, and pear outputs had a significant positive impact on AGDP, while apple and grapes outputs had a negative but statistically insignificant effect (Rehman et al., 2018). Furthermore, the study applied the Bayesian estimation method to analyze the impact of fruit price fluctuations and found that rising price volatility had a negative effect on fruit output (Fu et al., 2021).
The study employed deep neural networks to develop a fast and reliable system for predicting fruit production. The findings suggest that the government should enhance support for fruit production by implementing more effective policies to assist farmers in improving their output (Khan et al., 2020). A study using the ARDL-EC model found a long-run relationship between citrus and the real exchange rate and real GDP per capita growth rate (Seleka et al., 2024).
Alamri et al. (2024) used a gravity model and found that higher per capita GDP in Saudi Arabia and the presence of common borders enhance dates exports to Middle Eastern countries, while GCC membership appears to reduce export volumes. While dates production has been extensively studied, limited literature focuses specifically on grapes and watermelon, despite their growing domestic production and nutritional value. Studies by (Book 2020) and FAO (2024) emphasized the importance of diversifying fruit crop production to meet domestic consumption needs and reduce dependence on imports.
Understanding the relationship between GDP and fruit production is crucial, as it can inform policy design in resource allocation, agri-business investment, and environmental sustainability. Applying long-run econometric techniques, such as cointegration analysis and vector error correction models (VECM), allows for the investigation of both equilibrium relationships and short-run dynamics between agricultural outputs and macroeconomic performance (Johansen, 1991; Pesaran et al., 2001). Such an approach is particularly relevant in Saudi Arabia, where structural reforms and climatic constraints necessitate evidence-based planning in the agriculture sector.
We concluded that from the literature review, despite the strategic importance of these crops, few empirical studies have quantitatively analyzed their direct impact on Gross Domestic Product (GDP). This gap is especially pronounced in the case of grapes and watermelon, which are often overshadowed by staple and cereal crops in economic analyses. Moreover, agricultural outputs in Saudi Arabia are increasingly linked to non-traditional revenue streams such as agri-tourism, export diversification, and agro-industrial processing, all of which influence national income generation (Alotaibi et al., 2023).
3 Data and methods
3.1 Data
The current study utilizes annual time series data from 1970 to 2023, extracted from the Food and Agriculture Organization (FAO, 2025) for Saudi Arabia. The variables selected include GDP, measured in millions of US dollars, as the dependent variable, and the production quantities of grapes, dates, and watermelons (in tons) as the key independent variables representing fruit crop outputs. GDP is employed as the dependent variable to capture Saudi Arabia's economic performance, which is significantly influenced by contributions from the agricultural sector.
The total GDP is employed as the dependent variable rather than agricultural GDP (AGDP) or non-oil GDP. This choice is partly due to data limitations, as AGDP is not consistently reported throughout the study period, reducing its suitability for econometric modeling. More significantly, the choice of total GDP is theoretically matched with the objectives of Saudi Arabia's Vision 2030, which emphasizes economic diversification and positions agriculture as part of the broader growth strategy. By examining the contribution of key fruit products to total GDP, this study illustrates how agriculture interacts with and supports broader economic transformation. Nevertheless, it is acknowledged that total GDP is heavily influenced by the oil and services sectors, which may weaken the direct measure of agriculture's impact. This represents a limitation of the current analysis, but the choice of total GDP remains consistent with the national policy framework. Besides, Total GDP more accurately reflects the wider economic impact of fruit production, including its contributions to trade, food security, and diversification beyond the oil sector.
The selection of dates, watermelon, and grapes is motivated by their significant economic role and data availability within Saudi agriculture. Dates dominate with a harvested area of 157,444 hectares, annual production of about 1.64 million tons, and an export value exceeding 265,208 thousand USD in 2023, making them one of the country's most important export crops. Watermelon, cultivated on 25,198 hectares with production of 612,680 tons, contributes greatly to domestic food supply and self-sufficiency, while grapes, though smaller in scale (4,935 hectares and 103,466 tons), represent a high-value crop with an export potential of 670 thousand USD. Compared to other fruits, these three stand out for their larger production areas, higher export values, and consistent statistical records, justifying their selection in this study (FAO, 2025).
Their inclusion as explanatory variables also reflects broader policy priorities: dates remain a traditional export commodity central to the Kingdom's heritage, while grapes and watermelons illustrate a shift toward horticultural diversification, consistent with the objectives of Saudi Vision 2030, which emphasizes sustainable agricultural growth and reduced reliance on oil revenues. Variable explanations and statistical descriptive tests of key variables are presented in Table 1. The high standard deviation (SD) of GDP indicates significant variability around the mean, suggesting potential economic disparities (Table 1). Several common factors contribute to the high standard deviation observed in fruit production, including seasonal fluctuations, government policies, and subsidies; these factors collectively influence both production levels and price stability. The results obtained from Table 1 confirmed that none of the variables fully meet the criteria for normal distribution across all tests, but DATP comes closest to being normally distributed (verifies most tests except Shapiro–Wilk). GRSP proves some tests but fails others (notably Shapiro–Wilk and kurtosis). GDP and WAMP are not normally distributed. The data were transformed into natural logarithmic (Ln) forms to enhance the reliability and interpretability of the study results.
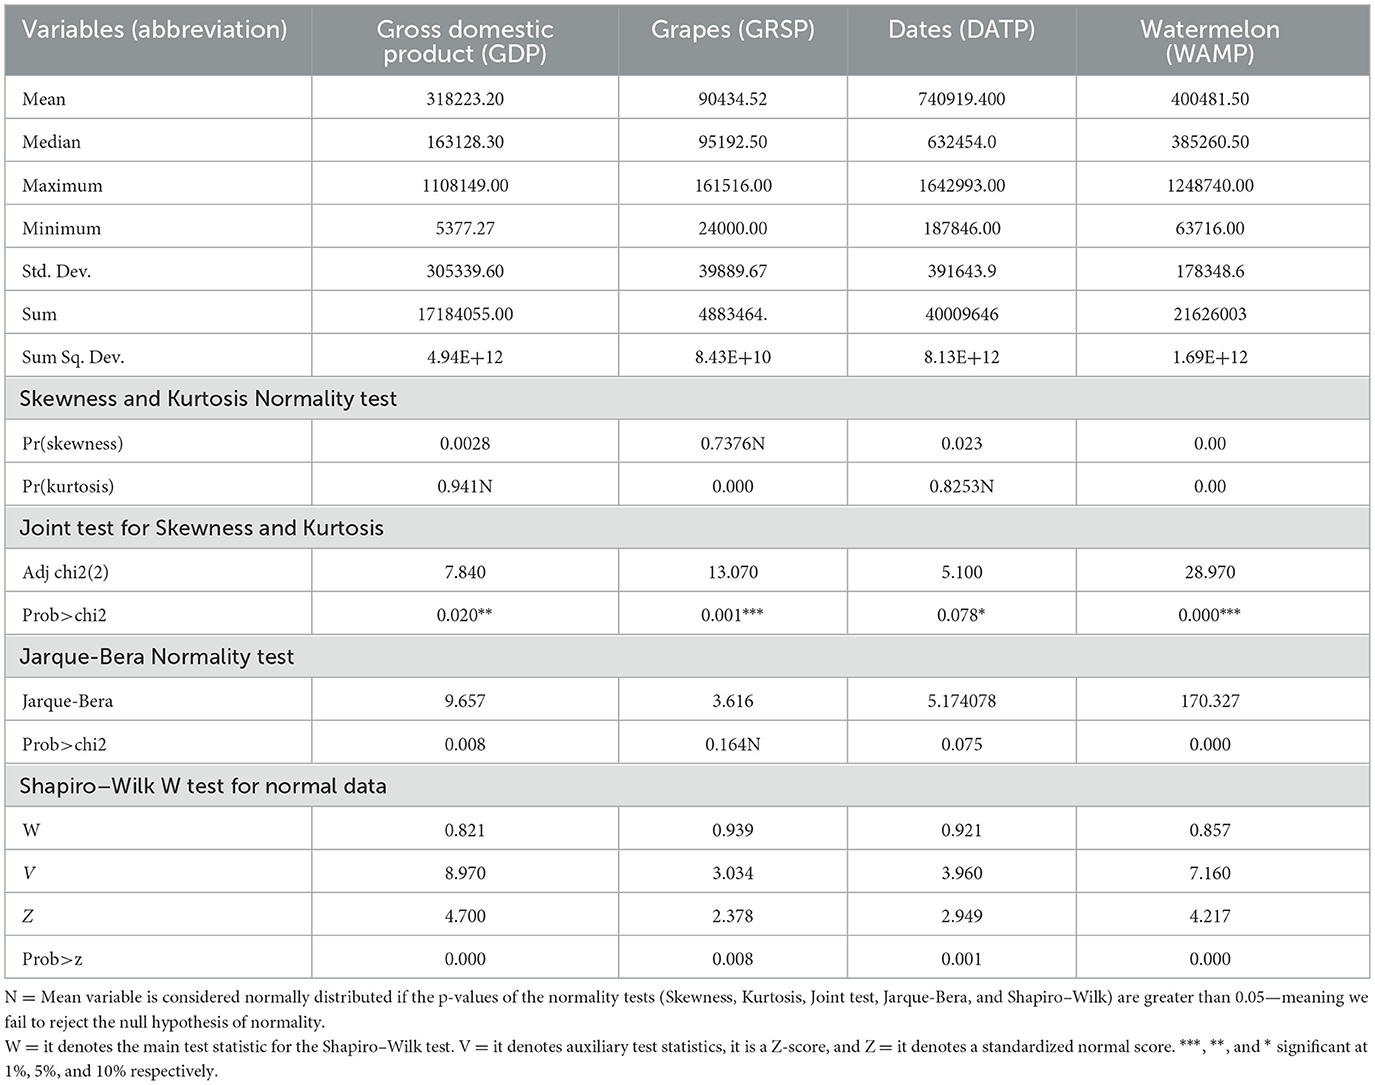
Table 1. Descriptive analysis.
Various intercorrelation measures, including matrix correlations, partial, and semi-partial, were applied to explore the relationships among the variables (Table 2). The matrix correlation results reveal that GDP exhibits a strong and statistically significant positive correlation with DATP (r = 0.912, p-value = 0.00), indicating that GDP and dates production tend to increase alongside. In contrast, the correlation between GDP and GRSP is weak and statistically significant (r = 0.256, p = p = 0.062). Moreover, GDP confirms a moderate positive correlation with WAMP (r = 0.418, p < 0.01). DATP has the strongest and highly significant relationship with GDP (Partial Corr = 0.9049) as 82% of the variation in GDP occurs when other variables are held constant (Partial2 = 0.8188, p-value = 0.00), at the same time, the GRSP has a statistically significant negative relationship with GDP when controlling for others (Partial Corr = −0.387, p = 0.0046). The WAMP is not a significant predictor of GDP in this test (p = 0.3731).
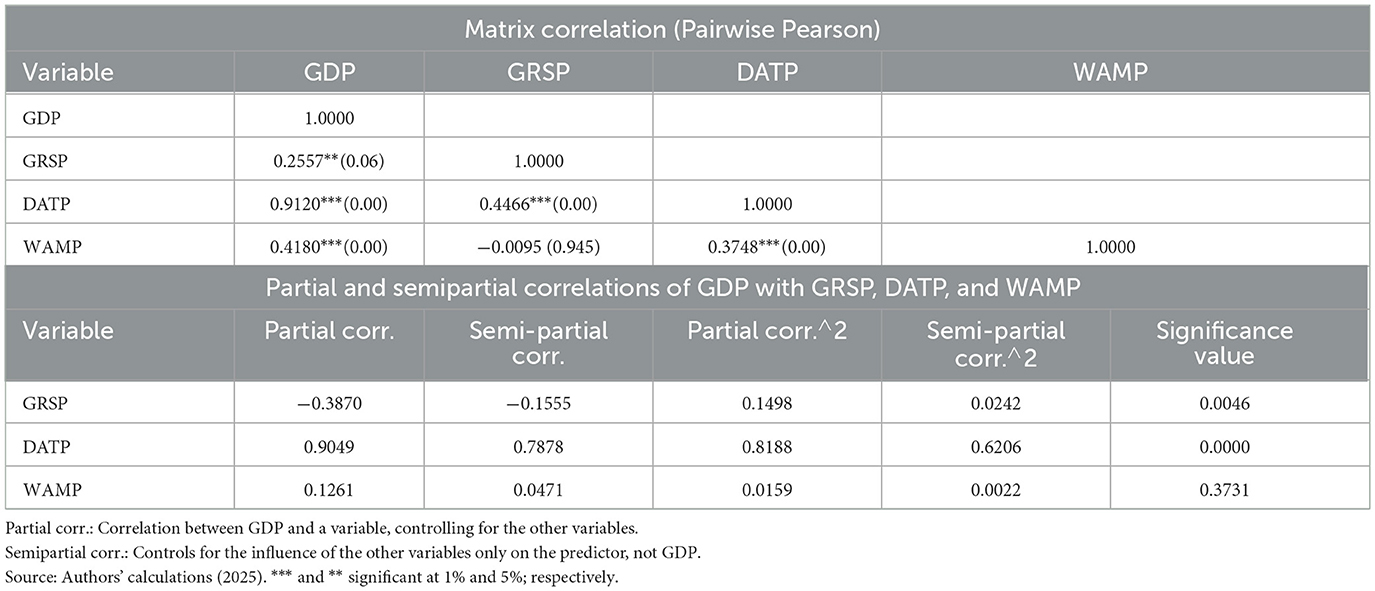
Table 2. Intercorrelation test results.
3.2 Unit root and cointegration approaches
Before conducting the VECM estimations, we employed (Ng and Perron 2001) and (Zivot and Andrews 1992) structural break unit root tests. To ensure robustness in identifying the stationarity of the variables, the study employed the (Ng and Perron 2001) unit root test. Ng-Perron proposed four modified statistics (MZα, MZt, MSB, and MPT) that incorporate generalized least squares (GLS) detrending to improve the reliability of unit root testing.
For accounting for an unknown break date (UBD), we used Zivot and Andrews. This test considers structural breaks as endogenous, offering three models: Model A (break in intercept), Model B (break in trend), and Model C (break in both intercept and trend). Following prior studies (e.g., Altinay and Karagol, 2005; Bakry and Almohamad, 2018; Zhou et al., 2022), we applied Model C to test for unit roots in our variables. The C model takes the equation formula as:
Whereas: is the first difference, Xt denotes a variable series that contains a unit root, referring to existing studied variables, which are LnGDP, LnGRSP, LnDATP, and LnWAMP. The Xt−j terms on the right-hand side of the equations permit the serial correlation and confirm that the disturbance term is white noise with variance σ2, and t = 1…., T, which denotes the index of time. IDt is an indicator dummy variable for a mean shift occurring at each probable time break date (TBD) while DTt is the corresponding trend variable, the null hypothesis is μ = 0, which indicates that the presence of a unit root in the series (X), whereas the alternative hypothesis μ < 0 indicates the series is trend stationary. The justification for applying the Ng-Perron test alongside structural break tests strengthens the validity of the integration order of each variable, thereby supporting more accurate model estimation and inference.
3.3 Johansen cointegration approach
To determine the number of cointegrating vectors, Johansen proposed two alternative tests: The trace and the maximum eigenvalue test (Johansen and Juselius, 1990).
Whereas: r is the number of cointegrating relationships, T is the number of observations, δ is the ith largest canonical correlation related to the estimated characteristic. The trace test examines the null hypothesis of r cointegration vector = 0 against n alternative hypotheses of r cointegration vector > 0, and γmax−eigne tests the alternative hypothesis of r cointegration vector = 0 against the alternative hypothesis of r = 1. The trace test is generally preferred over the maximum eigenvalue test for determining cointegration because it is more robust to non-normality. The selected variables in this study follow a mixture of a normal distribution and a Laplace distribution.
In the presence of cointegration, we estimate a VECM, a form of cointegrated vector autoregression (VAR). This framework includes an Error Correction Term (ECT) to capture the long-run equilibrium relationship among the selected variables.
3.4 Vector error correction model
Assuming the four selected variables are cointegrated, the VECM developed by Engle and Granger, (1987) captures both the short-run dynamics and the long-run equilibrium relationship. The general form of a VECM with one cointegrating (one lag for simplicity) equation can be written as:
Where:
Δ is the first difference operator, Π is αβ′, where β contains the cointegrating vectors (long-run relationships) and α contains the adjustment coefficients (how each variable corrects deviations from long-run equilibrium), Γicaptures short-run dynamics and ϵt it's a vector of white noise errors. Then the cointegrating equation takes the form:
Therefore, the VECM's formulas for the selected variables are:
3.5 VECM diagnostic estimators
To ensure the reliability and robustness of the VECM results, it is essential to perform diagnostic tests. The Lagrange Multiplier (LM) test is commonly used to detect the presence of autocorrelation in the residuals (Breusch and Godfrey, 2015). We perform the LM test by running the auxiliary regression after we run the regression model.
Then we estimate:
whereas n is the number of observations, andR2 It is from the auxiliary regression. Under the null hypothesis of no autocorrelation, the LM statistic follows a RX2(p) distribution. Several researchers (Buturac, 2021; Chu and Qureshi, 2023; Guerard et al., 2020) argued that detecting autocorrelation is crucial for model validity and forecasting accuracy.
Impulse Response Functions (IRFs) trace the effect of a one-time shock to one of the innovations (error terms) on current and future values of the endogenous variables in a VAR or VECM system. For a VECM model, IRFs are derived similarly after converting the system into a VAR in levels or using structural decomposition as follows:
The impulse responses are calculated from this model by applying a shock to εt and observing its effect through the dynamic system.
Furthermore, the forecast error variance decomposition (FEVD) is employed to understand the dynamic interactions among variables. FEVD quantifies the proportion of each variable's forecast error variance that can be attributed to shocks in itself and the other variables within the system (Hoque et al., 2024). This provides insight into the relative importance and influence of each variable over different time horizons, enhancing the interpretation of interdependencies in the system.
We can compute the forecast error variance of Yt+h. The FEVD at horizon h for variable i due to a shock in variable j is:
ei is a selection vector (1 in the ith position, 0 elsewhere)
Φk is the moving Average coefficient matrix at lag k, Σ is the variance-covariance matrix of the innovations of εt. And θij(h) percentage of forecast error variance of variable i due to shocks in variable j at horizon h. Often, we use Cholesky decomposition or generalized FEVD to orthogonalize shocks and attribute unique variance to each source.
4 Empirical results and discussions
Based on the (Ng and Perron 2001) unit root test with an intercept and trend, the results obtained from Table 3 indicate that LnGDP and LnDATP are non-stationary at the level but become stationary after first differencing, suggesting they are integrated of order one I(1). LnGRSP is found to be stationary at the level, indicating it is integrated of order I(0). In contrast, LnWAMP is non-stationary at both levels and first differences and is found to be stationary at second differences, integrated into order two I(2). These findings suggest that the variables are suitable for inclusion in a VECM analysis. However, we assume the necessary step to test for a structural break in the unit root process using the Zivot-Andrew's test to detect potential hidden stationarity due to structural breaks before proceeding with the VECM analysis.
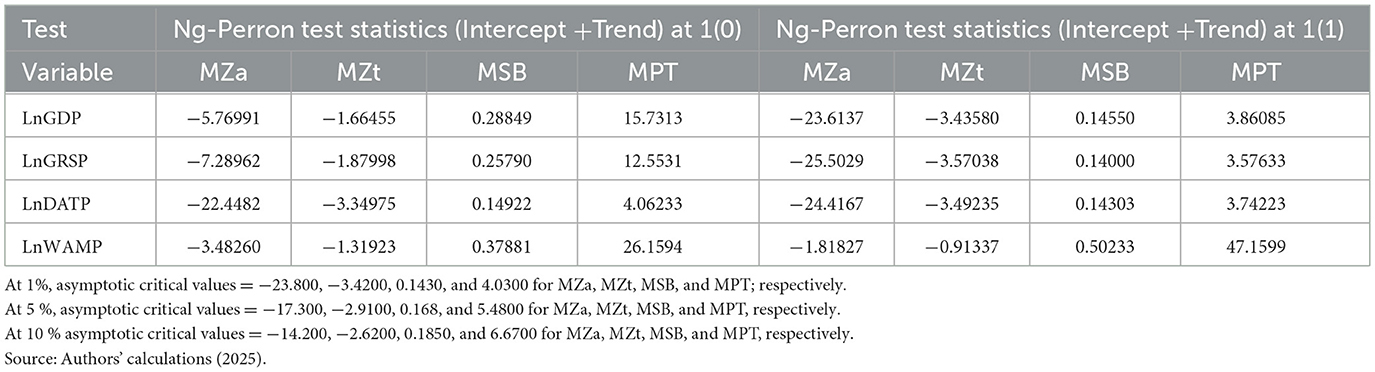
Table 3. Ng-Perron results.
To ensure methodological consistency, the integration order of all variables was carefully examined using unit root tests. Although the VECM approach is conventionally suitable for variables integrated of order one [I(1)], extensions in the econometric literature (Johansen, 1995; Juselius, 2006) allow for the inclusion of I(2) variables under certain conditions. In this study, watermelon production was identified as an I(2) variable. Given the sufficiently large sample size (1990–2023) and the correct identification of the cointegration rank, the VECM framework remains appropriate. This treatment ensures that both short-run adjustments and long-run equilibrium relationships are consistently represented, even in the presence of higher-order integration.
Based on the Zivot-Andrews unit root tests accepting structural breaks in intercept and trend, the selected variables showed mixed evidence of stationarity (Table 4). Among them, LnGDP and LnWAMP are non-stationary at the level but become stationary after first differencing, as their test statistics in first difference are (−7.515) for LnGDP and (−8.615) for LnWAMP which are below the 1% critical value. In contrast, LnGRSP (−5.711) and LnDATP (−6.248) are already stationary at the level, both exceeding the 1% critical threshold.
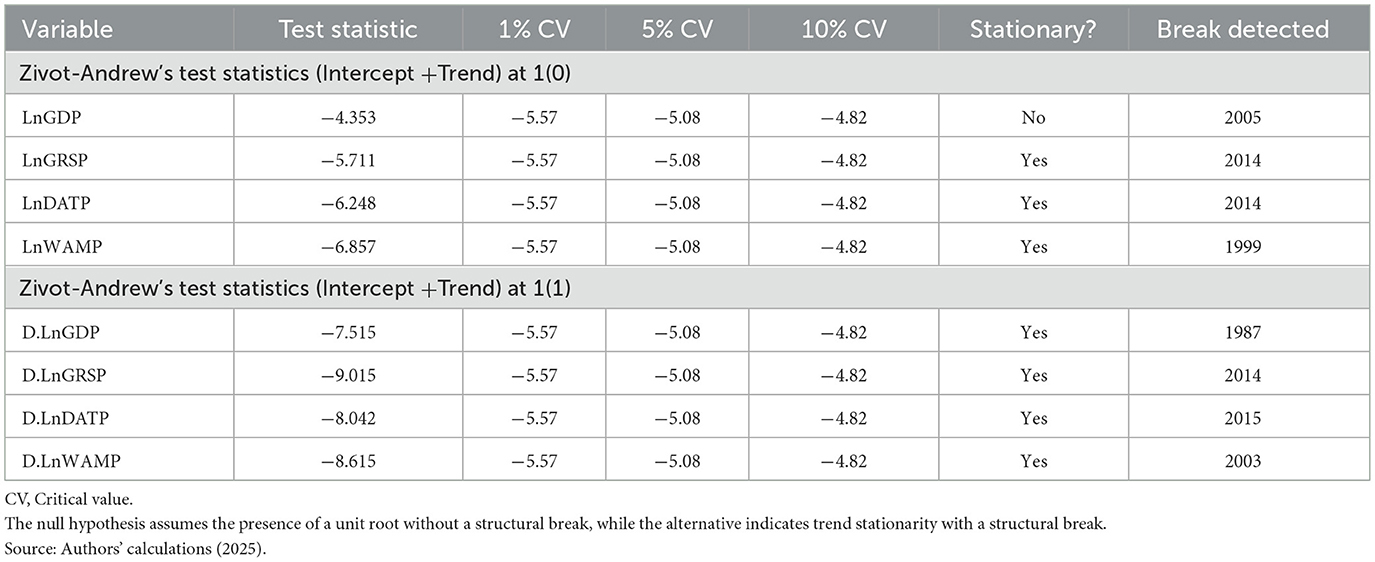
Table 4. Zivot-Andrews unit root test summary.
The results of Zivot-Andrews's test indicate that structural break dates vary across series and occur at different points in time, suggesting heterogeneous responses to economic or sector-specific shocks. In the case of GDP, a structural break in the level series (LnGDP) was identified in 2005, potentially corresponding to a policy change, economic crisis, or external macroeconomic shock. Additionally, a break in the first-differenced GDP series (D.LnGDP) occurred in 1987, which may reflect an earlier structural reform or significant shift in macroeconomic conditions.
Grapes production (LnGRSP and D.LnGRSP) exhibited structural breaks in 2014, indicating that grapes production experienced a major disruption at this break year, affecting both long-term trends and short-term growth patterns, likely due to sector-specific shocks or broader economic and environmental factors. Likewise, the Zivot-Andrews's test identified structural breaks in dates palm production, with a long-term shift in 2014 (LnDATP) and short-term volatility in 2015 (D.LnDATP), suggesting that a significant shock in 2014 had both immediate and persistent effects on the sector.
Structural breaks were also observed in the level and differenced forms of watermelon production (LnWAMP and D.LnWAMP), indicating evolving production dynamics. The break in the different series in 2003 likely reflects short-term volatility, while the 1999 break in the level suggests a long-term structural shift.
The Zivot-Andrews's test identifies structural breaks in Saudi Arabia's fruit production data series in 1999, 2003, 2005, 2014, and 2015. These breaks correspond to significant events in the country's agricultural and economic history. In 1999, early agricultural modernization programs were introduced (Kayed and Kabir Hassan, 2011). In 2003, reforms in water management and irrigation were implemented (Al-Zubeir, 2003). In 2005, Saudi Arabia's accession to the WTO influenced agricultural trade policies (Evenett, 2005). In 2014, severe climate events and subsidy reforms occurred, and the 2014 break reflects the sharp decline in global oil prices (Tokic, 2015). Linking these structural breaks to actual events provides a clearer explanation of the changes observed in fruit production over time and is consistent with historical and policy interventions, thereby strengthening the robustness of the empirical results.
Based on these results, we conclude that the identified structural break dates may reflect economic growth shocks or disruptions in the fruit sector, which likely influenced the dynamic behavior and stationarity properties of the corresponding time series (Table 4).
4.1 Johansen cointegration results
As the series includes a mix of I(0) and I(1) variables, a VECM can be employed if at least one cointegrating relationship exists. Therefore, the Johansen cointegration test is conducted to determine the presence of such relationships. It is evident from Table 5 that both the trace and maximum eigenvalue test results indicate the presence of four cointegrating relationships at the 5% significance level. This suggests that, although some variables may be non-stationary in levels, they exhibit a long-run equilibrium relationship, with their linear combinations being stationary. Consequently, the VECM is justified for analyzing the short-run dynamics and long-run relationships among these variables. This result is consistent with (Zou 2018), who stated that, on the argument of the existence of cointegration links, VEC modeling can be further performed.
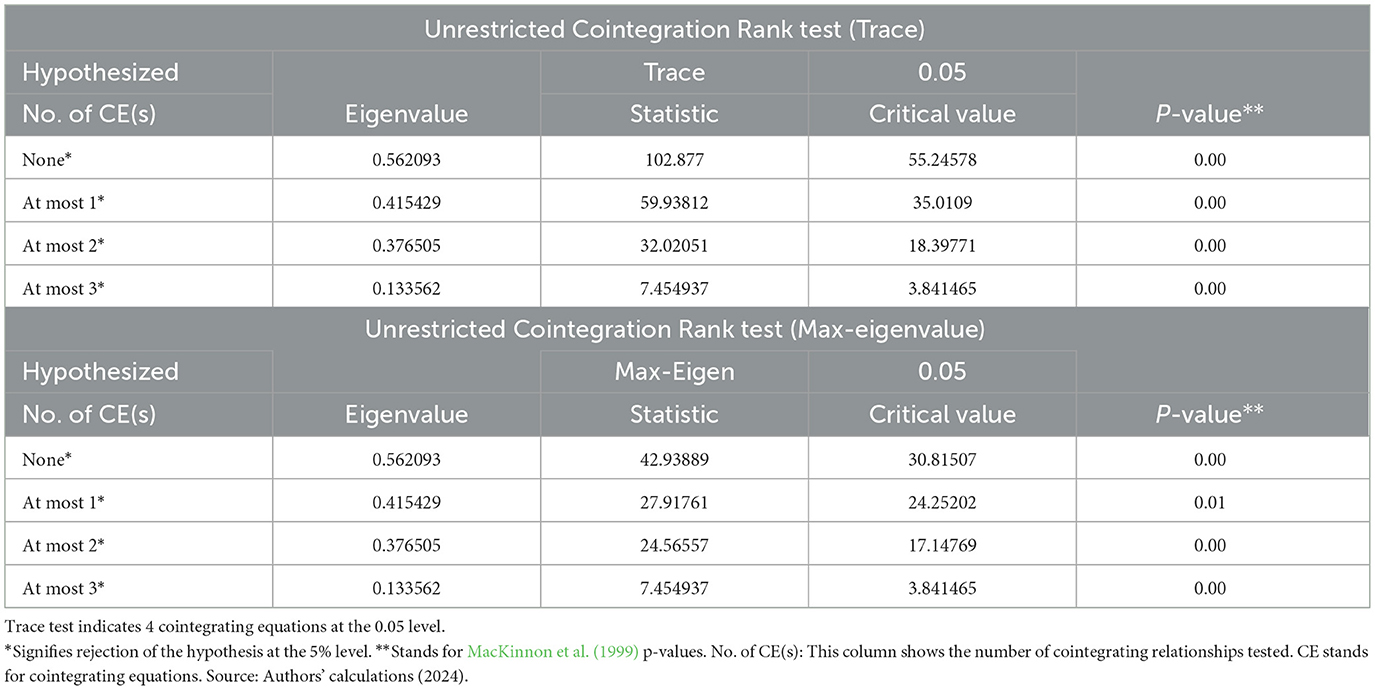
Table 5. Johansen Cointegration test.
Table 6 introduces the statistics used to determine the optimal lag length for the VECM. Most selection criteria (AIC, HQ, and FPE) indicate that a lag length of two is optimal (the lag length with more asterisks is considered the most optimal based on the selection criteria), suggesting that the VECM model should include two lags to ensure both accuracy and simplicity.
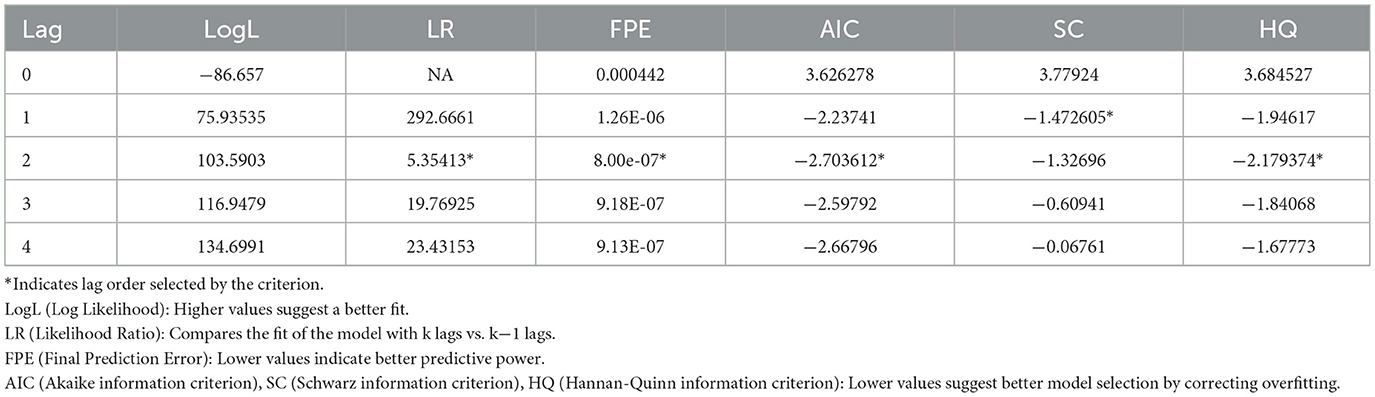
Table 6. Summary of lag length selection results.
4.2 Vector error correction estimates outcomes
Table 7 presents the results of short and long-run dynamics in the VEC model. The short-run dynamics in the VECM are captured by the error correction term (ECT) along with the lagged differences of the endogenous variables.
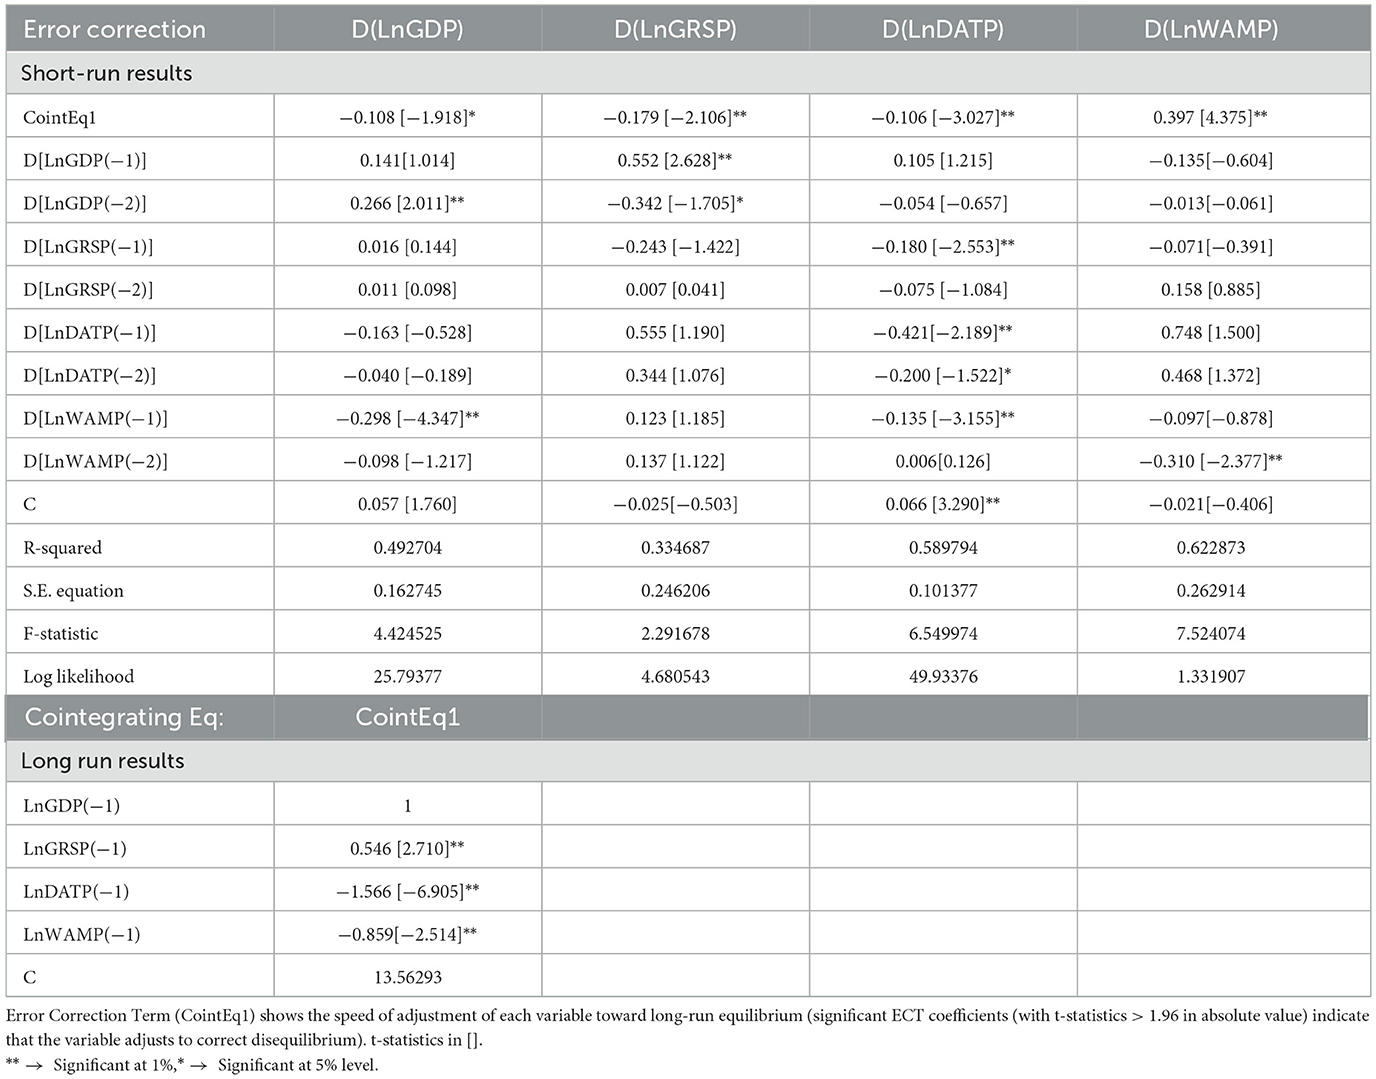
Table 7. Vector error correction parameter estimates.
Regarding the short-run Granger-type effects, the results indicate that the first lag of LnGRSP has a significant negative impact on LnDATP (t = −2.553). Additionally, LnDATP is negatively influenced by its own first lag (t = −2.189), suggesting a degree of short-term inertia. Furthermore, the first lag of LnWAMP significantly and negatively affects both LnGDP (t = −4.357) and LnDATP (t = −3.155), while its second lag exhibits a significant negative effect on LnWAMP itself (t = −2.377).
The VECM long-run estimates suggest that dates and watermelon negatively affect GDP, likely reflecting their limited competitiveness and the high resource costs of production in Saudi Arabia. Adding, dates production suffers from diminishing returns or limited value-added processing in the long run, while in the short/medium run, production shocks positively influence GDP due to domestic consumption and trade effects.
These findings support the hypothesis that GDP, grapes, and dates fruit production contribute to restoring long-run equilibrium after short-run shocks, as evidenced by negative and statistically significant ECT coefficients for LnGDP, LnGRSP, and LnDATP estimated as (−0.108); (−0.179); and (−0.106); respectively. Conversely, watermelon production behaves differently, as shown by its positive and destabilizing ECT (0.397), implying it may not align with the broader economic trends captured in GDP.
The short-run analysis reveals that grapes production (LnGRSP) has a significant negative impact on date production (LnDATP), suggesting a possible substitutive or competitive relationship between these two fruits in the short term (competition for shared resources such as land, labor, or irrigation, etc.) between grapes and dates cultivation. Moreover, the negative effect of the first lag of dates production on itself indicates short-run diminishing returns. Also, we conclude that watermelon production (LnWAMP) shows a negative impact on GDP and dates production, suggesting that fluctuations in watermelon yields may adversely influence agricultural output and broader economic performance. This fluctuation in the short run is clear in Figure 1. Additionally, watermelon production is negatively influenced by its second lag, which may reflect short-term overproduction effects or resource constraints. Furthermore, for more explanations of the negative impact of watermelon on GDP, the domestic watermelon production may exceed demand or compete with cheaper imported varieties, which could lead to market inefficiencies. Several scholars indicated that watermelon production is challenged with market inefficiencies (Balogun et al., 2019; Chogou et al., 2019). However, (Moumane et al. 2021) reported that watermelon has been a successful agricultural business, created economic strength for the farm, and will enhance the GDP (Hamad et al., 2022).
The long-run relationship between the variables is expressed as follows:
LnGDPt−1 = 13.5630 + 546LnGRSPt−1–1.566 LnDATPt−1–0.859 LnWAMPt−1.
It appears that LnGRSP exhibits a positive and statistically significant long-run relationship with LnGDP (t = 2.71). In contrast, both LnDATP and LnWAMP show negative and significant long-run effects on LnGDP, with t-values of −6.90 and −2.51, respectively.
The empirical findings reveal a differentiated long-run impact of fruits on economic growth in Saudi Arabia. Specifically, grapes production (GRSP) exhibits a positive and statistically significant relationship with GDP, suggesting that this crop contributes positively to long-term economic performance. This may be attributed to its higher export potential, better resource efficiency, and value-added processing opportunities within the country (Sharma et al., 2017).
Conversely, both dates production (DATP) and watermelon (WAMP) demonstrate negative and significant long-run effects on GDP. Despite the cultural and agricultural prominence of dates production in Saudi Arabia, market capacity, limited value-added processing, and export constraints appear to diminish its economic contribution (Alhamdan et al., 2024). Similarly, watermelon production is likely constrained by its high-water demand, low market value, and perishability, making it economically inefficient in the long term (Abdelbaki and Alzahrani, 2024; Morgounov et al., 2022).
These results underscore the importance of aligning agricultural policy with economic diversification goals, promoting fruit crops with higher export potential and value-added opportunities, while addressing inefficiencies in the production and supply chains of lower-impact crops. These results validate the presence of both short-run dynamics and long-run equilibrium, supporting the appropriateness of the VECM framework for this analysis.
For a VECM to be well-specified, the system should have enough cointegrating relationships to capture the long-term relationships between the variables (Canova, 1999). The stability of the estimated VECM was assessed by examining the roots of the companion matrix. As shown in Table 8, the results reveal that three roots have a modulus exactly equal to 1.000, indicating the presence of three cointegrating relationships among the endogenous variables (LnGDP, LnGRSP, LnDATP, and LnWAMP). This confirms the existence of long-run equilibrium relationships within the system. This result is supported by (Ullah et al. 2018), who confirmed a long-run connection between GDP and fruit production. Likewise, the remaining roots have moduli strictly less than one (e.g., 0.690485, 0.650070, 0.496591, and 0.424049), demonstrating that the short-run dynamics are stationary and the system is dynamically stable. Therefore, the VECM is correctly specified, and the model effectively captures both the short-term adjustments and the long-term cointegration among the variables.
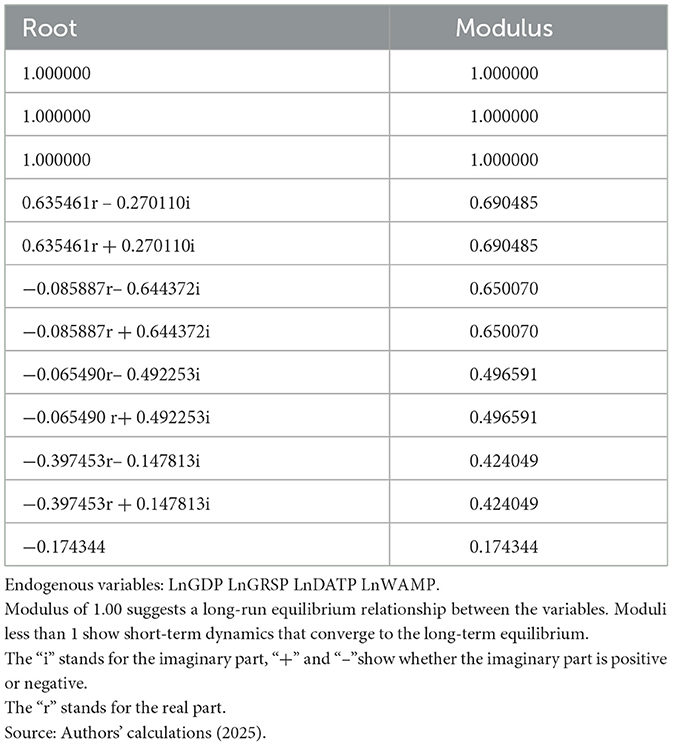
Table 8. Roots of characteristic polynomial.
The joint test statistics strongly reject the null hypothesis at the first and second lags (p-values < 0.01), suggesting that collectively, the lagged differences are significant and should be included in the model (Table 9). This indicates that the combined lagged effects of GDP and the fruit crops variables are important for explaining dynamics over time.
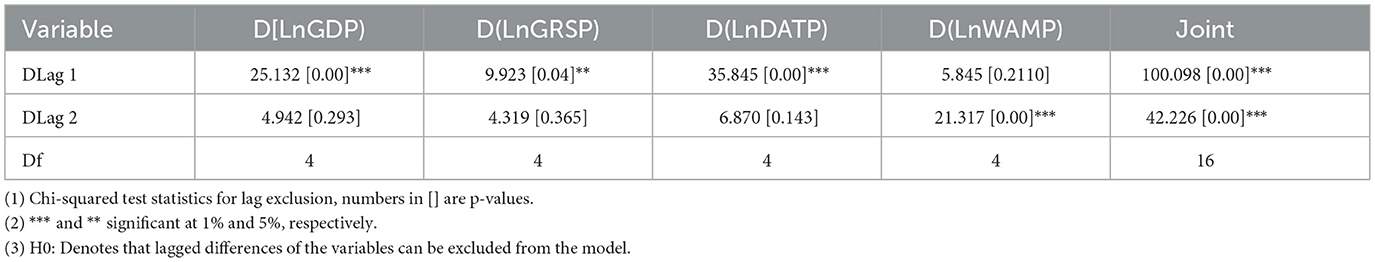
Table 9. VEC lag exclusion Wald tests.
The empirical results of VECM can be interpreted using agricultural production and economic growth theories. Grapes production positively affects GDP, consistent with the theory that crops with high export potential, efficient resource use, and value-added processing contribute to long-term growth. In contrast, the negative long-run effects of dates and watermelon on GDP align with the theory of diminishing returns and resource misallocation, as these crops are constrained by high water requirements, limited processing capacity, and lower market competitiveness. This theoretical reasoning supports empirical evidence that not all agricultural outputs contribute equally to economic development and that diversification toward high-value crops enhances sustainable growth. These theoretical insights help explain the observed study results and strengthen the interpretation of both short-run and long-run economic impacts of fruit production in Saudi Arabia.
Furthermore, based on the significance of lags, we can summarize the dynamic behavior for Short-term effects (Lag 1), which are important for GDP, GRSP, and DATP. The longer-term effects (Lag 2) are relevant mainly for WAMP (Table 9). We conclude that the economic growth (GDP increase) can stimulate fruit crop production (especially dates and grapes) relatively quickly, but watermelon production may react more slowly. However, the joint significance of all variables confirms that fruit crop production collectively plays an important role in influencing economic growth.
4.3 Lagrange multiplier result
The results of the Lagrange Multiplier (LM) test for serial correlation (autocorrelation) in the residuals of the VECM are presented in Table 10. At lags 2 and 3, the p-values are well above the 0.05 significance level, indicating the absence of autocorrelation. Although the p-value at lag 1 (0.058) is slightly above 0.05, it suggests a marginal presence of autocorrelation. Furthermore, the absence of significant serial correlation in the model residuals at higher lags indicates that the model adequately captures the system's dynamics.
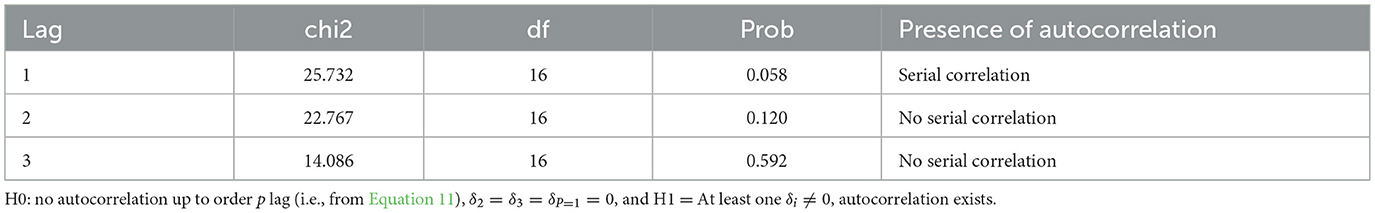
Table 10. Lagrange-Multiplier test.
4.4 Impulse response functions (IRFs) results
Table 11 presents the impulse response of selected variables to one standard deviation shocks over a 10-period horizon.
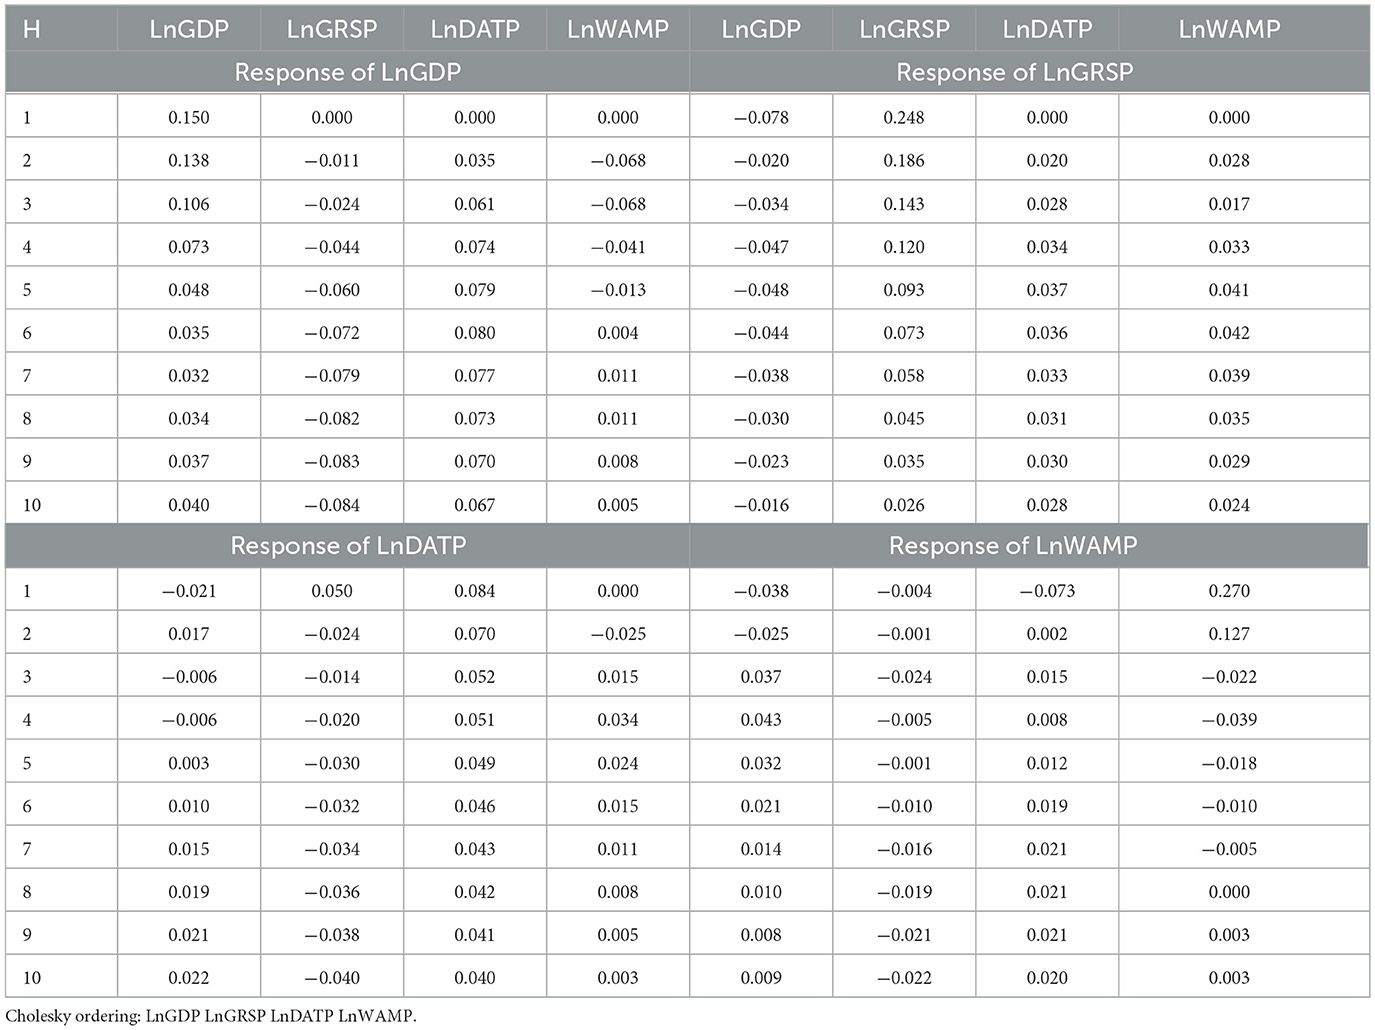
Table 11. Impulse response functions results.
4.4.1 IRF for GDP
The impulse response results show that GDP (LnGDP) responds positively to its own shocks, starting at 0.150 in period 1 and gradually declining to 0.040 by period 10. Among the fruit variables, dates production (LnDATP) has a consistent and positive impact on GDP, increasing from 0.035 in period 2 to a peak of 0.080 in period 6, then slowly declining to 0.067 in period 10, indicating its beneficial role in economic growth. In contrast, grapes production (LnGRSP) exerts a negative influence on GDP throughout the horizon, starting from −0.011 at period 2 and worsening to −0.084 by period 10, suggesting potential inefficiencies or a limited economic contribution. Watermelon production (LnWAMP) initially affects GDP negatively (−0.068 at periods 2 and 3), but the impact gradually becomes positive by period 6 (0.004) and reaches 0.005 by period 10, implying short-run costs followed by modest long-term benefits. Dates production appears to be the most economically supportive, while grapes production may require policy reassessment.
4.4.2 IRF for grapes production
Grapes production is most strongly influenced by its own shocks, starting at 0.248 in period 1 and gradually declining to 0.026 by period 10, showing a clear self-driven dynamic. The influence of GDP is negative, beginning at −0.078 and reducing in magnitude to −0.016 by period 10, indicating that higher GDP may slightly suppress grapes production over time. Meanwhile, the effects of dates production are small and positive, rising from 0.020 in period 2 to 0.028 in period 10, and watermelon production also has a mild positive effect, from 0.028 to 0.024 over the same horizon. These dynamics highlight that grapes production is somewhat self-contained but still responds moderately to changes in other fruit sectors.
4.4.3 IRF for dates production
Date production is most strongly influenced by its own shocks, with a positive response starting at 0.084 and gradually declining to 0.040 by period 10, reflecting a stable self-reinforcing effect. The influence of GDP begins slightly negative (−0.021) but turns positive over time, ending at 0.022, suggesting a weak but improving long-run relationship. Grapes production exerts a small negative impact on date output, dropping from 0.050 in period 1 to −0.040 by period 10, possibly due to competition for fruit resources. Watermelon production has a mildly positive effect, peaking at 0.034 in period 4 and decreasing to 0.003 by period 10. These results suggest that dates production is relatively autonomous but modestly affected by dynamics in other fruit sectors.
4.4.4 IRF for watermelon production
Watermelon production responds most strongly to its own shocks, with an initial surge of 0.270 in period 1 that diminishes to 0.003 by period 10, indicating a self-correcting dynamic. GDP shocks start negatively (−0.038) but gradually turn supportive, ending at 0.009, suggesting watermelon production eventually benefits from economic growth. Grapes shocks show small but steady negative effects, from −0.004 to −0.022, implying slight competition. Dates production initially suppresses watermelon output (−0.073), but the relationship turns positive through period 2, stabilizing at around 0.020 by period 10. These results indicate that while watermelon production adjusts quickly to its own shocks, it is modestly influenced by other fruits' production and economic factors over time.
The analysis reveals that GDP growth is primarily self-driven but also influenced by shocks in fruit production, particularly from the dates and grapes sectors. Dates production emerges as the most economically beneficial, exhibiting a persistent positive effect on its own output and supporting GDP growth over time, while also mildly enhancing watermelon production. In contrast, grapes production, despite a strong self-reinforcing dynamic, consistently exerts a negative impact on GDP, indicating limited economic contribution and possible inefficiencies. Watermelon production displays a strong short-term self-response and initially dampens GDP, but this effect transitions to a modest positive influence in the medium to long term. These findings highlight the strategic importance of dates production in promoting economic growth and suggest the need to reassess the roles of grapes and watermelon within the fruit sector.
Furthermore, Figure 2 shows that GDP is principally self-motivated but benefits positively from shocks to dates production. In contrast, Grapes consistently have proven a negative effect on GDP, pointing to inefficiencies in production and the need for resource reallocation. Dates production demonstrates a stable and persistent self-supporting effect while contributing positively to economic growth, which we interpret as evidence of stable sectoral growth. Watermelon production exhibits a strong short-term self-response and, although it initially impacts GDP negatively, its effect becomes positive in the long run. Watermelon responses are volatile, reflecting seasonal risks and short-term inefficiencies that challenged its long-run contribution.
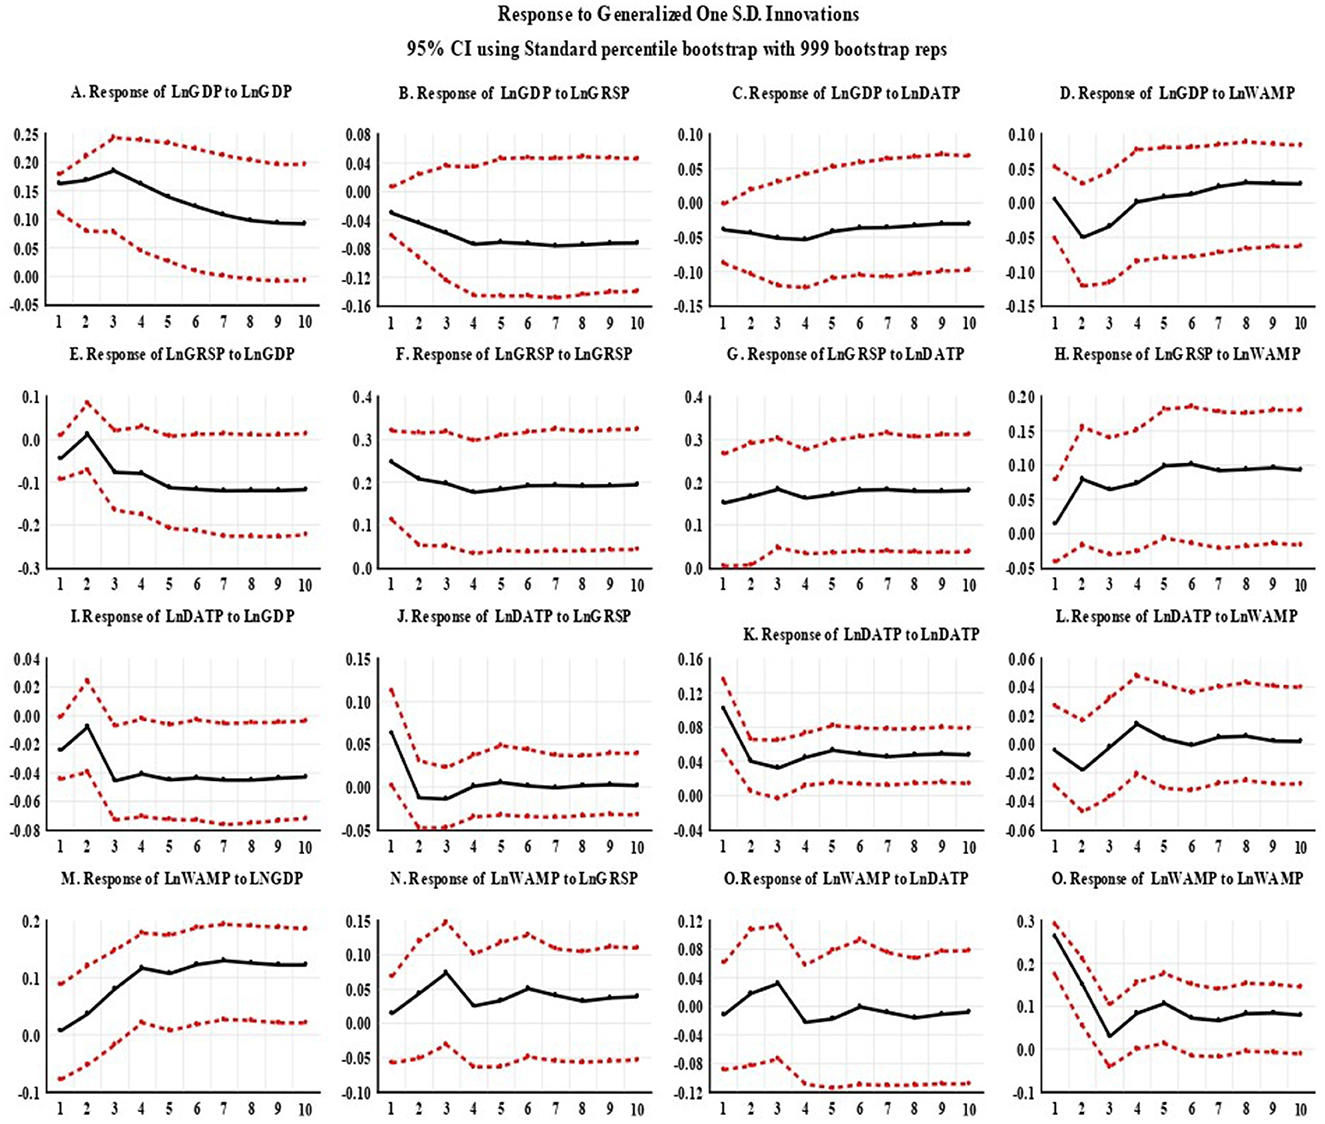
Figure 2. Dynamic responses of GDP and fruit production to generalized one standard deviation shocks. The black solid lines show the estimated impulse responses, and the dotted red lines represent the 95% confidence intervals based on bootstrapping (999 replications).
We conclude that Figure 2 fully confirms the earlier numeric IRF results and supports the policy suggestion for promoting dates and watermelon production to sustain economic growth, while grapes production needs careful management to avoid adverse effects on GDP.
4.5 Structural residuals of the VECM
From Figure 3, we observe that the structural residuals of the VECM for LnGDP, LnGRSP, LnDATP, and LnWAMP fluctuate closely around zero without demonstrating systematic patterns or trends, suggesting that the model is properly specified. Although minor volatility appears, particularly in the residuals for LnGRSP and LnDATP during the early 1980s and post-2010 periods, the fluctuations generally persist within ±2 standard deviations. This indicates an absence of significant autocorrelation and that the residuals behave like white noise. We concluded that the stability and randomness of the structural residuals, as illustrated in Figure 1, proves the robustness and reliability of the VECM in capturing the short- and long-run dynamics among the studied variables.
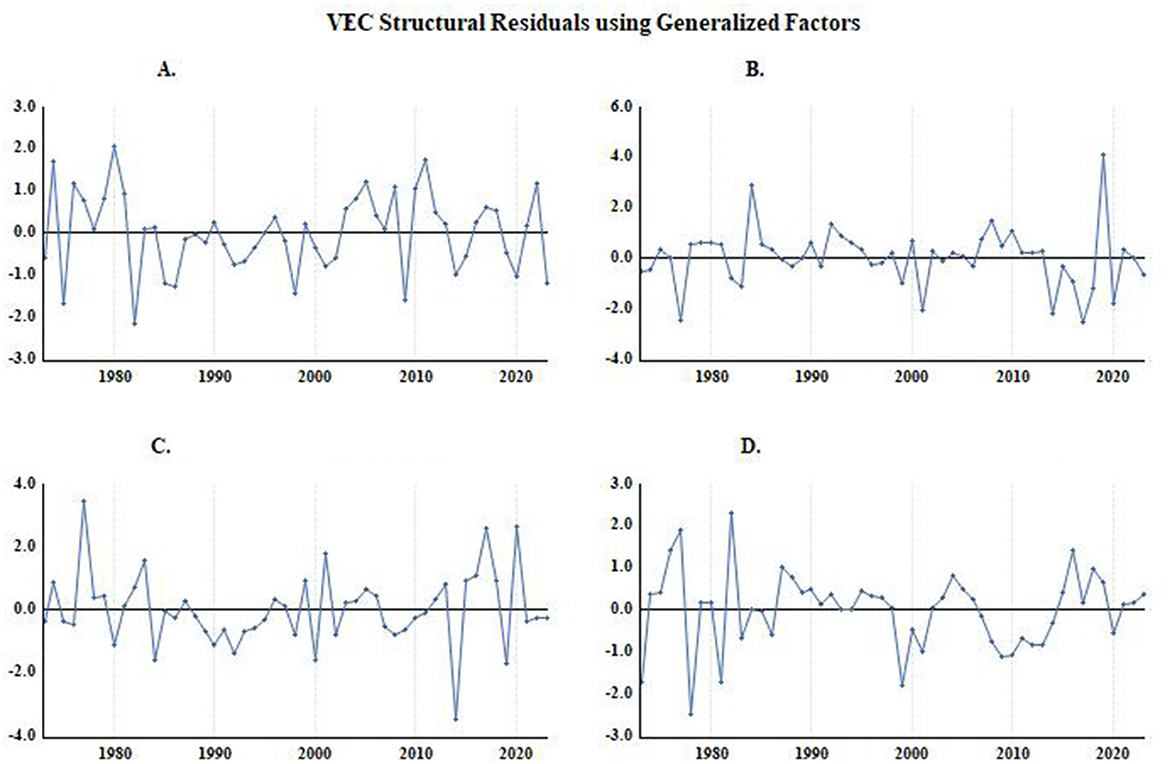
Figure 3. Structural residuals from the VECM for (A) LnGDP, (B) LnGRSP, (C) LnDATP, and (D) LnWAMP. (1) The horizontal axis represents the time (years), covering approximately from 1975 to 2023, the vertical axis measures the magnitude of the structural residuals (standardized errors) for each endogenous variable, and the blue lines show the path of residuals over time for each variable. (2) Residuals fluctuating around zero with no systematic patterns suggest that the model residuals are approximately white noise, implying a good model fit.
4.6 The variance decomposition results
Figure 4 presents the variance decomposition results obtained from the VECM applying Cholesky (d.f. adjusted) factors. The decomposition illustrates how much of the forecast error variance for each endogenous variable (LnGDP, LnGRSP, LnDATP, LnWAMP) is attributable to its own innovations.
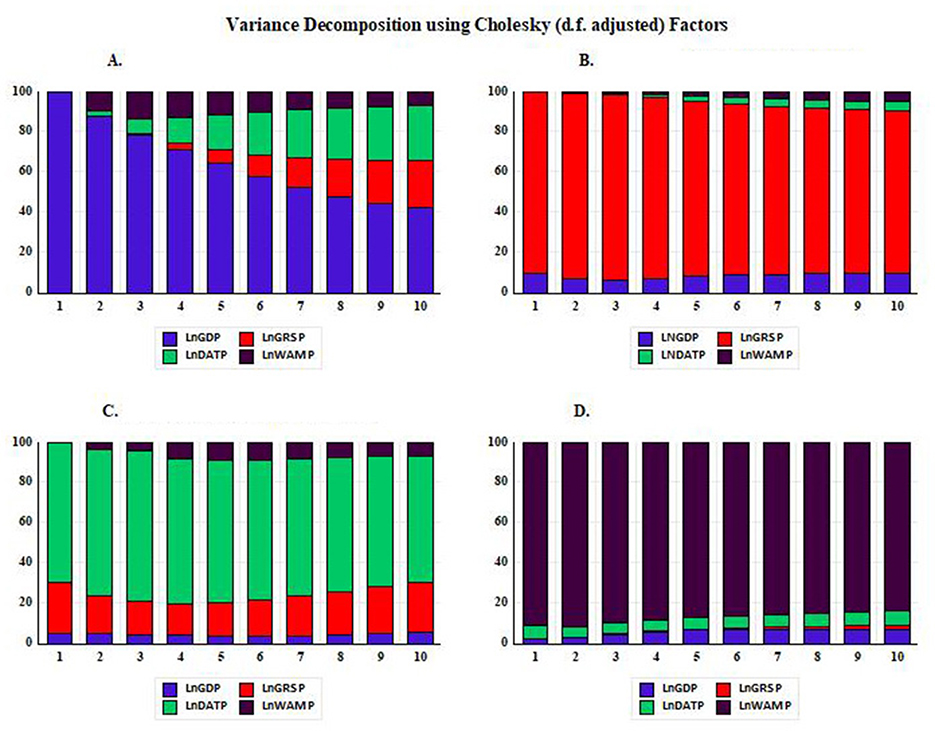
Figure 4. Forecast error variance decomposition of (A) LnGDP, (B) LnGRSP, (C) LnDATP, and (D) LnWAMP. The horizontal axis represents forecast horizons (periods 1–10). The vertical axis shows the percentage contribution (%) of each variable to the forecast error variance.
The variance decomposition results reveal that LnGDP's forecast variance is initially dominated by its own shocks, but over time, the influence of shocks from LnDATP and LnWAMP increases noticeably. LnGRSP remains mainly self-explanatory throughout all periods, although the contributions from LnDATP and LnWAMP exhibit a slight rise as the forecast horizon extends. LnDATP is initially highly dependent on its own innovations; however, the impact of LnGRSP steadily becomes more pronounced in explaining its forecast error variance. Finally, LnWAMP is predominantly explained by its own shocks across all periods, with only minimal contributions from the other variables.
The FEVD results confirm these dynamics and provide theoretical insights into fruits performance. Dates explain a large share of their own forecast variance, reflecting stability and continuity, consistent with resource-based comparative advantage. Grapes contribute negatively to GDP variance, indicating inefficiency and structural constraints. Watermelon accounts for a limited and unstable share of GDP variance, highlighting its volatility and sensitivity to short-term shocks. These interpretations strengthen the connection between the empirical findings and underlying economic mechanisms in the agricultural sector.
4.7 Historical decomposition analysis
The historical decomposition (HD) analysis (Figure 5) reveals that LnGDP faced significant negative stochastic shocks during the late 1980s through the early 2000s, with slight and fluctuating contributions from grapes and watermelon production, while dates production provided a notable positive offset, particularly in the mid-1990s and after 2010. LnGRSP exhibited highly volatile shocks during the 1980s and early 2000s, with watermelon production initially offering positive support that distressed after the mid-1990s, and only negligible influences from GDP and dates production, highlighting grapes' relative independence. LnDATP showed stable dynamics, with major disturbances mainly in the late 1980s and late 2010s, and insignificant interaction with other sectors, indicating strong internal drivers. LnWAMP demonstrated the highest volatility, especially during the 1970s−1980s and early 2000s, with reasonable contributions from GDP and dates production, and slight constant impacts from grapes production over time.
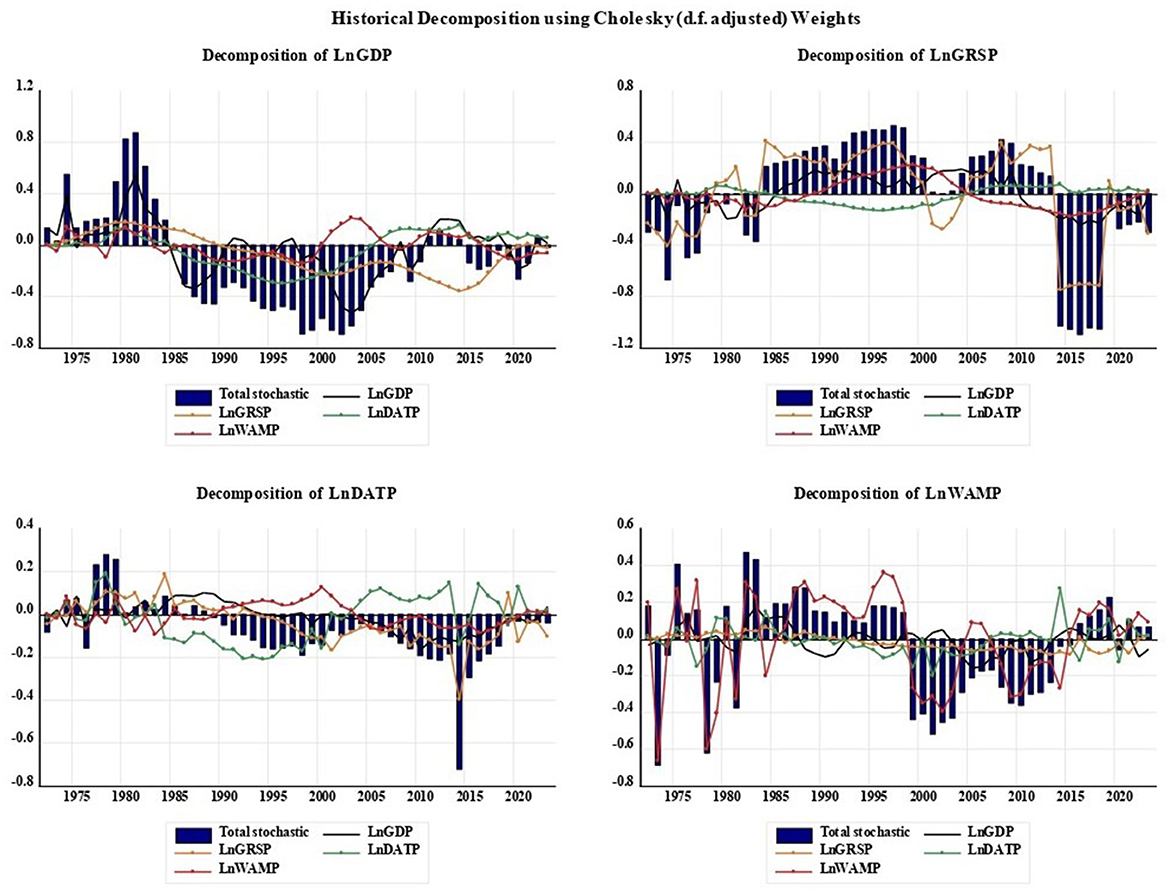
Figure 5. Historical decomposition of GDP and fruit production (1975–2023). Blue bars represent total stochastic shocks; lines represent contributions from GDP (blue), grapes (green), dates (orange), and watermelon (red). The historical decomposition of shocks for LnGDP and selected fruits production using a Cholesky (d.f. adjusted) approach. Source: Authors' calculations (2025).
4.8 The forecast results
The complete set of evaluation forecasting results is briefly summarized in Table 12. The forecast evaluation results show that LnDATP achieves the best predictive performance, with the lowest RMSE (0.165), MAE (0.120), and MAPE (0.88%), along with the Theil coefficient close to zero (0.006), indicating extremely low forecast errors and minimal bias. LnWAMP also demonstrates strong predictive accuracy, with moderate errors (RMSE = 0.280, MAE = 0.236, MAPE = 1.85%) and a small Theil's U (0.011). In contrast, LnGDP and LnGRSP have relatively higher forecast errors, with LnGDP recording an RMSE of 0.397, MAE of 0.325, and MAPE of 2.68%, while LnGRSP shows the highest errors at RMSE 0.449, MAE 0.357, and MAPE 3.13%. Nevertheless, the Theil coefficients for GDP and grapes production are very low (below 0.02), suggesting that despite the relatively higher error levels, the forecasts are still reliable and largely unbiased. Generally, forecasts for dates and watermelon production are more accurate, while GDP and grapes production are comparatively difficult to predict, due to greater sensitivity to external and macroeconomic fluctuations.
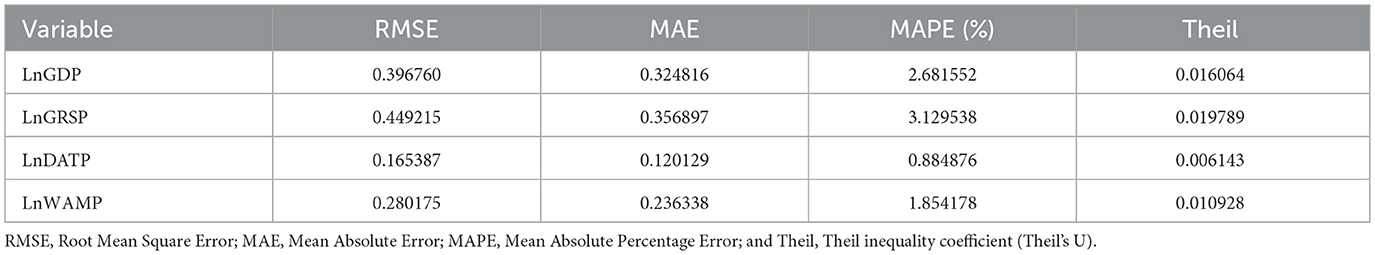
Table 12. Forecast assessment metrics for GDP and fruits production.
The forecast evaluation measures (RMSE, MAE, MAPE, Theil's U) reveal notable differences in predictability across the series. Dates and watermelon are relatively easier to forecast, benefiting from stable production cycles, consistent cultivation practices, established trade channels, and predictable seasonal demand. By contrast, grapes exhibit greater forecast errors due to higher production volatility, sensitivity to climate shocks, and fluctuations in market prices, while GDP forecasts are less accurate as a result of macroeconomic shocks and structural adjustments. addressing these differences is important for agricultural planning and economic policy, as it highlights where targeted interventions, such as improved storage infrastructure or market stabilization measures, could enhance predictability and reduce risk.
4.9 The sensitivity analysis
To ensure the robustness of our VECM results, we conducted a sensitivity analysis by extending the model to include three lags for the variables (Table 13). This approach allows us to examine whether the estimated short-run and long-run relationships between fruit production (grapes, dates, and watermelons) and GDP remain consistent when additional dynamic effects are considered. The sensitivity analysis with three lags confirms the robustness of the estimated VECM relationships while revealing important short-run dynamics. The error-correction terms indicate that GDP, grapes, and dates adjust significantly toward long-run equilibrium, while watermelon exhibits a positive adjustment coefficient, implying destabilizing short-run effects. In the short run, several lagged interactions are significant: GDP responds to its own second lag, dates and grapes exhibit correction dynamics through their lagged terms, and watermelon exerts both direct and indirect effects across lags. Despite these short-run fluctuations, the long-run cointegration equation remains stable, with grapes contributing positively to economic growth, while dates and watermelons exert negative and significant effects. These findings confirm that the main long-run relationships are consistent across lag specifications, while also highlighting the differing roles of fruits in the short-run adjustment process, particularly the destabilizing influence of watermelon.
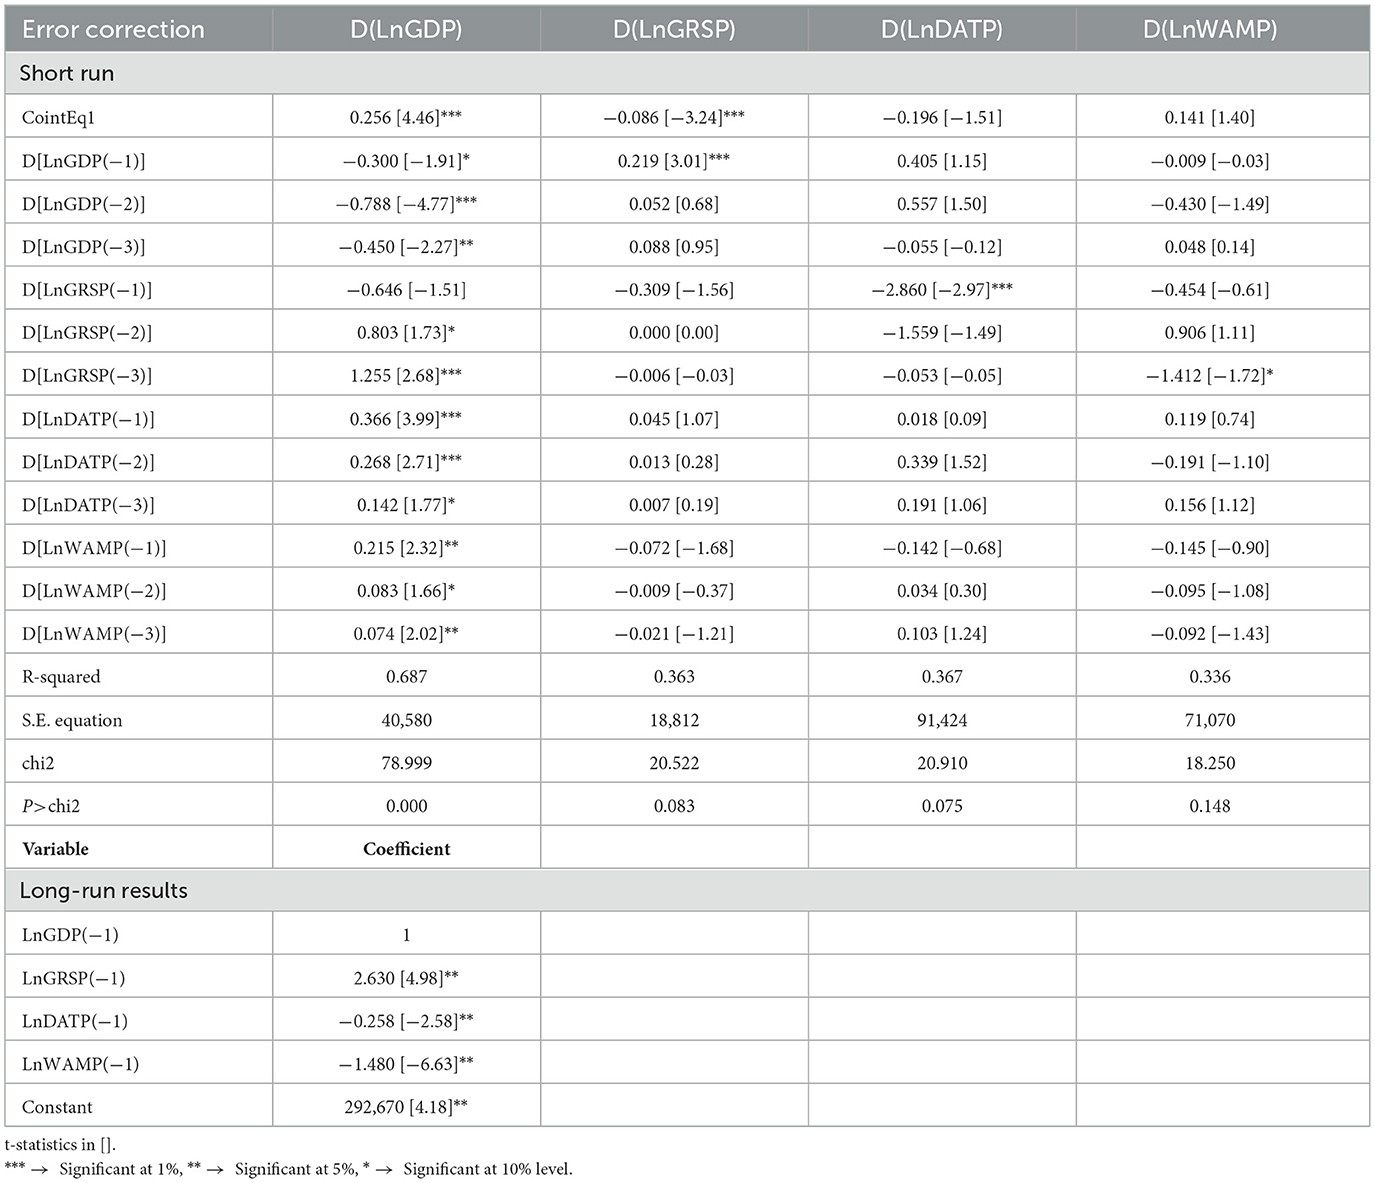
Table 13. The sensitivity analysis.
5 Conclusion and policy implications
The relationship between fruit production and economic growth has long been a subject of interest in development. While Saudi Arabia is traditionally recognized for its oil-dependent economy, recent national strategies, particularly the Vision 2030 framework, have emphasized the need for economic diversification. This study examined whether GDP and fruit production are cointegrated over time in Saudi Arabia. Likewise, the study investigated the long-run and short-run dynamics between GDP and fruit production in Saudi Arabia. We used time series annual data covering the period (1970–2023), analyzed by applying the VECM model system and its diagnostic tests. The robust models for verifying the VECM findings were performed by adopting figures for structural residuals, FEVD, and HD analysis. We perform forecast assessment metrics estimators to evaluate the accuracy and predictive power of the VECM. Before performing the VECM, the unit root and cointegrating tests were conducted.
The Zivot-Andrews's test revealed structural breaks across multiple series, indicating significant economic and fruit dynamics shifts. The results confirm the existence of a long-run equilibrium relationship among the variables, as evidenced by the significance of the error correction terms (ECTs) and the cointegrating equation. Both grapes (LnGRSP) and dates fruit production (LnDATP) exhibit significant short- and long-run interactions with GDP, highlighting their dynamic role in economic fluctuations. Notably, the positive error correction coefficient for watermelon production (LnWAMP) in the GDP equation indicates a divergence from the long-run equilibrium path, suggesting that deviations in watermelon output do not self-correct toward equilibrium.
The impulse response analysis reveals distinct dynamics across the four variables. Grapes and watermelon production are self-reinforcing but decay over time, while dates production maintains a stronger and more stable self-response. The analysis shows that GDP is mainly driven by its own dynamics but is also influenced by shocks in fruit production, especially from dates and grapes. Grapes production shocks exert a persistent negative effect on GDP, while production shocks have a positive and supportive impact on economic growth. Watermelon production shocks initially negatively affect GDP, but this effect becomes positive over time.
The decomposition findings suggest that GDP stability and growth are somewhat insulated from shocks in grapes and watermelon production, but dates production plays an increasingly important stabilizing role over time. Therefore, policy efforts should prioritize strengthening and expanding the dates production sector, including investment in technology, irrigation infrastructure, and export markets, to reinforce its positive contribution to GDP, especially during periods of broader economic distress. Structural residuals analysis proves the robustness and reliability of the VECM in capturing the short- and long-run dynamics among the studied variables.
We concluded that the IRFs and FEVD capture short- to medium-run dynamics, where dates and eventually watermelon play positive or stabilizing roles by supporting rural incomes, food security, and reducing GDP volatility. Similarly, watermelon's perishability and market inefficiencies may cause short-term negative impacts, but in the longer run, productivity gains contribute positively.
The historical decomposition shows that GDP faced major negative shocks in earlier decades, partially balanced by positive contributions from dates production. Grapes and watermelon were highly volatile with limited external influence, while dates production was stable and self-driven. Watermelon was the most unstable but was moderately influenced by GDP and dates output.
Forecast Assessment Metrics concluded that dates production watermelon production offered stronger forecast performance and showed the most accurate and reliable forecasts, with minimal errors and bias. In contrast, GDP and grapes production is harder to predict due to higher forecast errors and greater sensitivity to external factors.
Although the VECM long-run estimator suggests a negative connection between dates production and (GDP) economic growth, the short-run IRFs/FEVD results indicate positive responses. These outcomes are not contradictory but reflect different mechanisms acting over different horizons. In the long run, the negative effect may occur from structural issues such as market saturation, excessive dependence on traditional dates production, and limited integration of value-added processing industries, which constrain sustainable growth. In comparison, the short-run positive responses might be explained by consumption fluctuations during seasonal or religious events (for instance, the Islamic fasting month Ramadan), trade shocks that temporarily increase export demand, or policy-driven incentives. Therefore, the results suggest that while date production can generate immediate economic benefits, structural reforms and diversification are important to convert these benefits into sustained long-run growth.
The empirical findings are interpreted in economic terms to provide deeper insight. The positive self-supporting effect observed for date production suggests sectoral stability, indicating that established production patterns and trade relationships help protect the industry against short-term shocks. By contrast, the higher volatility in watermelon production highlights seasonal risk and sensitivity to fluctuations in demand and trade, implying that policy interventions such as storage, marketing strategies, or trade facilitation may be needed to stabilize outcomes. Similarly, the limited long-run responsiveness of grapes indicates constraints in market expansion and potential for value-added processing, which should direct long-term development policies.
The results reveal that the policy implications of dates production differ across time horizons. In the short run, dates production contributes positively to economic activity by generating seasonal employment, meeting domestic consumption, and responding to trade shocks. Policies in this context should focus on stabilizing supply chains, supporting export channels, and enhancing market efficiency. However, the long-run results highlight structural challenges, which mainly depend on traditional production and limited integration into value-added industries, and may constrain sustainable growth. Accordingly, long-term policy should prioritize diversification into processed dates products, investment in agribusiness technologies, and integration with food industry value chains.
The results have important economic and policy implications. Grapes production, with its positive long-run impact on GDP, highlights the benefits of supporting high-value and export-oriented crops. In contrast, the negative effects of dates and watermelon suggest the need for policies that improve efficiency, value-added processing, and market competitiveness. Short-run competition among crops also underscores the importance of resource allocation strategies. These findings provide actionable guidance for agricultural policy, supporting sustainable growth, economic diversification, and efficient use of land and water resources in Saudi Arabia.
6 Recommendation, further studies, and limitations
Based on the analysis, several key recommendations emerge. The positive and stable contribution of dates production to GDP highlights the importance of supporting and expanding this sector through targeted investment, technology adoption, and export development. In contrast, the consistently negative effect of grapes production on GDP suggests a need to reevaluate its economic role, possibly by improving productivity, shifting to higher-value varieties, or reallocating resources to more productive crops. Watermelon production shows mixed effects but holds potential for long-term gains. Therefore, policies should aim to manage their short-term volatility while enhancing market integration and value chain efficiency.
From a forecasting perspective, the strong predictive accuracy of dates and watermelon production supports their use in short and medium-term planning horizons. However, the relatively low forecast accuracy for GDP and grapes production suggests these variables are more vulnerable to external shocks, warranting more frequent updates and the inclusion of broader macroeconomic indicators in forecasting models.
For future research, it is recommended to explore structural VECM or non-linear models to capture potential asymmetric or regime-dependent relationships. Extending the dataset and incorporating variables such as climate change, rainfall, irrigation subsidies, labor force, trade policy, and input costs could enrich the analysis. Further research on the elasticity of watermelon production relative to GDP should be carried out. In addition, we suggest expanding into other fruits in future studies.
This study has limitations, including a limited set of variables, excluding potentially relevant factors such as climate conditions, policy changes, trade dynamics, or input costs, which could influence fruit output and GDP. Besides, the forecast evaluation is constrained by the available sample size and may not generalize well in the presence of future structural changes or shocks.
Data availability statement
Publicly available datasets were analyzed in this study. This data can be found at: https://www.fao.org/faostat/en/#data/QCL.
Author contributions
RE: Conceptualization, Data curation, Formal analysis, Funding acquisition, Investigation, Methodology, Project administration, Resources, Software, Supervision, Validation, Visualization, Writing – original draft, Writing – review & editing. MA-M: Investigation, Methodology, Project administration, Supervision, Writing – review & editing. NR: Conceptualization, Data curation, Writing – original draft.
Funding
The author(s) declare financial support was received for the research, authorship, and/or publication of this article. This research was funded by the Deanship of Scientific Research, King Faisal University, Al-Ahsa, Saudi Arabia, through financial support under the Ambitious Researcher Track, grant number: KFU253839.
Conflict of interest
The authors declare that the research was conducted in the absence of any commercial or financial relationships that could be construed as a potential conflict of interest.
Generative AI statement
The author(s) declare that no Gen AI was used in the creation of this manuscript.
Any alternative text (alt text) provided alongside figures in this article has been generated by Frontiers with the support of artificial intelligence and reasonable efforts have been made to ensure accuracy, including review by the authors wherever possible. If you identify any issues, please contact us.
Publisher's note
All claims expressed in this article are solely those of the authors and do not necessarily represent those of their affiliated organizations, or those of the publisher, the editors and the reviewers. Any product that may be evaluated in this article, or claim that may be made by its manufacturer, is not guaranteed or endorsed by the publisher.
References
Abdalla, I. F. (2024). “Domestic food production and consumption in Saudi Arabia: status quo and future prospects,” in Food and Nutrition Security in the Kingdom of Saudi Arabia, Vol. 1, eds. A. E. Ahmed, J. M. Al-Khayri, and A. A. Elbushra (Cham: Springer), 117–140. doi: 10.1007/978-3-031-46716-5_5
Abdelbaki, A. M., and Alzahrani, A. S. (2024). Gradually optimization of cropping pattern in Saudi Arabia for sustainable agricultural development until 2030. Ain Shams Eng. J. 15:102624. doi: 10.1016/j.asej.2023.102624
Alamri, Y. A., Alnafissa, M. A., Kotb, A., Alagsam, F., Aldakhil, A. I., Alfadil, I. E., et al. (2024). Estimating the expected commercial potential of saudi date exports to Middle eastern countries using the gravity model. Sustainability 16:2552. doi: 10.3390/su16062552
Alhamdan, A., Alamri, Y., Aljuhaim, F., Kotb, A., Aljohani, E., Alaagib, S., et al. (2024). Economic analysis of the impact of waste on the production and consumption of dates in Saudi Arabia. Sustainability 16:9588. doi: 10.3390/su16219588
Al-Khayri, J. M., Jain, S. M., and Johnson, D. V (2017). Date Palm Biotechnology Protocols, Vol. II: Germplasm Conservation and Molecular Breeding. New York, NY: Springer. doi: 10.1007/978-1-4939-7159-6
Al-Mssallem, M. Q., Al-Khayri, J. M., Alghamdi, B. A., Alotaibi, N. M., Alotaibi, M. O., Al-Qthanin, R. N., et al. (2024). “Role of date palm to food and nutritional security in Saudi Arabia,” in Food and Nutrition Security in the Kingdom of Saudi Arabia, Vol. 2: Macroeconomic Policy and Its Implication on Food and Nutrition Security, eds. A. E. Ahmed, J. M. Al-Khayri, and A. A. Elbushra (Cham: Springer International Publishing), 337–358. doi: 10.1007/978-3-031-46704-2_15
Alotaibi, B. A., Xu, W., Shah, A. A., and Ullah, W. (2024). Exploring climate-induced agricultural risk in Saudi Arabia: evidence from farming communities of Medina region. Sustainability 16:4245. doi: 10.3390/su16104245
Alotaibi, K. D., Alharbi, H. A., Yaish, M. W., Ahmed, I., Alharbi, S. A., Alotaibi, F., et al. (2023). Date palm cultivation: a review of soil and environmental conditions and future challenges. Land Degrad. Dev. 34, 2431–2444. doi: 10.1002/ldr.4619
Altinay, G., and Karagol, E. (2005). Electricity consumption and economic growth: evidence from Turkey. Energy Econ. 27, 849–856. doi: 10.1016/j.eneco.2005.07.002
Al-Zubeir, W. K. (2003). “Alternative water policies for the Gulf Cooperation Council countries,” in Developments in Water Science, Vol. 50 (Elsevier), 155–167. doi: 10.1016/S0167-5648(03)80014-X
Arabia, S. (2016). Saudi Vision 2030. Available online at: https://www.vision2030.gov.sa/en (Accessed November 7, 2025).
Awokuse, T. O., and Xie, R. (2015). Does agriculture really matter for economic growth in developing countries? Can. J. Agric. Econ. 63, 77–99. doi: 10.1111/cjag.12038
Aye, G. C., and Edoja, P. E. (2017). Effect of economic growth on CO2 emission in developing countries: evidence from a dynamic panel threshold model. Cogent Econ. Finance 5:1379239. doi: 10.1080/23322039.2017.1379239
Bakry, W., and Almohamad, S. (2018). Further evidence on Middle East and North Africa financial markets integration. Int. J. Econ. Bus. Res. 15, 1–22. doi: 10.1504/IJEBR.2018.088513
Balogun, O. L., Akinboro, O. S., Akinwole, O. T., and Osuji, E. E. (2019). An economic analysis of watermelon marketing. Int. J. Veg. Sci. 25, 355–361. doi: 10.1080/19315260.2018.1519625
Book, M. A. S. (2020). MEWA. Annual Statistical. Ministry of Environment, Water, and Agriculture, Riadyd, Saudi Arabia. Available online at: https://www.mewa.gov.sa/en/pages/default.aspx (Accessed November 14, 2025).
Breusch, T. S., and Godfrey, L. (2015). “A review of recent work on testing for auto-correlation in dynamic simultaneous models,” in Macroeconomic Analysis, eds. D. Currie, R. Nobay, and D. Peel (London: Routledge), 63–110.
Buturac, G. (2021). Measurement of economic forecast accuracy: a systematic overview of the empirical literature. J. Risk Financial Manage. 15:1. doi: 10.3390/jrfm15010001
Canova, F. (1999). “Vector autoregressive models: specification, estimation, inference, and forecasting,” in Handbook of Applied Econometrics, Vol. 1: Macroeconomics, eds. M. Hashem Pesaran and Michael R. Wickens (Oxford: Blackwell Publishing Ltd.), 53–110.
Chogou, S. K., Assogba, R., Degbey, H., Abokini, E., and Achigan-Dako, E. G. (2019). Market structure and performance of watermelon (Citrullus lanatus) in Benin. Sci. Afr. 3:e00048. doi: 10.1016/j.sciaf.2019.e00048
Chu, B., and Qureshi, S. (2023). Comparing out-of-sample performance of machine learning methods to forecast U.S. GDP growth. Comput. Econ. 62, 1567–1609. doi: 10.1007/s10614-022-10312-z
Corigliano, O., Morrone, P., and Algieri, A. (2025). Navigating the challenges of sustainability in the food processing chain: insights into energy interventions to reduce footprint. Energies 18:296. doi: 10.3390/en18020296
Engle, R. F., and Granger, C. W. (1987). Co-integration and error correction: representation, estimation, and testing. Econometrica 55, 251–276. doi: 10.2307/1913236
Evenett, S. J. (2005). WTO Accession: Lessons From Experience. Available online at: https://www.alexandria.unisg.ch/handle/20.500.14171/85414 (Accessed November 7, 2025).
FAO (2025). FAOSTAT. Rome: Food and Agriculture Organization of the United Nations. Available online at: https://openknowledge.fao.org/server/api/core/bitstreams/b49c8100-3e00-4cc6-b617-226edd7a9662/content (Accessed November 14, 2025).
Fu, H., Fang, Y., Qu, Y., and Pan, Y. (2021). A sustainable economic system to face the fluctuation of fruit prices: based on a small-region DSGE model. Discrete Dyn. Nat. Soc. 2021:6693709. doi: 10.1155/2021/6693709
Guerard, J., Thomakos, D., and Kyriazi, F. (2020). Automatic time series modeling and forecasting: a replication case study of forecasting real GDP, the unemployment rate and the impact of leading economic indicators. Cogent Econ. Finance 8:1759483. doi: 10.1080/23322039.2020.1759483
Hamad, A. O., Kai, K. H., Kijazi, A., Khamis, S. A., Abdalla, A. H., Ame, H. K., et al. (2022). The influence of climate variability on the Watermelon production in Zanzibar. Atmospheric Clim. Sci. 13, 44–61. doi: 10.4236/acs.2023.131004
Hoque, M. E., Billah, M., Kapar, B., and Naeem, M. A. (2024). Quantifying the volatility spillover dynamics between financial stress and US financial sectors: evidence from QVAR connectedness. Int. Rev. Financial Anal. 95:103434. doi: 10.1016/j.irfa.2024.103434
Johansen, S. (1991). Estimation and hypothesis testing of cointegration vectors in Gaussian vector autoregressive models. Econometrica 59:1551. Available online at: https://www.proquest.com/scholarly-journals/estimation-hypothesis-testing-cointegration/docview/214853255/se-2 (Accessed November 14, 2025).
Johansen, S. (1995). A statistical analysis of cointegration for I(2) variables. Econ. Theory 11, 25–59. doi: 10.1017/S0266466600009026
Johansen, S., and Juselius, K. (1990). Maximum likelihood estimation and inference on cointegration—with applications to the demand for money. Oxf. Bull. Econ. Stat. 52, 169–210. doi: 10.1111/j.1468-0084.1990.mp52002003.x
Juselius, K. (2006). The Cointegrated VAR Model: Methodology and Applications. Oxford: OUP. doi: 10.1093/oso/9780199285662.001.0001
Kayed, R. N., and Kabir Hassan, M. (2011). Saudi Arabia's economic development: entrepreneurship as a strategy. Int. J. Islamic Middle Eastern Finance Manage. 4, 52–73. doi: 10.1108/17538391111122203
Khan, T., Qiu, J., Qureshi, M. A. A., Iqbal, M. S., Mehmood, R., and Hussain, W. (2020). Agricultural fruit prediction using deep neural networks. Procedia Comput. Sci. 174, 72–78. doi: 10.1016/j.procs.2020.06.058
MacKinnon, J. G., Haug, A. A., and Michelis, L. (1999). Numerical distribution functions of likelihood ratio tests for cointegration. J. Appl. Econ. 14, 563–577. doi: 10.1002/(SICI)1099-1255(199909/10)14:5%3C563::AID-JAE530%3E3.0.CO;2-R
Mahomoodally, M. F., Khadaroo, S. K., Hosenally, M., Zengin, G., Rebezov, M., Ali Shariati, M., et al. (2023). Nutritional, medicinal and functional properties of different parts of the date palm and its fruit (Phoenix dactylifera L.) – a systematic review. Crit. Rev. Food Sci. Nutr. 64, 7748–7803. doi: 10.1080/10408398.2023.2191285
Manikandan, S. K., Gowda, N. K., Nair, V., Al-Ruzouq, R., Gibril, M. B. A., Lamghari, F., et al. (2025). Advancing date palm cultivation in the Arabian Peninsula and beyond: addressing stress tolerance, genetic diversity, and sustainable practices. Agric. Water Manage. 307:109242. doi: 10.1016/j.agwat.2024.109242
MOEWA (2023). National Center for Palms and Dates Initiatives. Riyadh: Ministry of Environment, Water and Agriculture.
Morgounov, A., Abubakr, M., Alhendi, A., Alkhatran, A., Alhuwaymil, H., and Ghosh, K. (2022). Agroclimatic zones and cropping systems in the southwestern regions of the Kingdom of Saudi Arabia: characterization, classification and improvement potential. Crops 2, 186–201. doi: 10.3390/crops2020014
Moumane, A., El Ghazali, F. E., Al Karkouri, J., Delorme, J., Batchi, M., Chafiki, D., et al. (2021). Monitoring spatiotemporal variation of groundwater level and salinity under land use change using integrated field measurements, GIS, geostatistical, and remote-sensing approach: case study of the Feija aquifer, Middle Draa watershed, Moroccan Sahara. Environ. Monit. Assess. 193:769. doi: 10.1007/s10661-021-09581-2
Ng, S., and Perron, P. (2001). Lag length selection and the construction of unit root tests with good size and power. Econometrica 69, 1519–1554. Available online at: http://www.jstor.org/stable/2692266 (Accessed November 14, 2025).
Pesaran, M. H., Shin, Y., and Smith, R. J. (2001). Bounds testing approaches to the analysis of level relationships. J. Appl. Econ. 16, 289–326. doi: 10.1002/jae.616
Rehman, A., Deyuan, Z., Hussain, I., Iqbal, M. S., Yang, Y., and Jingdong, L. (2018). Prediction of major agricultural fruits production in Pakistan by using an econometric analysis and machine learning technique. Int. J. Fruit Sci. 18, 445–461. doi: 10.1080/15538362.2018.1485536
Seleka, T. B., Obi, A., and Motsatsi, J. M. (2024). Competitiveness of the South African citrus fruit industry in the global market and its macroeconomic determinants. J. Agribusiness Dev. Emerg. Econ. doi: 10.1108/JADEE-02-2024-0055. [Epub ahead of print].
Sharma, K., Mahato, N., Cho, M. H., and Lee, Y. R. (2017). Converting citrus wastes into value-added products: economic and environmently friendly approaches. Nutrition 34, 29–46. doi: 10.1016/j.nut.2016.09.006
Thirtle, C., Lin, L., and Piesse, J. (2003). The impact of research-led agricultural productivity growth on poverty reduction in Africa, Asia and Latin America. World Dev. 31, 1959–1975. doi: 10.1016/j.worlddev.2003.07.001
Timmer, C. P. (2002). Agriculture and economic development. Handb. Agric. Econ. 2, 1487–1546. doi: 10.1016/S1574-0072(02)10011-9
Tokic, D. (2015). The 2014 oil bust: causes and consequences. Energy Policy 85, 162–169. doi: 10.1016/j.enpol.2015.06.005
Ullah, A., Khan, D., and Zheng, S. (2018). Testing long-run relationship between agricultural gross domestic product and fruits production: evidence from Pakistan. Ciência Rural 48:e20170854. doi: 10.1590/0103-8478cr20170854
Zhou, L., Iormom, B. I., Azhar, M. S., and Peng, M. Y. P. (2022). Domestic inflation, exchange rate, and aggregate import demand nexus in Nigeria: new evidence from cointegrating regression. Int. J. Finance Econ. 27, 4154–4165. doi: 10.1002/ijfe.2364
Zivot, E., and Andrews, D. W. K. (1992). Further evidence on the great crash, the oil-price shock, and the unit-root hypothesis. J. Business Econ. Stat. 10, 251–270. doi: 10.1080/07350015.1992.10509904
Keywords: fruit production, GDP, forecast error variance decomposition, Saudi Arabia, impulse response functions
Citation: Elzaki RM, Al-Mahish M and Rashed NM (2025) Modeling the fruit production-GDP Nexus in Saudi Arabia: evidence from cointegration and vector error correction model techniques. Front. Sustain. Food Syst. 9:1673399. doi: 10.3389/fsufs.2025.1673399
Received: 25 July 2025; Accepted: 27 October 2025;
Published: 21 November 2025.
Edited by:
Rozina Shaheen, Effat University, Saudi ArabiaReviewed by:
Shruti Mohapatra, Sri Sri University, IndiaHounaida Daly, University of Hail, Saudi Arabia
Copyright © 2025 Elzaki, Al-Mahish and Rashed. This is an open-access article distributed under the terms of the Creative Commons Attribution License (CC BY). The use, distribution or reproduction in other forums is permitted, provided the original author(s) and the copyright owner(s) are credited and that the original publication in this journal is cited, in accordance with accepted academic practice. No use, distribution or reproduction is permitted which does not comply with these terms.
*Correspondence: Raga M. Elzaki, cm1hbGlAa2Z1LmVkdS5zYQ==