 Qi Yan1,2
 Lingling Fan
- 1State Key Laboratory of Efficient Utilization of Arid and Semi-arid Arable Land in Northern China, Institute of Agricultural Resources and Regional Planning, Chinese Academy of Agricultural Sciences, Beijing, China
- 2Key Laboratory of Agricultural Remote Sensing (AGRIRS), Ministry of Agriculture and Rural Affairs, Institute of Agricultural Resources and Regional Planning, Chinese Academy of Agricultural Sciences, Beijing, China
- 3Institute of Environment and Sustainable Development in Agriculture, Chinese Academy of Agricultural Sciences, Beijing, China
- 4Agricultural Information Institute, Chinese Academy of Agricultural Sciences, Beijing, China
Against the backdrop of intensifying climate change and rapid population growth, the conflict between food production and water scarcity has become increasingly severe. Understanding how crop planting patterns evolve over space and time and regulating regional water footprints is critical for achieving sustainable agriculture under water constraints. However, comprehensive assessments of these hydrological impacts have been limited by the lack of long-term, high-resolution spatial distribution data. This study, conducted in the Beijing-Tianjin-Hebei (BTH) region of China, integrates multi-source remote sensing and meteorological data to develop an adaptive threshold-based algorithm for accurate winter wheat extraction. Using this high-precision mapping approach, we analyzed winter wheat planting dynamics from 1990 to 2019 and evaluated its implications for water resource stress. The proposed method achieves high mapping accuracy with an overall accuracy of 93% and Kappa coefficient of 0.89. Our findings reveal three distinct phases in wheat planting area changes, characterized by initial increase, subsequent decrease, and eventual stabilization. The southward shift in spatial distribution, evidenced by a 58-km migration of the planting centroids, led to significant water resource disparities. The unit-area water footprint in southern regions increased 2.6 times more than in northern areas (p < 0.01). Notably, blue water requirement surged by 68.7%, reaching 11.3 billion m3, while available green water declined by 72.0%. The spatial heterogeneity in water resource sensitivity to cropland changes demonstrates that different regions exhibit markedly different vulnerabilities. These findings highlight the urgent need for region-specific water management strategies. We recommend implementing spatially differentiated measures including irrigation quotas and crop rotation systems. Furthermore, developing coordinated water-food optimization plans could significantly enhance agricultural sustainability.
1 Introduction
Food security and water resource security are two fundamental pillars that support sustainable global development (Bwambale et al., 2022; Kang et al., 2017). Accounting for approximately 70% of global freshwater withdrawals, agricultural water use combined with continually rising consumption has placed unprecedented pressure on these resources (Davis et al., 2017; Li et al., 2020). At the same time, the global population is projected to increase to 9 billion by 2050 (Food and Agriculture Organization of the United Nations, 2023). To meet their needs, global food production needs to increase by approximately 50% (Fitton et al., 2019). This population explosion and the requirement for increased food production have fundamentally exacerbated the resource shortage situation (Ding et al., 2021).
Wheat, as one of the most widely cultivated irrigation crops globally, has the characteristic of high water consumption, which has a dual impact on food production safety and sustainable utilization of water resources (Fan et al., 2024). To scientifically evaluate the water resource effect of wheat production, the academic community has established multi-dimensional quantitative indicators (Al-Selwey et al., 2023; Pereira et al., 2020). Water requirement of wheat refers to the total water consumption composed of evaporation from the soil surface and transpiration of the plants under the conditions of suitable soil water and fertilizer, standardized management, and normal growth in large-scale high-yield areas (Pereira et al., 2021). This indicator is the core basis for determining the irrigation water requirement. The water footprint, from the perspective of the entire life cycle, quantifies the total amount of water resources consumed directly by the product and indirectly by the supply chain (Cao et al., 2023). The analysis of the temporal and spatial variation of water requirement can reveal the dual driving mechanisms. On the one hand, it reflects the effect of climate change on the water stress of crops (such as the intensification of evaporation due to warming) (Chen et al., 2021). On the other hand, it demonstrates the endogenous changes in water demand caused by variety renewal and farming transformation. The temporal and spatial assessment of water footprint decouples the coupling relationship between wheat production and water occupation, providing a quantitative basis for optimizing the water-food nexus.
Although the temporal and spatial characteristics of water requirement and the water footprint of wheat have been extensively studied, the existing results still have significant limitations. First, most of the existing studies focus on the overall or administrative unit scale of food crops, ignoring the heterogeneity of water resource utilization within the wheat-growing belts within a region (Chen et al., 2018; Mialyk et al., 2024). Second, current research lacks high-resolution water use dynamic analysis based on the crop growth cycle. The development of remote sensing technologies provides a new approach to solving this problem. By integrating multi-source remote sensing data and geographic spatial analysis techniques, a detailed spatiotemporal map of water consumption during the entire growth period of wheat can be constructed (Weiss et al., 2020; Xiao et al., 2024). This high-resolution assessment can not only accurately capture the spatiotemporal differentiation patterns of water resource utilization, reveal the interactive effects of multiple factors such as climate, farming, and irrigation, but also identify key areas for irrigation optimization (such as high-risk zones of groundwater overexploitation), thereby laying a scientific foundation for targeted intervention in sustainable production in water-scarce areas (Liu et al., 2022).
As a typical wheat-producing area sensitive to climate change, the North China Plain is facing multiple resource pressures (Kang and Eltahir, 2018). Against the background of global warming, this region is confronted with three major challenges. First, the change of precipitation patterns has exacerbated the mismatch between water supply and demand. The average annual precipitation in the temperate continental climate zone is 556 mm (1951–2018), but the coefficient of variation of precipitation has been relatively large in the past 30 years, with 60% of the precipitation concentrated in July and August (Ren et al., 2018). Meanwhile, the accumulated temperature above 0 °C has increased by 192 °C·d, causing the peak water demand period of wheat to advance and prolong. Second, extreme climate events have intensified the burden of irrigation. Among the 450-550 mm water requirement during the growth period, the frequency of spring drought has increased, raising the risk of water shortage during the critical water requirement period by 35%, and the irrigation dependence exceeds 80% (Lu et al., 2019; Rosa, 2022). Third, the deterioration of groundwater resources has worsened. The increase in temperature has accelerated evapotranspiration, coupled with the uncertainty of precipitation, forcing the average annual over-extraction to exceed 2.5 billion cubic meters, and the thickness of the aquifer has decreased by 1.2 meters in the past 10 years (Feng et al., 2013). Against this backdrop, it is necessary to dynamically monitor the evolution of water footprints under the quantifiable trend of warming and drying, identify the water-saving potential in high climate risk areas, and guide the optimization of regional and seasonal irrigation. For instance, in over-exploitation areas, intelligent drip irrigation systems can be adopted, the supplementary irrigation volume can be dynamically adjusted based on precipitation predictions, and marginal farmland can be converted to drought-resistant varieties, ultimately establishing a climate change-adaptive wheat production system (Ren et al., 2018). Moreover, despite extensive research on agricultural water use, few studies have systematically investigated the spatiotemporal impacts of crop pattern dynamics on water resource utilization, particularly the heterogeneous water management challenges arising from crop spatial migration.
The objective of this study is to analyze the spatial–temporal impact of the spatial distribution evolution of winter wheat in the North China Plain from 1990 to 2019 on water resource utilization based on high-resolution remote sensing data. We focused on the period from 1990 to 2019, which effectively captures the full cycle of intensive agricultural expansion and the ensuing water crisis in the North China Plain prior to the large-scale, centralized implementation of stringent groundwater governance policies around 2020 (Long et al., 2025). Analyzing this period establishes a critical baseline against which the efficacy of future conservation measures can be evaluated. First, we proposed an adaptive threshold method to extract the spatial distribution of winter wheat in the North China Plain from 1990 to 2019 using long-term Landsat images. Second, we calculated the water requirement and water footprint of winter wheat based on the extraction results. Finally, we analyzed the spatial–temporal impact of winter wheat planting on water resource utilization in the North China Plain from 1990 to 2019.
2 Materials and methods
2.1 Study area
We selected the Beijing-Tianjin-Hebei (BTH) region in the North China Plain as our study area. The BTH is located in the central part of the North China Plain, with geographical coordinates ranging from 113°27′E to 119°50′E and 36°05′N to 42°40′N, spanning the North China and Northeast China regions (Figure 1). The terrain is higher in the northwest and lower in the southeast, with mountainous and hilly areas in the northwest and plains in the southeast. The BTH has a temperate continental climate, characterized by dry and windy springs, hot and humid summers, cool and dry autumns, and cold and dry winters. The average annual precipitation is 484.5 mm, with significant temporal and spatial variations. Precipitation decreases from the coast to the inland and from the southeast to the northwest, with 65 to 75% of the precipitation concentrated in summer. The average annual temperature ranges from 3.8 to 13.1 °C, with the lowest temperature in January and the highest in July. The main cropping system in this region is double cropping, with winter wheat and summer corn as the main crops, along with sorghum, soybeans, and other economic crops. Wheat covers 34.5% of the total cultivated land area and is one of the most important food crops in BTH.

Figure 1. The spatial distribution and topographical characteristics of the BTH. (a) The spatial location of the BTH in China; (b) the primary land-use types in the Hebei Plain in 2015; (c) the topographical characteristics and boundaries of Landsat path/row coverage of the Hebei Plain. The blue points represent wheat samples, and the red points represent non-wheat samples in 2019, which were gathered from ground surveys collected in spring 2019 (592 wheat samples and 280 non-wheat samples) and Google Earth (157 wheat samples and 354 non-wheat samples).
2.2 Datasets and processing
2.2.1 Landsat data and preprocessing
The Hebei Plain covers 25 paths/rows (titles) of the Landsat Worldwide Reference System (WRS-2) (Figure 1). We obtained all applicable standard Level 1 Terrain-corrected (L1T) Landsat images in the growing period of winter wheat from 1990 to 2019, which have already been stored in the GEE platform as the image collection of Landsat 5 (TM)/8 (OLI) Surface Reflectance (SR).1 Here, we chose Landsat images from 1990, 2000, 2010, and 2019 to extract winter wheat information (if Landsat images in a given year were inaccessible, the images in adjacent years were used).
We excluded the poor-quality observations with cloud scores >20% according to the quality assessment band. For the poor-quality observations, we used the 67–100% confidence level (“yes” for the determination of the cloud cover condition) to exclude all the potentially poor observations. In addition, we calculated the vegetation index of NDVI using the Landsat SR image collection (Equation 1), which can be calculated as follows:
Where and are the surface reflectance values of the near-infrared band (0.76–0.90 mm) and red band (0.63–0.69 mm) in the Landsat sensor.
2.2.2 Field survey data
We gathered field survey data at ground sites in early April 2019 using the MG858 hand-held GPS receivers. The cropping patterns and their field truth were recorded at each site. In total, 872 ground truth sites (592 winter wheat samples and 280 non-wheat samples) were collected, 207 winter wheat samples were applied to establish the fundamental standard curve of winter wheat, and the remaining were used for accuracy assessment.
2.2.3 Meteorological datasets and auxiliary datasets
We collected daily meteorological data for 145 densely distributed meteorological stations in the BTH for the years 1989, 1990, 1999, 2000, 2009, 2010, 2018, and 2019 from the Resource and Environment Data Cloud Platform of the Chinese Academy of Sciences.2 The data included daily average temperature, daily maximum temperature, daily minimum temperature, precipitation, wind speed, sunshine duration, and relative humidity. Then, we obtained the statistical data of winter wheat irrigation area and farmland irrigation water consumption at the municipal level from 1990 to 2013 from a previous study (Zhou et al., 2020). In addition, we acquired 90 m resolution Digital Elevation Model (DEM) data from the GEE platform (See footnote 1).
2.3 Methodology
2.3.1 Algorithms to identify winter wheat fields
We proposed a phenology-based crop mapping algorithm (PBA) for winter wheat mapping (Figure 2). The growing season of winter wheat spans from late September of the current year to early June of the following year, covering a total of approximately 260 ~ 270 days. This period encompasses key growth stages: the initial emergence phase (October), the overwintering dormancy period (November to February), the green-up and vigorous growth stage (March to April), and the heading and maturing stage (May to mid-June). The core processes of this algorithm included fundamental standard curve determination of winter wheat, vector inner product similarity measurement, threshold determination of winter wheat classification, and accuracy assessment (Figure 3).
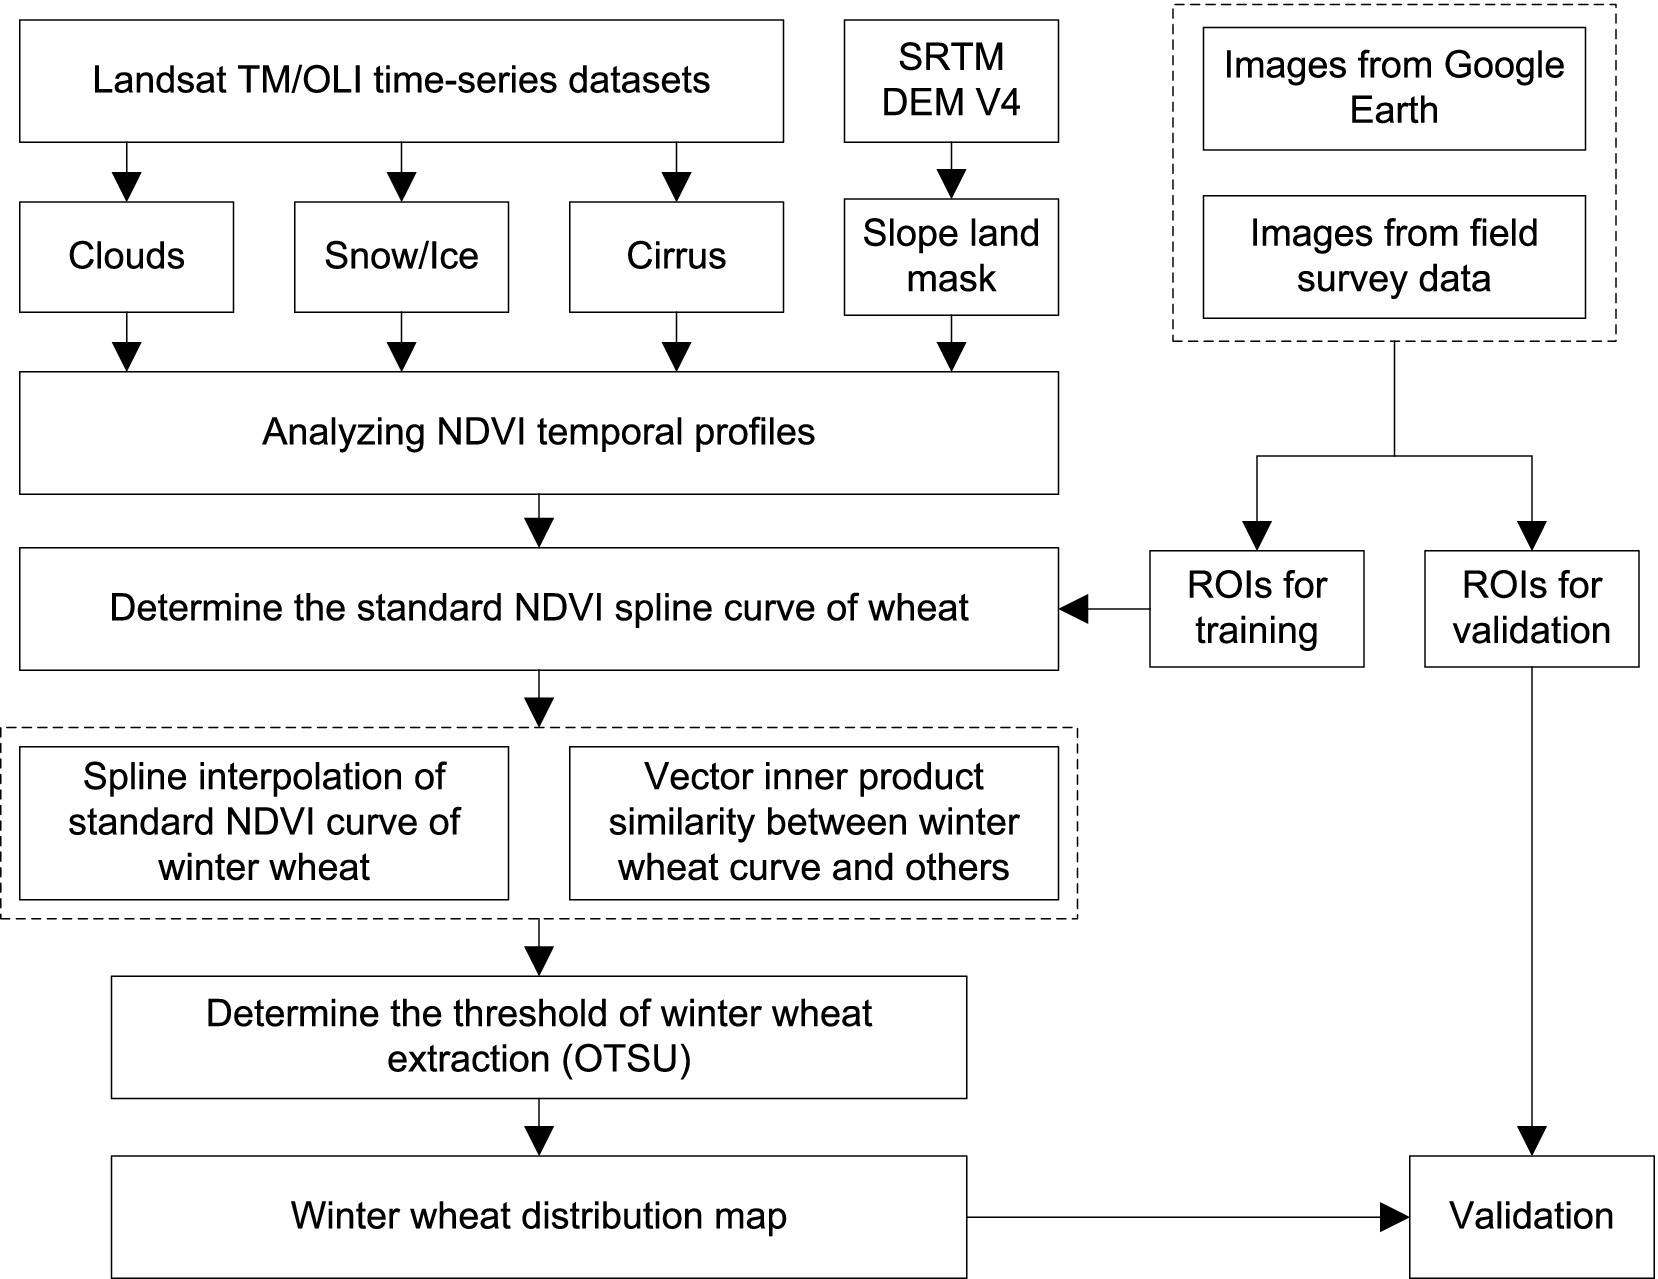
Figure 2. The workflow for pixel-based winter wheat mapping in this study. Major modules include Landsat data preprocessing, standard NDVI curve determination of winter wheat, vector inner product similarity measurement, and the threshold determination of winter wheat extraction. We used the regions of interest (ROIs) from field survey data and very high-resolution (VHR) images to validate the resultant winter wheat map.
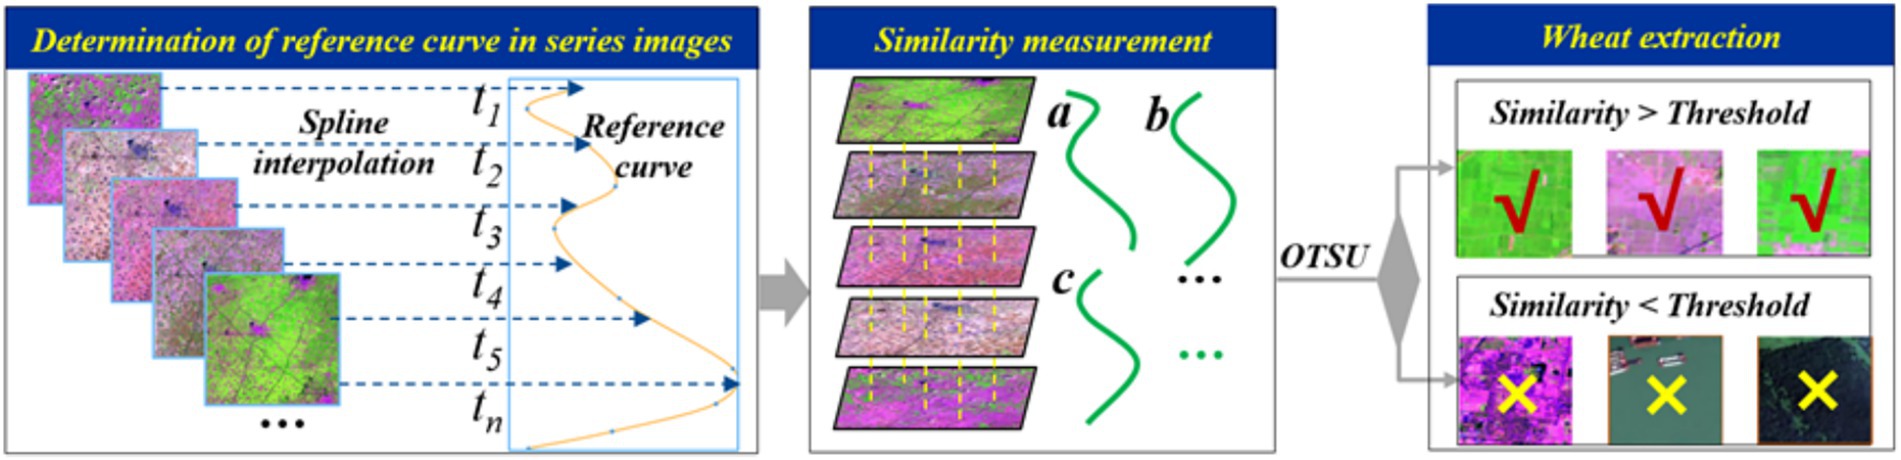
Figure 3. Schematic diagrams of the core module of the PBA algorithm. First, we applied spline interpolation on the fundamental standard curve across the different path/row images to obtain the reference curve library in the whole study area. Second, we used the inner product to measure the similarity between the reference array and each pixel array in the given path/row images. Third, we applied the approach of maximum interclass variance to determine the threshold and extract the winter wheat pixels.
To determine the fundamental standard curve of winter wheat, we used 207 random samples of field survey data to construct the fundamental standard curve of winter wheat. First, the imagery of red and near-infrared bands was used to calculate the NDVI index based on the preprocessed Landsat series data. Second, we calculated the average NDVI of the samples according to the different growth periods of winter wheat (280, 295, 320, 350, 380, 430, 480, 505, 525, and 537 days of the year (DOY)). To implement spline interpolation, we added 365 days in the second year to obtain a continuous DOY. Third, we obtained the fundamental standard curve of winter wheat using spline curve interpolation based on the abovementioned phenological dates and corresponding NDVI.
To determine the reference array library, we conducted spline curve interpolation on the fundamental standard curve to acquire the reference array of winter wheat in different path/row images (Figure 3). The phenological dates in different path/row images vary from one to another due to the different number of available images. This limited us from directly comparing the fundamental standard curve with the pixels in different path/row images using the method of the vector dot product mentioned below. Therefore, we performed spline interpolation on the fundamental standard curve according to the phenological dates of available images and then acquired the estimated reference array of winter wheat in different path/row images. With the iterative operation, we obtained the reference array library across the whole study area.
To measure the similarity between winter wheat pixels and others, we used the vector dot product to measure the similarity between the NDVI reference array of winter wheat and other objects (Equations 2, 3). For vectors a and b:
the dot product of a and b is given by:
where vectors a and b are needed to have the same number of rows and columns, and is a scalar; the larger the dot product is, the higher the similarity between a and b (Equation 4).
In addition, we used the maximum interclass variance (Otsu) to determine the threshold of winter wheat mapping. This approach assumes that the pixels can be classified into background and target and then calculates the optimal threshold to distinguish the two types of pixels.
We validated the results of this method mainly based on agricultural statistics and ground truth samples. First, we compared our results with the agricultural statistical data at the county level to examine the winter wheat map produced by PBA algorithms. The purpose of the comparison is to assess the quantitative agreement of our method. Then, we collected reference data from Google Earth evenly distributed ground surveys collected in the spring of 2019, together with a large amount (>3,000) to evaluate our results. In addition, we compared the Landsat-based result and the existing winter wheat map from the MODIS in the case region. The aim is to evaluate whether the multitemporal Landsat images can effectively capture the phenological information of winter wheat compared to the higher revisit frequency of MODIS (Supplementary materials).
2.3.2 The crop water requirements calculation
Crop water requirement refers to the sum of the evaporation from the soil surface between plants and the transpiration of plants under the conditions of suitable soil moisture and nutrients, good management, normal growth, and large-scale high yield (Blanc, 2020). The method for determining crop water requirement mainly involves field measurement, and theoretical calculation methods can also be used. In this study, crop coefficient method was adopted to calculate crop water requirements (Equation 5). The calculation formula is as follows:
where ETc is crop water requirement (mm), ET0 is reference evapotranspiration (mm), and Kc is crop coefficient.
The reference evapotranspiration is calculated using the Penman-Monteith method recommended by the Food and Agriculture Organization of the United Nations (FAO) (Equation 6), and the formula is as follows:
The crop coefficient is the ratio of the potential evapotranspiration of a crop to the reference evapotranspiration, reflecting the differences between different crops and the reference crop. This coefficient is an important parameter for calculating the actual water requirement of crops based on the reference evapotranspiration. In this study, the FAO-recommended method for determining crop coefficients was adopted (Allen et al., 1998). Based on the growth and development characteristics of the crops, they were classified into the initial growth period (from sowing to when the crop coverage approaches 10%, with the crop coefficient being Kcini), the rapid development period (from 10% coverage to full coverage, with the crop coefficient increasing from Kcini to Kcmin), the middle growth period (from full coverage to the beginning of the maturation stage, with the crop coefficient being Kcmin), and the mature stage (from when the crop leaves turn yellow to harvest, with the crop coefficient decreasing from Kcmin to Kcend). For winter wheat, this study sets Kcini = 0.7, Kcmin = 1.15, and Kcend = 0.4 (Table 1).

Table 1. Phenology-based crop coefficients (Kc) for winter wheat in the study area.
This choice was made for several reasons. First, conducting field experiments to derive locally calibrated Kc values for the entire study area over the 30-year period was not feasible. Second, using a consistent, internationally recognized benchmark minimizes spurious variations in our water footprint analysis, ensuring that the observed spatiotemporal patterns are primarily driven by changes in climate and planting distribution, rather than by arbitrary changes in Kc. While the FAO-56 Kc values provide a robust and widely accepted estimate, it is important to note that they do not account for potential variations due to specific crop cultivars, inter-annual differences in management, or microclimatic conditions.
2.3.3 The effective rainfall calculation
The effective rainfall during the crop growth period refers to the amount of rainfall that can be provided to the crops for evaporation and transpiration, thereby reducing the crops’ requirement for irrigation water. Calculating the rainfall and evaporation amounts for each period for the crops requires obtaining the measured data of the initial soil water storage and the maximum water storage volume for that period. However, it is very difficult to obtain the measured data. Therefore, this study adopts a simplified method for calculating the effective rainfall:
where Pe represents the effective rainfall (mm), and P represents the precipitation during the growth period (mm) (Equation 7).
2.3.4 The blue and green water requirements
The blue water requirement and green water requirement are, respectively, defined as the portions of the total crop water requirement that are supplied by blue water and green water (Equations 8, 9). Irrigation is the main method for winter wheat cultivation in BTH. The portions of green water and blue water in the crop water requirement can be calculated using the following formula:
Where ETg is the green water required for the growth of crop c throughout the entire growth period in region n (mm), and ETb is the blue water required for the growth of crop c throughout the entire growth period in region n (mm).
To verify the water requirement of winter wheat calculated in this study, we compared our results with previous studies (Supplementary materials). By comparing the research results on the water requirement and water footprint of wheat in the relevant regions from existing literature, we found that although some results had slight differences due to the variations in research time and region, the overall results of this study were consistent with those of the existing literature (Supplementary Table S1).
2.3.5 The crop water footprint calculation
Virtual water refers to the amount of water resources required by the products of crops or during the process of providing those products’ services. This study calculates the virtual water content of crops from the perspective of water requirement for crops, dividing the crops into primary, processed, by-products, and non-water-consuming products. The calculation method of virtual water varies depending on the product level. Calculating the virtual water content of primary agricultural products of winter wheat from the perspective of water requirement for crops means that in the actual growing environment, the virtual water content of each unit of primary agricultural products is equal to the ratio of the water requirement of each unit area of crops to the crop yield (Equation 10). The calculation formula for the virtual water content of primary agricultural products of crops is:
represents the virtual water content in the unit winter wheat product c of region n (m3/t), represents the yield of winter wheat product c in region n (kg/m2), represents the water consumption during the production process of winter wheat product c in region n (mm).
According to the concept of water footprint, the water footprint of crop production in a country or region is the amount of water resources consumed during the growth of crops in that country or region, which is the sum of the blue water and green water footprints (Equation 11).
Where is the crop water footprint (m3), is the total production of the crop (kg), is the planting area of winter wheat product c in region n (m2).
2.3.6 The spatial–temporal impacts analysis
To analyze the spatiotemporal impacts of the spatial distribution of winter wheat on water resource utilization from 1990 to 2019, four time points (1990, 2000, 2010, and 2019) were selected for this study. We extracted the spatial distribution of winter wheat, the spatial distribution of water requirement, and water footprint for each pixel from ArcGIS, and obtained the spatial information (latitude, longitude, and elevation) and attribute (winter wheat area) of each pixel. Then, we analyzed the spatiotemporal distribution characteristics of wheat planting area, water requirement, and water footprint in the latitude direction. First, we divided the study area along the latitude direction into equally spaced grids with a spacing of 10 km. Then, for the three periods of 1990–2000, 2000–2010, and 2010–2019, we calculated the wheat area, water requirement, and water footprint within each fishing net. Finally, we conducted a correlation analysis based on the statistical data of wheat area and water resource utilization indicators to analyze the spatial–temporal impacts of wheat planting area on water resources.
3 Results
3.1 Landsat-derived winter wheat map from 1990 to 2019
The results showed that winter wheat dominated the Hebei Plain and was mainly distributed in the plains of southern Hebei Province (Figure 4), which is consistent with the terrain shown in Figure 1. The thresholds of winter wheat extraction across different paths/rows were distinctly discriminatory, ranging from 0.5 to 1.3.
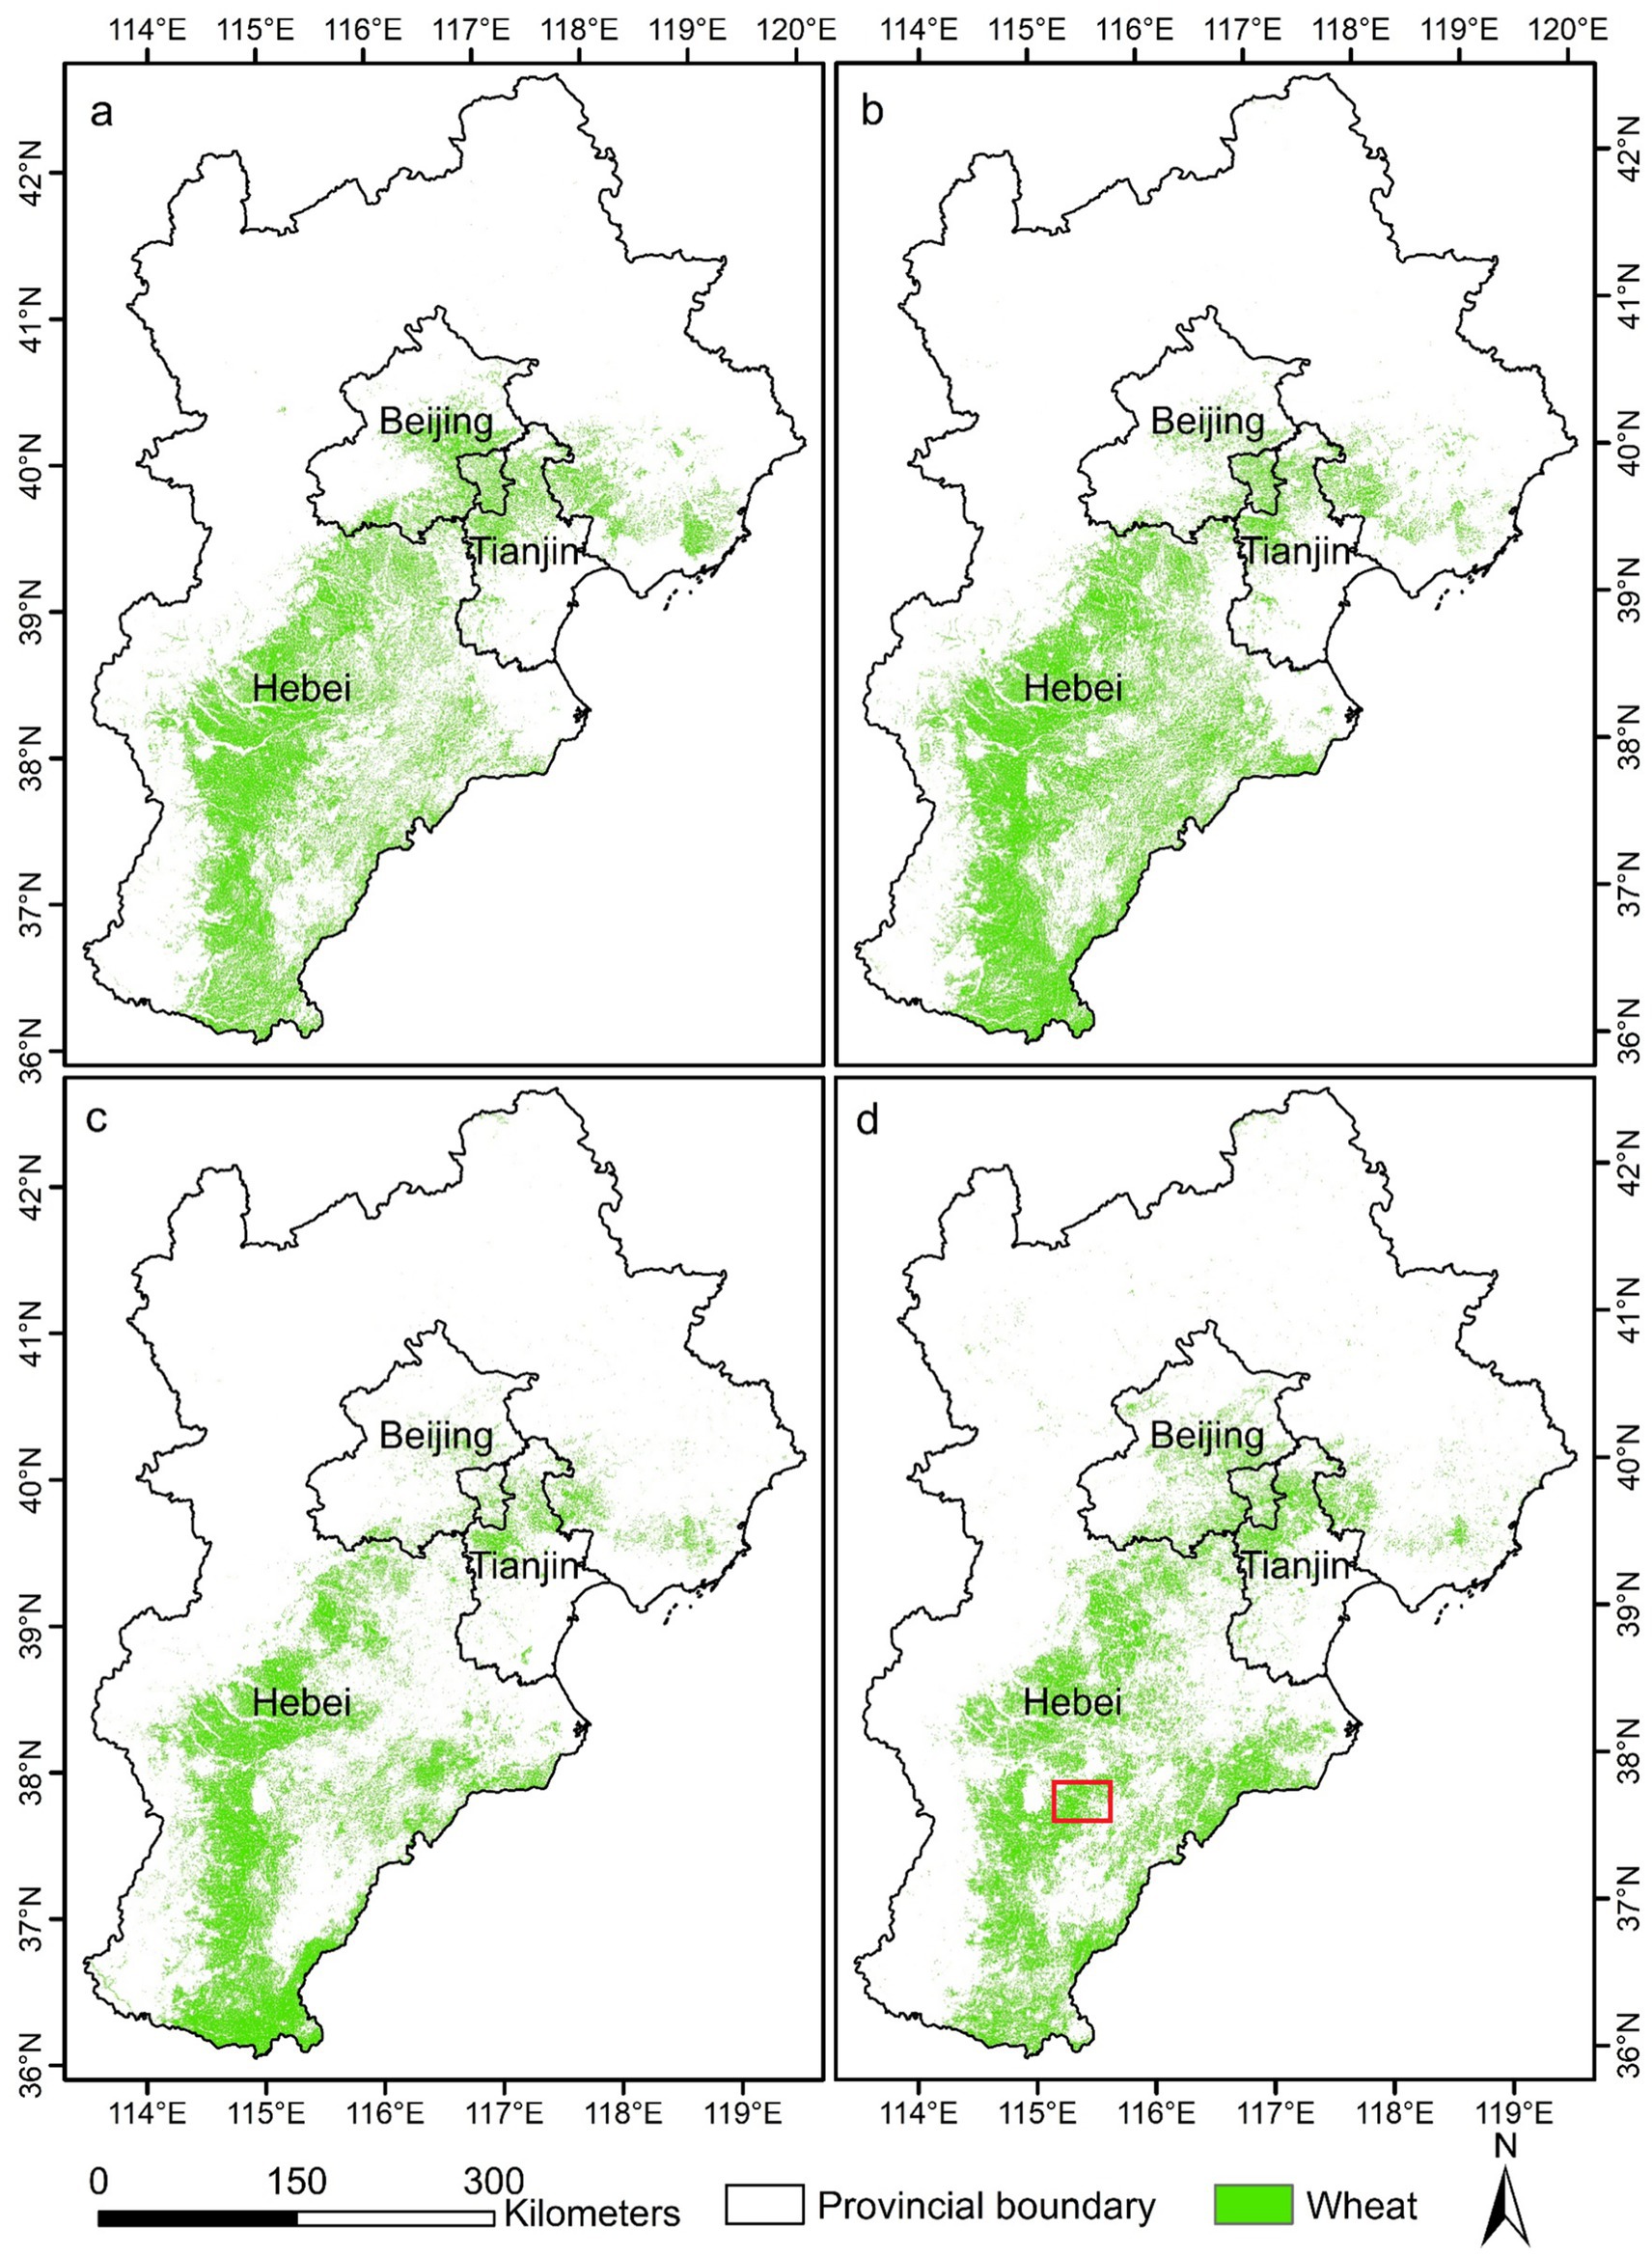
Figure 4. Winter wheat map in the Hebei Plain from 1990 to 2019 based on the PBA method (a: 1990, b: 2000, c: 2010, and d: 2019). The red box in Map (d) shows the location of the case area in Figure 7. The legends for maps (a–c) are the same as for map (d).
Our results showed that the Hebei Plain mainly exhibited a loss of winter wheat from 1990 to 2019, with large spatial variations between different periods (Figure 5). From 1990 to 2000, the Hebei Plain showed an overall gain in winter wheat, with sporadic loss in the peri-urban areas (i.e., Beijing) (Figure 5a). From 2000 to 2010, the Hebei Plain indicated an overall loss of winter wheat (Figure 5b). From 2010 to 2019, winter wheat gain occurred in the eastern plains, while winter wheat loss occurred in the western plains (Figure 5c).
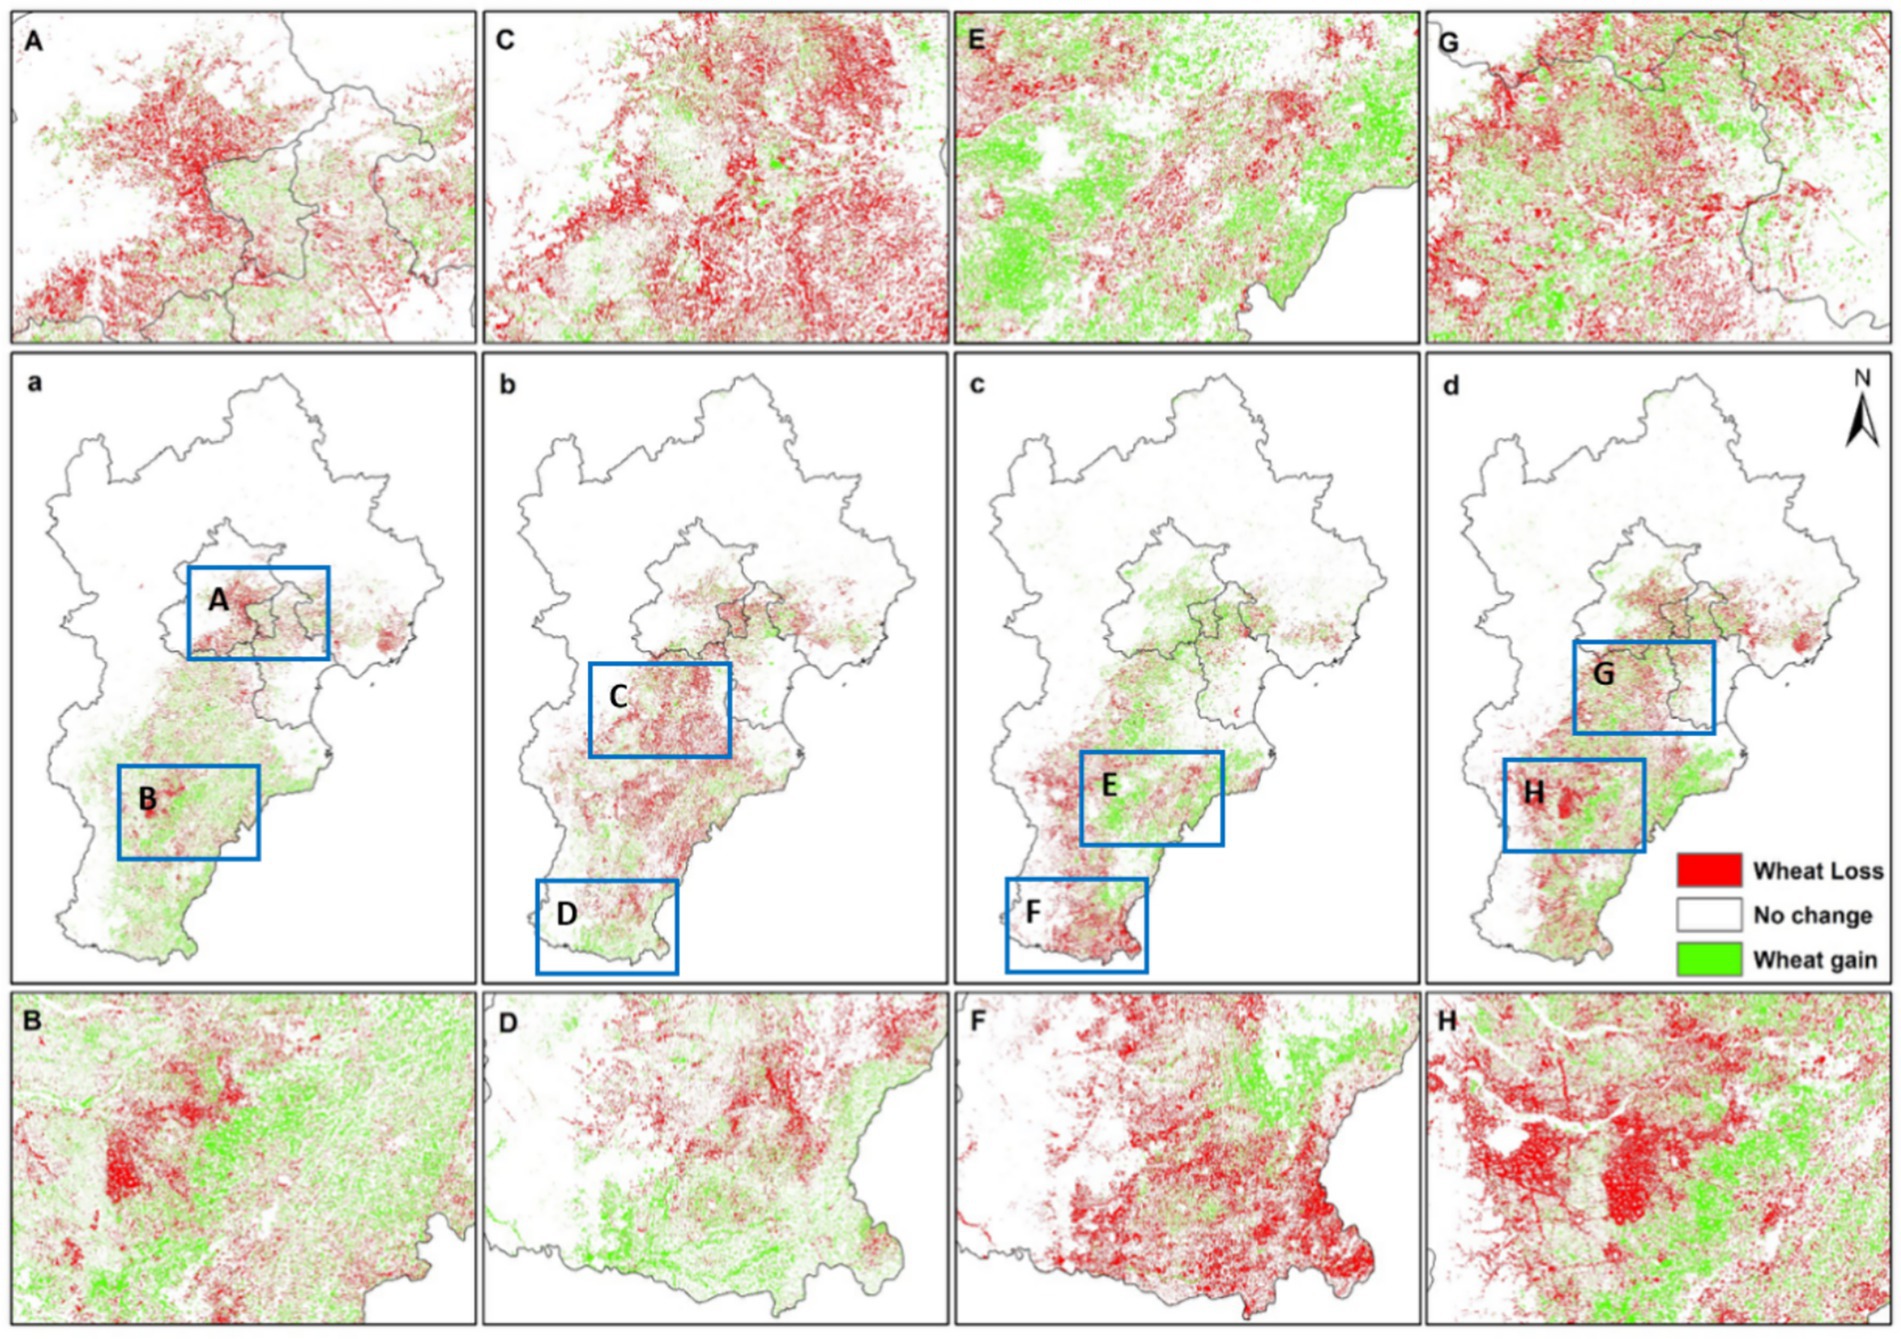
Figure 5. The geographical change in winter wheat distribution from 1990 to 2019 (a: 1990–2000, b: 2000–2010, c: 2010–2019, d: 1990–2019). The zoom-in images (A–H) show details in different regions (maps A and B show the spatial changes in winter wheat from 1990 to 2000; maps C and D show the spatial changes in winter wheat from 2000 to 2010; maps E and F show the spatial changes in winter wheat from 2010 to 2019; and maps G and H show the spatial changes in winter wheat from 1990 to 2019). The legends for maps (a–c) are the same as for map (d).
3.2 Agreement evaluation with statistical data and ground truth samples
Despite a slight overestimation when compared to the agricultural statistical data, the results indicated that the Landsat-derived winter wheat area had a high correlation with the agricultural census data. The Landsat-derived areas of winter wheat in 1990, 2000, 2010, and 2019 were 28910.68 km2, 32365.58 km2, 27178.29 km2, and 23661.66 km2, respectively (the agricultural statistical data were 24636.93 km2 in 1990, 30118.47 km2 in 2000, and 25865.23 km2 in 2010, and the data in 2019 were unavailable). At the county level, the Landsat-derived winter wheat area estimated by the PBA algorithm correlated well with agricultural statistical data, with relatively high coefficients of determination (0.76 in 1990, 0.76 in 2000, and 0.81 in 2010) (Figure 6).
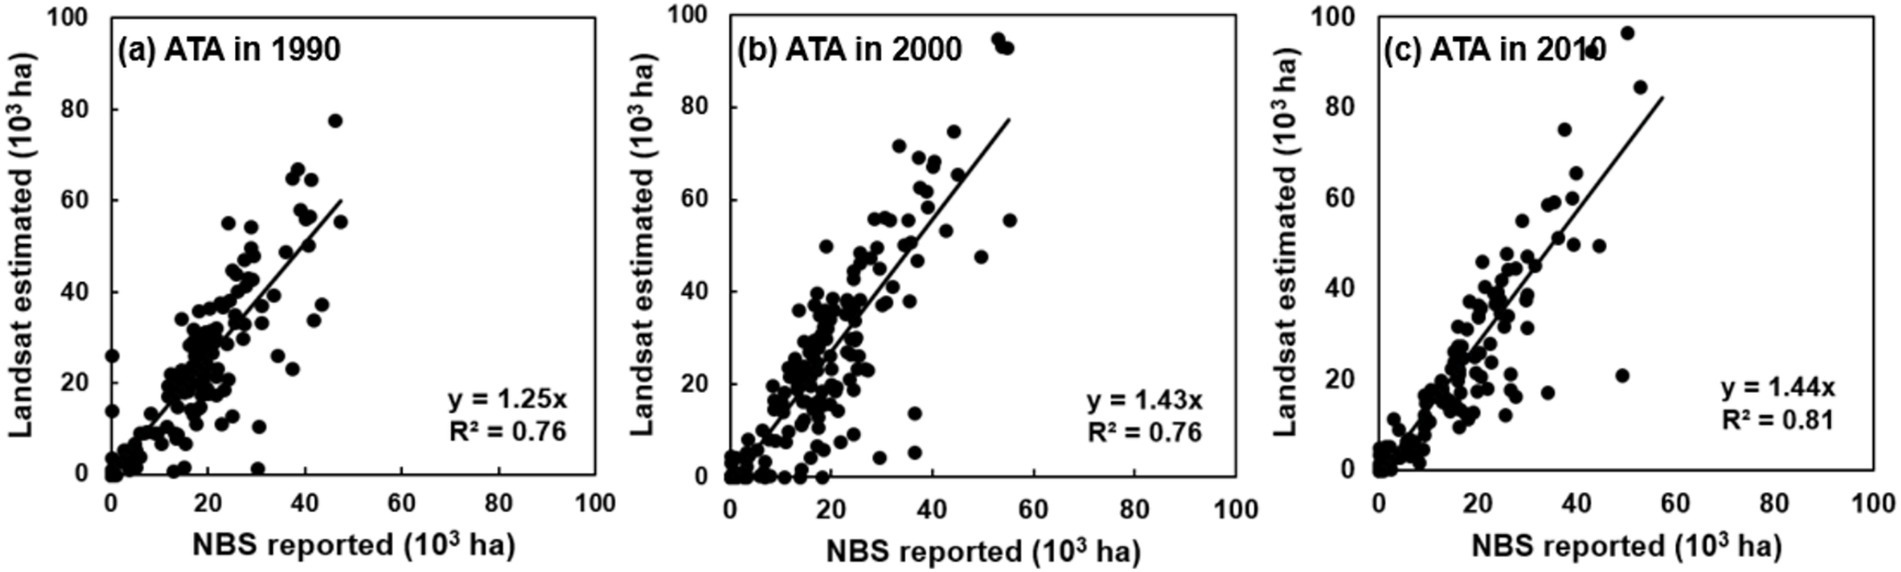
Figure 6. County-level comparisons of winter wheat area between agricultural statistical data and Landsat-estimated maps based on PBA in (a) 1990, (b) 2000, and (c) 2010. Since there were no available county-level statistics for comparison in 2019, we conducted an agreement evaluation with statistical data for the 3 years.
The validation using VHR images (i.e., Google Earth) and ground survey sites indicated that the Landsat-based winter wheat map from 1990 to 2019 had high accuracy, with an average overall accuracy of 0.93 (Table 2). The average user accuracy and producer accuracy of the winter wheat category are 0.94 and 0.93, respectively. The accuracy of the winter wheat maps was different in each year, with 2019 having the highest producer accuracy in the winter wheat category (0.96), followed by 2000 (0.94), 1990 (0.93), and 2010 (0.89). The user accuracy of winter wheat was highest in 2010 (0.99), followed by 2019 (0.97), 2000 (0.92), and 1990 (0.89) (Table 2).
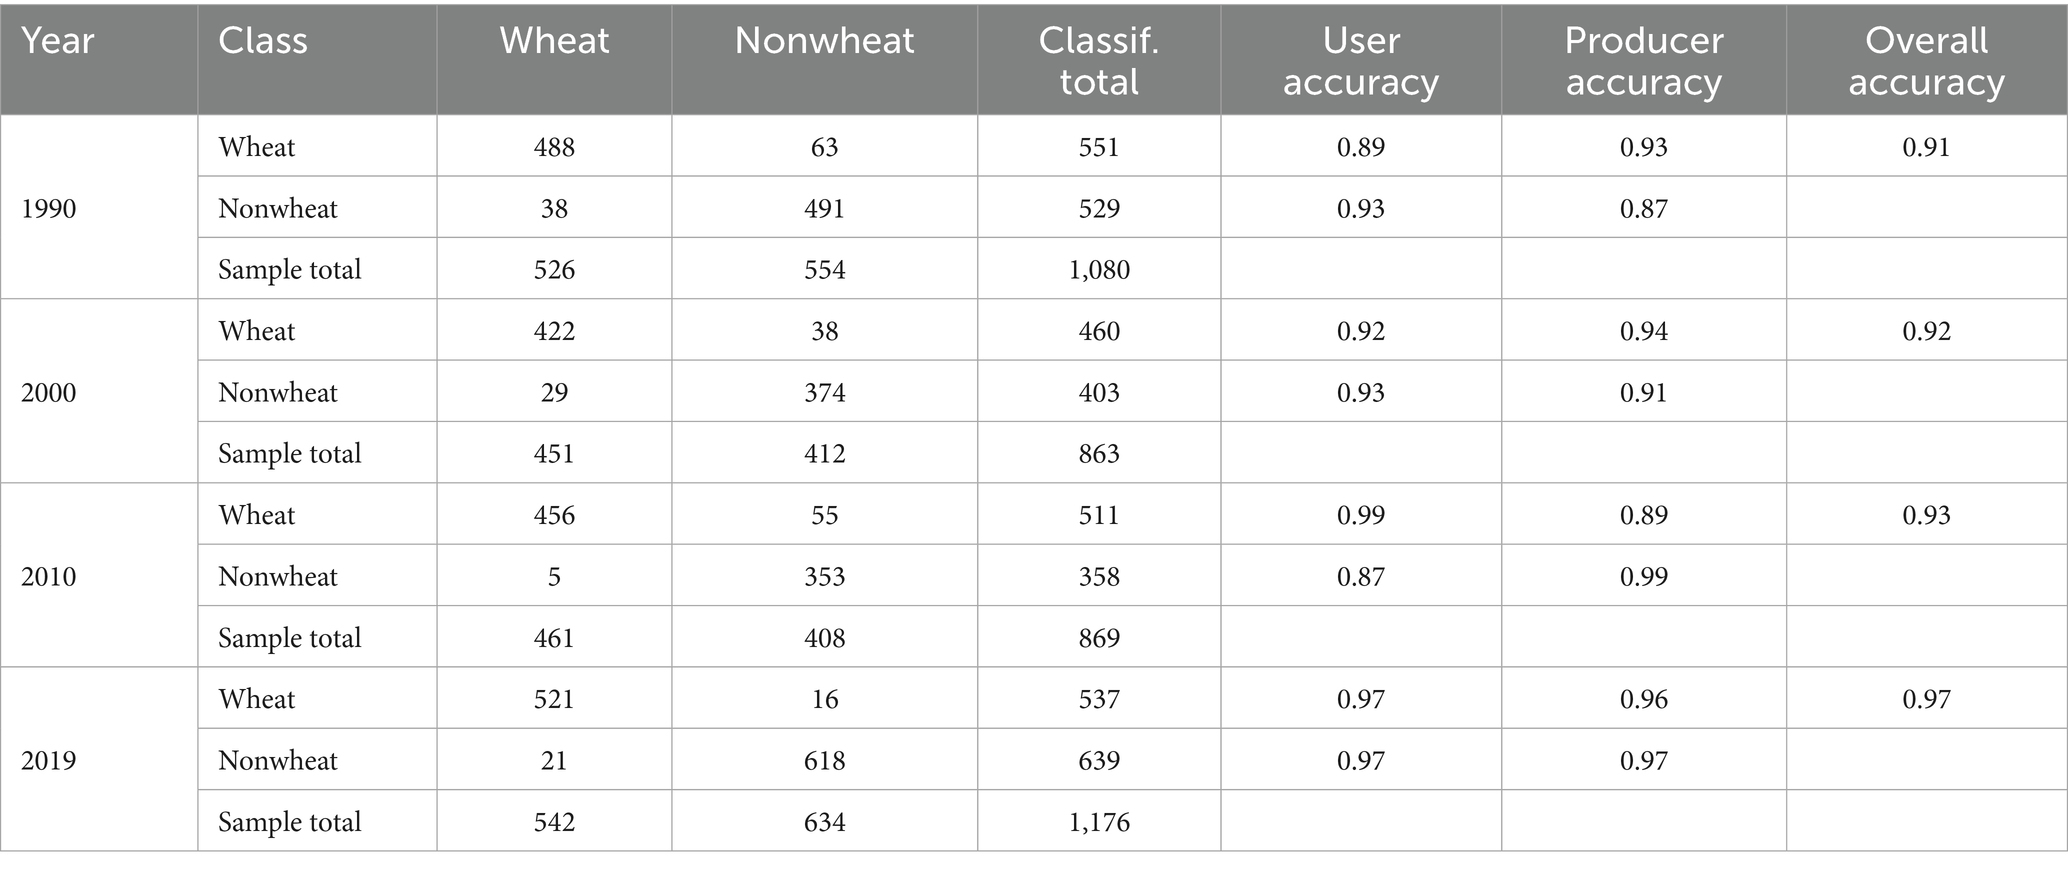
Table 2. Confusion matrix of winter wheat validation based on the samples from Google Earth and the ground survey sites.
We also have compared our phenology-based winter wheat maps with existing winter wheat maps (Figure 7). The comparison between the Landsat-based map and the existing MODIS-based map indicated that the Landsat-based map could more accurately depict the boundaries and details of winter wheat fields, even though both products exhibited high spatial accuracy (Figure 7). First, because of little change in the winter wheat area from 2010 to 2013 in the Hebei Plain (agricultural statistical data: 25865.23 km2 in 2010 and 24387.44 km2 in 2013), we compared the Landsat-based winter wheat map in 2010 and the existing MODIS-based map in 2013. We found that the Landsat-based result had more detailed information, which can identify the road boundaries between winter wheat fields. Second, we made a comparison between the Landsat-based maps using the phenology-based method of combining variations before and after heading dates (CBAH) (Qiu et al., 2017) and our PBA approach. The results showed that the integrality and details of winter wheat fields produced by our method can be better identified than that of CBAH (Figure 7).
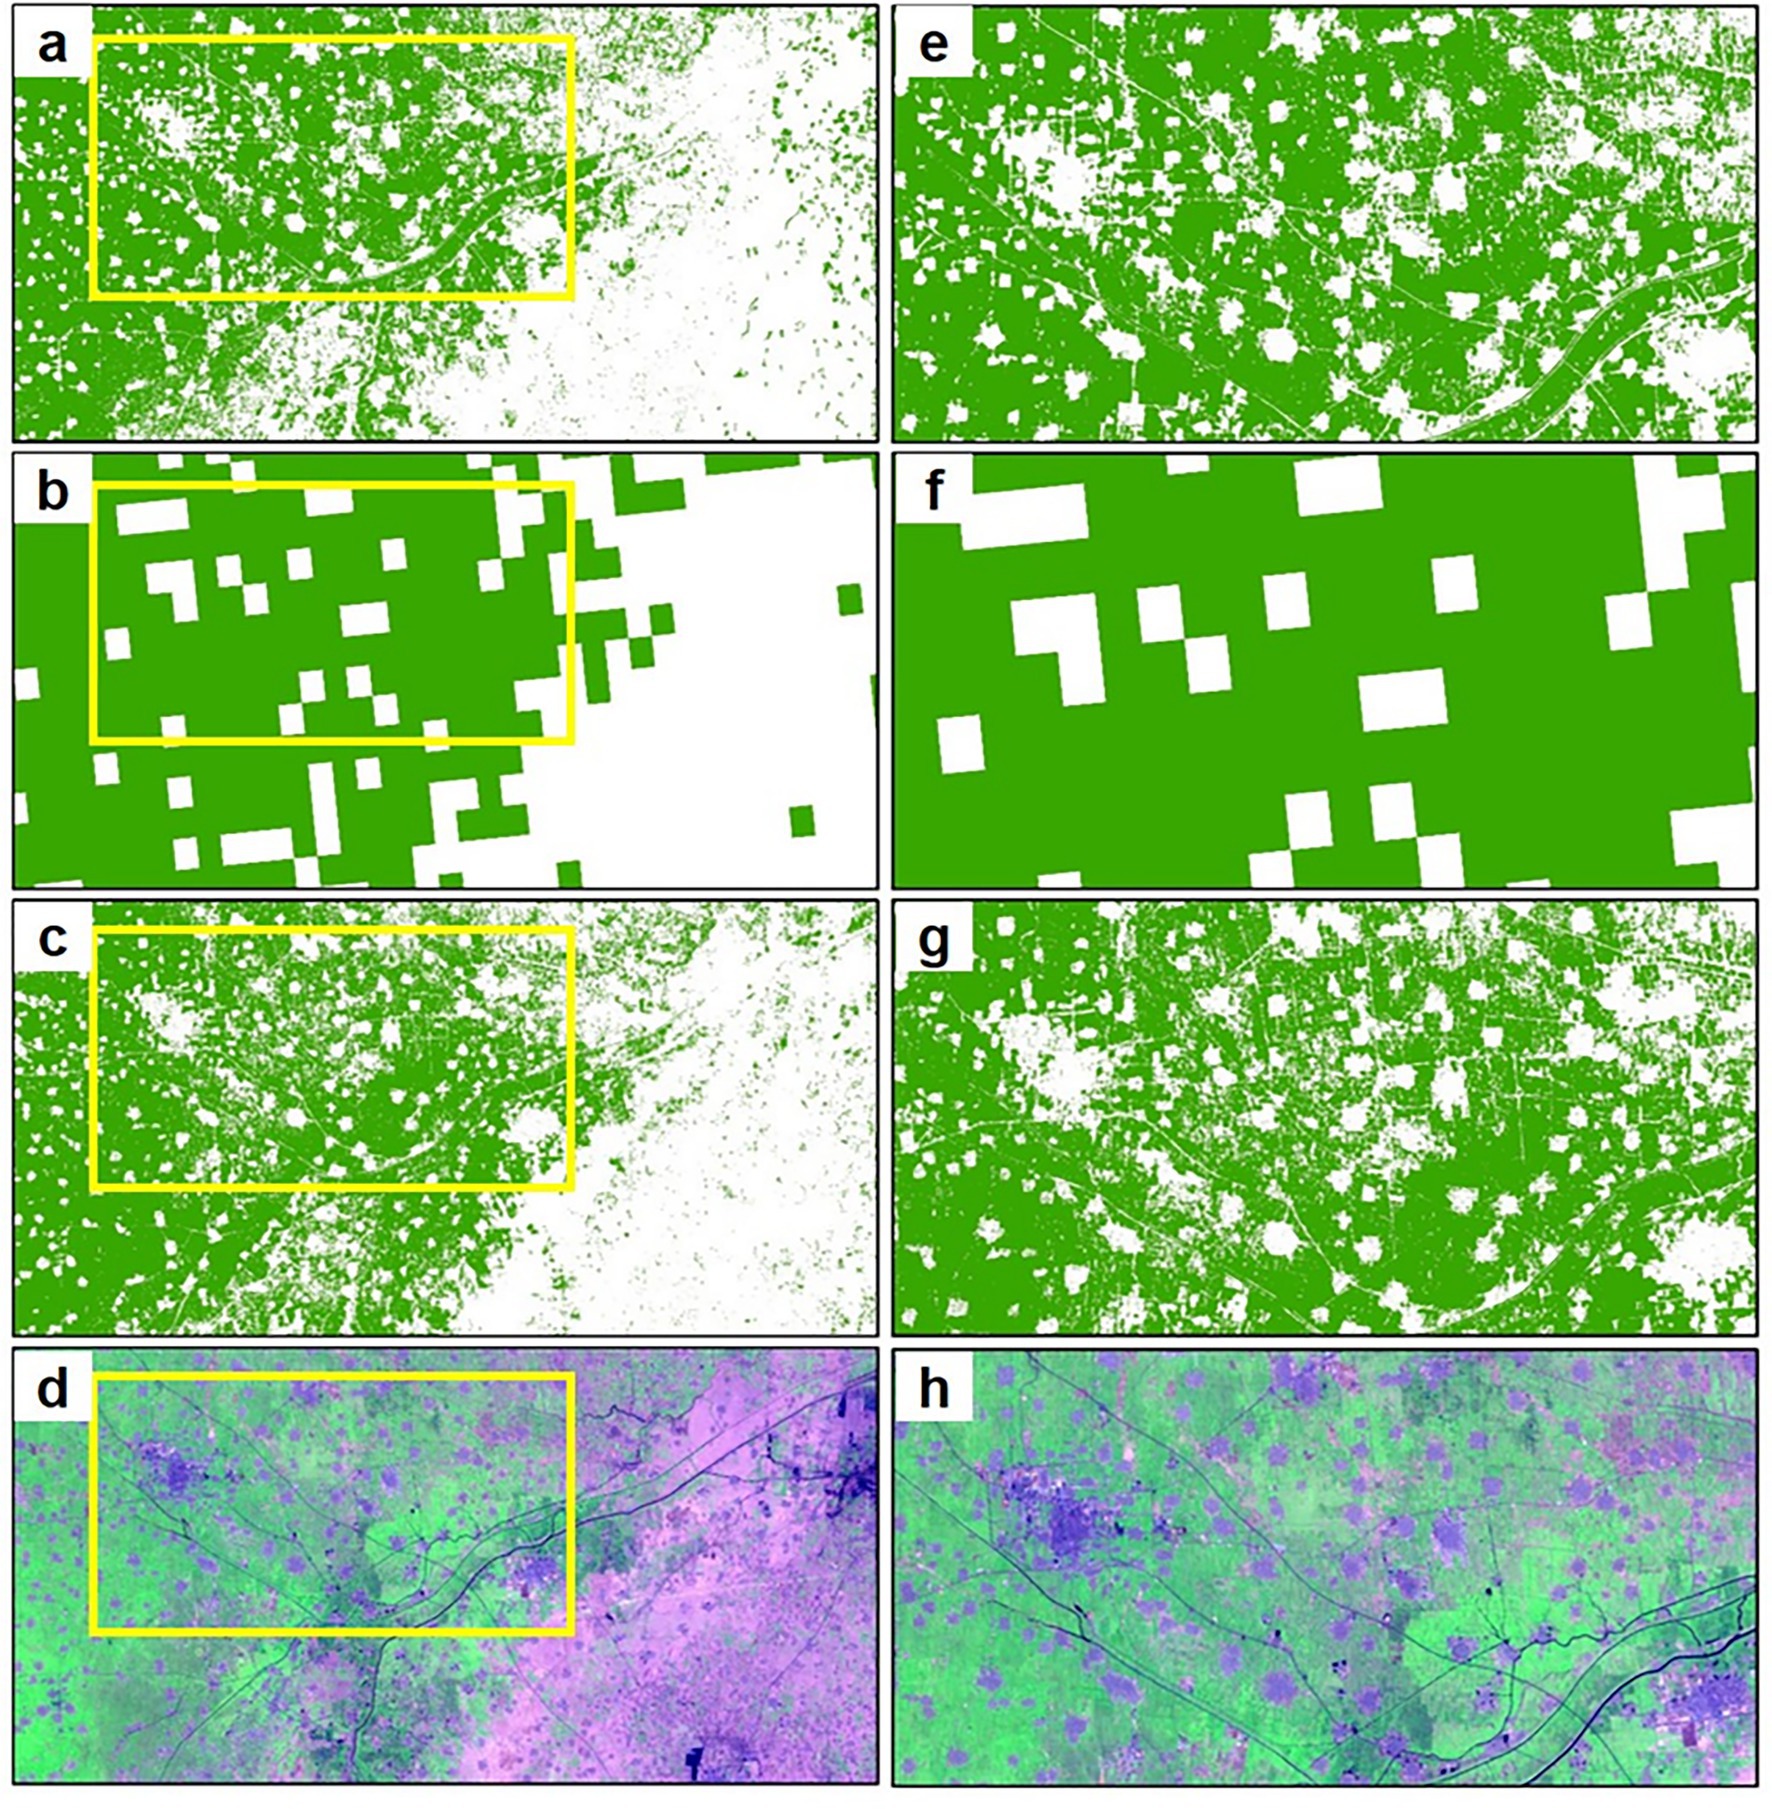
Figure 7. Comparison between Landsat-derived 30-m winter wheat map, MODIS-derived 250-m winter wheat map, and Landsat-derived 30-m winter wheat map in 2010 produced by CBAH in a typical winter wheat region (the location is shown in Figure 4 Map d) in Hengshui city, North China Plain. (a): 30-m Landsat-derived map, (b): 250-m MODIS-derived map produced by CBAH, (c): 30-m Landsat-based map using CBAH, and (d) Landsat color composite image acquired on April 2, 2010. Maps (e–h) show the local details of (a–d) within the yellow rectangular.
3.3 The spatial–temporal distribution of water requirements and water footprints
3.3.1 The spatial–temporal distribution of water requirements
Over the past three decades, there has been significant regional heterogeneity and dynamic evolution in the water resource requirement for winter wheat in the eastern plain (Figure 8). The high-demand areas for total water consumption have always been in the eastern plain, while the center of blue water requirement has shifted towards the ecologically sensitive mountain-plain transition zone (Figure 9). The spatial pattern of green water requirement has remained relatively stable, but the planting response has changed significantly (Figure 10). During the study period, especially after 2010, the range of water demand expanded, shifted southward towards the coast, and was accompanied by a trend of planting structure adjustment, highlighting the profound impact of climate change (or management factors) on the water resource pressure in this region’s agriculture and the complexity of response strategies.
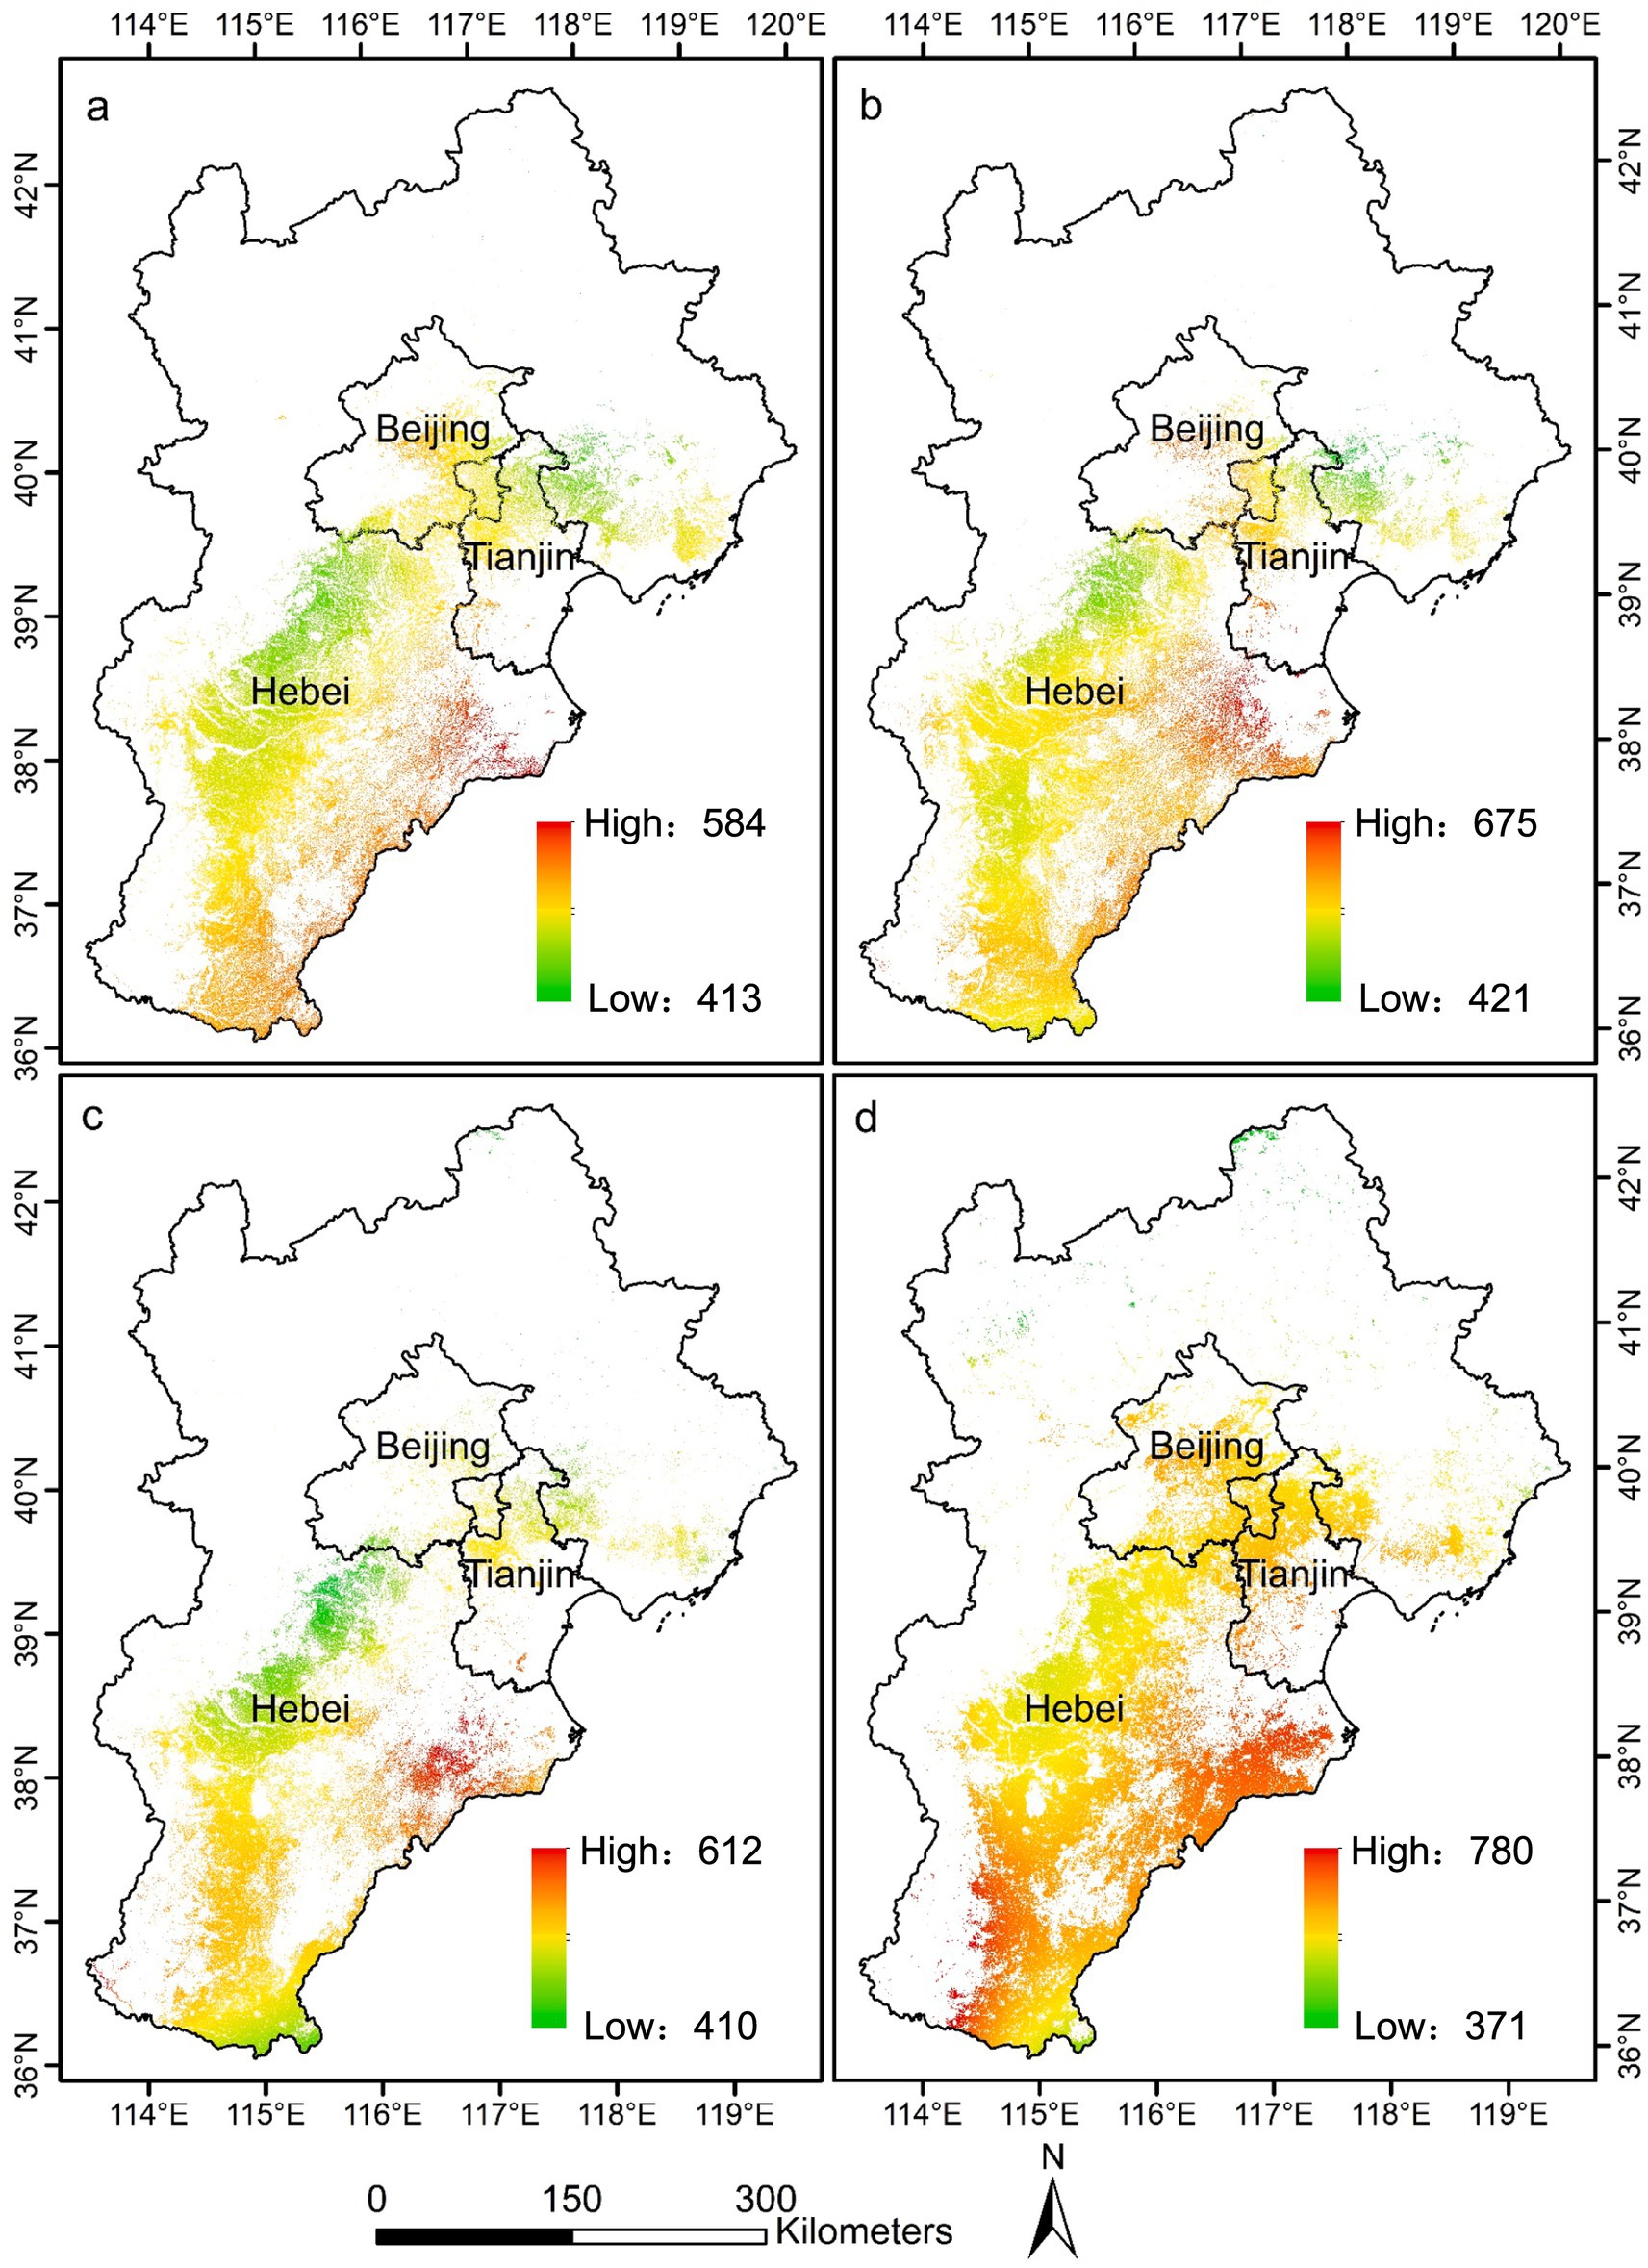
Figure 8. Spatial–temporal distribution of water requirement of winter wheat from 1990 to 2019 (a: 1990, b: 2000, c: 2010, d: 2019). The data units in the figure are in millimeters (mm).

Figure 9. Spatial–temporal distribution of blue water requirement of winter wheat from 1990 to 2019 (a: 1990, b: 2000, c: 2010, d: 2019). The data units in the figure are in millimeters (mm).

Figure 10. Spatial–temporal distribution of green water requirement of winter wheat from 1990 to 2019 (a: 1990, b: 2000, c: 2010, d: 2019). The data units in the figure are in millimeters (mm).
From 1990 to 2019, the spatial pattern of total water requirement for winter wheat (371–780 mm) remained relatively stable, with high-value areas concentrated in the eastern plain and low-value areas in the mountain-plain transition zone (Figure 8). The total water requirement increased overall from 1990 to 2000, with an expansion of planting area in the east. It slightly decreased from 2000 to 2010, with a reduction in the eastern planting area. From 2010 to 2019, the range expanded, and the total requirement increased, especially in the south and the eastern coastal areas. The blue water requirement (103–598 mm) showed significant spatiotemporal changes, with high-value areas initially existing in both the transition zone and the eastern plain, gradually shifting towards the transition zone, and low-value areas in the northern hills (Figure 9). The green water requirement (78–411 mm) had a basically stable spatial pattern from 1990 to 2010, with the low-value area (east) and high-value area (transition zone) experiencing expansion and contraction of planting area around 2000 (Figure 10).
3.3.2 The spatial–temporal distribution of water footprint
The water footprint of winter wheat production in the BTH from 1990 to 2019 showed a downward trend (149 to 136 billion cubic meters), with a stable spatial pattern (high in the east and low in mountainous areas) (Figure 11). However, there was a structural reversal with a sharp increase in blue water footprint (67 to 113 billion cubic meters) and a significant decrease in green water footprint (82 to 23 billion cubic meters), indicating a transformation in regional agricultural water use from reliance on natural precipitation to irrigation dependence.

Figure 11. Spatial–temporal distribution of water footprint of winter wheat from 1990 to 2019 (a: 1990, b: 2000, c: 2010, d: 2019). The data units in the figure are cubic meters (m3).
The average total water footprint over 30 years was 150 billion cubic meters, with high-value areas persistently distributed in the eastern plains and low-value areas located in the mountain foothills and northern hills (Figure 12). From 1990 to 2000, the water footprint rose due to the expansion of wheat planting in the east. From 2000 to 2010, the reduction in wheat areas in the eastern parts of Beijing and Tianjin led to a slight decrease. From 2010 to 2019, spatial heterogeneity increased, with new high-value expansion points emerging in the eastern coastal and southern mountain foothills.
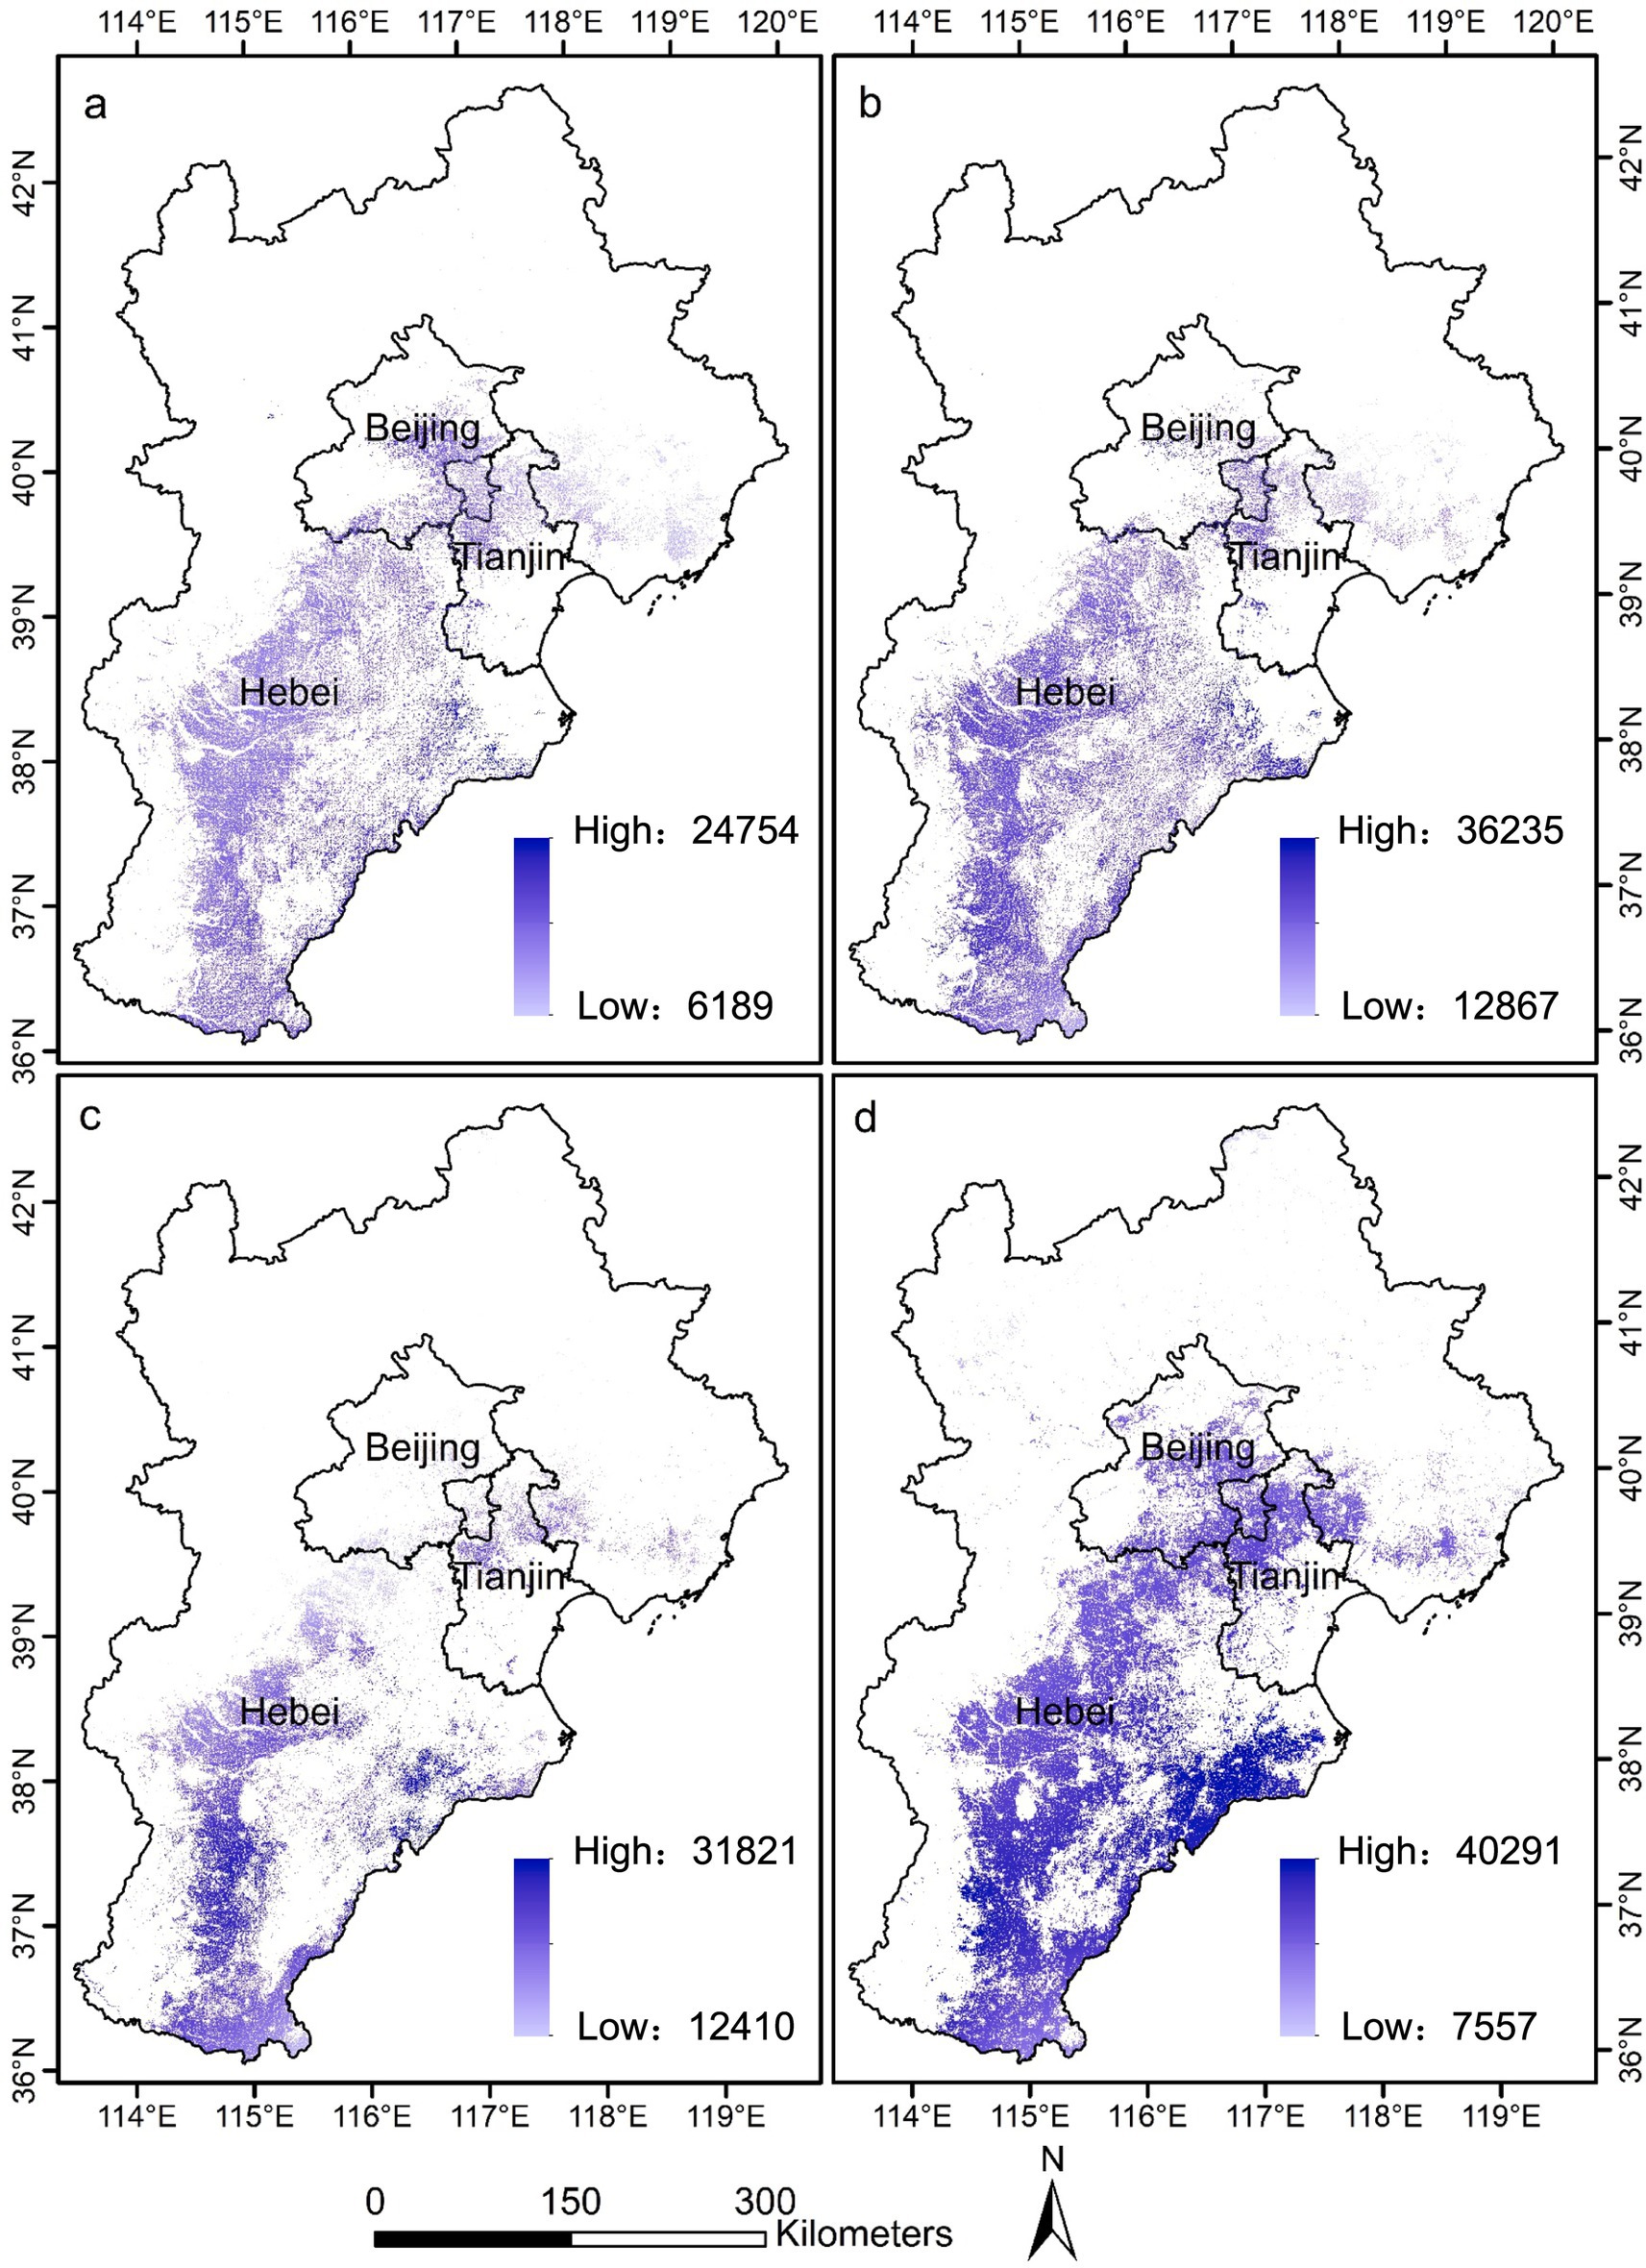
Figure 12. Spatial–temporal distribution of blue water footprint of winter wheat from 1990 to 2019 (a: 1990, b: 2000, c: 2010, d: 2019). The data units in the figure are cubic meters (m3).
The blue water footprint (average 105 billion cubic meters) changed in tandem with the total water footprint, reflecting the increasing dominance of irrigation (Figure 12). The green water footprint shrank to an average of 45 billion cubic meters, with a spatial distribution opposite that of blue water (Figure 13). This scissors-like difference highlights the deterioration of rain-fed conditions due to climate change or intensified cultivation, forcing production to shift towards the eastern plains and emerging coastal areas with high irrigation demands. There is an urgent need to optimize water resource allocation and planting structure.
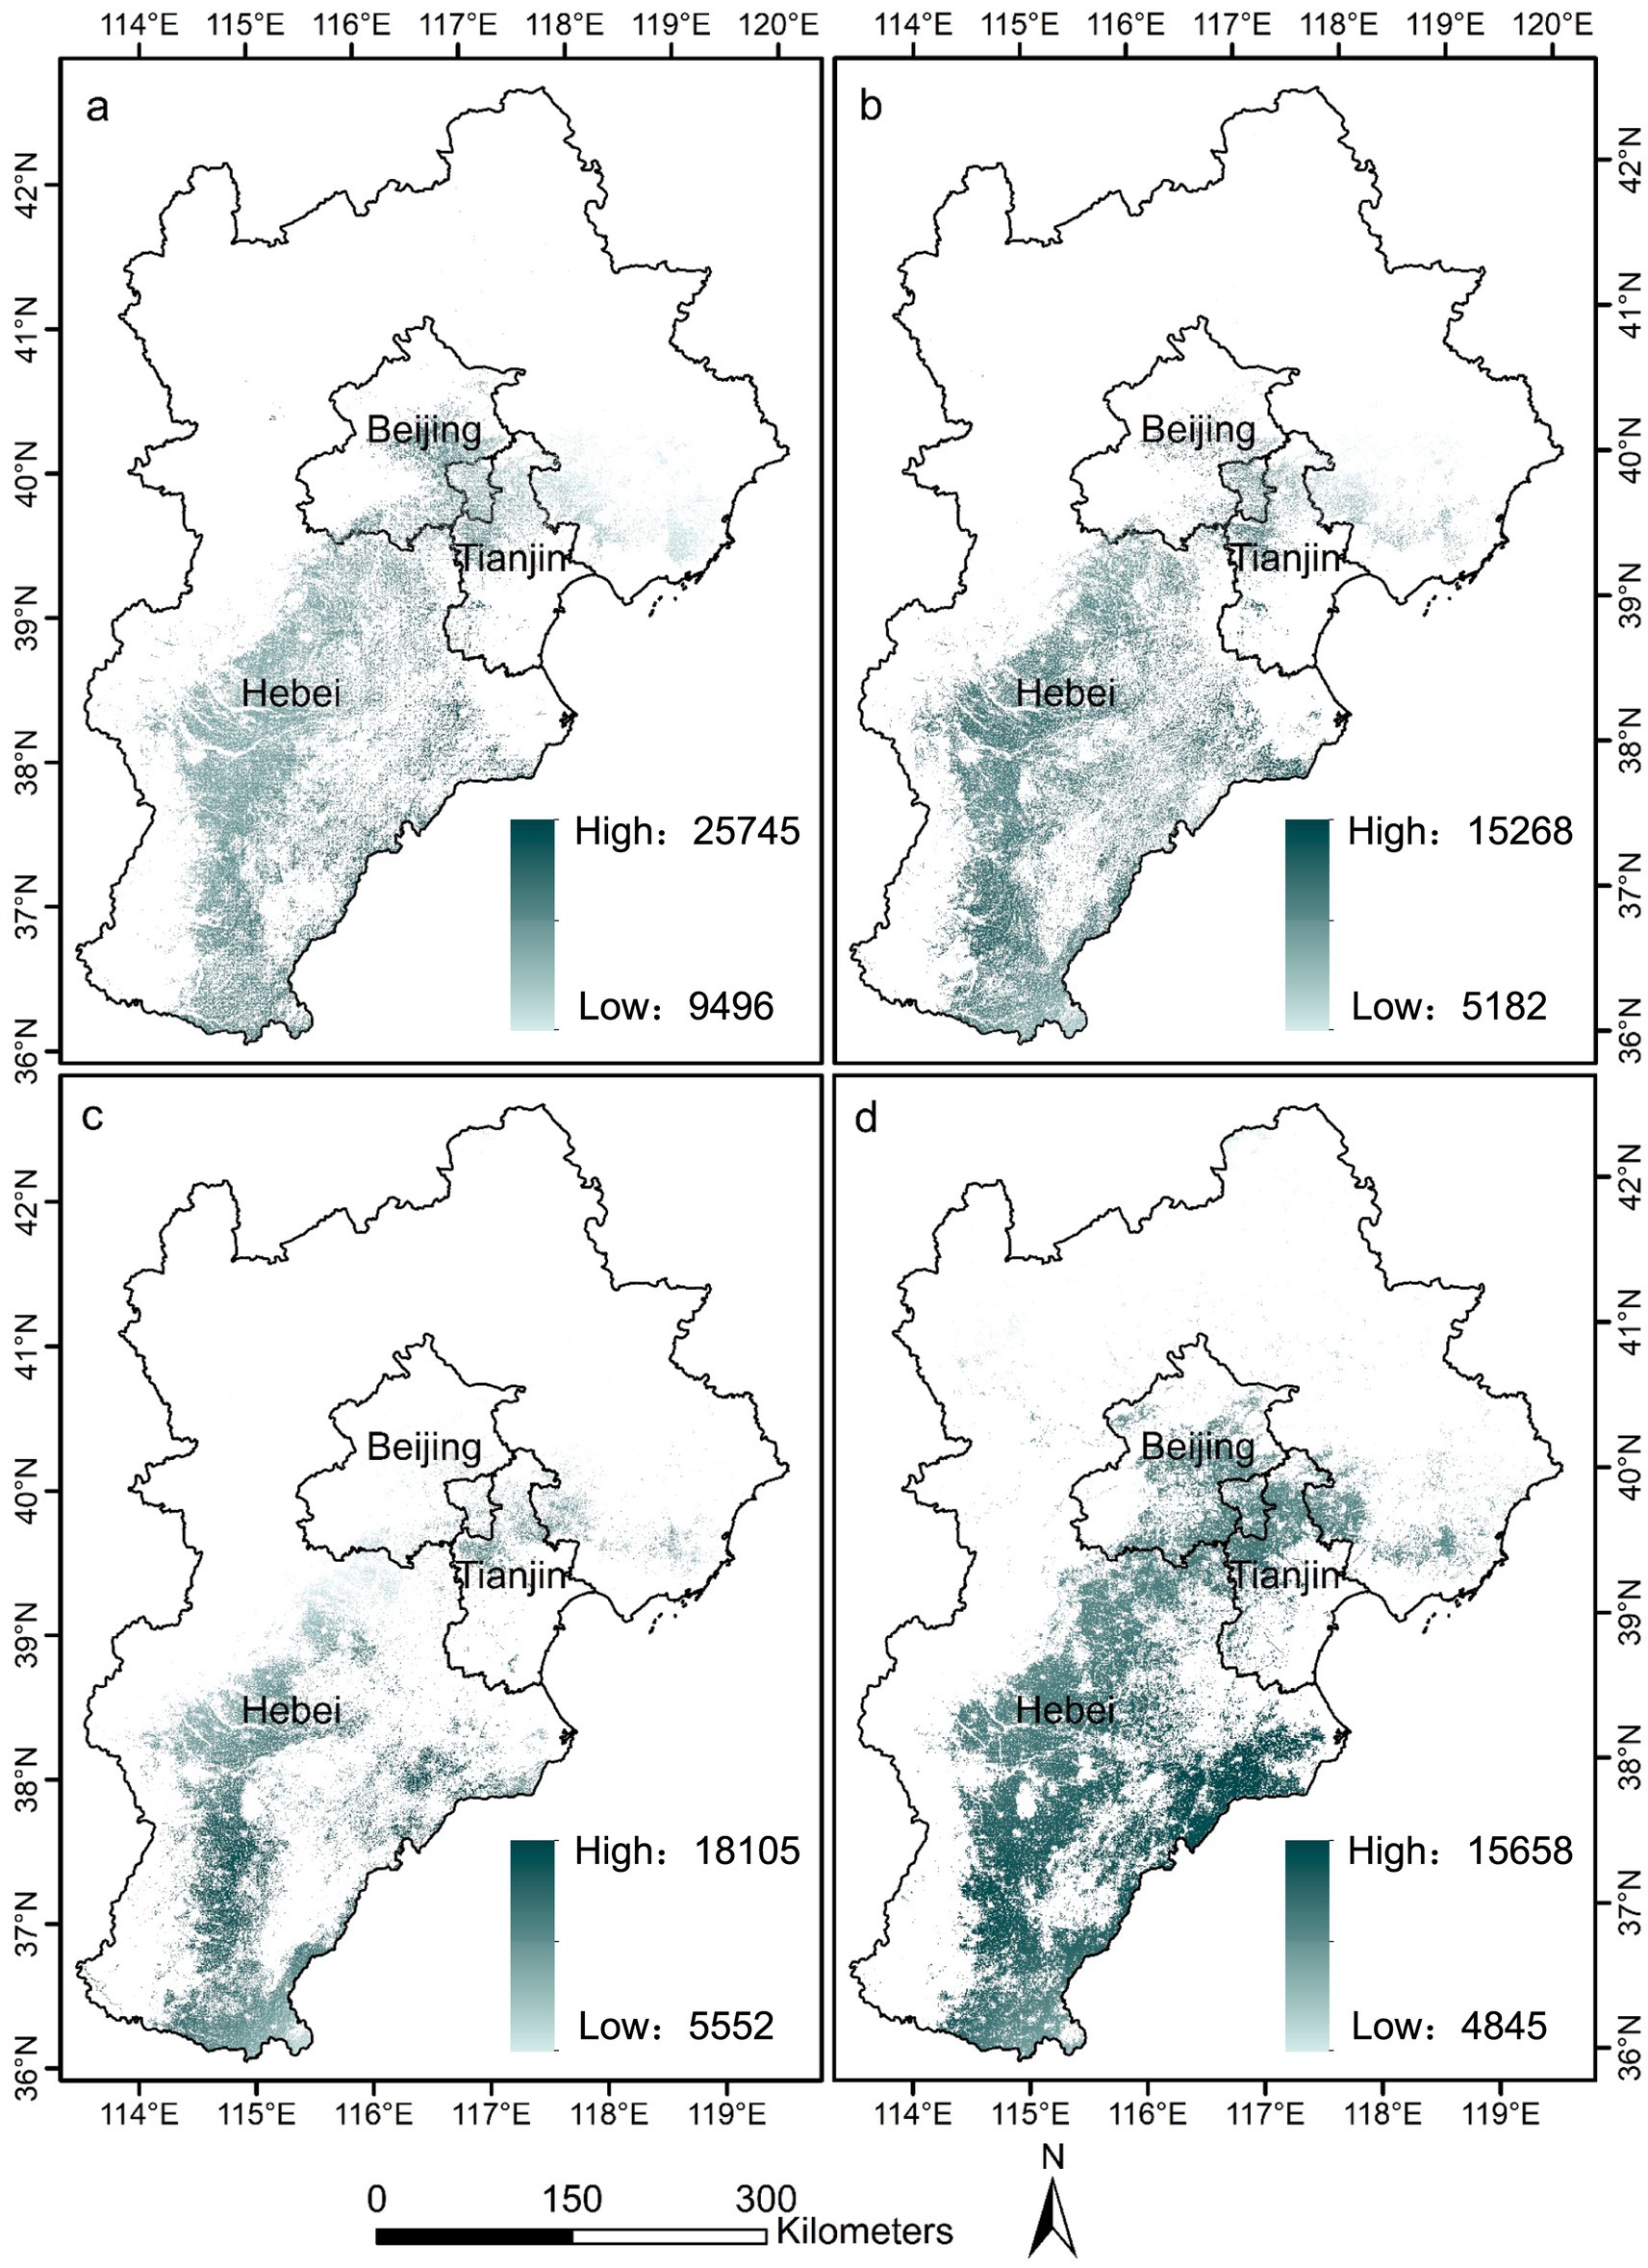
Figure 13. Spatial–temporal distribution of green water footprint of winter wheat from 1990 to 2019 (a: 1990, b: 2000, c: 2010, d: 2019). The data units in the figure are cubic meters (m3).
3.4 The spatial–temporal impact of winter wheat planting on water resource
From 1990 to 2019, the winter wheat production system in the BTH showed a significant spatial reconfiguration trend. The winter wheat area, the water footprint (including blue water footprint), and the green water footprint all shifted towards the southwest, with an average migration distance of 53 km (Figure 14). However, the center of the agricultural irrigation area and water withdrawal volume remained stationary in the eastern part of Baoding, with the migration distance (about 14 km) being less than a quarter of the planting migration distance. From 1990 to 2019, the winter wheat area and the water footprint center were consistent and moved from the eastern part of Baoding to the eastern part of Shijiazhuang, showing a significant southward trend. The green water footprint lagged the planting area, indicating the imbalance in the spatial matching of nature and production in the agricultural water resources system. The spatial decoupling of the irrigation system (including irrigation area and water withdrawal volume) from the planting layout reflects the lagging feature of the adjustment of engineering facilities.
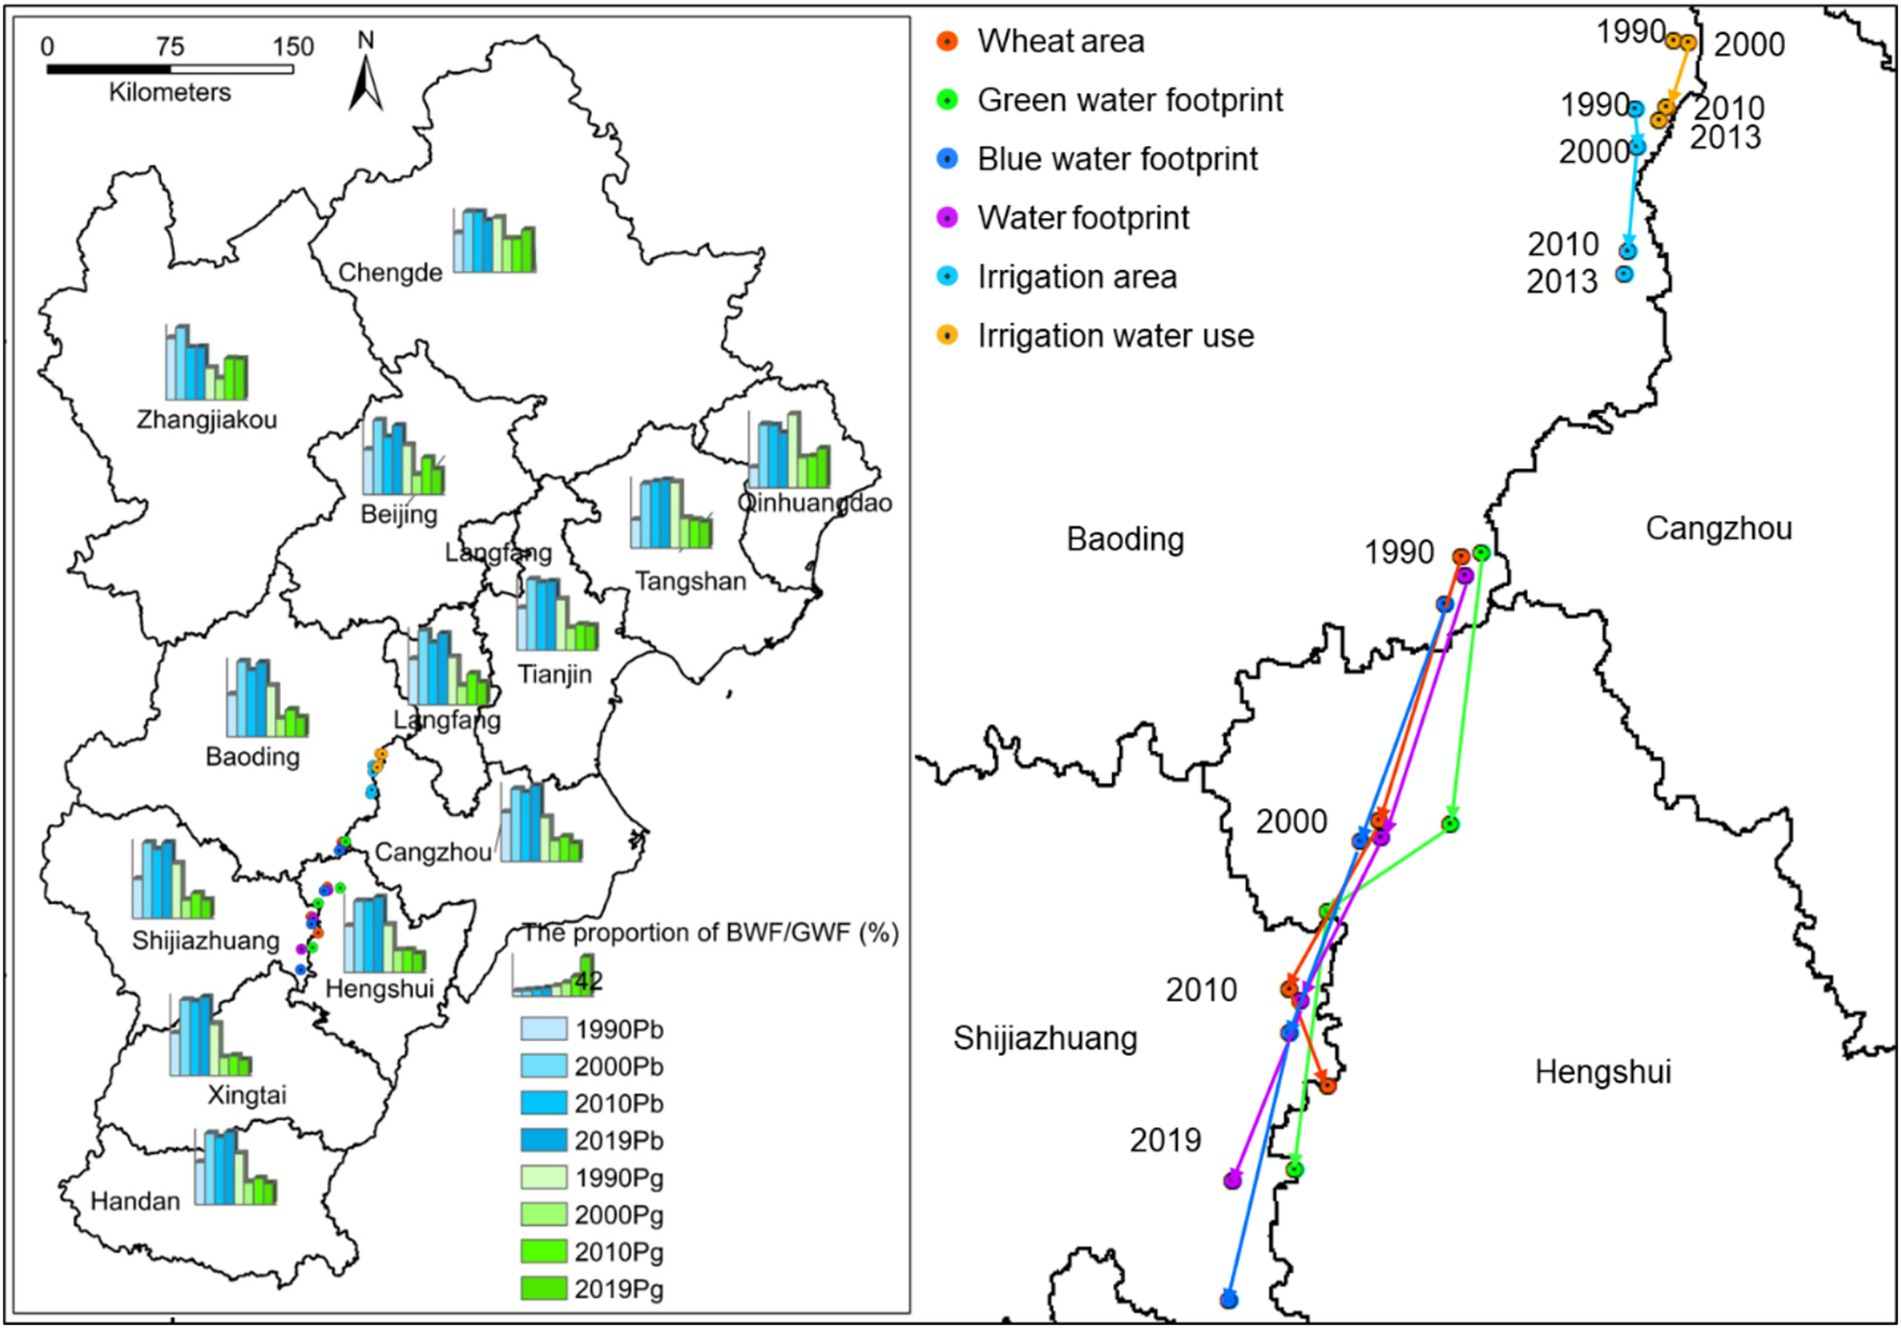
Figure 14. The spatial–temporal movements of wheat planting area and water resource utilization indicators, including water footprint of wheat production and water use capacity. The arrows in the figure indicate the spatial migration trend of the wheat area center and water resource utilization indicators from 1990 to 2019. Since the data on irrigation area and irrigation water use can only be collected up to 2013, the migration trends of these two indicators are only analyzed up to 2013.
From 1990 to 2019, the water footprint of winter wheat production, including its blue water component, exhibited a distinct spatial shift southward, with significant decreases in high-latitude areas and significant increases in low-latitude areas of the study region (Figure 15). This pattern manifested as a substantial increase in the water footprint between 36°N and 38°N, contrasting with significant decreases between 38°N and 42°N. Similarly, the blue water footprint increased significantly within the 36°N–38.5°N, while showing a marginal decrease north of 38.5°N up to 42°N. In contrast, the green water footprint demonstrated a consistent decreasing trend across all latitudes from 36°N to 42°N during the study period.

Figure 15. Latitudinal evolution of water footprint of wheat production in BTH region from 1990 to 2019.
From 1990 to 2019, the area of wheat cultivation in the low-latitude regions (with a latitude ranging from 36° to 39°) continued to expand significantly, resulting in a notable increase in water pressure. In contrast, the area of wheat cultivation in the high-latitude regions showed a shrinking trend. The correlation coefficient between the winter wheat area and water footprint was relatively high, and the regression slope of the two in the low-latitude regions was significantly greater than that in the high-latitude regions (0.21 in the low-latitude regions was higher than 0.08 in the high-latitude regions) (Figure 16). The correlation coefficient between the winter wheat area and water footprint in the low-latitude regions implies that for every 1 km2 of wheat expansion in this region, the water footprint increases by 210,000 m3, which is 2.6 times higher than that in the high-latitude regions. The demand for blue water from winter wheat cultivation in the entire region is very high. For every 1 km2 of wheat expansion, the blue water footprint in the high-latitude regions increases by 360,000 m3, while in the low-latitude regions it increases by 390,000 m3. The demand for green water from wheat expansion in the high-latitude regions is slightly higher than that in the low-latitude regions. For every 1 km2 of wheat expansion, the demand for green water in the high-latitude regions is 1.6 times higher than that in the low-latitude regions.
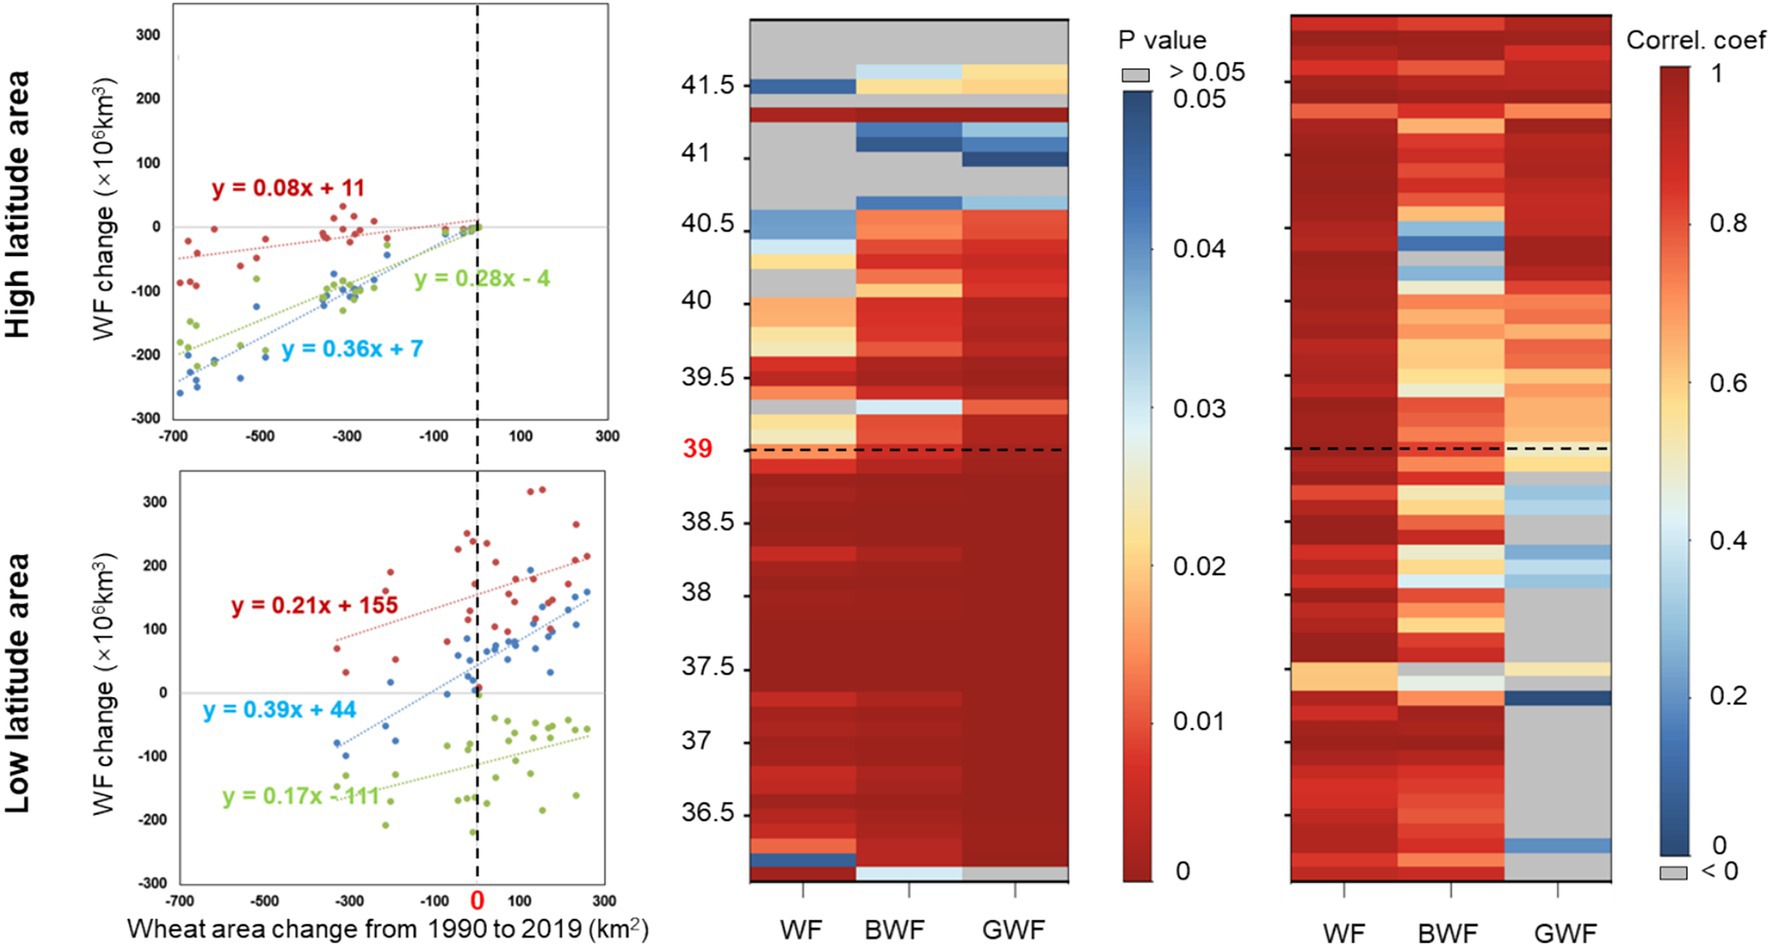
Figure 16. Correlation analysis of winter wheat area and water footprint (WF) (including blue water footprint, BWF and green water footprint, GWF) in high latitude (39–42°N) and low latitude (36–39°N) regions in BTH from 1990 to 2019.
4 Discussion
The water requirements and the water footprint of winter wheat in BTH showed a temporal and spatial trend of first increasing and then decreasing over the past 30 years (Supplementary Table S2). From 1990 to 2000, the average temperature and solar radiation during the winter wheat growing season in BTH significantly increased, while precipitation and dew point temperature significantly decreased (Wang et al., 2018). At the same time, due to the macro adjustment of national grain policies, farmers’ production enthusiasm was greatly enhanced, and the planting area of winter wheat in the medium and high water-demand regions expanded significantly, resulting in an increase of approximately 27% in the water footprint of winter wheat production. In 1993, the State Council relaxed grain prices and operations, implementing “guaranteed quantity with flexible pricing,” that is, retaining the quantity of grain orders and allowing prices to fluctuate according to market conditions. In 1996, the central government decided to further increase the grain order prices and implement provincial (autonomous regions, municipalities) government pricing under the guidance of the central government. This greatly stimulated the production enthusiasm of farmers and promoted the increase of winter wheat planting area in the medium and high water-demand regions, including those in BTH with medium and high water requirement (Zhou et al., 2023). From 2000 to 2010, the average temperature, solar radiation, and dew point temperature during the winter wheat growing season in BTH showed a decreasing trend, while precipitation slightly increased, the overall water requirement for winter wheat decreased (Figure 8). At the same time, due to national policy intervention, the winter wheat area in high-demand regions significantly decreased, resulting in a reduction of approximately 32% in the water footprint of winter wheat production. In 2019, the Action Plan for Comprehensive Management of Groundwater Over-exploitation in North China was released, marking the start of systematic efforts to address groundwater over-exploitation in the North China region. The state strengthened the comprehensive management of water resources in areas with excessive groundwater extraction (especially in Hebei Province), delineating groundwater over-extraction areas, prohibited mining areas, and restricted mining areas, reducing the planting area of winter wheat in corresponding over-extraction areas, which promoted the reduction of the water footprint of winter wheat (Hu et al., 2017; Long et al., 2025). Our observed southward expansion of winter wheat area is consistent with the broader pattern of a southward retreat of the winter wheat planting boundary identified by Chen et al. (2020). While climate warming might intuitively suggest a northward expansion, the actual spatial response is dominated by stronger socioeconomic drivers in the North China Plain. Factors, such as urban expansion in the north consuming farmland, and specific regional agricultural policies encouraging intensification in the south, have effectively pushed the cultivation centroid southward.
The spatial distribution of the water footprint of winter wheat indicates the existence of some potential hotspots that require special attention to water security issues. For instance, compared with the high-latitude areas of the BTH, the changes in the winter wheat planting area in the low-latitude regions of the BTH have a stronger correlation with the water footprint and blue water footprint of winter wheat production. Therefore, the low-latitude regions should become the key areas for spatial distribution management of winter wheat and comprehensive management of agricultural water resources (Figure 17). Due to the higher temperature, more precipitation and better land quality in the low-latitude regions, the crop yields in these areas are higher than in other regions. However, due to inefficient field management, excessive fertilizer input and low water resource utilization efficiency, the sensitivity of winter wheat planting area and water footprint is relatively stronger in this region. Since 2014, in response to the increasingly serious ecological and environmental damage (such as land subsidence and ecosystem degradation) caused by excessive groundwater extraction, the Chinese government has implemented policies to restrict agricultural water use in the central plains of the BTH region (Liu et al., 2024; Cao et al., 2013). In addition, our spatial migration results also reflect the synchronous transfer of winter wheat planting and water consumption, the lag of natural rainfall (green water) response, and the severe delay of engineering water supply (irrigation system). This “triple decoupling” phenomenon profoundly reveals the spatial imbalance in the spatial matching of “nature—production—engineering” elements in the regional agricultural water resources system. The direct migration of winter wheat planting centered in the eastern part of Shijiazhuang led to the reshaping of the water footprint pattern, but the deviation of the green water footprint migration exposed the spatial rigidity constraints of water resources. More importantly, the spatial decoupling between the irrigation system and the planting layout (a migration distance difference of 44 km) reflects the severe mismatch in the adjustment of engineering facilities. This finding indicates that the “water-based land allocation” policy in the North China Plain needs to break away from the single water volume control mode and shift to the coordinated optimization of “planting technology, nature” in all three aspects. While the South-to-North Water Diversion Project exemplifies the large-scale implementation of matching water transfer with regional needs, our findings suggest that its effectiveness can be further amplified (Long et al., 2020; Zhang X. Y. et al., 2024). The key lies in enhancing the precise coordination between this water delivery system and evolving agricultural layouts, coupled with widespread modern irrigation transformation. Achieving this synergy is crucial for overcoming the grain-water conflict and securing sustainable agricultural development. This spatial mismatch phenomenon may be widespread in global major agricultural areas such as the Ganges Plain in India and the Ogallala aquifer in the United States (Yang et al., 2016; Steward et al., 2013). This study, through its detailed spatiotemporal analysis, strongly reinforces the necessity of managing water resources in both space and time. The insights gained from the North China Plain, particularly the quantified impact of crop layout changes on water stress, serve as a valuable reference for validating and refining water resilience strategies in other agricultural regions facing similar challenges. In the future, through modern irrigation transformation, the construction of smart water resource allocation networks, and precise matching of cross-regional water diversion projects, it is necessary to fundamentally break through the bottleneck between grain production and water resource protection and achieve sustainable development of the agricultural system (Hu et al., 2024).
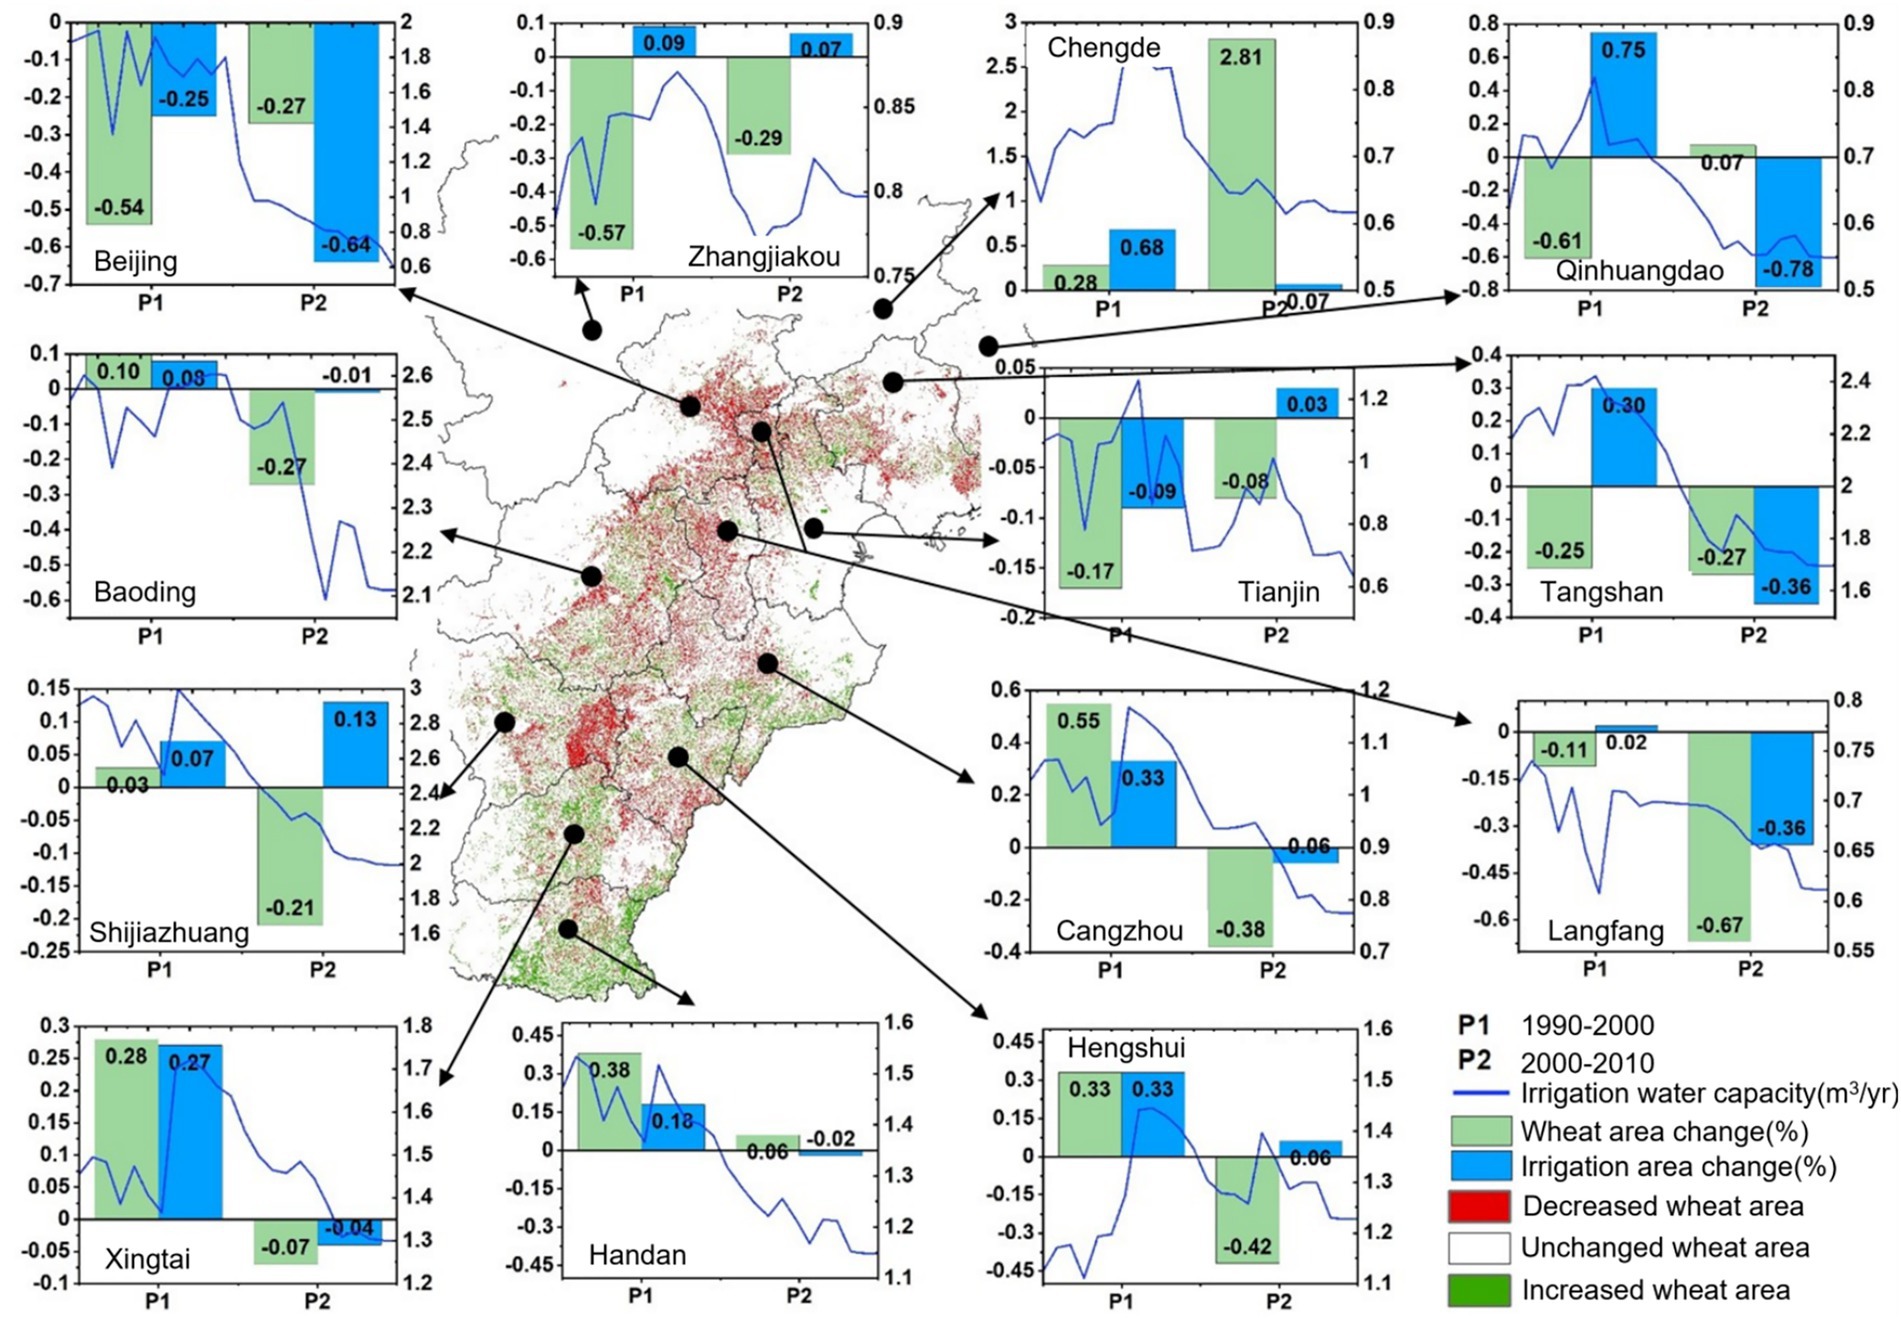
Figure 17. Relationship between winter wheat area and irrigation area at the municipal level from 1990 to 2010 (P1: 1990–2000; P2: 2000–2010). Since there was no available data on the municipal-level irrigation area and irrigation water capacity from 2010 to 2019, here we only compared the data from 1990 to 2010.
Our analysis, which concludes in 2019, captures the long-term trends in winter wheat cultivation and its water footprint prior to the full-scale implementation of stringent groundwater conservation policies in the North China Plain. These policies, such as Comprehensive Management Plan for Groundwater Over-exploitation in North China launched around 2020, aim to directly address the very issue of groundwater depletion highlighted by our findings, likely through measures like limiting irrigation quotas, adjusting agricultural planting structures, and promoting water-saving technologies. It is plausible that the southward shift of winter wheat and the associated water resource changes identified in our study may have been mitigated or even reversed in some areas after 2019 due to these interventions. For instance, our observed surge in blue water requirement until 2019 could represent a historical peak, with current management strategies working to curb this trend. Therefore, while our study provides a critical baseline of the pre-policy era and unequivocally demonstrates the urgent need for such interventions, it also underscores the necessity for future research to extend this analysis using post-2019 data. Such follow-up work will be essential to quantify the effectiveness of these policies and to understand the new dynamics of the regional water-food system under constrained water use. Another potential limitation of this study lies in the use of static, FAO-recommended crop coefficient (Kc) values. Kc can vary with crop variety, planting density, and management practices. Our analysis therefore reflects the water footprint under a standardized crop management scenario. Future research could reduce this uncertainty by incorporating dynamic, remotely-sensed Kc estimates or by conducting field experiments to develop region-specific Kc curves for dominant cultivars. However, we posit that the primary spatiotemporal trends identified in this study are robust, as they are driven by large-scale, systematic changes in cultivation geography and climate, rather than by localized variations in crop characteristics. Finally, our analysis quantifies the absolute water footprint of the expanded winter wheat cultivation. However, a comprehensive assessment of the net hydrological impact requires consideration of the water use by the preceding land cover that was replaced. The land cover prior to the southward expansion of winter wheat is uncertain and could have ranged from fallow land or low-water-use crops to other high-water-demand crops (e.g., rice, maize, or vegetables), particularly in the warmer and more humid southern regions. Consequently, the net change in regional water consumption resulting from this land use change remains ambiguous. A surging blue water footprint in the south identified in this study should therefore be interpreted as highlighting a potential and significant increase in water stress, especially if winter wheat displaced less water-intensive systems. Future research that integrates long-term, high-resolution land use change data with crop-specific water models is essential to reconstruct historical land use sequences and precisely attribute the net water consumption change to the observed cropping pattern shifts.
Our findings on the southward migration of winter wheat and its water resource use call for spatially differentiated management strategies that align with both water sustainability and food security goals. First, given the excessive blue water dependency in the southern migration areas, strict irrigation quotas based on integrated soil-crop modeling should be enforced. In contrast, in the northern part of the region, where groundwater overdraft is most critical, the policy should focus on “determining land use by water availability.” This could involve incentivizing the shift to low-water-consumption alternative crops or even strategic fallowing in the most over-explocated aquifers, with the primary goal of groundwater recovery. Second, the decline in available green water underscores a missed opportunity. Agricultural practices should be optimized to better capture rainfall. This can be achieved by adjusting sowing dates to align key growth stages with peak rainfall periods and by breeding and adopting new crop varieties with improved water-use efficiency and phenologies that are better suited to the changing climate. Moreover, technological water-saving measures must be coupled with socioeconomic policies to ensure farmer adoption. We recommend piloting compensated fallowing programs and ecological compensation mechanisms where water saved through reduced irrigation is monetized or traded, providing direct economic incentives for farmers. Furthermore, investment in precision agriculture technologies should be targeted to the southern high-water-footprint areas to generate the greatest return in water productivity investment (Zhang et al., 2023; Wada et al., 2014).
This study reveals that there have been significant temporal and spatial changes in the water requirement and water footprint of winter wheat in the Beijing-Tianjin-Hebei region from 1990 to 2019, which leads to the potential impact of the change in winter wheat area on local water resource utilization. The temporal and spatial variation information of water requirement and water footprint of winter wheat is helpful for the government to formulate comprehensive and precise water resource management policies to ensure the comprehensive and rational utilization of regional water resources and the sustainable production of food security. Future research will focus on a comprehensive analysis of the interaction between the spatiotemporal dynamics of winter wheat and its water consumption, leveraging integrated assessment frameworks such as the water-food-ecology nexus (Putra et al., 2020; Zhang J. X. et al., 2024). We will employ advanced methodologies that combine remote sensing with process-based models to quantitatively analyze the coupling relationship between winter wheat production and environmental pressures, building upon insights from regional sustainability assessments (Kashyap and Agarwal, 2021; He et al., 2017).
5 Conclusion
This study extracted the spatial distribution of winter wheat cultivation in the Beijing-Tianjin-Hebei region from long-term high-resolution Landsat images from 1990 to 2019. By combining the water requirement model and agricultural production statistics, we analyzed the spatial–temporal impact of the evolution of winter wheat planting patterns in the Beijing-Tianjin-Hebei region on water resource utilization. The study found that from 1990 to 2019, the winter wheat planting area in the Beijing-Tianjin-Hebei region showed a phased change characteristic of “increase - decrease - stability,” and the distribution continued to move southward. The center of planting area shifted 58 km southward over 30 years. The southward shift of the planting hotspots led to significant spatial variation in water resource utilization distribution, and the unit area water footprint in the southern region increased significantly. The requirement for irrigation water resources increased by 68%, reaching 11.3 billion cubic meters, while the usage of rainfall resources decreased by 72%, highlighting the unsustainable nature of irrigation dependence. This study also revealed the spatial heterogeneity of the impact of winter wheat planting in the North China Plain on water resources, pointed out the potential areas that the region needs to focus on, and emphasized the need for region-specific water resource management. Future research should prioritize updating this spatiotemporal analysis with data from beyond 2019. This will allow for a direct assessment of the efficacy of recent groundwater management policies in mitigating water scarcity and reshaping agricultural landscapes, thereby validating and refining the regional strategies proposed in this study.
Data availability statement
The raw data supporting the conclusions of this article will be made available by the authors, without undue reservation.
Author contributions
QY: Writing – original draft. LX: Writing – review & editing. FZ: Writing – review & editing. YZ: Writing – review & editing. LF: Writing – review & editing. PY: Writing – review & editing.
Funding
The author(s) declare that financial support was received for the research and/or publication of this article. This work was supported by the National Natural Science Foundation of China (Award Nos. 42201112 and 32471999), the Youth Innovation Program of the Chinese Academy of Agricultural Sciences (Y2025QC11), the National Key Research and Development Program of China (Award No. 2022YFD2001105), and the Central Public-interest Scientific Institution Basal Research Fund (Award No. JBYW-AII-2025-40).
Conflict of interest
The authors declare that the research was conducted in the absence of any commercial or financial relationships that could be construed as a potential conflict of interest.
Generative AI statement
The authors declare that no Gen AI was used in the creation of this manuscript.
Any alternative text (alt text) provided alongside figures in this article has been generated by Frontiers with the support of artificial intelligence and reasonable efforts have been made to ensure accuracy, including review by the authors wherever possible. If you identify any issues, please contact us.
Publisher’s note
All claims expressed in this article are solely those of the authors and do not necessarily represent those of their affiliated organizations, or those of the publisher, the editors and the reviewers. Any product that may be evaluated in this article, or claim that may be made by its manufacturer, is not guaranteed or endorsed by the publisher.
Supplementary material
The Supplementary material for this article can be found online at: https://www.frontiersin.org/articles/10.3389/fsufs.2025.1674652/full#supplementary-material
Footnotes
References
Allen, R. G., Pereira, L. S., Raes, D., and Smith, M. (1998). “Crop evapotranspiration: guidelines for computing crop water requirements” in FAO irrigation and drainage paper no. 56 (Rome: Food and Agriculture Organization of the United Nations), 56.
Al-Selwey, W. A., Alsadon, A. A., Ibrahim, A. A., Labis, J. P., and Seleiman, M. F. (2023). Effects of zinc oxide and silicon dioxide nanoparticles on physiological, yield, and water use efficiency traits of potato grown under water deficit. Plants-Basel 12:218. doi: 10.3390/plants12010218
Blanc, É. (2020). Statistical emulators of irrigated crop yields and irrigation water requirements. Agric. For. Meteorol. 284:107828. doi: 10.1016/j.agrformet.2019.107828
Bwambale, E., Abagale, F. K., and Anornu, G. K. (2022). Smart irrigation monitoring and control strategies for improving water use efficiency in precision agriculture: a review. Agric. Water Manag. 260:107324. doi: 10.1016/j.agwat.2021.107324
Cao, X. C., Bao, Y. T., Li, Y. Y., Li, J. N., and Wu, M. Y. (2023). Unravelling the effects of crop blue, green and grey virtual water flows on regional agricultural water footprint and scarcity. Agric. Water Manag. 278:108165. doi: 10.1016/j.agwat.2023.108165
Cao, G. L., Zheng, C. M., Scanlon, B. R., Liu, J., and Li, W. P. (2013). Use of flow modeling to assess sustainability of groundwater resources in the North China plain. Water Resour. Res. 49, 159–175. doi: 10.1029/2012WR011899
Chen, S., Fan, L. L., Liang, S. F., Chen, H., Sun, X., Hu, Y. N., et al. (2020). Spatiotemporal dynamics of the northern limit of winter wheat in China using MODIS time series images. Remote Sens 12:2382. doi: 10.3390/rs12152382
Chen, B., Han, M. Y., Peng, K., Zhou, S. L., Shao, L., Wu, X. F., et al. (2018). Global land-water nexus: agricultural land and freshwater use embodied in worldwide supply chains. Sci. Total Environ. 613-614, 931–943. doi: 10.1016/j.scitotenv.2017.09.138
Chen, X. H., Ma, C. C., Zhou, H. M., Liu, Y., Huang, X. M., Wang, M. K., et al. (2021). Identifying the main crops and key factors determining the carbon footprint of crop production in China, 2001-2018. Resour. Conserv. Recycl. 172:105661. doi: 10.1016/j.resconrec.2021.105661
Davis, K. F., Rulli, M. C., Seveso, A., and D'Odorico, P. (2017). Increased food production and reduced water use through optimized crop distribution. Nat. Geosci. 10, 919–924. doi: 10.1038/s41561-017-0004-5
Ding, Y. B., Gong, X. L., Xing, Z. X., Cai, H. J., Zhou, Z. Q., Zhang, D. D., et al. (2021). Attribution of meteorological, hydrological and agricultural drought propagation in different climatic regions of China. Agric. Water Manag. 255:106996. doi: 10.1016/j.agwat.2021.106996
Fan, L. L., Chen, S., Xia, L., Zha, Y., and Yang, P. (2024). Assessing the effects of wheat planting on groundwater under climate change: a quantitative adaptive sliding window detection strategy. Atmos. 15:1501. doi: 10.3390/atmos15121501
Feng, W., Zhong, M., Lemoine, J. M., Biancale, R., Hsu, H. T., and Xia, J. (2013). Evaluation of groundwater depletion in North China using the gravity recovery and climate experiment (GRACE) data and ground-based measurements. Water Resour. Res. 49, 2110–2118. doi: 10.1002/wrcr.20192
Fitton, N., Alexander, P., Arnell, N., Bajzelj, B., Calvin, K., Doelman, J., et al. (2019). The vulnerabilities of agricultural land and food production to future water scarcity. Glob. Environ. Chang. 58:101944. doi: 10.1016/j.gloenvcha.2019.101944
Food and Agriculture Organization of the United Nations (2023). FAO statistical yearbook 2022. Rome: World Food and Agriculture.
He, G., Cui, Z. L., Ying, H., Zheng, H. F., Wang, Z. H., and Zhang, F. S. (2017). Managing the trade-offs among yield increase, water resources inputs and greenhouse gas emissions in irrigated wheat production systems. J. Clean. Prod. 164, 567–574. doi: 10.1016/j.jclepro.2017.06.085
Hu, S., Mo, X. G., and L, Z. H. (2017). Impacts of possibility planting region change for winter wheat on agricultural water surplus and deficit in Huang-Huai-Hai region. Geogr. Res. 36, 861–871. (in Chinese). doi: 10.11821/dlyj201705005
Hu, M. M., Tang, H. J., Yu, Q. Y., and Wu, W. B. (2024). A new approach for spatial optimization of crop planting structure to balance economic and environmental benefits. Sustain. Prod. Consum. 53, 109–124. doi: 10.1016/j.spc.2024.12.003
Kang, S., and Eltahir, E. A. B. (2018). North China plain threatened by deadly heatwaves due to climate change and irrigation. Nat. Commun. 9:2894. doi: 10.1038/s41467-018-05252-y
Kang, S. Z., Hao, X. M., Du, T. S., Tong, L., Su, X. L., Lu, H. N., et al. (2017). Improving agricultural water productivity to ensure food security in China under changing environment: from research to practice. Agric. Water Manag. 179, 5–17. doi: 10.1016/j.agwat.2016.05.007
Kashyap, D., and Agarwal, T. (2021). Carbon footprint and water footprint of rice and wheat production in Punjab, India. Agric. Syst. 186:102959. doi: 10.1016/j.agsy.2020.102959
Li, M., Fu, Q., Singh, V. P., Liu, D., Li, T. X., and Zhou, Y. (2020). Managing agricultural water and land resources with tradeoff between economic, environmental, and social considerations: a multi-objective non-linear optimization model under uncertainty. Agric. Syst. 1780:12685. doi: 10.1016/j.agsy.2019.102685
Liu, X. C., Liu, W. F., Tang, Q. H., Liu, B., Wada, Y., and Yang, H. (2022). Global agricultural water scarcity assessment incorporating blue and green water availability under future climate change. Earths Future 10:e2021EF002567. doi: 10.1029/2021EF002567
Liu, S. B., Wu, F., Li, P. Y., Wang, D. Y., Feng, X. F., Wang, Z. H., et al. (2024). An evaluation on the effect of water-saving renovation on a large-scale irrigation district: a case study in the North China plain. Agronomy 14:1434. doi: 10.3390/agronomy14071434
Long, D., Xu, Y. C., Cui, Y. J., Cui, Y. H., Butler, J. J. Jr., Dong, L., et al. (2025). Unprecedented large-scale aquifer recovery through human intervention. Nat. Commun. 16:7296. doi: 10.1038/s41467-025-62719-5
Long, D., Yang, W. T., Scanlon, B. R., Zhao, J. S., Liu, D. G., Burek, P., et al. (2020). South-to-north water diversion stabilizing Beijing's groundwater levels. Nat. Commun. 11:3665. doi: 10.1038/s41467-020-17428-6
Lu, S. B., Bai, X., Li, W., and Wang, N. (2019). Impacts of climate change on water resources and grain production. Technol. Forecast. Soc. Change 143, 76–84. doi: 10.1016/j.techfore.2019.01.015
Mialyk, O., Schyns, J. F., Booij, M. J., Su, H., Hogeboom, R. J., and Markus, B. (2024). Water footprints and crop water use of 175 individual crops for 1990-2019 simulated with a global crop model. Sci Data 11:206. doi: 10.1038/s41597-024-03051-3
Pereira, L. S., Paredes, P., Hunsaker, D. J., López-Urrea, R., and Shad, Z. M. (2021). Standard single and basal crop coefficients for field crops. Updates and advances to the FAO56 crop water requirements method. Agric. Water Manag. 243:106466. doi: 10.1016/j.agwat.2020.106466
Pereira, L. S., Paredes, P., and Jovanovic, N. (2020). Soil water balance models for determining crop water and irrigation requirements and irrigation scheduling focusing on the FAO56 method and the dual kc approach. Agric. Water Manag. 241:106357. doi: 10.1016/j.agwat.2020.106357
Putra, M. P. I. F., Pradhan, P., and Kropp, J. P. (2020). A systematic analysis of water-energy-food security nexus: a south Asian case study. Sci. Total Environ. 728:138451. doi: 10.1016/j.scitotenv.2020.138451
Qiu, B. W., Luo, Y. H., Tang, Z. H., Chen, C. C., Lu, D. F., Huang, H. Y., et al. (2017). Winter wheat mapping combining variations before and after estimated heading dates. ISPRS J. Photogramm. Remote Sens. 123, 35–46. doi: 10.1016/j.isprsjprs.2016.09.016
Ren, D. D., Yang, Y. H., Yang, Y. M., Richards, K., and Zhou, X. Y. (2018). Land-water-food nexus and indications of crop adjustment for water shortage solution. Sci. Total Environ. 626, 11–21. doi: 10.1016/j.scitotenv.2018.01.071
Rosa, L. (2022). Adapting agriculture to climate change via sustainable irrigation: biophysical potentials and feedbacks. Environ. Res. Lett. 17:063008. doi: 10.1088/1748-9326/ac7408
Steward, D. R., Bruss, P. J., Yang, X. Y., Staggenborg, S. A., Welch, S. M., and Apley, M. D. (2013). Tapping unsustainable groundwater stores for agricultural production in the High Plains aquifer of Kansas, projections to 2110. Proc. Natl. Acad. Sci. USA 110, E3477–E3486. doi: 10.1073/pnas.1220351110
Wada, Y., Wisser, D., and Bierkens, M. F. P. (2014). Global modeling of withdrawal, allocation and consumptive use of surface water and groundwater resources. Earth Syst. Dynam. 5, 15–40. doi: 10.5194/esd-5-15-2014
Wang, Z. B., Chen, J., Tong, W. J., Xu, C. C., and Chen, F. (2018). Impacts of climate change and varietal replacement on winter wheat phenology in the North China plain. Int. J. Plant Prod. 12, 251–263. doi: 10.1007/s42106-018-0024-0
Weiss, M., Jacob, F., and Duveiller, G. (2020). Remote sensing for agricultural applications: a meta-review. Remote Sens. Environ. 236:111402. doi: 10.1016/j.rse.2019.111402
Xiao, L. J., Wang, G. C., Wang, E. L., Liu, S. L., Chang, J. F., Zhang, P., et al. (2024). Spatiotemporal co-optimization of agricultural management practices towards climate-smart crop production. Nat. Food 5, 59–71. doi: 10.1038/s43016-023-00891-x
Yang, Y. C. E., Ringler, C., Brown, C., and Mondal, M. A. H. (2016). Modeling the agricultural water-energy-food nexus in the Indus River Basin, Pakistan. J. Water Resour. Plan. Manag. 142:04016062. doi: 10.1061/(ASCE)WR.1943-5452.0000710
Zhang, X. Y., Chen, J. F., Yu, C., Wang, Q., and Ding, T. H. (2024). Emergency risk assessment of sudden water pollution in south-to-north water diversion project in China based on driving force-pressure-state-impact-response (DPSIR) model and variable fuzzy set. Environ. Dev. Sustain. 26, 20233–20253. doi: 10.1007/s10668-023-03468-7
Zhang, M., Qin, J. Y., Tan, H., Mao, H. L., Tu, X. J., and Jian, J. F. (2023). Education level of farmers, market-oriented reforms, and the utilization efficiency of agricultural water resources in China. Econ. Chang. Restruct. 56, 3927–3947. doi: 10.1007/s10644-022-09474-5
Zhang, J. X., Yang, T., and Deng, M. J. (2024). Ecosystem services' supply-demand assessment and ecological management zoning in Northwest China: a perspective of the water-food-ecology nexus. Sustainability 16:7223. doi: 10.3390/su16167223
Zhou, F., Bo, Y., Ciais, P., Dumas, P., Tang, Q. H., Wang, X. H., et al. (2020). Deceleration of China's human water use and its key drivers. Proc. Natl. Acad. Sci. USA 117, 7702–7711. doi: 10.1073/pnas.1909902117
Keywords: spatial–temporal changes, water footprint, spatial heterogeneity, climate adaptation, winter wheat
Citation: Yan Q, Xia L, Zhao F, Zha Y, Fan L and Yang P (2025) Southward shift of winter wheat area intensifies regional water scarcity in the Beijing-Tianjin-Hebei region. Front. Sustain. Food Syst. 9:1674652. doi: 10.3389/fsufs.2025.1674652
Edited by:
Dengpan Xiao, Hebei Normal University, ChinaReviewed by:
Hongfei Lu, Jiangsu Vocational College of Agriculture and Forestry, ChinaHe Zhang, Beijing Huayun ShineTek Science and Technology Co Ltd, China
Copyright © 2025 Yan, Xia, Zhao, Zha, Fan and Yang. This is an open-access article distributed under the terms of the Creative Commons Attribution License (CC BY). The use, distribution or reproduction in other forums is permitted, provided the original author(s) and the copyright owner(s) are credited and that the original publication in this journal is cited, in accordance with accepted academic practice. No use, distribution or reproduction is permitted which does not comply with these terms.
*Correspondence: Lingling Fan, ZmFubGluZ2xpbmdAY2Fhcy5jbg==