 Ajita Gupta
 R. K. Singh
 Mukesh Kumar
- Irrigation and Drainage Engineering Division, ICAR-Central Institute of Agricultural Engineering, Bhopal, India
Lysimeters are essential for quantifying soil water content and evapotranspiration, but their high cost limits widespread adoption. This study developed a cost effective, IoT-enabled weighing lysimeter to measure crop evapotranspiration (ETc) in shallow-rooted crops and enhance sustainable irrigation management. The system, with a 1.38 m² surface area and a one-ton single-point load cell, integrated soil moisture and temperature sensors at three depths and a waterproof ultrasonic sensor for drainage measurement. Data were stored locally on an SD card and transmitted to the cloud via the ThingSpeak IoT platform for real-time monitoring. Field validation with wheat during the 2022-23 winter season recorded a total ETc of 331.9 mm with high accuracy (R² = 0.998) and a resolution of 0.20 mm. The total cost of construction was approximately USD 709, making it a highly cost-effective and practical alternative to conventional lysimeter systems. The developed system enables affordable, accurate, and continuous water monitoring, supporting efficient irrigation scheduling and sustainable water resource management.
1 Introduction
Enhancing water productivity (WP) of different crops by judicious irrigation scheduling is a key practice for conserving water in the agricultural sector. Scheduling the time and quantity of irrigation water is primarily governed by crop evapotranspiration. Among various technologies, a lysimeter is typically employed to directly measurement of crop evapotranspiration and the water balance parameters (Howell et al., 1991; Parisi et al., 2009). Various lysimeters have been installed by the India Meteorological Department (IMD) in the agriculture stations of different agro-climatic zones of India for the measurement of crop evapotranspiration (IMD, 2008). However, these lysimeters are bulky, manual, and need proper maintenance. Also, available digital lysimeters are very complex and costly.
Weighing lysimeter is the most accurate method for estimating evapotranspiration (ET), and percolation, and providing complete water balance components (Ruth et al., 2018). This device is frequently utilized to validate different hydrological models, such as those discussed by Chapman and Malone (2002), and Soldevilla-Martinez et al. (2014). Additionally, weighing lysimeter is very much useful in evaluating the performance of other hydrometeorological instruments and measurement techniques, e.g. eddy-covariance method for ET estimation (Ding et al., 2010; Hirschi et al., 2017). Essentially, weighing lysimeter uses the control boundary condition which analyzes the change in mass of a soil-filled tank that is cultivated with crops. Change in weight of the lysimeter directly reflects the movement of water into or out of the system, thus providing insights into water consumption at the system’s boundaries. The success of lysimeters in estimating crop evapotranspiration (ETc) depends on it is proper installation, operation, and management (Mariano et al., 2015; Hagenau et al., 2015). Depending on experimental requirements, various researchers have discussed and evaluated different types of lysimeters (Ruiz-Peñalver et al., 2015; Jiménez-Carvajal et al., 2017; Nicolás-Cuevas et al., 2020; Kebede et al., 2024).
Two major types of weighing lysimeters have been developed to measure crop evapotranspiration. The first type uses a counterbalancing mechanism to neutralize the dead weight of the lysimeter, this method is referenced by Black et al. (1968), Pruitt and Angus (1960), and Gupta et al. (2017). Numerous lysimeters employing this technique have been developed Marek et al. (1988), and Howell et al. (1995), primarily to measure the crop evapotranspiration (ETc) of major annual crops like alfalfa (Hunsaker et al., 2002), wheat (Dugas et al., 1985), and sorghum (Ritchie and Burnett, 1968). The second type utilizes highly sensitive load-measuring devices (Barani and Khanjani, 2002). The second method is increasingly preferred due to its precision, accuracy, and the advantages offered by computer-controlled data acquisition systems.
With the advent of technology, lysimeters evolved to include electronic sensors, data loggers, and automated monitoring systems. The integration of these technologies allowed for real-time data acquisition and improved accuracy in quantifying water fluxes (Kim et al., 2011). Additionally, advancements in materials, such as the use of modern plastics and non-corrosive metals, enhanced the durability and lifespan of lysimeter systems. Recent advancements in data logging devices, electronic sensors, affordability of commercial load cells, and data acquisition systems have facilitated the development of fully automated lysimeters that are solely supported by load cells, eliminating the need for balancing mechanisms or other mechanical parts (Allen and Fischer, 1991). This advancement makes it feasible to design a smart lysimeter that is not only cost-effective but also reliable, accurate, and low-maintenance. Various lysimeters utilizing load cell sensors have been documented by researchers such as McFarland et al. (1983), Tyagi et al. (2000, 2003), Barani and Khanjani (2002), Jia et al. (2006), Loos et al. (2007), Payero and Irmak (2008), Girona et al. (2011), and Sagar et al. (2022). However, a major challenge remains the high costs associated with the construction and installation of these lysimeters (Da Silva et al., 2016; Libardi et al., 2018). There is a firm need for the development and utilization of an affordable portable weighing lysimeter that combines high sensitivity with precision.
The primary objectives of this study were to outline the design, development, and installation of an advanced IoT-enabled weighing lysimeter specifically engineered to assess crop evapotranspiration (ETc) in shallow-rooted field crops.
2 Materials and methods
2.1 Measurement site
The lysimeter was developed and evaluated at the ICAR-Central Institute of Agricultural Engineering in Bhopal, Madhya Pradesh, located in central India (Figure 1). The geographical coordinates of the research area range from 23° 18′22″ N to 23° 20′00″ N latitude, and from 77° 24′45″ E to 77° 25′24″ E longitude, with an average elevation of 490 m above sea level. The study area is characterized by a humid subtropical climate, experiences cool, dry winters, hot summers, and a humid monsoon season, with an average annual rainfall of 1,146 mm. Meteorological data during the study duration were collected from an observatory adjacent to the experimental site.
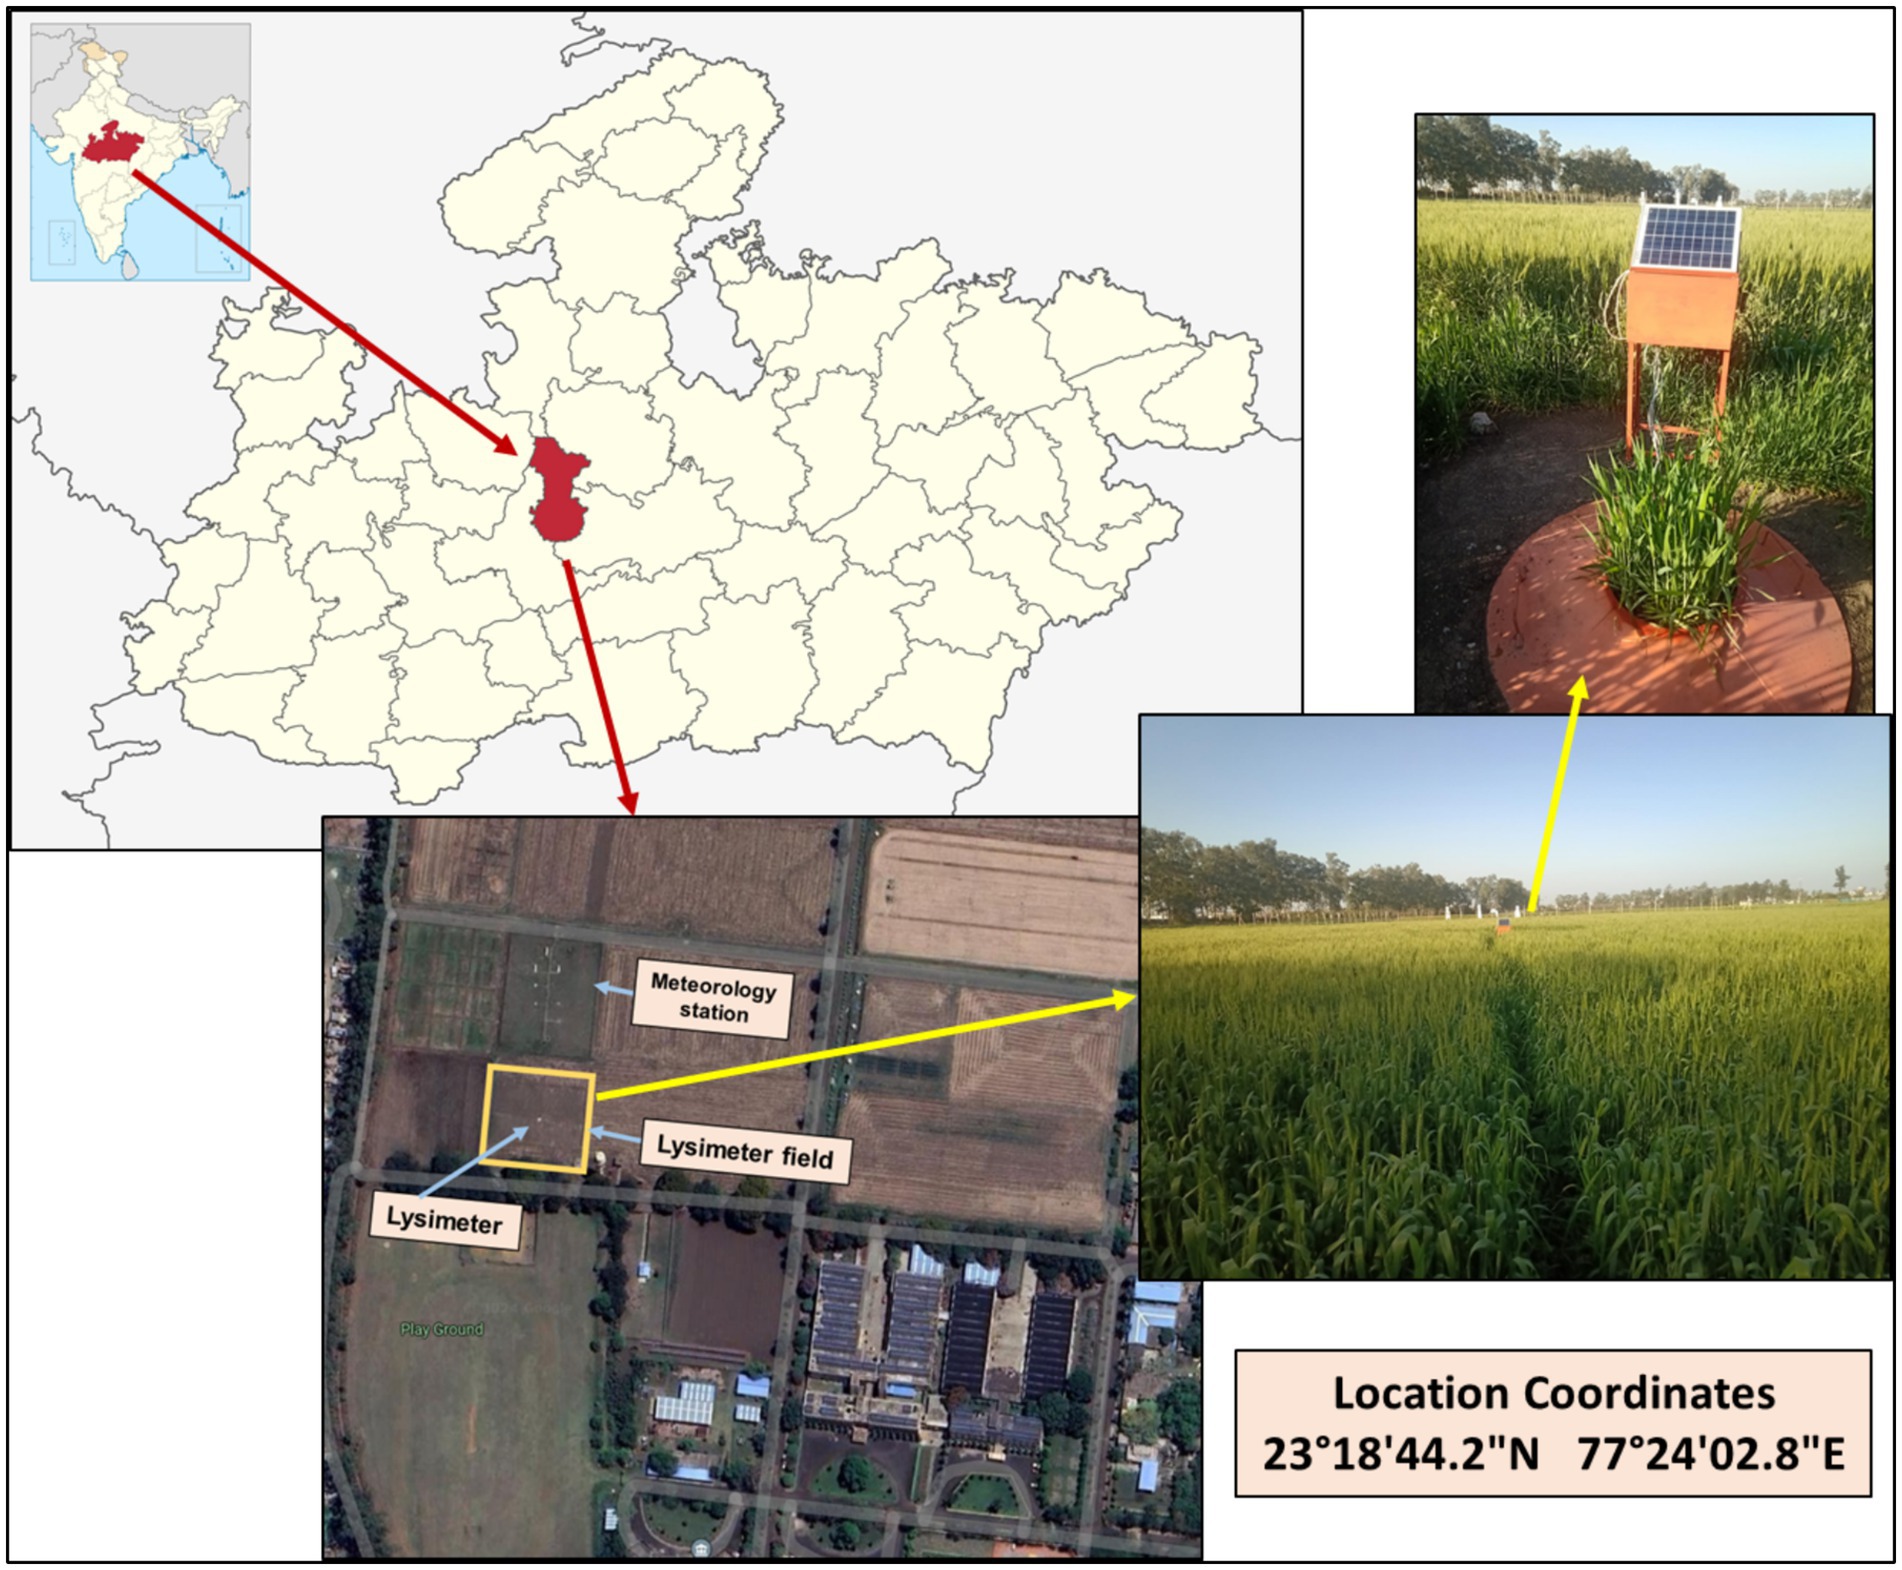
Figure 1. Location map of study area.
The soil is black, predominantly clayey in texture, enriched with montmorillonite clay minerals. It is notably sticky and soft, swelling when wet and cracking as it dries. A hard pan is found at depths of 1.8–2.5 m which restricts the downward movement of water beyond the root zone following heavy rainfall or excessive irrigation. Data on different soil physical, hydraulic, and chemical properties of the experimental site are presented in Table 1 (Gupta et al., 2019).
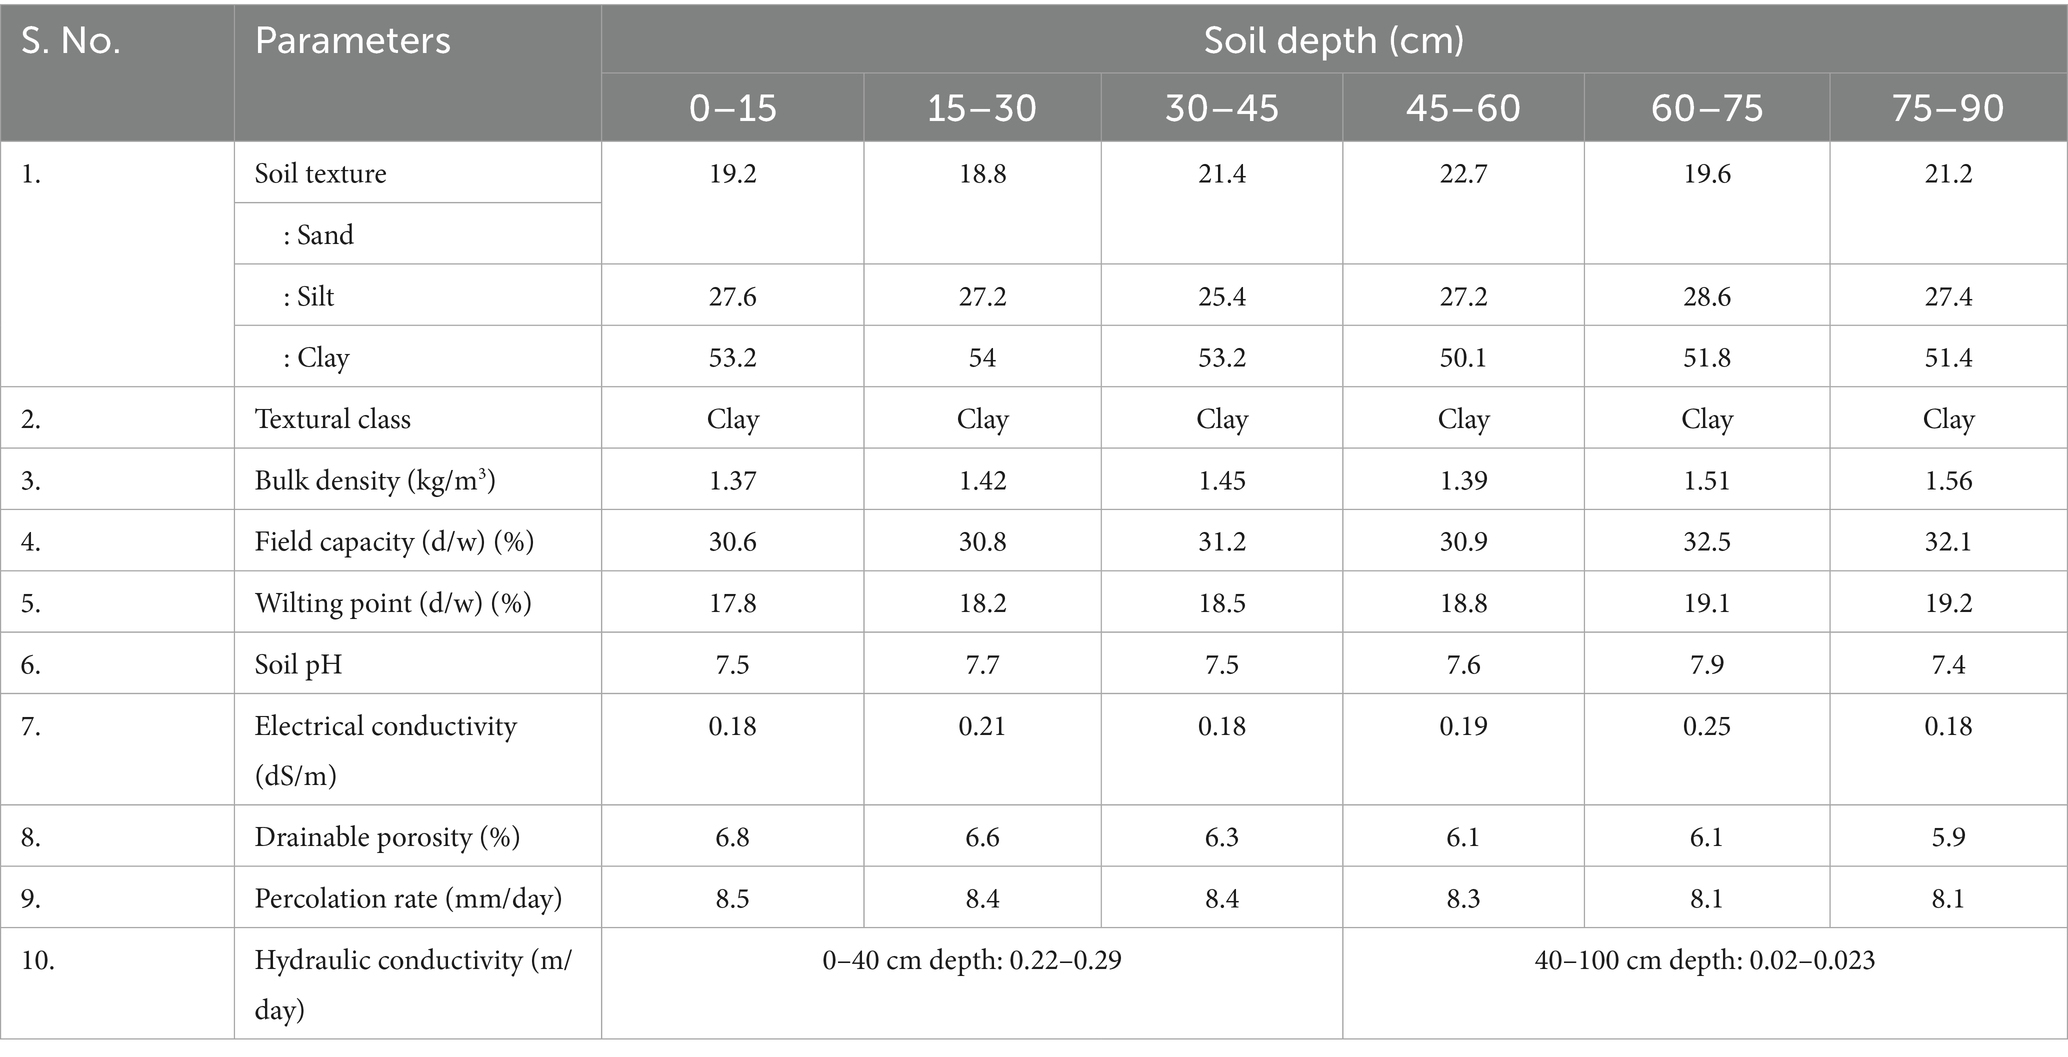
Table 1. Soil physical and hydraulic properties of the experimental farm.
2.2 Hardware description
The weighing lysimeter comprises three primary components: the inner tank that contains soil, and vegetation; a weighing mechanism system; and a system for data acquisition and data logging.
2.2.1 Inner tank
The design of the weighing lysimeter focused on ease of installation, minimal maintenance requirements, and affordability in construction costs. It was based on modifications to the model reported by Allen and Fisher (1991), specifically altering the placement of the load cells. Initially positioned above ground, atop the lysimeter’s inner tank, the load cells were directly exposed to the environment in the design description given by Allen and Fisher (1991). This exposure causes rapid temperature variations that negatively impact the performance of the load cells and the accuracy of lysimeter readings. To mitigate these thermal effects, the developed lysimeter involved placing the load cells beneath the tank, underground where temperature variations are significantly reduced.
The inner cylinder, which contained the soil, water, and vegetation, was weighed using a strain-gauge load cell. The dimensions of the cylinder were chosen to ensure a suitable diameter-to-depth ratio (less than one) and to accommodate the root zone depth of the crops being studied. The inner tank of lysimeter was made in a cylindrical format with dimensions of 750 mm in height, and 450 mm in diameter using a 12 mm thick HDPE drum. The outer cylinder was made of RCC with an inner diameter of 550 mm and an outer diameter of 600 mm. The radial clearance of 10 mm between the inner and outer cylinders was provided to facilitate assembling and aligning the two cylinders. The soil column was partially monolithic and thus represents an undisturbed soil profile. The soil is removed by a core cutter (diameter: 450 mm and depth 200 mm). The core cutter was fabricated at the institute workshop, it was pressed into the ground using a wooden plank and a hammer. To facilitate drainage, a 150 mm filter layer was added to the bottom of the lysimeter tank. The size of gravel (5–10 mm), pebble (2–5 mm) and coarse sand (1.5–2 mm) in graded form – gravel at the bottom, pebble in between and coarse sand at the top. The total depth of the filter layer of 15 cm in a combination of (4:4:7: Sand:Pebble:Gravel) per 100 cm depth of soil is effective in terms of filter efficacy. The top of the tank was then filled with 600 mm depth of soil.
Creo 2016 v.4 3-D AutoCAD software (PTC product, Boston, Massachusetts, United States) was used to design the components of the lysimeter (Figure 2).
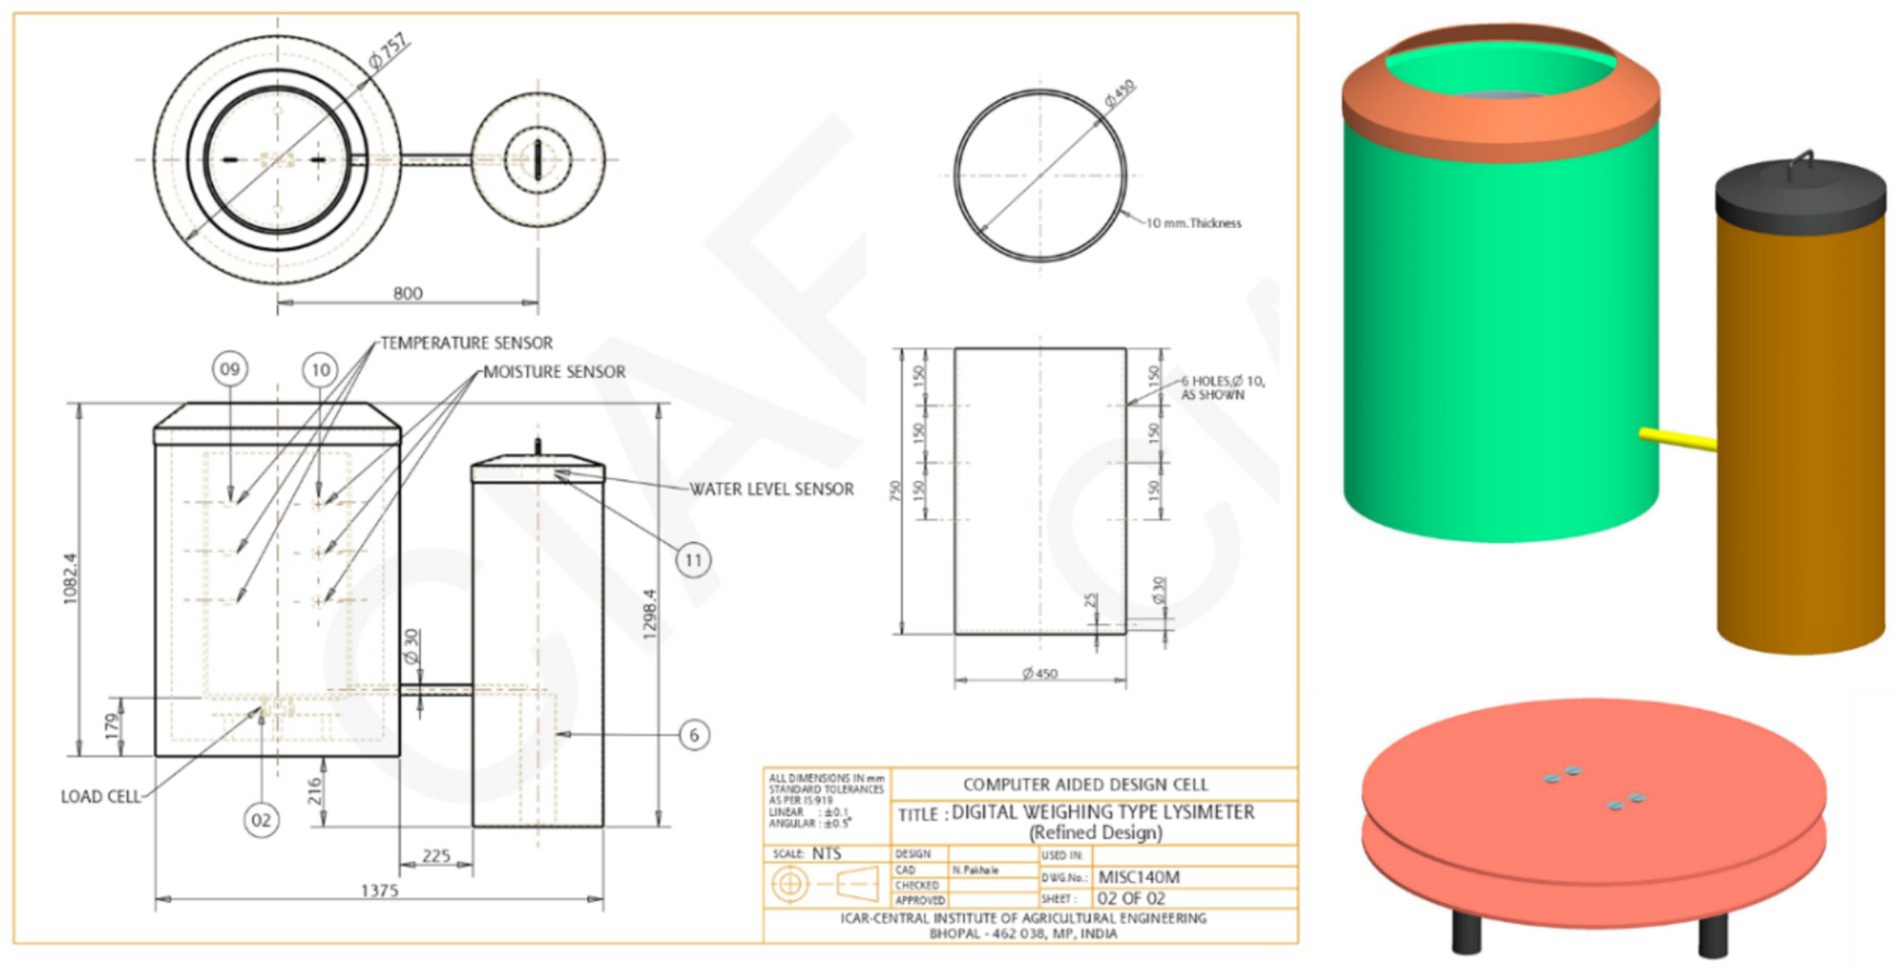
Figure 2. Computer-aided design of lysimeter system.
Soil moisture sensors (Watermark) and soil temperature sensors (DS18B20 Digital Temperature Probe) (three each) were installed at 15 cm intervals from the top of the lysimeter. WATERMARK Soil Moisture Sensor—MODEL 200SS (manufactured by the IRROMETER Company, Inc. of Riverside, California) is a resistive device that responds to changes in soil moisture. The soil moisture sensor generates an output in the form of electrical resistance. To read the value of this resistance a voltage divider circuit was established between the microcontroller and the sensor. The Watermark 200SS sensors were interfaced with the microcontroller using a methodology outlined by Payero et al. (2017), the sole change involved replacing the previously used Feather microcontroller with an ESP 32 microcontroller. The resistance of the Watermark sensor, expressed in kilohms (kΩ), was determined by the following calculation:
where, res = known resistance used in the voltage divider (10 kΩ). The codes and calibration equation to interface watermark sensors with the microcontroller is given in https://www.irrometer.com/200ss.html website was adopted.
The temperature sensors used were digital thermo probes (DALLAS DS18B20 model). These sensors convert temperature readings into a 12-bit digital word within a maximum time of 750 milliseconds. These sensors are capable of measuring temperatures ranging from −55 °C to +125 °C (−67 °F to +257 °F). The probe’s head is encased in stainless steel, making it ideal for use in wet or harsh environments.
The rainwater could enter into the gap between the inner and the outer tank of the lysimeter. To alleviate water accumulation between the inner and outer tanks of the lysimeter due to rainfall, a cover lid was fabricated (MS sheet) with an outer diameter of 55 cm and an inner diameter of 52 cm. The lid was tilted at an angle of 10° outward, and its collar was inserted into the ground a few inches. This design facilitated water flow away from the lysimeter, preventing internal water intrusion. Additionally, the inclined lid shielded the lysimeter from direct sunlight, reducing the potential heating of lysimeter sensors. The wiring of the load cell, soil temperature and soil moisture sensors, float switch, ultrasonic sensor, and DC submersible mini-pump, were neatly grouped and routed near the top of the outer part of the lysimeter system. The wires were then connected to the microcontroller and power source above the ground. The detailed image of the inner tank and its components are shown in Figure 3.
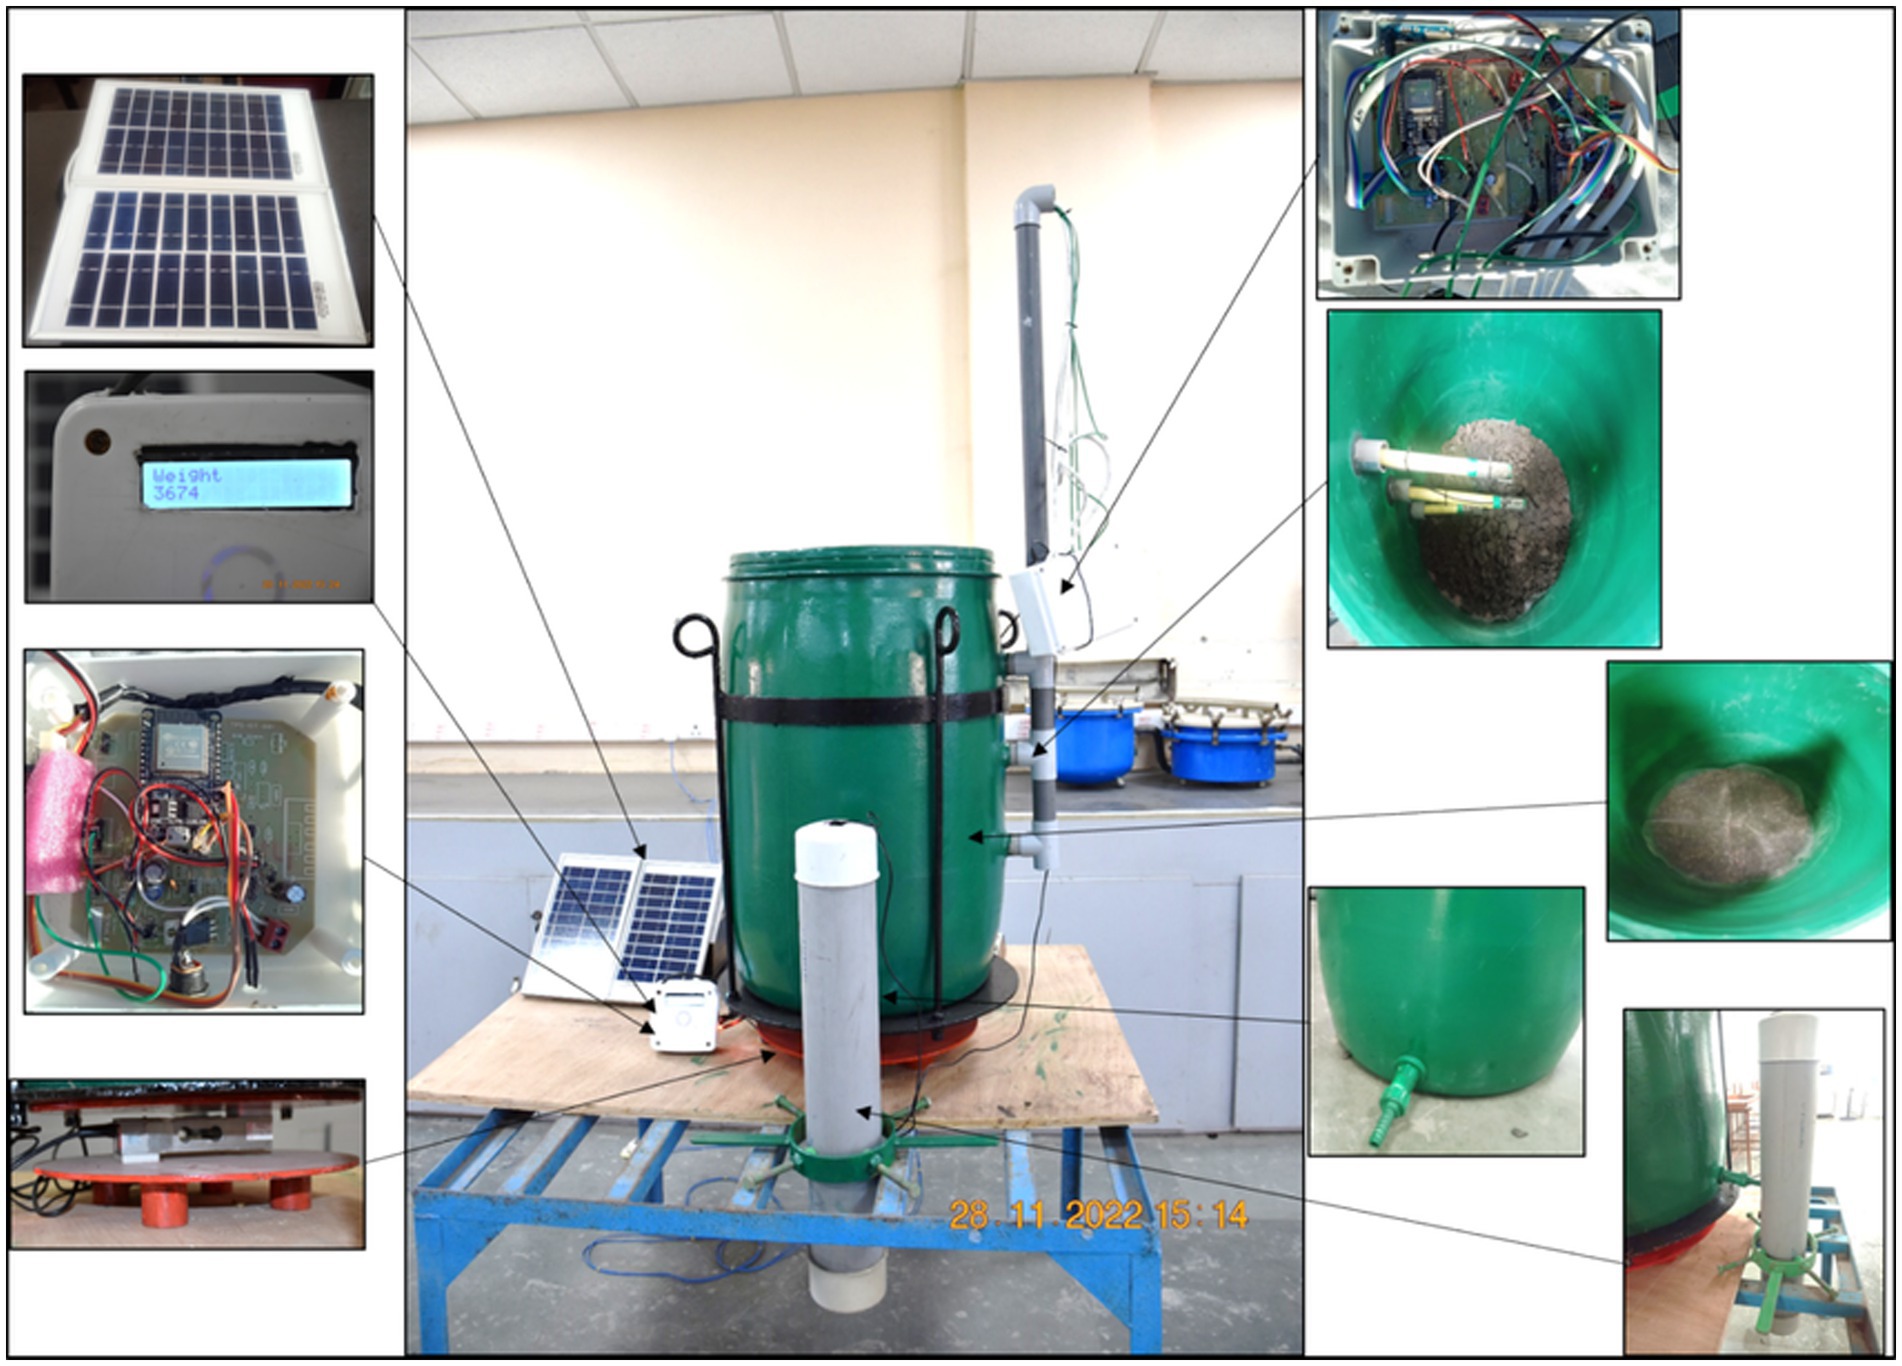
Figure 3. Inner tank of lysimeter, sensors and micro-controller.
2.2.2 Loadcell
The lysimeter was mounted on a platform-type load cell with a capacity of 1 ton. This is a strain gauge-based low profile bending beam load cell (Model 60410-SS, Artech Industries Inc., United States) ideal for precision single point platform scale application with environmental protection class IP65. The Loadcell specifications are given in Table 2. The load cells feature four wires: a red wire for excitation positive (E+), a black wire for excitation negative (E−) or ground, a white wire for Output positive (O+), and a green wire for Output negative (O−). The load cell transforms the applied weight into an electrical signal, which is then detected by an HX711 module. This module amplifies the millivolt-level electrical output from the load cell and translates the analog signal into a digital format using an onboard 24-bit A/D converter. Recognized for its high accuracy and affordability, the HX711 module serves as a critical interface between the load cell and the microcontroller. Subsequently, it is connected to an ESP32 microcontroller board. To facilitate regular monitoring, a program was developed in the Arduino IDE to log weight measurements every 5 min. The Loadcell was calibrated to record the mass of the lysimeter with a resolution of 0.20 mm of depth of water. For routine work, the weight was registered every 5 min interval. The loadcells had a sensitivity of 2 mV/V. The circuit diagram of the load cell connected with ESP-32 microcontroller is shown in Figure 4. One load plate and one base plate with a diameter of 400 mm and thickness of 5 mm were used as a load cell platform (Figure 4). Spacers were placed between the load cell and the plates to protect against overload. The plates were pre-drilled with through-holes for mounting the load cell and leveling feet. Four countersunk head screws (M8x16 mm bolt) were used to attach the load cell and the spacer to both the load plate and the base plate on each side. The weighing platform was mounted on four equidistance adjustable supporting feet (each 10 cm in height) and integrated into the base plate. This allowed to level of the weighing platform during installation. The Loadcell platform was fabricated with a 5 mm Galvanized Iron sheet. The total weight of the loadcell platform was 17.80 kg.
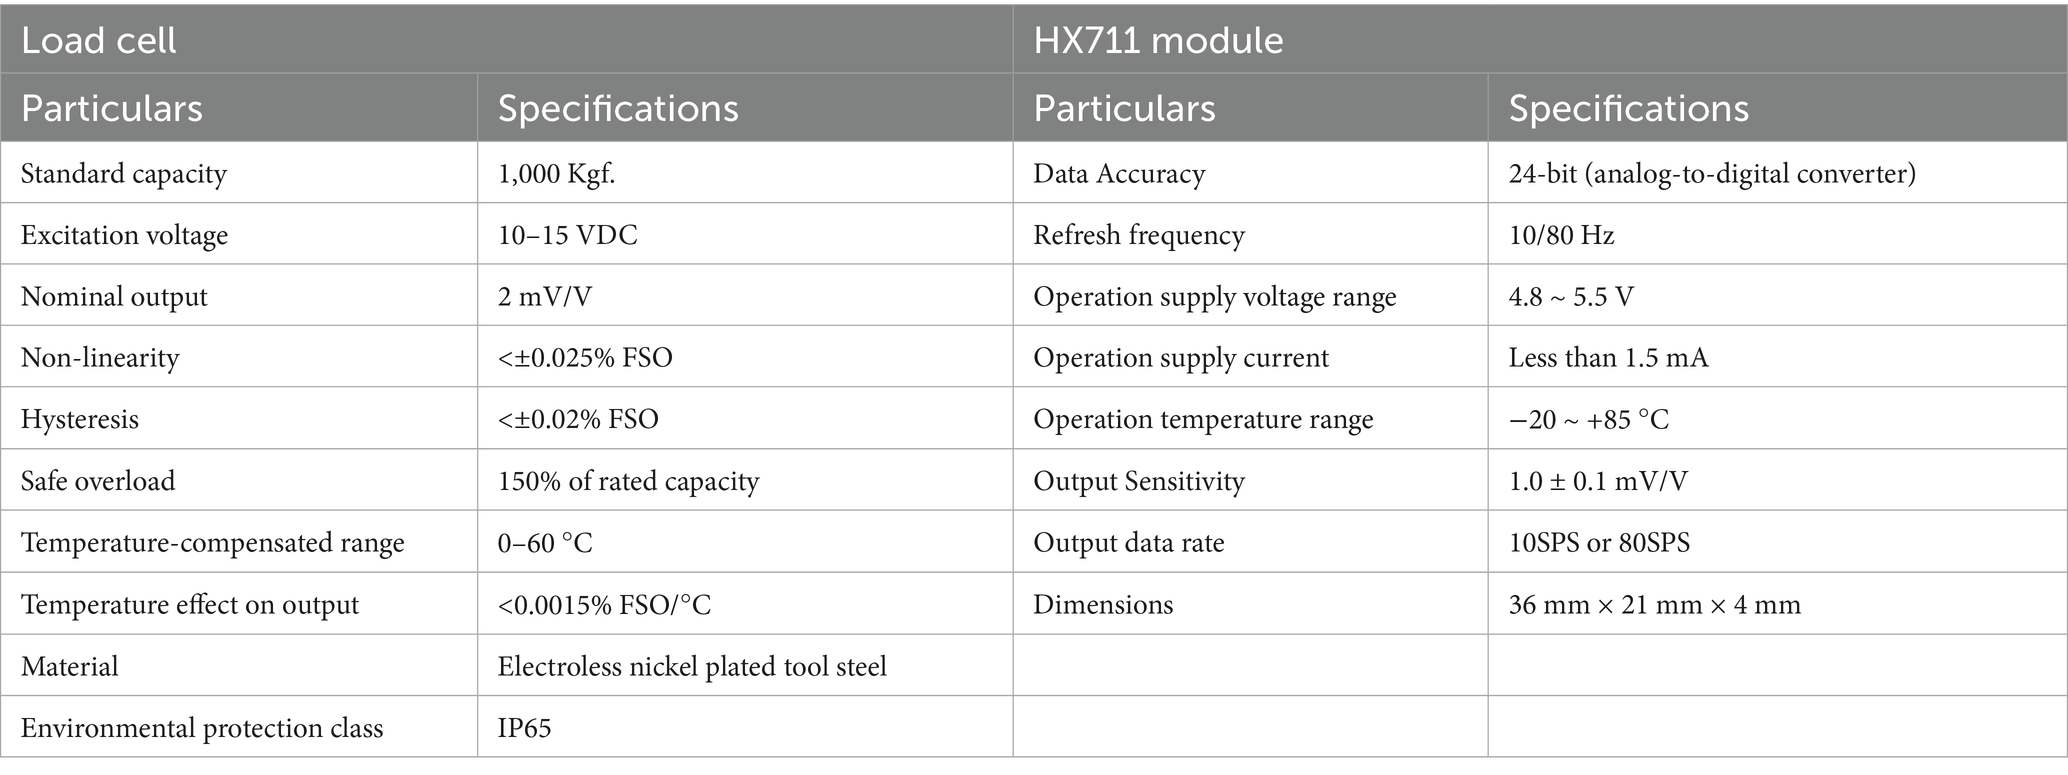
Table 2. Specification of loadcell and HX711 module.
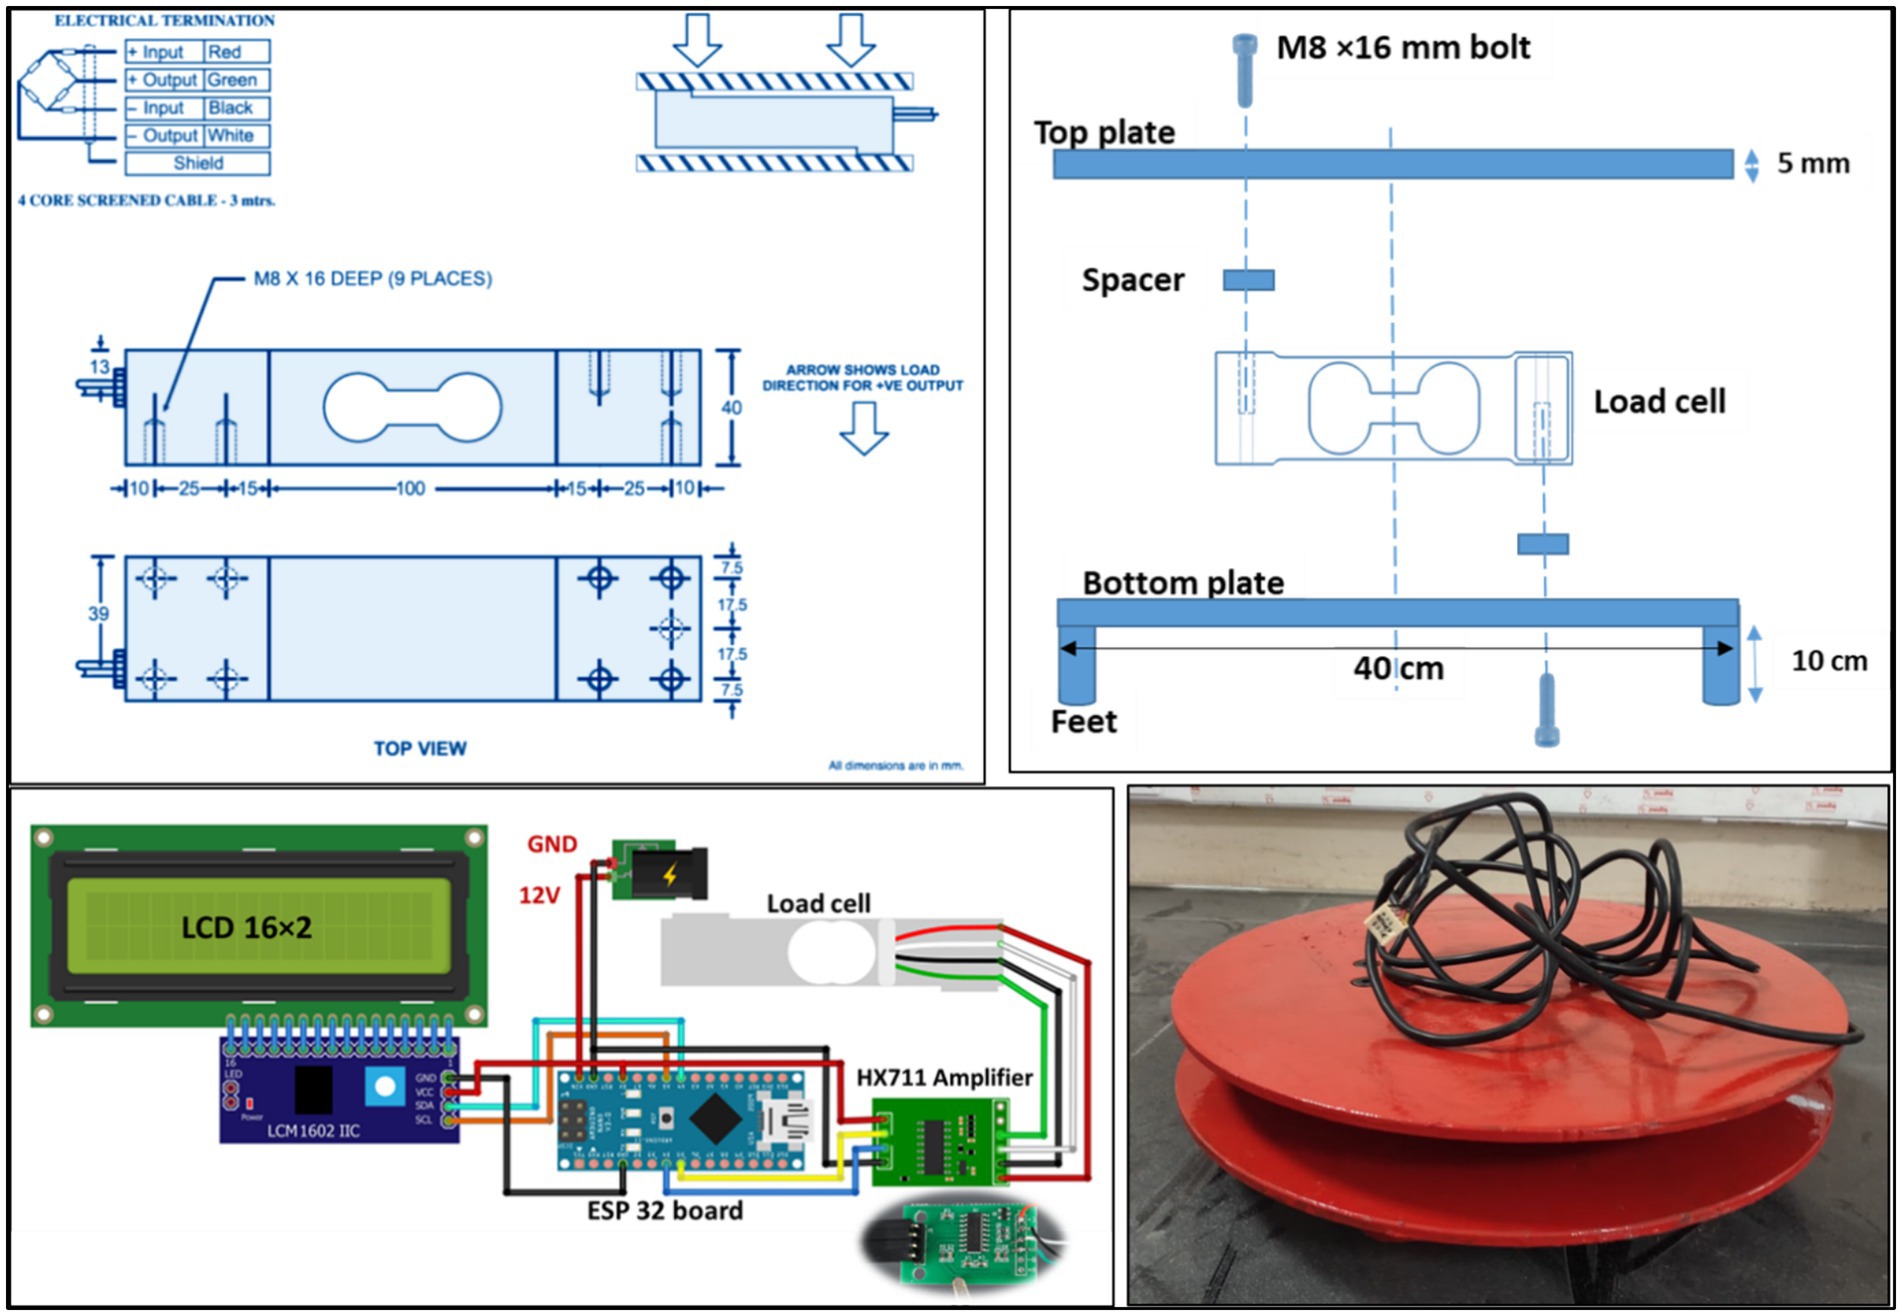
Figure 4. Dimensional description of load cell and load cell platform, and load cell connection diagram.
2.2.3 Drainage tank
The drainage water accumulated in the lysimeter’s tank located at the bottom. The drainage tank, constructed from a PVC pipe with a diameter of 11 cm and a height of 45 cm, had end caps securely glued to both of its ends. The depth of the water drained through the lysimeter was measured using a waterproof ultrasonic sensor (Operating Voltage: 5 V DC; Operating Range: 25 cm–4.5 m) installed at the top of the drainage tank, attached with the upper-end cap. The waterproof ultrasonic JSN-SR04T sensor supports multiple modes of operation. One of the modes is the famous HC-SR04 mode, which accepts a trigger signal and provides an echo signal pulse corresponding to the time the sound takes to travel and bounce back any object. The operating voltage is 3 V–5.5 V (DC) and the working current of less than 8 mA is required by the sensor with 1 mm resolution. The ultrasonic sensor was connected to the ESP-32 microcontroller (Figure 5). The ultrasonic sensor module JSN-SR04T has a 4-pin connector option to interface with microcontrollers. GND pin of the sensor was connected to the ESP32 GND pins, sensor’s VCC pin to the ESP32 5 V pin, GPIO5 pin of the ESP32 to the TRIG pin of the sensor and ECHO pin of the sensor was connected to the GPIO18 of the ESP32. The float switch and a 12-V mini water pump were powered directly through a solar panel to empty the drainage tank when the water reached a certain limit. Water exceeding the soil field capacity was permitted to exit the lysimeter tank through drainage outlets at the bottom. The drainage outlet was drilled into the inner tank of the lysimeter as close as possible to the bottom.
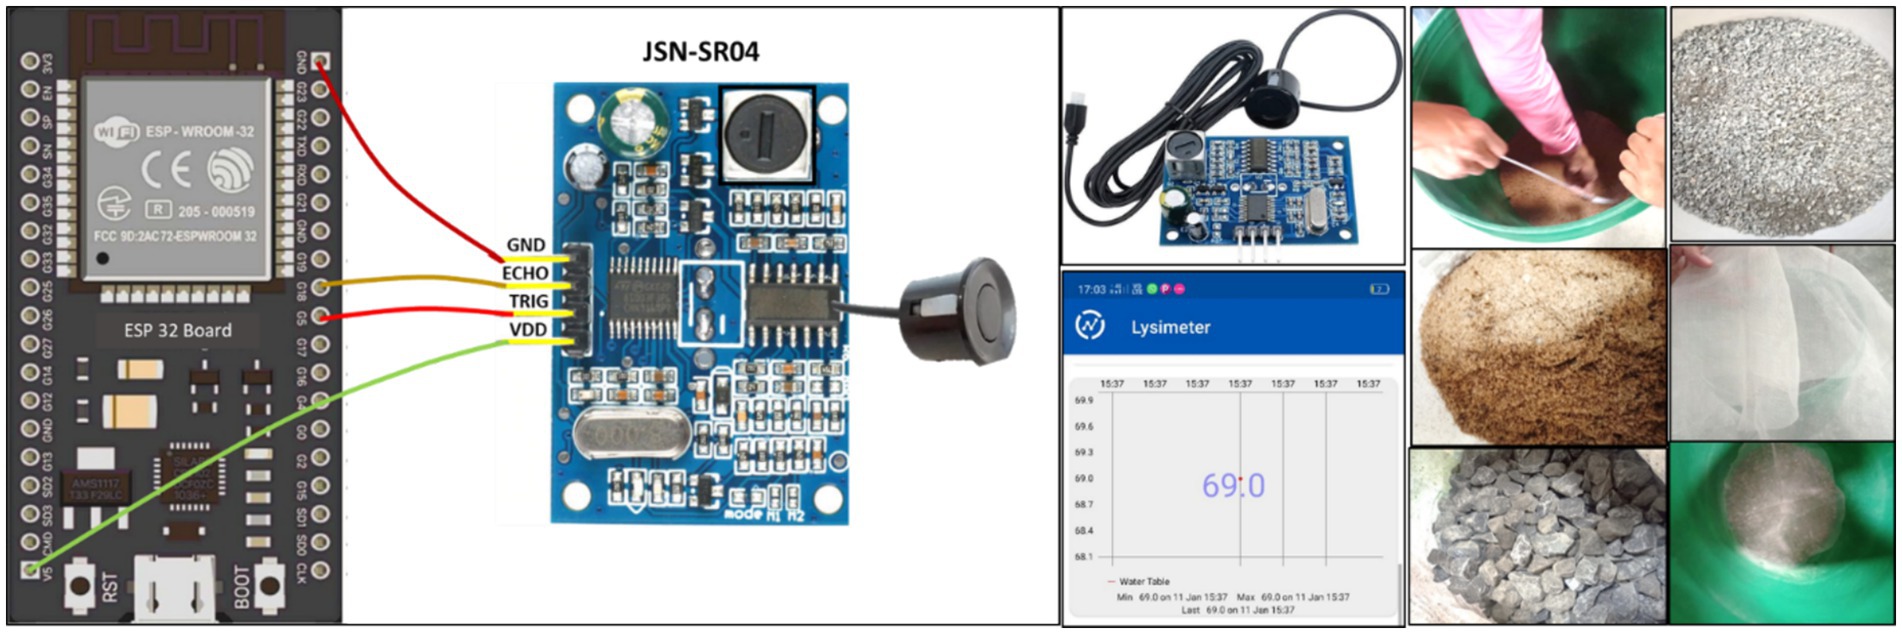
Figure 5. Connection diagram of ultrasonic sensors and filling of drainage layer in the lysimeter.
A 120 GSM geotextile fabric layer was positioned between the soil and the drainage layer to inhibit soil erosion during intense rain. Excessive water could then passively move from the top of the filter layer to the outlet.
2.3 Installation
The lysimeter was installed at the research farm of ICAR-CIAE, Bhopal (Figure 6). The location for lysimeter was marked. Large blocks of soil were carefully extracted using a core cutter to maintain the integrity of the existing soil structure, and these intact blocks were then piled aside. The excavation involved removing soil in 20 cm thick layers, each placed in a separate pile. This process continued until reaching a depth of 100 cm, after that the base of the excavated hole was made level. The dimensions of the excavation were then enlarged to fit the outer tank. To recreate the original soil profile, soil was methodically backfilled in the same layered order from which it was removed, and compacted periodically to achieve its original density. This backfilling was carried out until the soil level was 15 cm below the top of the tank. The surrounding area around the outer tank was filled in and compacted. Other researchers, such as Phene et al. (1991), Khan et al. (1993), Ayars et al. (2003), and Johnson et al. (2005) suggested removing soil in smaller increments and refilling the container to preserve the natural characteristics of the surrounding soil. Meanwhile, Lorite et al. (2012) noted that if roots are well-developed and nutrient and water supply are unrestricted, then dissimilar soil might not significantly affect water usage and crop yield. The outer tank and the floor of the lysimeter were made of RCC. A pre-fabricated 5 cm thick RCC hume pipe having a 60 cm outer diameter and 100 cm length was inserted into the ground. The space between the concrete wall and the inner tank was maintained at 10 cm to prevent changes in the system’s energy balance (Barani and Khanjani, 2002).
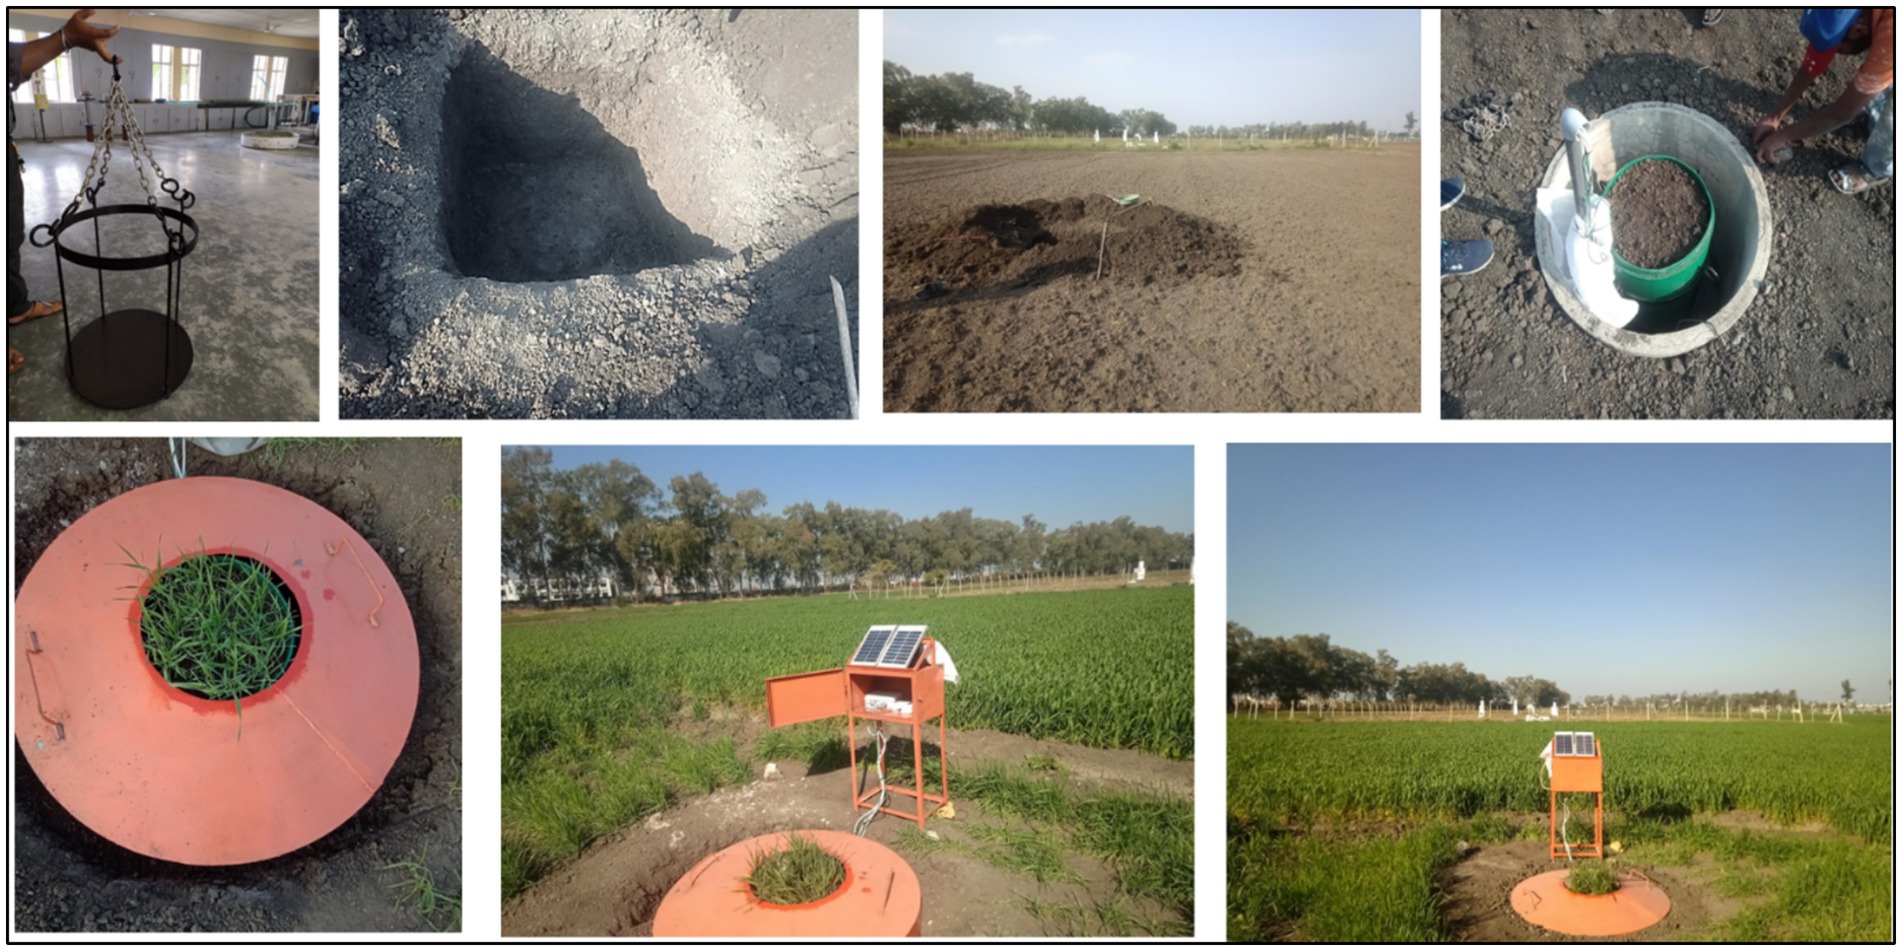
Figure 6. Installation of lysimeter in the field.
The inner tank was lowered into the ground using a 7-foot hydraulic tripod stand with a chain and pulley system. The lysimeter was fastened with a 1.5-inch GI anchor chain and lowered into the outer tank using a chain and pulley system of the hydraulic tripod stand. The inner tank was lowered slowly into the outer tank until it settled on the leveling base. The tank was leveled at the base and checked to ensure using a digital spirit gauge (Freemans PRO-DL120), and soil was carefully backfilled around it with hand shovels up to a depth of approximately 1 m to stabilize the structure. The sensor wires were guided to a common corner of the tank, routed up the side, and out to the surface, where they were connected to the data logger and power unit. The lysimeter was powered by a 20-W solar panel and a 7 Ah–12 V battery for continuous power supply. The solar panel with a battery backup was sufficient to power the system continuously. During cloudy days, the battery backup sustained operation for approximately 3 days without interruption. No data loss was observed due to power shortages during the experimental period. The PVC drain system was positioned along the bottom of the inner tank. It was installed 45 cm below the bottom of the inner tank.
The lysimeter site is equipped with an agrometeorological station supported by the India Meteorological Department (IMD), which records rainfall using both recording and non-recording types of rain gauges, minimum and maximum temperatures, relative humidity (RH), pan evaporation, sunshine hours, wind speed and wind direction on regular basis.
2.4 Data acquisition and control system
Arduino IDE (Integrated Development Environment) version 2.0 was used to write code and upload it to the microcontroller board. The algorithms within the Arduino IDE were developed using the C language for the main code and C++ for the code libraries. The developed lysimeter could measure all the soil water balance components at an interval of 5 min. ESP32 microcontroller board was used to program the logic and also to establish Wi-Fi connectivity. The controller had an LCD (16 × 2) to check and examine the working of the lysimeter onsite. The sensor data were stored both in the 16 GB micro-SD card (Sandisk Ultra, Western Digital Corporation, California, United States) onsite and on the cloud server using IoT platform (ThingSpeak).1 The ThingsNetwork employs the LoRaWAN protocol, a long-range wide area network technology. It is an open-source IoT application that uses the HTTP protocol to store and retrieve data over the Internet (Figure 7). A real-time clock (DS3231, HiLetgo, Shenzhen, China) was installed on the microcontroller to obtain exact timestamps. The datalogger was enclosed in the IP-65 enclosure. A SIM-based router was installed near the field for internet connectivity. The readings were stored on the IoT platform, i.e., Thingspeak platform. Figure 8 represents the electronic components, microcontrollers, and the data storage system of the lysimeter assembly. The IoT sensors (soil moisture, soil temperature, ultrasonic, and load cell) performed reliably during the four-month wheat season. Periodic calibration was conducted for the load cell and ultrasonic sensor at installation and mid-season, with no major drift observed. The soil moisture sensors (Watermark 200SS) required rechecking after irrigation events but showed consistent performance. Overall, the system required minimal maintenance aside from routine inspections of wiring and sensor connections.
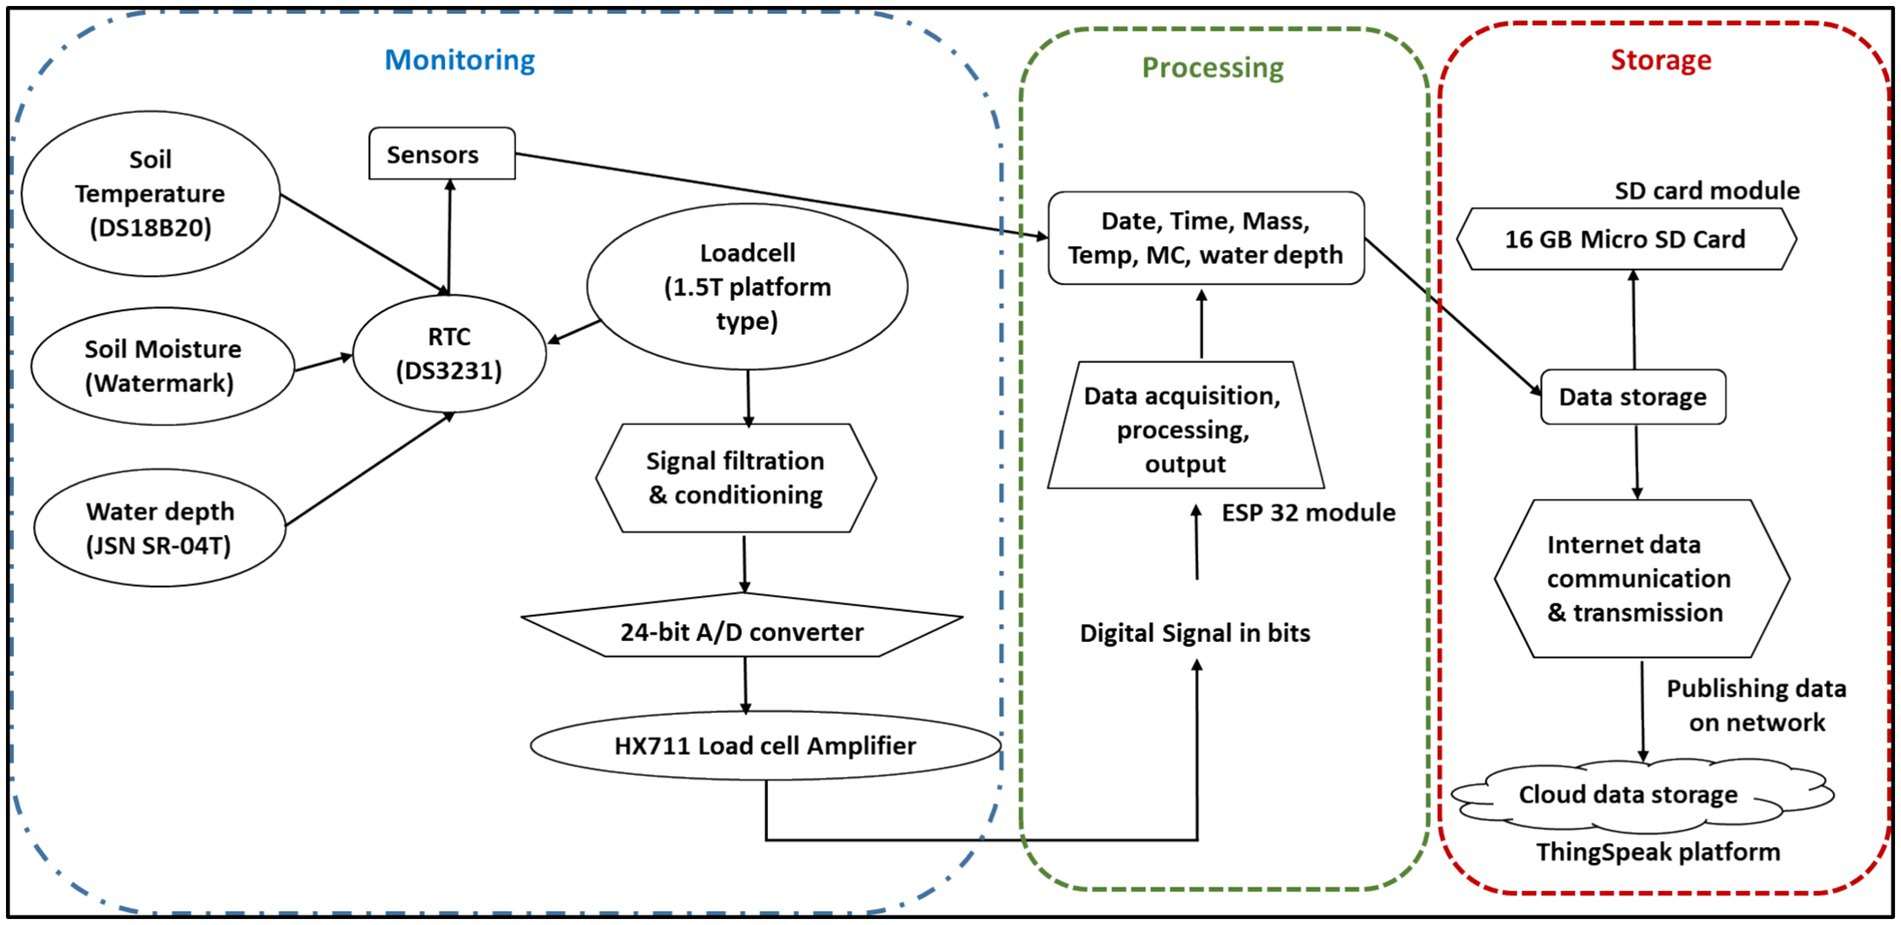
Figure 7. Lysimeter data monitoring, processing, and storage flow diagram.
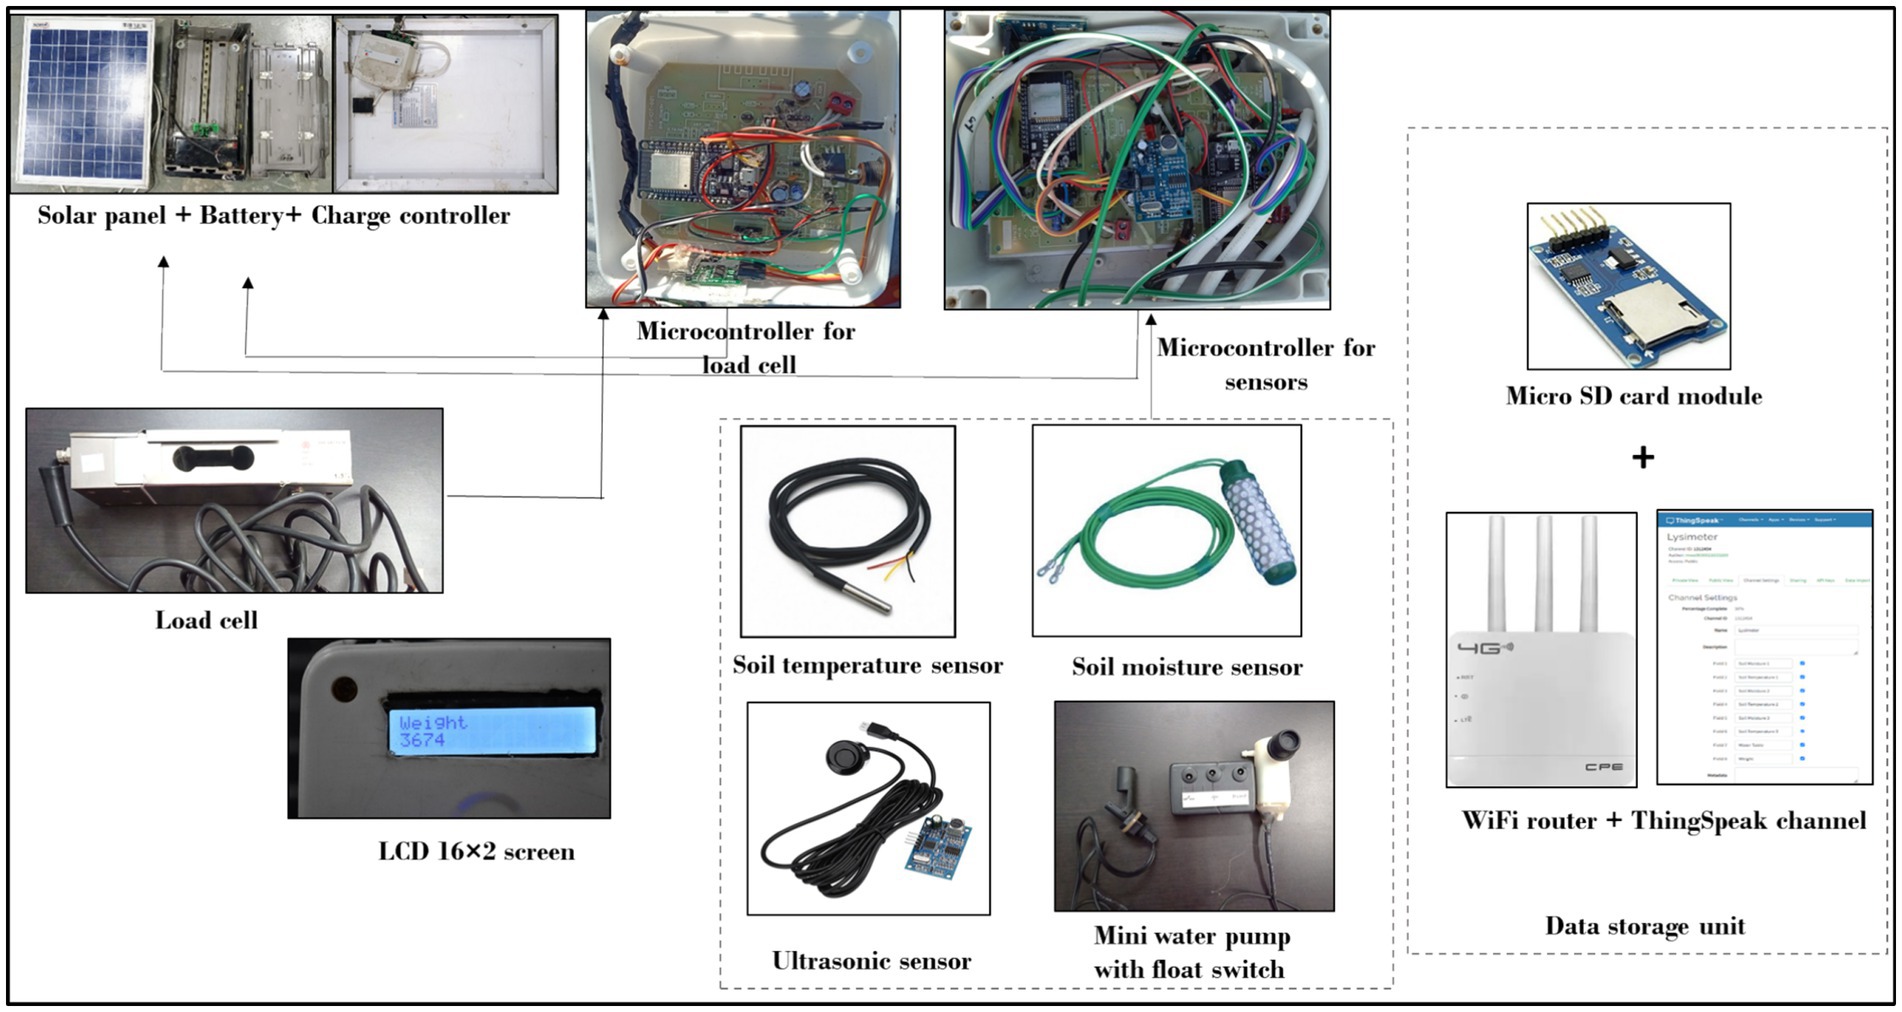
Figure 8. Sensors, microcontrollers, and other electronic components of lysimeter.
2.5 Calibration of load cell
The lysimeter weighing platform was calibrated in the lab before installation in the field. For the calibration, a combination of eleven known weights was placed and removed in sequential order. Tightly sealed bags filled with oven-dried soil were taken as standard known weights. A high-resolution digital scale with an accuracy of 0.01 g was utilized to measure known masses. Initially, the dead weight of the lysimeter was determined. Subsequently, the process of adding and removing mass to the lysimeter started, following a sequence planned to incorporate variations in mass. Masses were added individually, and their corresponding weights were recorded. These recorded weight changes were examined and compared against the actual weights. The procedure was then repeated in reverse order for the removal of the masses. Each addition and removal event was spaced by 40 s. Additionally, voltage readings from the load cell were taken at 15 and 30-s intervals post each mass change to ensure the lysimeter had stabilized. The calibration data was analyzed using a Microsoft Excel® spreadsheet to calculate the coefficient of determination (R2 value).
2.6 Cost of materials and construction
Table 3 lists the parts and total cost of the system, amounting to Rs. 58,910 (approximately $709 USD). This amount covers both construction and labor expenses. By opting for alternative sensors on the market, the component costs can be reduced further. A key benefit of this lysimeter setup is its affordability, making replication more feasible. Overall, the cost is considerably lower than that of other commercially available lysimeter systems.
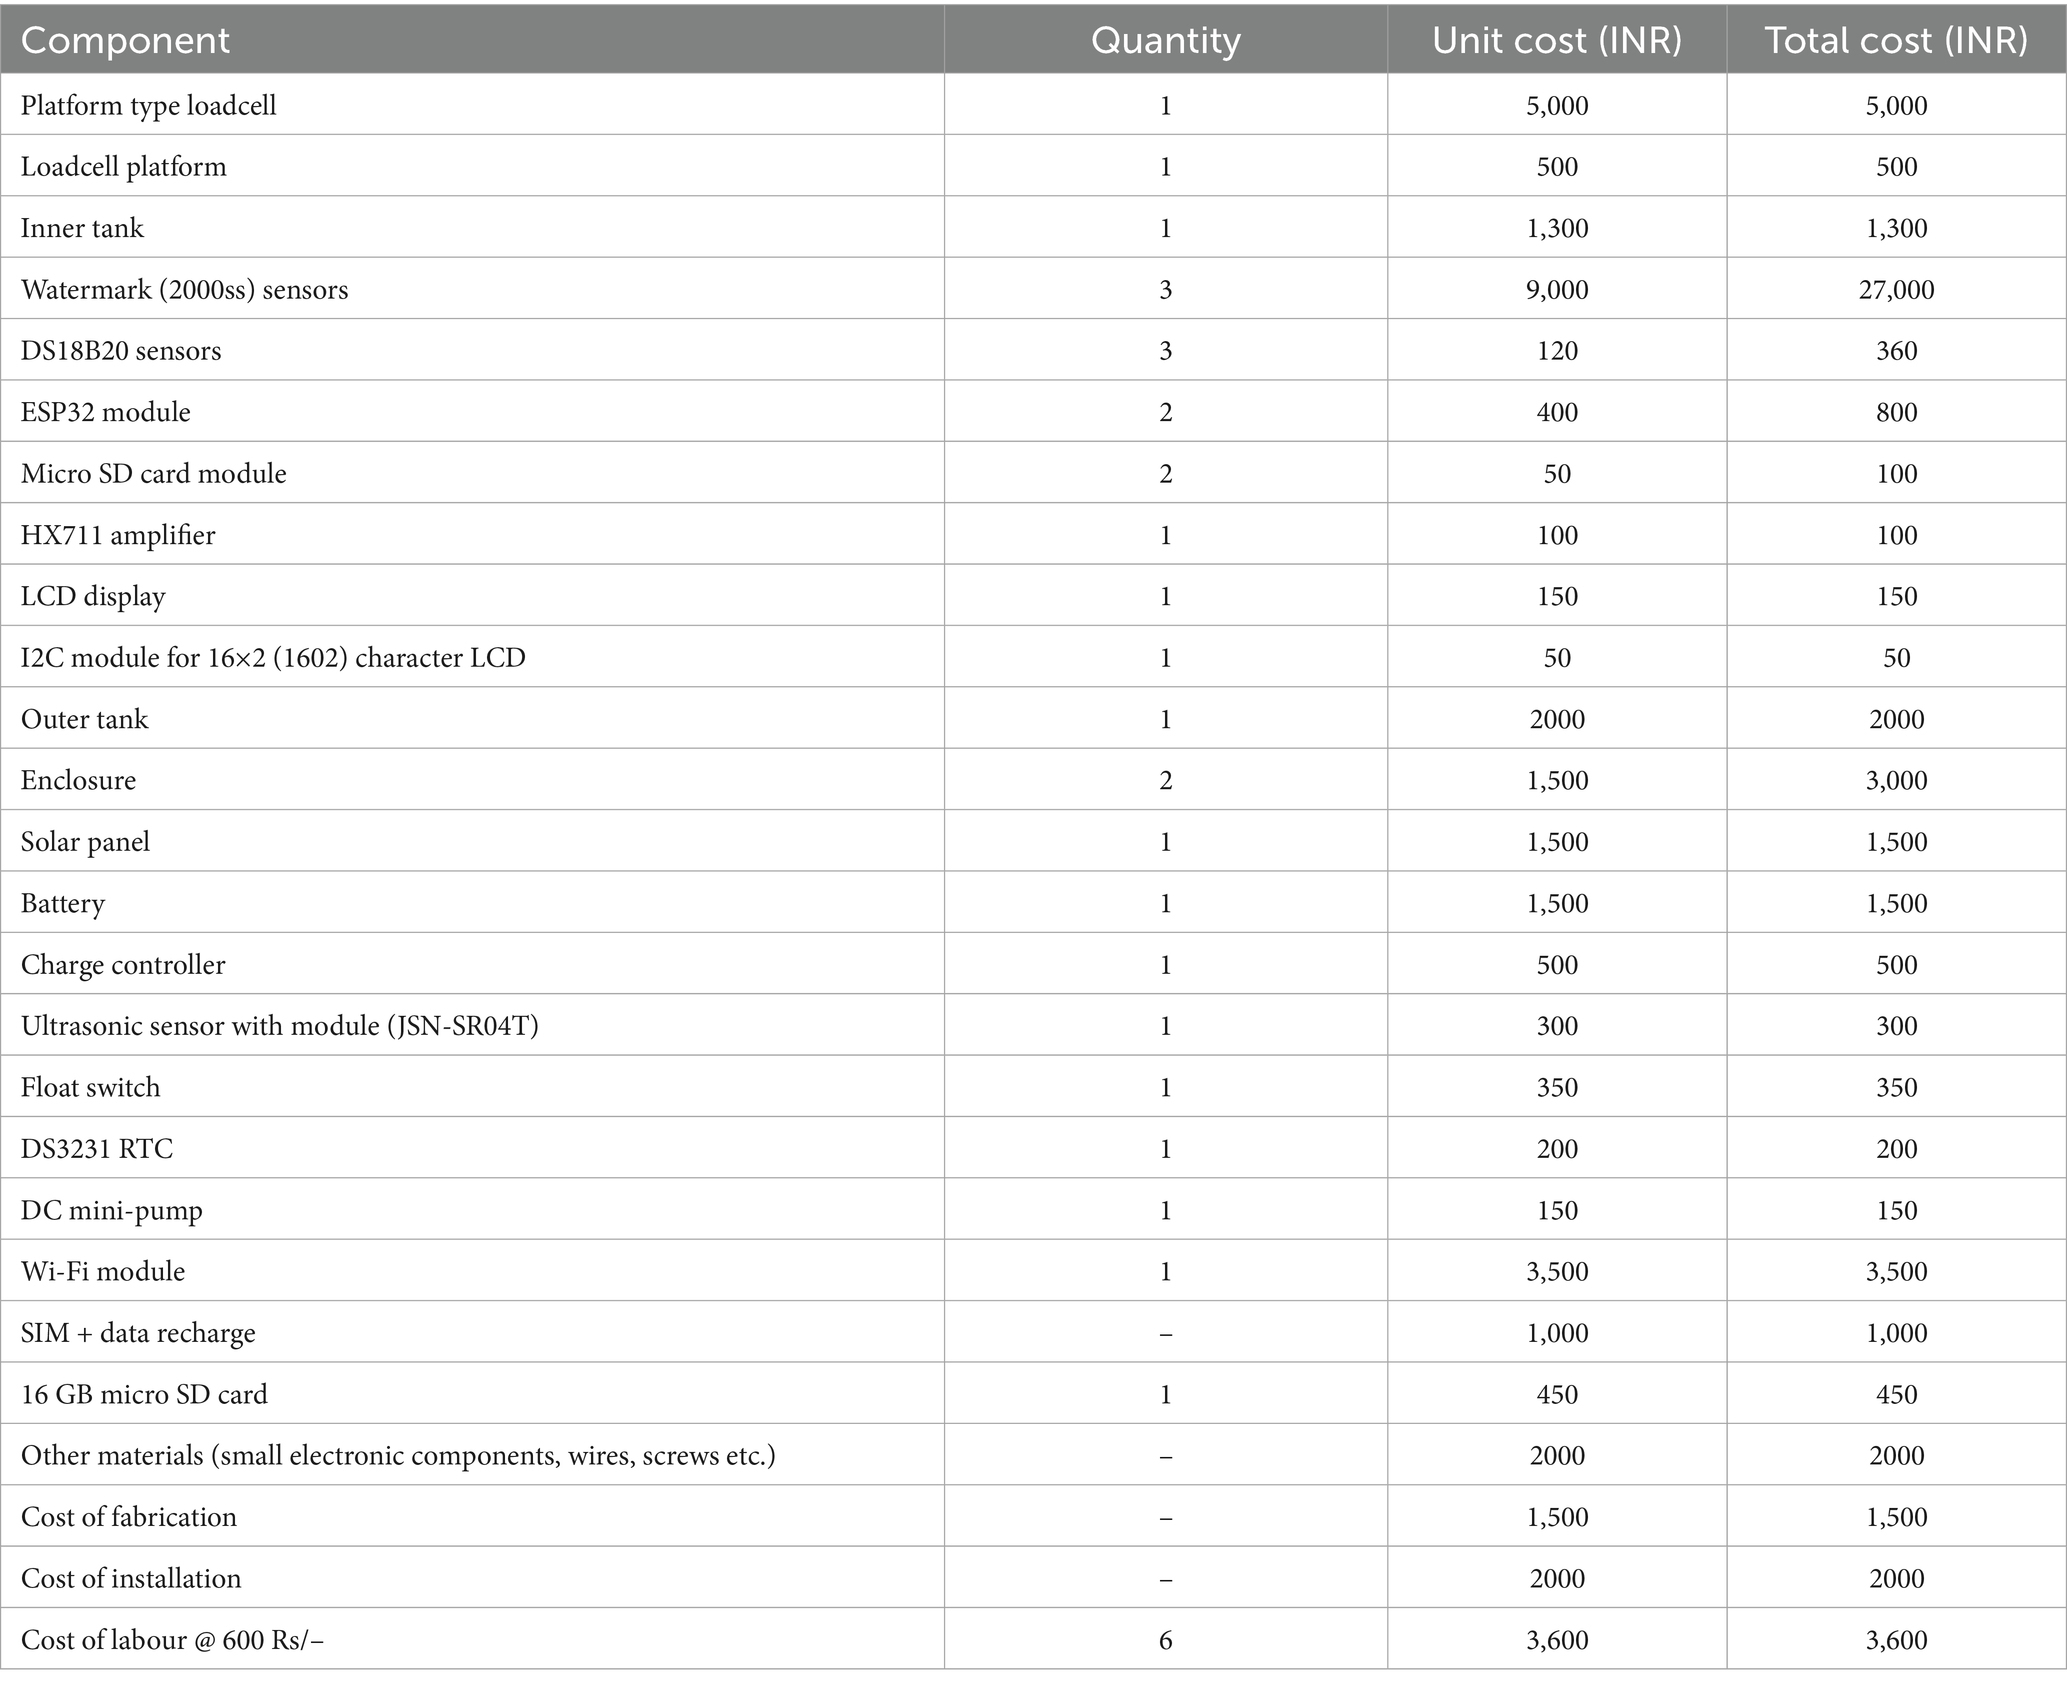
Table 3. Cost summary of the lysimeter components.
The cost of lysimeter systems reported in the literature varies considerably depending on their design, scale, and level of sophistication. For example, a field-scale lysimeter was developed at $1,310 (Dong and Hansen, 2023), and other units have been reported at approximately $1,700 (Fisher, 2012). Schmidt et al. (2013) documented an investment of about $5,100, while Bello and Van Rensburg (2017) presented a small-scale lysimeter at only $520. At the other extreme, advanced commercial systems such as the SmartField-Lysimeter by METER Group cost between $20,000 and $30,000 (METER Group, 2025; https://metergroup.com/meter-products/). In comparison, our IoT-enabled lysimeter was constructed at just $709, yet it incorporates advanced features including real-time cloud-based monitoring, automated drainage measurement, and multi-depth soil and temperature sensing. This balance of affordability and functionality makes it a cost-effective alternative, offering capabilities often found only in much more expensive systems.
2.7 Field testing
The Lysimeter was installed at the field and was tested to calculate crop evapotranspiration of wheat crop (Var. HI 1544) in the years 2022–23 (Winter). Daily evapotranspiration (ET) was calculated as the difference between the mass gains of the lysimeter and lysimeter mass losses and then dividing the result by the lysimeter’s area. The wheat crop was taken from 15th Nov 2022 to 12th April 2023. The water balancing parameters can be estimated by Equation 1. The wind affects the lysimeter reading because of momentum flux, causing important measurement fluctuations. However, the average wind speed of the study area is 3 KMPH, which produces an insignificant standard deviation in the measured value (Howell et al., 1995). Moreover, repeated readings were taken to minimize the wind effects (Van Bavel and Myers, 1962; Tyagi et al., 2003; López-Urrea et al., 2006) suggested taking measurements more frequently and averaging these over periods of 5–30 min to ensure readings are not influenced by wind. In our installation, measurements were collected every 5 min to mitigate this perturbation. The primary data collected may contain considerable error and need to be smoothed. Therefore, the primary data was smoothed using the exponential method and outliers were removed before calculating the daily water balance. The daily crop evapotranspiration sum for each day was estimated using Equation 2.
2.7.1 Lysimeter water balance
where:
ETc = crop evapotranspiration; P = precipitation; Irr = irrigation; D = drainage; ΔS = change in profile soil water content.
2.8 Estimation of crop evapotranspiration
The actual evapotranspiration ETc (mm) was estimated (Equation 2) as given by Doležal et al., 2018.
where, ETc,i represents the actual evapotranspiration on the ith day, LYWi and DRi denoting the masses of the lysimeter and the drainage tank, respectively (both in kg), measured at midnight on the ith day., while LYWi+1 and DRi+1 represent the masses of the same items at midnight of the following day (i + 1). The equation is based on the assumption that the density of water is 1,000 kg/m3 and the inner horizontal diameter of the lysimeter measures 0.45 m.
2.9 Estimation of reference evapotranspiration
Reference evapotranspiration (ET0) refers to the evapotranspiration of a reference crop like alfalfa, assumed to be 0.12 m tall, with a surface resistance of 70 S/m and an albedo of 0.23. This crop is considered to be actively growing over a large area with constant, adequate water supply (Allen et al., 1998). ET0 was calculated using the CROPWAT software version 4.2, developed by the food and agriculture organization (FAO). The Penman-Monteith equation (Equation 3), which incorporates factors such as daily sunshine hours, maximum and minimum air temperatures, relative humidity, and wind speed at a height of 2 m, was employed to estimate ET0.
Where:
ET0 = Reference evapotranspiration (mm day−1).
Rn = Net radiation at the crop surface (MJm−2 day−1);
G = Soil heat flux density (MJ m−2 day−1); T = Mean daily air temperature at 2 m height (°C);
U2 = Wind speed at 2 m height (m s−1); ea = Saturation vapor pressure (kPa);
ed = actual vapor pressure (kPa); (ea − ed) = Saturation vapor pressure deficit (kPa);
Δ = Slope vapor pressure curve (kPa °C−1); γ = Psychometric constant (kPa °C−1).
3 Results and discussion
The calibration of the lysimeter weighing system demonstrated a strong correlation (R2 = 0.998) between the known mass and the lysimeter’s readings, indicating precise measurements (Figure 9; Table 4). This level of precision is comparable with results from other studies. For example, Bello and Van Rensburg (2017) and Junior et al. (2023) reported an R2 of 0.998 in their studies on low-cost weighing lysimeters. Similarly, Sanches et al. (2017) and, Dong and Hansen (2023) achieved an R2 of 1 in their work on lysimeter construction and calibration. The lysimeter developed in this study exhibited excellent linearity and no hysteresis, underscoring its reliability for cost-effective usage. Consequently, this equipment is well-suited for evaluating evapotranspiration (ETc) with a precision and accuracy of about 0.2 mm, appropriate for field crop research applications. Lysimeters vary in size, shape, and mass, which affects their sensitivity levels, as noted by Bello and Van Rensburg (2017). According to the literature, lysimeter sensitivities range from a high of 0.004 mm (Marek et al., 2006) to a low of 1.0 mm (McFarland et al., 1983). Therefore, the sensitivities observed in this study align with those in the higher sensitivity spectrum.
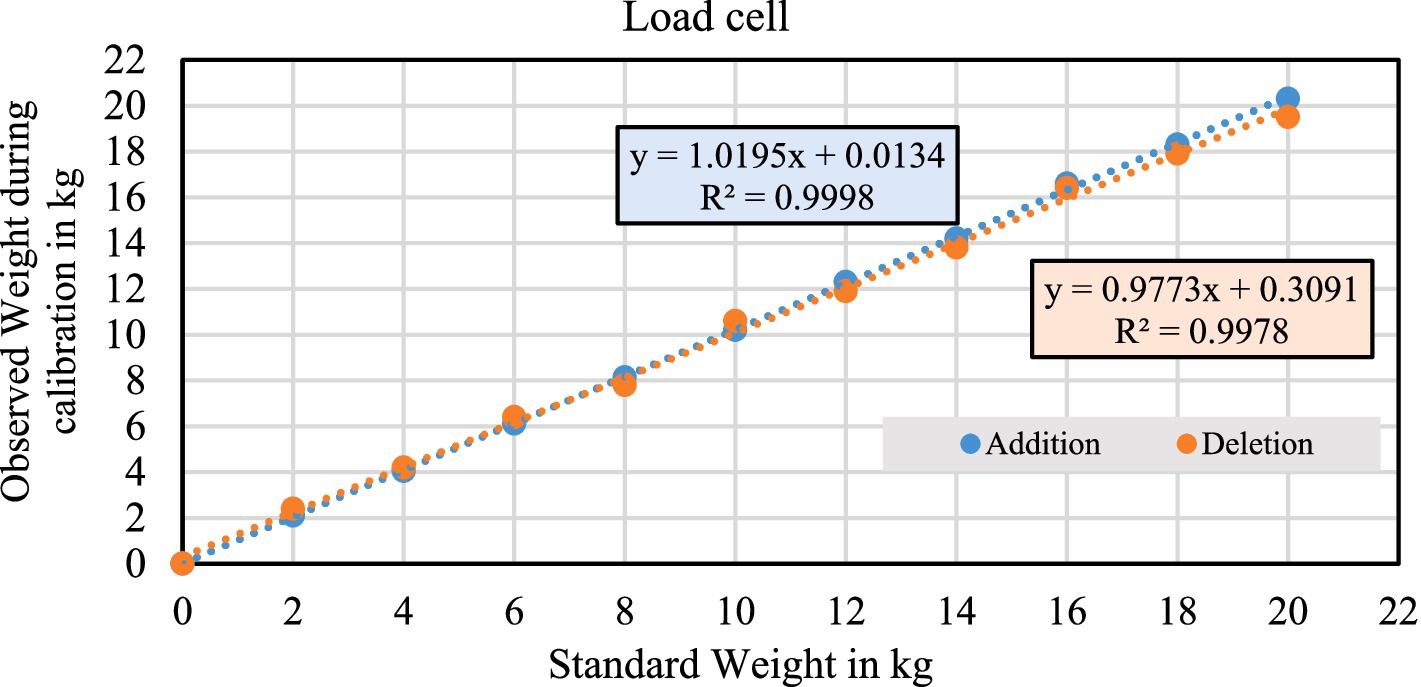
Figure 9. Calibration of lysimeter weighing platform for addition and deletion of known weights.
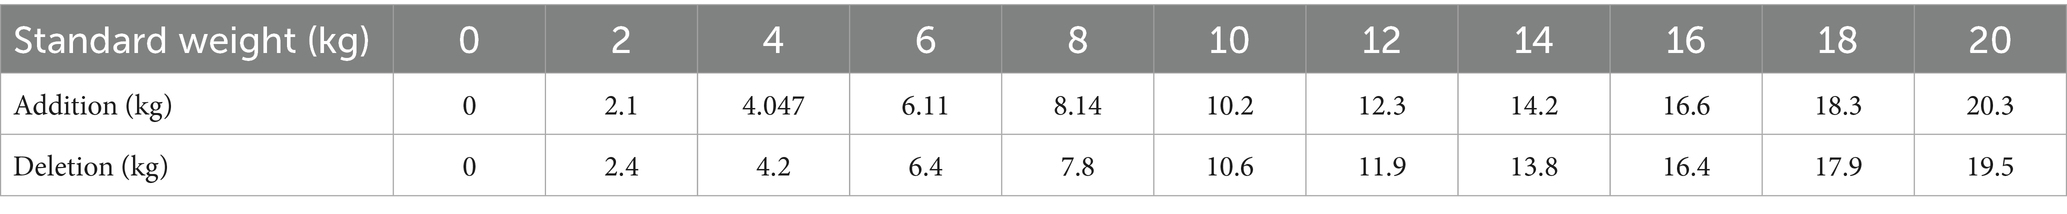
Table 4. Calibration data of load cell during addition and deletion of standard weights.
The lysimeter demonstrated high sensitivity and precision in detecting changes in mass, essential for calculating the mass balance of the system (Junior et al., 2023). For instance, during manual irrigation on December 10, 2022, a specific volume of water corresponding to the mass of 12 kg was added at 4:30 p.m., the lysimeter’s readings displayed in Figure 10. The recorded mass was remarkably accurate, showing 11.83 kg, an error margin of just 0.17 kg. According to the trend shown in Figure 10, the weight of the lysimeter decreased on the day before irrigation due to evapotranspiration, which caused water loss from the soil, varying the daily rate between day and night. The irrigation increased the lysimeters’ equivalent mass, whereas crop evapotranspiration (ETc) led to a reduction, particularly during peak atmospheric demand from 11:00 a.m. to 2:00 p.m. On the day of the test, the ETc for the lysimeter was 1.39 mm. Additionally, the reference evapotranspiration (ET0) for that day, calculated using the Penman-Monteith method by Allen et al. (1998), was 1.98 mm. Another example for the 2 days evaluation of the lysimeter, is two rain events that occurred on 26/01/2023 (15.8 mm), as well as on 27/01/2023 (11.9 mm) totaling up to 27.7 kg of water input. The recorded increase in the equivalent mass of lysimeter was 27.2 kg with an error of only 0.50 kg. The ETc of the first day of testing (26/01/2023) was 1.86 mm for lysimeter and ET0 on this day was 1.62 mm. While ETc of the second day of testing (27/01/2023) was 1.51 mm for lysimeter and ET0 was 1.31 mm. A significant amount of water from the soil inside the lysimeter was drained through the filter layer with the amount of 5.6 mm. The drainage amount was recorded through an ultrasonic sensor. We should remember that there is a cap on the maximum capacity of the drainage tank. An internal algorithm automatically empties it once this limit is reached, allowing the measurement of any additional drainage to continue. The results obtained indicated that the portable weighing lysimeter accurately measured the water volumes provided through irrigation.
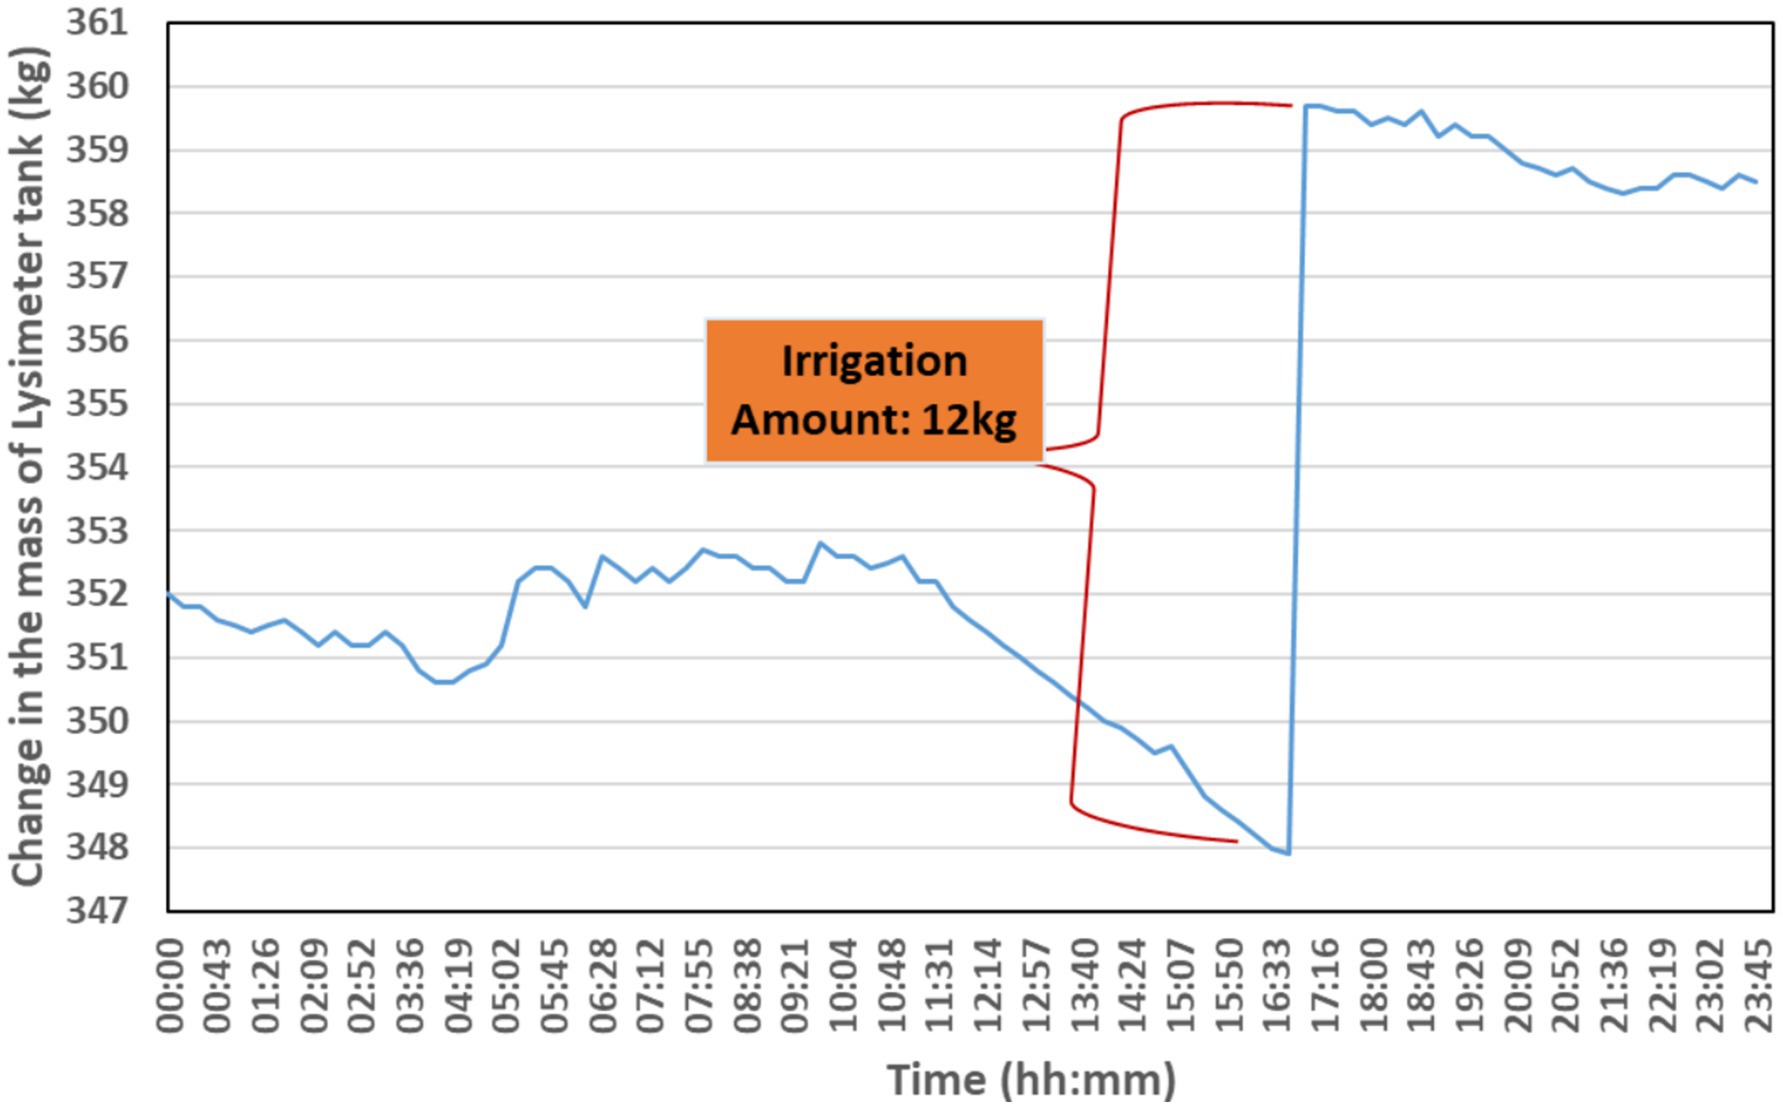
Figure 10. Precision evaluation of irrigation in the lysimeter (test).
During the test days from January 1, 2023, to January 6, 2023, the behavior of the lysimeter, as illustrated in Figure 11, aligned with the expected standard pattern. This pattern reflects changes in soil water storage due to the evapotranspiration process, as described by Gomes (2017) and Junior et al. (2023), with no rainfall impacting the results.
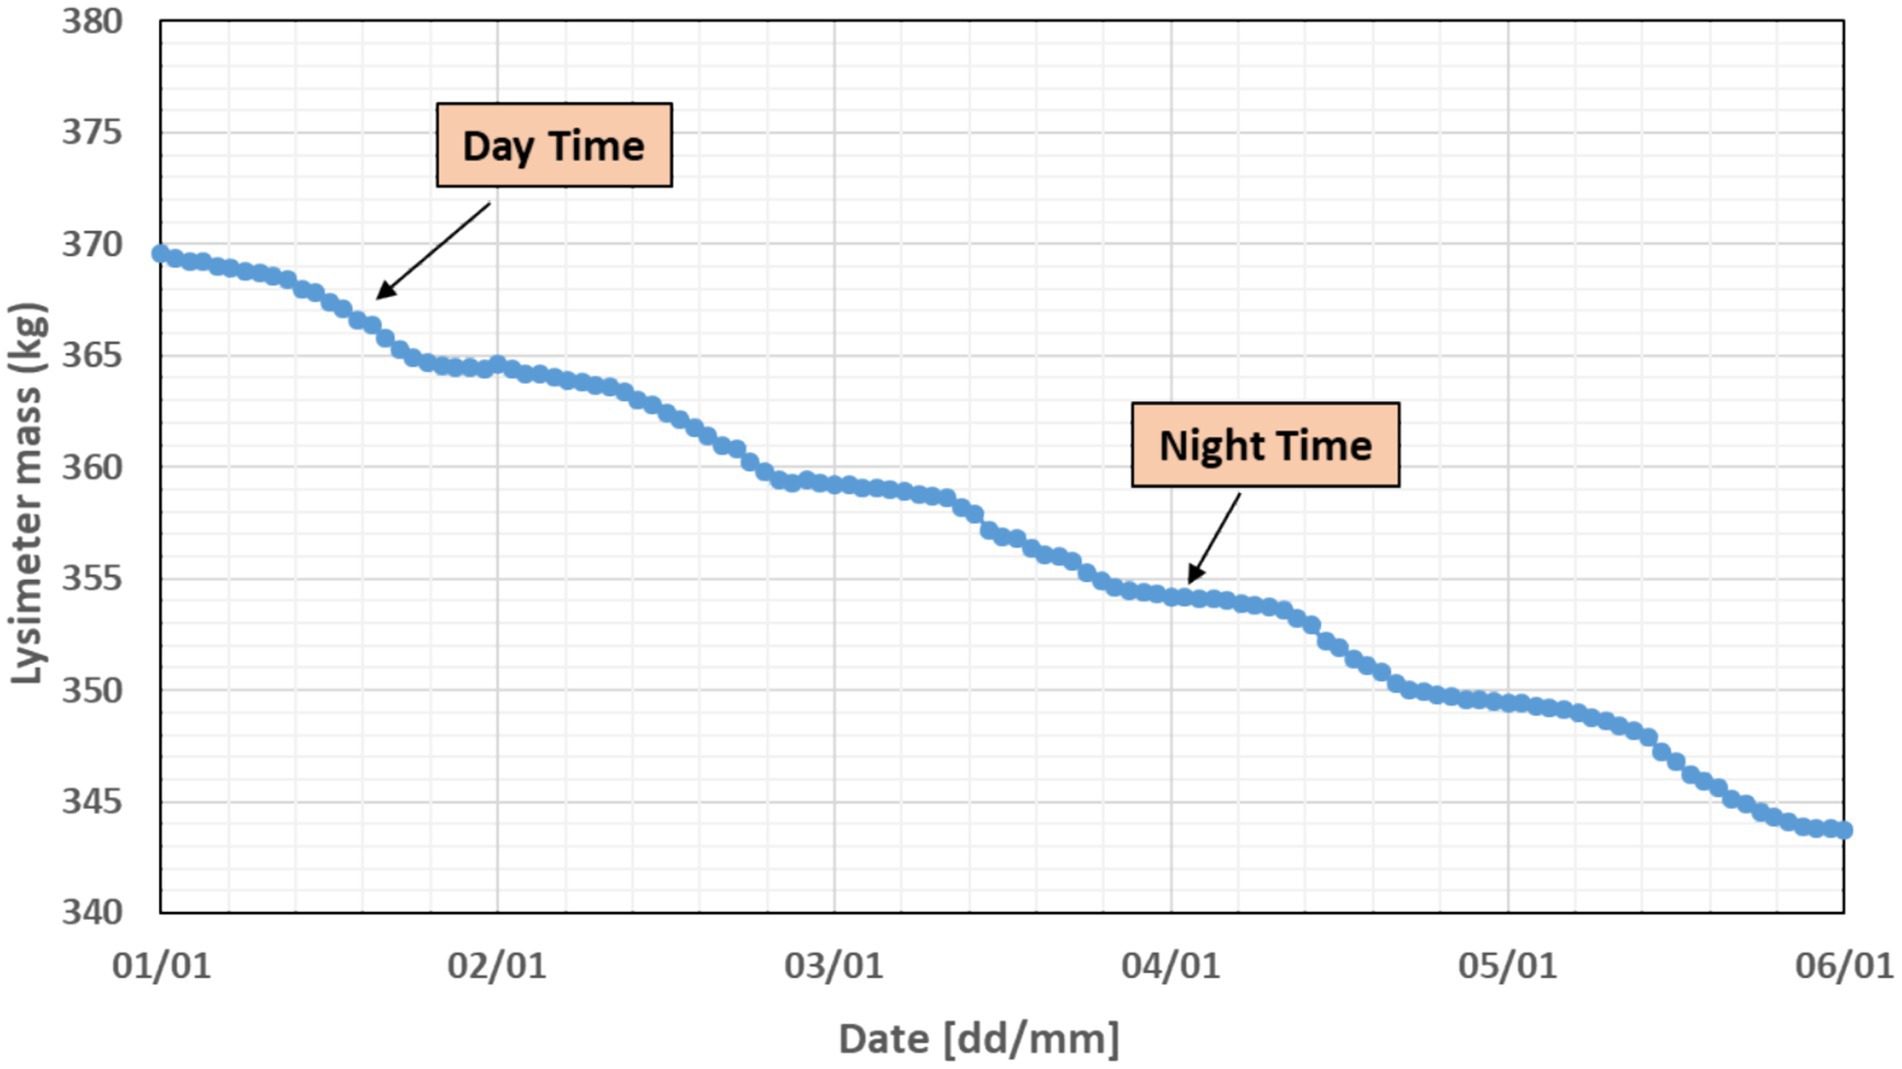
Figure 11. Variation of lysimeter mass during test week.
3.1 Reference ET and lysimeter ET of wheat crop
The average daily evapotranspiration (ETc) for wheat was recorded at 2.12 mm/day, with variations ranging from 0.57 mm to 5.27 mm. This study’s conclusions are corroborated by the findings from Adamala et al. (2016) and Bala et al. (2017). The total ETc for wheat was measured at 331.9 mm, while the reference evapotranspiration (ET0) during the same seasons was 359.08 mm (Figure 12). In various agro-climatic zones of India, wheat crop ET values fluctuate between 300 and 450 mm. The ET values observed during field trials confirm the efficacy of the lysimeter used. These results align with those reported by Tyagi et al. (2000) who found a crop ET value of 332 mm for wheat through a lysimeter study.
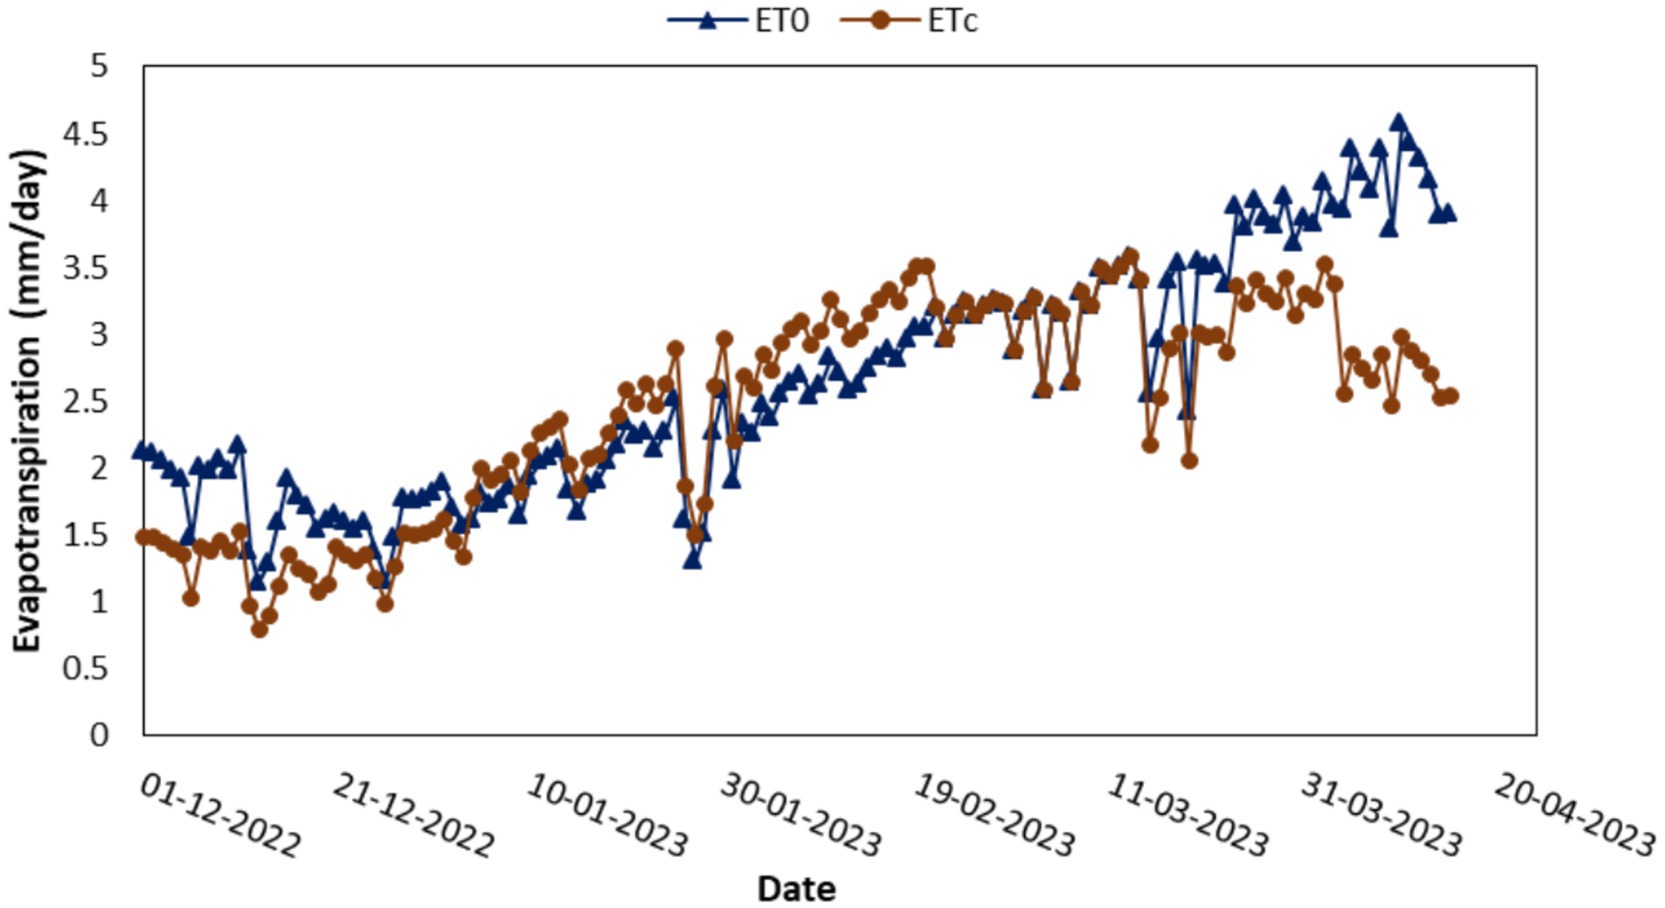
Figure 12. Reference ET and lysimeter ET for wheat crop during rabi 2022–23.
4 Conclusion
The development of the IoT-enabled digital weighing lysimeter at the ICAR-Central Institute of Agricultural Engineering, Bhopal, represents a significant advancement in evapotranspiration measurement technology. Unlike conventional lysimeters, this system integrates real-time remote monitoring through Wi-Fi connectivity (ESP32 and Raspberry Pi), enabling cloud-based data access and eliminating manual data collection. Its autonomous operation, powered by a 20 W solar panel, ensures reliable functionality in off-grid conditions, while its high-resolution water depth measurement (0.1–0.25 mm) enhances accuracy in soil water balance estimations. The integration of advanced sensors and an automated drainage system significantly reduces human intervention, improving the precision and efficiency of hydrological monitoring. The lysimeter’s construction, utilizing durable materials and an optimized drainage system, minimizes soil erosion while maintaining proper water management. The installation process adhered to best practices, preserving soil structure integrity and ensuring precise hydrological observations. Calibration results demonstrated an exceptional correlation (R2 = 0.998) between known weights and lysimeter readings, confirming its capability to detect minute mass changes crucial for evapotranspiration estimation. Field validation further reinforced its accuracy, with recorded evapotranspiration rates closely aligning with established models such as the Penman-Monteith equation.
With a total cost of Rs. 58,910 (approximately $709 USD), the system offers a cost-effective and accessible alternative to commercial lysimeters, making high-precision evapotranspiration measurement feasible for a wider range of agricultural applications. The integration of multi-depth soil moisture and temperature sensors enables comprehensive soil profile monitoring, surpassing traditional lysimeter capabilities. This research underscores the successful development of a robust, affordable, and scalable lysimeter system that enhances irrigation management, supports water-use optimization, and contributes to long-term agricultural sustainability.
Data availability statement
The original contributions presented in the study are included in the article/supplementary material, further inquiries can be directed to the corresponding author.
Author contributions
AG: Conceptualization, Writing – review & editing, Investigation, Software, Methodology, Formal analysis, Writing – original draft. RS: Conceptualization, Supervision, Writing – review & editing, Writing – original draft, Formal analysis, Validation. MK: Conceptualization, Methodology, Writing – original draft, Writing – review & editing, Software.
Funding
The author(s) declare that no financial support was received for the research and/or publication of this article.
Acknowledgments
The authors are grateful to the Director, ICAR-Central Institute of Agricultural Engineering (CIAE), Bhopal for their immense support and facilities to conduct this study.
Conflict of interest
The authors declare that the research was conducted in the absence of any commercial or financial relationships that could be construed as a potential conflict of interest.
Generative AI statement
The authors declare that no Gen AI was used in the creation of this manuscript.
Any alternative text (alt text) provided alongside figures in this article has been generated by Frontiers with the support of artificial intelligence and reasonable efforts have been made to ensure accuracy, including review by the authors wherever possible. If you identify any issues, please contact us.
Publisher’s note
All claims expressed in this article are solely those of the authors and do not necessarily represent those of their affiliated organizations, or those of the publisher, the editors and the reviewers. Any product that may be evaluated in this article, or claim that may be made by its manufacturer, is not guaranteed or endorsed by the publisher.
Footnotes
References
Adamala, S., Rajwade, Y. A., and Reddy, Y. K. (2016). Estimation of wheat crop evapotranspiration using NDVI vegetation index. J. Appl. Nat. Sci. 8, 159–166. doi: 10.31018/jans.v8i1.767
Allen, R. G., and Fischer, D. K. (1991). “Direct load cell-based weighing lysimeter system” in Lysimeter for evapotranspiration and environmental measurements. eds. R. G. Allen, T. A. Howell, W. O. Pruitt, I. A. Water, and E. Jensen (New York: American Society of Civil Engineers), 114–124.
Allen, R. G., Pereira, L. S., Raes, D., and Smith, M. (1998). “Crop evapotranspiration: guidelines for computing cropwater requirements” in FAO irrigation and drainage paper 56 (Rome: FAO), 174.
Ayars, J. E., Johnson, R. S., Phene, C. J., Trout, T. J., Clark, D. A., and Mead, R. M. (2003). Water use by drip-irrigated late-season peaches. Irrig. Sci. 22, 187–194. doi: 10.1007/s00271-003-0084-4
Bala, A., Pawar, P. S., Misra, A. K., and Rawat, K. S. (2017). Estimation and validation of actual evapotranspiration for wheat crop using SEBAL model over Hisar district, Haryana, India. Curr. Sci. 113, 134–141. doi: 10.18520/cs/v113/i01/134-141
Barani, G. A., and Khanjani, M. J. (2002). A large electronic weighing lysimeter system: design and installation. J. Am. Water Resour. Assoc. 38, 1053–1060. doi: 10.1111/j.1752-1688.2002.tb05545.x
Bello, Z. A., and Van Rensburg, L. D. (2017). Development, calibration and testing of a low-cost small lysimeter for monitoring evaporation and transpiration. Irrig. Drain. 66, 263–272. doi: 10.1002/ird.2095
Black, T. A., Thurtell, G. W., and Tanner, C. B. (1968). Hydraulic load-cell lysimeters, construction, calibration and test. Soil Sci. Soc. Am. Proc. 32, 623–629.
Chapman, T. G., and Malone, R. W. (2002). Comparison of models for estimation of groundwater recharge, using data from a deep weighing lysimeter. Math. Comput. Simul. 59, 3–17. doi: 10.1016/S0378-4754(01)00389-5
Da Silva, J. C., da Silva, A., Bonfim-Silva, E. M., Duarte, T. F., and Pacheco, A. B. (2016). Construction and assessment of a hydraulic weighing lysimeter. Afr. J. Agric. Res. 11, 951–960. doi: 10.5897/AJAR2015.10730
Ding, R., Kang, S., Li, F., Zhang, Y., Tong, L., and Sun, Q. (2010). Evaluating eddy covariance method by large-scale weighing lysimeter in a maize field of Northwest China. Agric. Water Manag. 98, 87–95. doi: 10.1016/j.agwat.2010.08.001
Doležal, F., Hernandez-Gomis, R., Matula, S., Gulamov, M., Miháliková, M., and Khodjaev, S. (2018). Actual evapotranspiration of unirrigated grass in a smart field lysimeter. Vadose Zone J. 17, 1–13. doi: 10.2136/vzj2017.09.0173 1
Dong, Y., and Hansen, H. (2023). Development and design of an affordable field scale weighing lysimeter using a microcontroller system. Smart Agric. Technol. 4:100147. doi: 10.1016/j.atech.2022.100147
Dugas, W. A., Upchurch, D. R., and Ritchie, J. T. (1985). A weighing lysimeter for evapotranspiration and root measurements. Agron. J. 77, 821–825.
Fisher, D. K. (2012). Simple weighing lysimeters for measuring evapotranspiration and developing crop coefficients. Int. J. Agric. & Biol. Eng, 5, 35–43. Available online at: https://www.ijabe.org
Girona, J., Del Campo, J., Mata, M., Lopez, G., and Marsal, J. (2011). A comparative study of apple and pear tree water consumption measured with two weighing lysimeters. Irrig. Sci. 29, 55–63. doi: 10.1007/s00271-010-0217-5
Gomes, J. R. (2017). Construction and calibration of a weighing lysimeter and comparison of its evapotranspiration measurement with that obtained by Thornthwaite’s method (1948). Master’s Dissertation, UNESP, Botucatu, p. 101.
Gupta, A., Rao, K. V. R., Singh, S., Soni, K., and Sawant, C. (2019). Water productivity and yield of baby corn (Zea mays L.) as influenced by irrigation levels under subsurface drip irrigation. Int. J. Chem. Stud. 7, 128–135.
Gupta, A., Sarangi, A., and Singh, D. K. (2017). Estimation of crop coefficients and water productivity of mustard (Brassica juncea) under semi-arid conditions. Curr. Sci. 113, 264–271. doi: 10.18520/cs/v113/i02/264-271
Hagenau, J., Meissner, R., and Borg, H. (2015). Effect of exposure on the water balance of two identical lysimeters. J. Hydrol. 520, 69–74. doi: 10.1016/j.jhydrol.2014.11.030
Hirschi, M., Michel, D., Lehner, I., and Seneviratne, S. I. (2017). A site-level comparison of lysimeter and eddy covariance flux measurements of evapotranspiration. Hydrol. Earth Syst. Sci. 21, 1809–1825. doi: 10.5194/hess-21-1809-2017
Howell, T. A., Schneider, A. D., Dusek, D. A., Marek, T. H., and Steiner, J. L. (1995). Calibration and scale performance of bushland weighing lysimeters. Trans. ASAE 38, 1019–1024.
Howell, T. A., Schneider, A. D., and Jensen, M. E. (1991). “History of lysimeter design and use for evapotranspiration measurements” in Lysimeters for evapotranspiration and environmental measurements : proceedings of the international symposium on lysimetry, Honolulu, Hawaii, July 23 - 25, 1991, eds. R.G. Allen, T.A. Howell, W.O. Pruitt et al. (New York: ASCE), 1–9.
Hunsaker, D. J., Pinter, P. J., and Cai, H. (2002). Alfalfa basal crop coefficients for FAO–56 procedures in the desert regions of the Southwestern US. Trans. ASAE 45:1799. doi: 10.13031/2013.11431
IMD. (2008). Annual report 2008. Ministry of Earth Sciences, Government of India. Available online at: https://metnet.imd.gov.in/docs/imdnews/ANNUAL_REPORT2008English.pdf (Accessed March 04, 2025).
Jia, X., Dukes, M. D., Jacobs, J. M., and Irmak, S. (2006). Weighing lysimeters for evapotranspiration research in a humid environment. Trans. ASAE 49, 401–412. doi: 10.13031/2013.20414
Jiménez-Carvajal, C., Ruiz-Peñalver, L., Vera-Repullo, J. A., Jiménez-Buendía, M., Antolino-Merino, A., and Molina-Martínez, J. M. (2017). Weighing lysimetric system for the determination of the water balance during irrigation in potted plants. Agric. Water Manag. 183, 78–85. doi: 10.1016/j.agwat.2016.10.006
Johnson, R. S., Williams, L. E., Ayars, J. E., and Trout, T. J. (2005). Weighing lysimeters aid study of water relations in tree and vine crops. Calif. Agric. 59, 113–136. doi: 10.3733/ca.v059n02p133
Junior, A. A., da Silva, T. J. A., and Andrade, S. P. (2023). Smart IoT lysimetry system by weighing with automatic cloud data storage. Smart Agric. Technol. 4:100177. doi: 10.1016/j.atech.2023.100177
Kebede, N., Ayana, M., Mekonnen, B., and Beri, H. (2024). Design, construction, and calibration of a weighable lysimeter for measuring water requirements of field crops for data-scarce areas of Ethiopia. Heliyon 10:e36968. doi: 10.1016/j.heliyon.2024.e36968
Khan, B. R., Mainuddin, M., and Molla, M. N. (1993). Design, construction and testing of a lysimeter for a study of evapotranspiration of different crops. Agric. Water Manag. 23, 183–197. doi: 10.1016/0378-3774(93)90027-8
Kim, Y., Jabro, J. D., and Evans, R. G. (2011). Wireless lysimeters for real-time online soil water monitoring. Irrig. Sci. 29, 423–430. doi: 10.1007/s00271-010-0249-x
Libardi, L. G., Faria, R. T. D., Dalri, A. B., Rolim, G. D. S., and Palaretti, L. F. (2018). High precision weighing lysimeters for evapotranspiration measurements of sugarcane pre-sprouted plantlets. Eng. Agric. 38, 208–216. doi: 10.1590/1809-4430-/2018
Loos, C., Gayler, S., and Priesack, E. (2007). Assessment of water balance simulations for large-scale weighing lysimeters. J. Hydrol. 335, 259–270. doi: 10.1016/j.jhydrol.2006.11.017
López-Urrea, R., de Santa Olalla, F. M., Fabeiro, C., and Moratalla, A. (2006). Testing evapotranspiration equations using lysimeter observations in a semiarid climate. Agric. Water Manag. 85, 15–26. doi: 10.1016/j.agwat.2006.03.014
Lorite, I. J., Santos, C., Testi, L., and Fereres, E. (2012). Design and construction of a large weighing lysimeter in an almond orchard. J. Agric. Res. 10, 238–250. doi: 10.5424/sjar/2012101-243-11
Marek, T., Piccinni, G., Schneider, A., Howell, T., Jett, M., and Dusek, D. (2006). Weighing lysimeters for the determination of crop water requirements and crop coefficients. Appl. Eng. Agric. 22, 851–856. doi: 10.13031/2013.22256
Marek, T. H., Schneider, A. D., Howell, T. A., and Ebeling, L. L. (1988). Design and construction of large weighing monolithic lysimeters. Trans. ASAE 31, 477–0484.
Mariano, D. D. C., Faria, R. T. D., Freitas, P. S. L. D., Lena, B. P., and Johann, A. L. (2015). Construction and calibration of a bar weighing lysimeter. Acta Sci. Agron. 37, 271–278. doi: 10.4025/actasciagron.v37i3.19368
McFarland, M. J., Worthington, J. W., and Newman, J. S. (1983). Design, installation and operation of a twin weighing lysimeter for fruit trees. Trans. ASAE 26, 1717–1721.
Nicolás-Cuevas, J. A., Parras-Burgos, D., Soler-Méndez, M., Ruiz-Canales, A., and Molina-Martínez, J. M. (2020). Removable weighing lysimeter for use in horticultural crops. Appl. Sci. 10:4865. doi: 10.3390/app10144865
Parisi, S., Mariani, L., Cola, G., and Maggiore, T. (2009). Mini-lysimeters evapotranspiration measurements on suburban environment. Ital. J. Agrometeorol. 3, 13–16.
Payero, J. O., and Irmak, S. (2008). Construction, installation, and performance of two repacked weighing lysimeters. Irrig. Sci. 26, 191–202. doi: 10.1007/s00271-007-0085-9
Payero, J. O., Mirzakhani-Nafchi, A., Khalilian, A., Qiao, X., and Davis, R. (2017). Development of a low-cost internet-of-things (IoT) system for monitoring soil water potential using watermark 200SS sensors. Adv. Internet Things 7, 71–86. doi: 10.4236/ait.2017.73005
Phene, C. J., Hoffman, G. J., Howell, T. A., Clark, D. A., Mead, R. M., Johnson, R. S., et al. (1991). “Automated lysimeter for irrigation and drainage control” in Proceedings, Lysimeters for evapotranspiration and environmental measurements, IR Div/ASCE. Honolulu Hawaii, USA, 23–25 July 1991 (American Society of Civil Engineers, St Joseph, Missouri, USA), 28–36.
Pruitt, W. O., and Angus, D. E. (1960). Large weighing lysimeter for measuring evapotranspiration. Trans. ASAE 3, 13–18.
Ritchie, J. T., and Burnett, E. (1968). A precision weighing lysimeter for row crop water use studies. Agron. J. 60, 545–549.
Ruiz-Peñalver, L., Vera-Repullo, J. A., Jiménez-Buendía, M., Guzmán, I., and Molina-Martínez, J. M. (2015). Development of an innovative low cost weighing lysimeter for potted plants: application in lysimetric stations. Agric. Water Manag. 151, 103–113. doi: 10.1016/j.agwat.2014.09.020
Ruth, C. E., Michel, D., Hirschi, M., and Seneviratne, S. I. (2018). Comparative study of a long-established large weighing lysimeter and a state-of-the-art mini-lysimeter. Vadose Zone J. 17, 1–10. doi: 10.2136/vzj2017.01.0026
Sagar, A., Hasan, M., Singh, D. K., Al-Ansari, N., Chakraborty, D., Singh, M. C., et al. (2022). Development of smart weighing lysimeter for measuring evapotranspiration and developing crop coefficient for greenhouse chrysanthemum. Sensors 22:6239. doi: 10.3390/s22166239
Sanches, A. C., Souza, D. P. D., Mendonça, F. C., and Maffei, R. G. (2017). Construction and calibration of weighing lysimeters with an automated drainage system. Rev. Bras. Eng. Agríc. Ambient. 21, 505–509. doi: 10.1590/1807-1929/agriambi
Schmidt, C. D. S., Pereira, F. D. C., Oliveira, A. D., Júnior, J. F. G., and Vellame, L. M. (2013). Design, installation and calibration of a weighing lysimeter for crop evapotranspiration studies. Water Resour. Irrig. Manag. 2, 77–85.
Soldevilla-Martinez, M., Quemada, M., López-Urrea, R., Muñoz-Carpena, R., and Lizaso, J. I. (2014). Soil water balance: comparing two simulation models of different levels of complexity with lysimeter observations. Agric. Water Manag. 139, 53–63. doi: 10.1016/j.agwat.2014.03.011
Tyagi, N. K., Sharma, D. K., and Luthra, S. K. (2000). Evapotranspiration and crop coefficients of wheat and sorghum. J. Irrig. Drain. Eng. 126, 215–222. doi: 10.1061/(ASCE)0733-9437(2000)126:4(215)
Tyagi, N. K., Sharma, D. K., and Luthra, S. K. (2003). Determination of evapotranspiration for maize and berseem clover. Irrig. Sci. 21, 173–181. doi: 10.1007/s00271-002-0061-3
Keywords: evapotranspiration, IoT, irrigation scheduling, lysimeter, water balance
Citation: Gupta A, Singh RK and Kumar M (2025) Advancing precision irrigation through an affordable IoT-enabled lysimeter for monitoring crop water requirements. Front. Sustain. Food Syst. 9:1677654. doi: 10.3389/fsufs.2025.1677654
Edited by:
Vijay Singh Meena, ICAR—Mahatma Gandhi Integrated Farming Research Institute, IndiaReviewed by:
Ghanshyam T. Patle, Central Agricultural University, IndiaParul Taneja, Indian Institute of Technology Guwahati, India
Copyright © 2025 Gupta, Singh and Kumar. This is an open-access article distributed under the terms of the Creative Commons Attribution License (CC BY). The use, distribution or reproduction in other forums is permitted, provided the original author(s) and the copyright owner(s) are credited and that the original publication in this journal is cited, in accordance with accepted academic practice. No use, distribution or reproduction is permitted which does not comply with these terms.
*Correspondence: R. K. Singh, cmtzaW5naGlpbnJnQGdtYWlsLmNvbQ==