 Siphe Zantsi
 Kayalethu Sotsha4
- 1Economic Analysis Unit, Agricultural Research Council, Pretoria, South Africa
- 2Department of Agriculture and Animal Health, University of South Africa, Pretoria, South Africa
- 3Department of Agricultural Science, Nelson Mandela University, Gqeberha, South Africa
- 4National Agricultural Marketing Council, Pretoria, South Africa
- 5Agri-metrics Unit, Agricultural Research Council, Pretoria, South Africa
Introduction: South Africa’s market-based land reform has long been criticised for its slow pace, partly due to concerns about limited budgets, alleged inflated land prices, and the acquisition of low-potential land. Yet, despite these claims, no national study has systematically examined land prices paid under the Proactive Land Acquisition Strategy (PLAS).
Methods: This study analyses trends in land prices for 1,989 PLAS farms purchased between 2005 and 2018—representing 89% of all PLAS acquisitions and compares these prices with open-market agricultural land values. Using descriptive statistics and an Ordinary Least Squares regression model, we identify key determinants of land prices and assess whether PLAS transactions exhibit signs of market distortion or opportunistic pricing.
Results and Discussion: Results show that 1.67 million hectares were acquired at an average cost of R5,984 per hectare, substantially lower than both privately purchased land by black farmers and national open-market averages. Prices vary widely across provinces and enterprise types, with irrigated and high-value enterprises such as table grapes costing significantly more than extensive grazing land. Regression results indicate that farm size, location, access to water rights, and extension services significantly influence prices, whereas distance to markets and farmer characteristics play a smaller role. The comparison with open-market transactions shows that PLAS land is consistently cheaper, suggesting that the state largely purchases lower-value land rather than overpaying for it. These findings indicate no national evidence of systematic price inflation but highlight structural market inefficiencies and resource constraints that shape acquisition outcomes. Policy implications include adopting standardised valuation frameworks, prioritising high-potential land, and aligning acquisition with spatial planning to strengthen long-term farm viability.
1 Introduction
Unjust colonial policies in many Global South countries have necessitated land reform initiatives following their attainment of political independence. In South Africa, such policies include the notorious 1913 Land Act, which entrenched racially discriminatory land ownership patterns. Lipton (2009, 124) defines land reform as “legislation intended and likely to directly redistribute ownership of, claims on, or rights to current farmland, and thus to benefit the poor by raising their absolute and relative status, power, and/or income, compared with likely situations without the legislation”.
In South Africa, the framework for land reform is outlined in the 1997 White Paper on Land Policy, which defines and guides the implementation of land reform [Department of Land Affairs (DLA), 1997]. According to the White Paper, land reform comprises three key components: land restitution, which seeks to restore land forcibly taken from its original owners; land tenure reform, which aims to secure the land rights of farmworkers and residents of former homelands; and land redistribution, the focus of this study, which addresses the racially skewed land ownership pattern created by colonial and apartheid policies, favouring the white minority.
Nearly three decades have passed since the implementation of the land redistribution policy. However, progress has been widely regarded as disappointing by various stakeholders. On multiple occasions (1999 and 2014), the government failed to meet its target of redistributing 30% of commercial agricultural land from white to black farmers (Mahlati et al., 2019). Moreover, many redistributed farms have experienced significant declines in productivity, with some ceasing production entirely. Recent studies estimate that only about 10% of land has been redistributed through this policy, and merely 7% of those farms operate at optimal capacity (Sihlobo and Kirsten, 2021; Verschoor et al., 2023).
The literature identifies several interrelated factors behind this underperformance. Poor beneficiary selection—where individuals with limited or no farming experience are chosen—has been flagged as a key issue (Zantsi and Greyling, 2021). This is further exacerbated by the lack of timely, well-coordinated, and high-quality post-settlement support (Zantsi, 2023). Additionally, critics argue that the government’s failure to provide beneficiaries with title deeds restricts their ability to use the land as collateral to access finance, especially given the limited land reform budget (Aliber, 2019).
Analysts note that land reform receives only approximately 0.1% of the national budget, despite the significant costs associated with farm acquisition and post-settlement support (Aliber, 2019). Recent evidence indicates that approximately R2 million is needed to acquire land and support a single beneficiary over an eight-year period (Zantsi et al., 2025). This financial burden is further compounded by corruption, including the inflation of land prices in some transactions, which increases costs and slows down redistribution efforts. However, no national study has systematically examined the extent of land price inflation in land reform. Previous research, such as a district-level study in KwaZulu-Natal, found insufficient evidence of inflated prices (Mbatha et al., 2010), yet recent reports highlight serious corruption in land reform processes (Mtero et al., 2023).
The objective of this study is to systematically analyse the prices paid for farms acquired under the Proactive Land Acquisition Strategy (PLAS), compare these prices with open-market agricultural land values, and identify the farm-level and spatial factors that drive variations in PLAS land prices. In doing so, the study seeks to determine whether PLAS acquisitions reflect market distortions or opportunistic pricing, and to assess the extent to which land characteristics such as enterprise type, water rights, location, farm size, and access to support services influence acquisition costs. Ultimately, the study aims to generate evidence to inform more efficient, transparent, and productivity-oriented land acquisition strategies for land reform.
Using a dataset of nearly 2,000 PLAS farms acquired between 2005 and 2018—representing 98% of all such acquisitions during this period—this research is the first of its kind to examine national land acquisition costs over such a prolonged period. Identifying unusual disparities in land prices could enhance policy efficiency and redirect resources to other critical components of land redistribution. Additionally, a clearer understanding of land acquisition costs can inform future planning and help meet the 2030 targets outlined in the National Development Plan [National Planning Commission (NPC), 2012].
The remainder of the article is structured as follows. Section 2 reviews the literature on land reform implementation, agricultural land valuation, and the functioning of land markets in South Africa. Section 3 presents the theoretical framework, drawing on the theories of price determination, market failure, and opportunistic behaviour to explain how land values may diverge under market-led redistribution. Section 4 describes the data sources, sampling approach, and analytical methods, including the OLS model used to identify determinants of PLAS land prices. Section 5 reports the empirical findings, beginning with descriptive trends in land acquisition and price variation, followed by regression results and a comparison between PLAS and open-market transactions. Section 6 discusses the implications of these findings in relation to theory and policy. Finally, Section 7 concludes by summarising key insights, identifying limitations, and suggesting directions for future research.
2 Literature review
2.1 How is land redistribution implemented, and how is it affected by land prices?
South Africa’s land reform policy is market-based under the “willing seller, willing buyer” (WBWS) principle. This means that land transactions occur voluntarily between the buyer and seller, with the state not forcing anyone to sell. Land redistribution involves a process where the state purchases land on the market and leases it to “suitable” beneficiaries using the willing seller–willing buyer principle. Beneficiaries also have to apply for post-settlement support from the National Department of Agriculture under the Comprehensive Agricultural Support Programme.
Numerous land redistribution policies have been implemented in various forms since the inception of South Africa’s land reform programme in 1994: the Settlement Land Acquisition Grant (SLAG) of 1997–2000, the Land Reform for Agricultural Development (LRAD) of 2001–2010, the Proactive Land Acquisition Strategy (PLAS) of 2006 (introduced after LRAD was phased out) and the State Land Lease and Disposal Policy (SLLDP) of 2013, the most recent (Zantsi and Greyling, 2021). Lately, all these subprogrammes have been integrated into PLAS.
Under the Proactive Land Acquisition Strategy (PLAS), the idea is to acquire land that appears suitable and strategic for redistribution (Aliber et al., 2018). A national study (DRDLR, 2015) showed that there were substantial differences between provinces in the implementation of the programme. However, a survey of 850 land redistribution beneficiaries in the Eastern Cape, KwaZulu Natal and Mpumalanga found that the process was broadly similar in those provinces (Dawood, 2018).
Typically, the Department of Rural Development and Land Reform made offers to commercial farmers to purchase their land, but land could also be purchased if requested by beneficiaries through a formal application process. It also happens that commercial farmers approach suitable beneficiaries and advise them to approach the Department of Agriculture to purchase their farms as part of land redistribution. Lahiff (2005) argued that sometimes commercial farmers sell land to the government for land reform as an exit strategy, especially farmers who are in financial distress, hoping to exploit the state for more money to start over. This is arguably where the opportunity for inflating prices allegedly arises.
This is a contentious issue, and it is important to understand the different perspectives and factors involved. The Ministry of Agriculture and Land Affairs’ preliminary review of the redistribution programme in December 1999 claimed that marginal land [is] being bought at exorbitant prices, turning white landowners into instant millionaires (Aliber and Mokoena, 2002). Arenstein and Groenewald (2004) reported an investigation by an independent property valuer who found that the prices for fourteen vegetable and dairy farms in Mpumalanga were inflated by 300% more than market value.
Some argue that commercial farmers, particularly those in areas targeted for land reform, are strategically inflating land prices to make it more difficult for the government and emerging farmers to acquire land (Aliber and Mokoena, 2002). The stated motivation from commercial farmers to collude not to sell to the government of black farmers is a desire to maintain control over land resources or to maximise profits before the land is transferred.
Others argue that land prices are generally determined by market forces and that artificially inflating prices is not a widespread phenomenon (Obi, 2006; Mbatha et al., 2010). They also point to the fact that land prices are already relatively high in South Africa due to factors such as high demand, scarcity, and the development of infrastructure.
2.2 Agricultural land value and factors affecting it
Before we delve into land valuation, we need to first understand the difference between land market value and land agricultural value. Market value includes external, speculative, and policy-driven factors, while agricultural value is based purely on the land’s farming income potential. When market value exceeds agricultural value, land may be overvalued for farming purposes. This makes it harder for farmers to finance purchases based on the land’s income. A large gap complicates land reform and new farmer entry, while a smaller gap (as observed post-1984) improves affordability and loan repayment potential (Van Schalkwyk and Van Zyl, 1993).
At the dawn of democracy, Van Schalkwyk and Van Zyl (1993) investigated the hypothesis that agricultural land in South Africa was overvalued. They concluded that while South African land was historically overvalued due to policy and inflationary effects, the 1980s marked a shift. They found that increased productivity and reduced state intervention led to a closing of the gap between market and agricultural value. In their view at the time, this was a positive implication for land reform, farm financing, and investment decisions.
The average price of a hectare of agricultural land in South Africa can vary significantly depending on location and land type. Generally, high-potential arable land can range from R40,000 to R50,000 per hectare, while Karoo grazing land can be around R2,000 per hectare. Irrigated farms can fetch between R150,000 and R200,000 per hectare (Western Cape Department of Agriculture, 2024). Furthermore, smaller farms are more expensive compared to larger farms (Aliber and Mokoena, 2002). There are numerous accounts for this relationship. First, the fact that very small properties tend to be for residential purposes, as well as the fact that among true farm properties, larger farms tend to be of lower quality land, for example, extensive grazing land rather than arable land—think about the Karoo, for instance.
Obi (2006) employed cointegration analysis and an error correction model to investigate both long-run and short-run relationships between real agricultural land prices and macroeconomic variables over a 49-year period (1955–2003). He found that positive determinants of farmland prices include:
• Real GDP per capita: Strong positive correlation. As income rises, demand for land increases.
• Real farm debt per hectare: Positive effect, suggesting that greater borrowing supports higher land investment and prices.
• Real net farm income: Also significantly positive, confirming that land values are supported by agricultural profitability.
• Real exchange rate: Positive and significant; a depreciating Rand increases competitiveness and land value.
However, there was no strong evidence that land transfers to black farmers under land reform significantly influenced national land price trends in the study period.
But how are the agricultural land prices determined? Middelberg (2014) identifies valuation methods used by South African financiers to assess agricultural land used as collateral. The study identified several methods. The first is the market value approach, which is the most used method. This is usually based on comparable sales of nearby land. However, it is limited by the lack of reliable government statistics on land transactions (relying instead on deeds offices and private data services). In this method, financiers choose from various ways to apply market valuation. These include income capitalisation (i.e., productive value). It is the most preferred approach by financiers focused on income potential. It is based on a discounted cash flow model, which uses a 5-year average net farm income, long-term interest rates, and agricultural risk premium as the discount rate (typically 12.5–16%). It is standardised across agro-ecological zones, not farm-specific. However, this approach yields a more conservative (lower) valuation than the market approach. The other market value method approach is the cost approach. It is rarely used, as it often overstates value. It is rather used as an upper limit or check. However, Middelberg (2014) noted that there was no uniformity among financiers in how they apply valuation methods.
3 Theoretical framework
Based on the reviewed literature and relevant economic principles, we anchor our analysis in three interrelated theoretical lenses: the theory of price determination, market failure, and opportunistic behaviour. In a market-led land reform system such as South Africa’s, one would expect land prices to be efficiently determined through competitive interactions between buyers and sellers. However, evidence suggests that this is not the case. Instead, significant distortions, information asymmetries, and structural constraints limit the ability of the land market to function efficiently. These features give rise to market failure, where the land required for redistribution is either not made available, not competitively priced, or is of lower quality than what is traded in the open market. The literature further indicates that such failures may be amplified by alleged distortions within the land market, including selective land offerings, uneven access to information, and strategic behaviour by sellers. Together, these theoretical perspectives help to explain the divergence between idealised market functioning and the empirical patterns observed in South Africa’s land reform transactions.
3.1 Theory of price determination
The theory of price determination refers to the economic principles that explain how the price of a good or service is established in a market. It is primarily rooted in microeconomic theory, especially the laws of supply and demand.
In our case of agricultural land, as learned from previous studies, for example, Obi (2006), demand for land is driven by:
• Expected future returns from agriculture.
• Non-agricultural uses (e.g., urban development).
• Macroeconomic conditions (e.g., interest rates, GDP).
• Land’s value as an inflation hedge or store of wealth.
While, supply of land is generally inelastic (fixed in quantity), especially in the short term. This rigidity amplifies price effects from demand changes.
3.2 Market failure
Market failure occurs when the allocation of resources by a free market is inefficient, meaning that the supply and demand for goods and services are not in balance, leading to an inefficient distribution. This can happen for various reasons, including the existence of public goods, externalities, imperfect information, or incomplete markets. There are significant signs of market failure in South Africa’s land reform, particularly within the willing seller–willing buyer approach. This approach, which relies on the existing land market, has been criticised for several reasons, leading to slow progress and disappointing results.
For example, Lahiff (2007, p. 1591) concluded that ‘Land reform transactions depart considerably from ‘normal’ market transactions, and appear to be concentrated on less sought-after land that is purchased at prices higher than it might fetch on the open market. The bureaucratic complexity of the grant-making process ensures that intended beneficiaries are not able to compete in the ‘real’ market, but rather operate in a parallel market dominated by state officials, where beneficiaries have little influence over the purchase negotiations or the price paid.
3.2.1 Opportunistic behaviour
Opportunistic behaviour refers to actions taken by individuals or organisations that are self-interested, strategic, and often unethical, especially when they exploit information asymmetries, loopholes, or trust to gain an advantage—typically at the expense of others (Williamson, 1985). This occurs when the actor pursues their own interest knowingly at the cost of others. For example, landowners anticipating government purchase through land reform programmes inflate prices or offload marginal, unproductive land. Sometimes it involves lying, withholding information, reneging on agreements, or exploiting weaker parties. In other instances, where all possible future actions or contingencies cannot be specified, opportunism can emerge.
4 Data and methods
4.1 Study area and data
The present study draws its data from a project that was commissioned by the Department of Agriculture, Forestry, and Fisheries on Proactive Land Acquisition Strategy (PLAS) beneficiaries across the country. Interviews were conducted with a total of 1989 beneficiaries, as shown in Table 1. To arrive at this sample, a comprehensive list of all PLAS beneficiaries was obtained from the Department of Agriculture, Land Reform, and Rural Development. Every PLAS farm was visited to engage with the beneficiaries. The 1989 sample represents 89% of the total number of PLAS farms purchased nationally between 2005 and 2018. Beneficiaries were selected based on their availability during the interview visits. This cross-sectional study utilised a questionnaire, which was administered face-to-face by trained enumerators to capture the data from PLAS beneficiaries in 2018.

Table 1. Distribution of PLAS farm beneficiaries interviewed per province.
This is one of the largest datasets for PLAS farms in the country. It consists of many variables.
4.2 Analytical methods
To analyse the trend in price paid for PLAS farms, we used summary statistics to calculate and report minimum, maximum, mean, and standard deviation. The empirical model to explain factors affecting the amount of PLAS land prices paid, we estimated the Ordinary Least Squares (OLS) linear regression. The mathematical representation of the OLS is shown in Equation 1.
where εi is the error term, and α, β are the true (but unobserved) parameters of the regression. The parameter β represents the variation of the dependent variable (Land price (R/ha), computed as total acquisition cost divided by farm size) when the independent variable has a unitary variation. In addition, the X represents a set of independent or explanatory variables (summarised in Table 2). Our empirical model, based on OLS regression, primarily uses farm-level and transaction-specific variables such as farm size, location, water rights, and extension access. These variables align with the theoretical framework as proxies for broader constructs. For instance, farm size and water rights reflect supply and demand dynamics under the price determination theory, while acquisition year captures temporal price trends linked to inflation and market expectations. Distance to market and extension access indicate imperfect information and infrastructure constraints, consistent with market failure theory. Regional effects and enterprise type may signal opportunistic behaviour, where sellers in high-value areas exploit information asymmetries to inflate prices. Furthermore, while these proxies provide partial alignment, we acknowledge the absence of macroeconomic and behavioural variables (e.g., interest rates, GDP growth, and seller distress indicators) that would allow a more rigorous test of the theories. Future research should integrate these variables to strengthen the theoretical–empirical link.

Table 2. Selection of variables, measurements, and expected influence on price paid for land in PLAS farms.
OLS regression assumes certain conditions, and therefore, it is recommended that the data meet the conditions to provide accurate predictions (Wooldridge, 2013). Similarly, in this study, checks for the primary assumptions were done prior to the implementation of the model. First, the sample was randomly chosen, and multi-collinearity and heteroscedasticity checks between predictors were done. No perfect collinearity and significant heteroscedasticity were detected, as shown in Table 3.

Table 3. Variance inflation factor (VIF) test for variables used in the OLS model.
5 Results and discussion
5.1 Summary of variables used in the regression analysis
This section provides a descriptive analysis of land acquisition (cost and size), beneficiaries’ age, farming experience, major operating enterprise, and distance to market. In some cases, the analyses are compared by province. Table 4 summarises the continuous variables. The results show that a typical PLAS beneficiary is 53 years old and has 21 years of farming experience. The respective standard deviations of 12.01 and 12.93 indicate that the data points are centred on the mean values.

Table 4. Summary statistics for continuous variables.
In addition, between 2005 and 2018, a total of 167 million hectares were acquired for R10.02 billion. This suggests that, on average, 1.67 million hectares of PLAS farms were acquired between 2005 and 2018 for R5 984.50 per hectare. This is lower than the privately purchased land of R7357/ha by black farmers in one Eastern Cape region reported by Beinart et al. (2024). It is also lower than the average price paid for all land transactions done in the country, which amounts to R16 462 (see Table 5). The Recap amount spent was R2.06 billion.
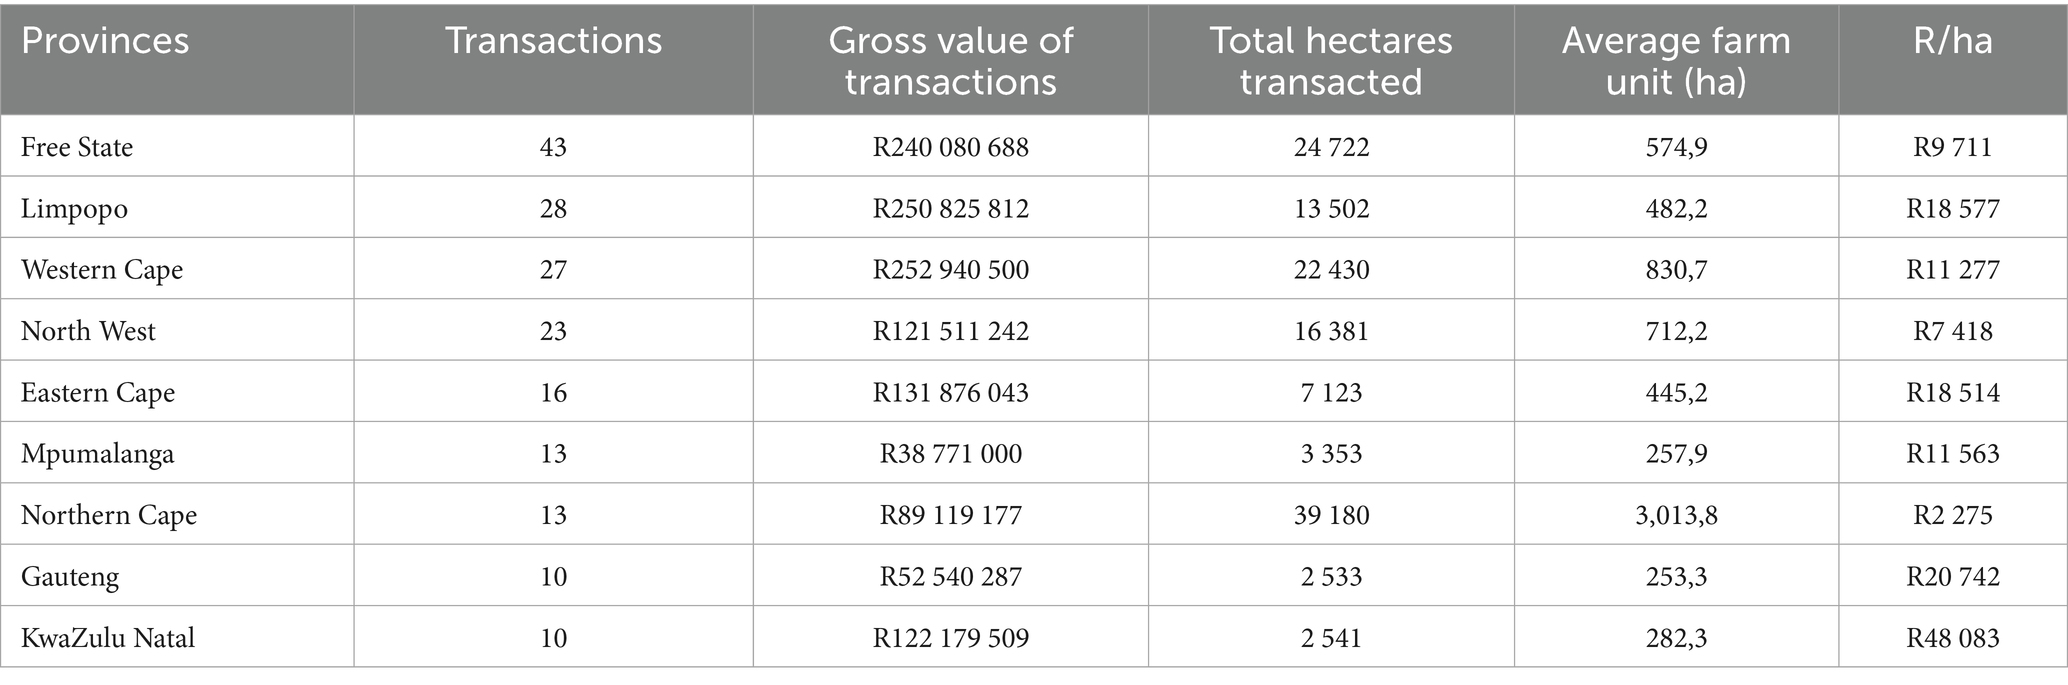
Table 5. Summary of land transactions and prices in South Africa (2024).
Figure 1 represents the average age distribution by province, indicating that a PLAS beneficiary from the Eastern Cape is 56 years older than beneficiaries from the other provinces. Beneficiaries from all provinces are 50 years or older, reflecting the sentiments of farmer organisations such as AgriSA, which estimated the average age of South African farmers to be 57 years old. Beneficiaries in the Northern Cape have the most years of farming experience on average, followed by KwaZulu-Natal and the Eastern Cape provinces. Beneficiaries from Gauteng had the fewest years of farming experience, followed by the Western Cape and Free State.

Figure 1. A comparison of the average age of beneficiaries and farming experience by province.
When comparing age and farming experience, it is apparent that beneficiaries from KwaZulu-Natal, Eastern Cape, and Northern Cape provinces begin farming activities at a younger age, resulting in a smaller difference between age and farming experience at 26 and 28, respectively. This could be attributed to the reliance on subsistence farming activities for a living in the KwaZulu-Natal and Eastern Cape provinces, whereas growing up on farms (commercial and small-scale) in the Northern Cape province could be a factor. The contrary applies in the Free State and Gauteng provinces, where beneficiaries have fewer years of farming experience on average compared to their age.
Figure 2 depicts the overall cost of land acquisition for PLAS farms and the land size for each year between 2005 and 2018. Notably, there were different levels of success or rate, with the most land acquired in 2011 (349,000 hectares), followed by 2010 (182,000 hectares) and 2008 (167,000 hectares). During these years, each hectare cost R5,510, R3.91 million, and R3.34 million, on average. There have been years of modest success, with fewer than 100,000 hectares acquired. These are: 2005 (7,000 hectares), 2006 (43,000 hectares), 2017 (48,000 hectares), and 2018 (35,000 hectares).

Figure 2. Cost and amount of land acquired from 2005 to 2028.
On average, each hectare costs R2,000, R6,209, R7,604, and R12,000. Notably, the cost of land was heavily determined by the purpose of acquisition, as well as other considerations such as location, climate, and inflation. For example, the average cost of land used to grow table grapes was R420,900, followed by crocodile breeding (R363,700), vegetables, and tourism (R353,800). On the other hand, land used for timber production, livestock, and field crops was acquired at a lesser price, averaging R7,200, R18,600, and R36,400, respectively.
Is the cost of acquiring land for land reform different from the cost of acquiring land from an ordinary buyer in the open market? We have pulled out secondary data and compared it with our own data set to address this question. Recent data on transactions of agricultural land is summarised in Table 5, showing that more sales in the agricultural land market occurred in the Free State, while KwaZulu Natal had the most expensive agricultural land sold in the period under review. However, this is aggregated land, not disaggregated by land type or purpose for transaction.
Table 6 shows that a total of 1768 farmland transactions took place across South Africa, covering 2.09 million hectares with a combined value of about R10 billion. Mpumalanga recorded the highest number of transactions, while the Northern Cape accounted for the largest area transacted. Average farm sizes vary widely—from only 276 ha in Gauteng to 4,745 ha in the Northern Cape—reflecting different production systems and land markets. Price per hectare also differs considerably, with Gauteng showing the highest value (R11 328/ha) and the Northern Cape the lowest (R1 353/ha). Overall, the national average stands at 1184 ha per farm unit and R4 789 per hectare, highlighting substantial provincial variation in land market dynamics.

Table 6. Summary of land transactions and price paid for land reform in South Africa.
Figure 3 shows a consistent price gap between land acquired through the PLAS (land reform) programme and land bought on the open market across all provinces. In every case, PLAS pays less per hectare than ordinary buyers, with the grey bars illustrating the size of this difference. The gap varies by province: it is smallest in the Northern Cape and North West, where overall land prices are low, and largest in KwaZulu-Natal, Gauteng, and the Eastern Cape, where open-market land values are significantly higher. Overall, the figure suggests that the government typically purchases lower-priced land for redistribution, either because it targets cheaper properties or because the kinds of farms available to PLAS differ from those traded in the open market.

Figure 3. Difference in price paid by the government for land and price paid by ordinary buyers in an open land market.
Figure 4 depicts the proportion of beneficiaries with water rights. Although not presented here, the Northern Cape had the largest share of acquired hectares (32%), followed by Mpumalanga (13%), Eastern Cape (13%), Free State (11%), North West (10%), KwaZulu-Natal (8%), Limpopo (5%), the Western Cape (5%), and Gauteng (3%). Less than 20% of beneficiaries have water rights across all provinces. Given this, the Eastern Cape has the highest proportion of beneficiaries with water rights (18.48%), followed by KwaZulu-Natal (16.30%) and the North West (16.58%). Gauteng, Limpopo, and the Northern Cape had lower proportions of beneficiaries with water rights, at 4.71 and 5.80%, respectively.

Figure 4. Proportion of beneficiaries who have water rights by province.
Figure 5 depicts the distance from the PLAS farms to the markets. This is based on markets supplied by farmers. The results show that the distance to the market is a minimum of zero, where farmgate sales are predominant, and can extend up to 250 kilometres away. Beneficiaries in the Northern Cape travel the longest distance to the market, an average of 115 kilometres, while the rest of the provinces travel 50 kilometres or less. The KwaZulu-Natal beneficiaries travel the shortest distance, 20 km. The distance to the market is significant since it affects logistical expenses when considering the kind of transportation used, roads, tolls, border crossings, travel permits, and so on. Together, these factors may have an impact on the quality of the produce as well as the costs incurred during transit, reducing the farm’s profitability.
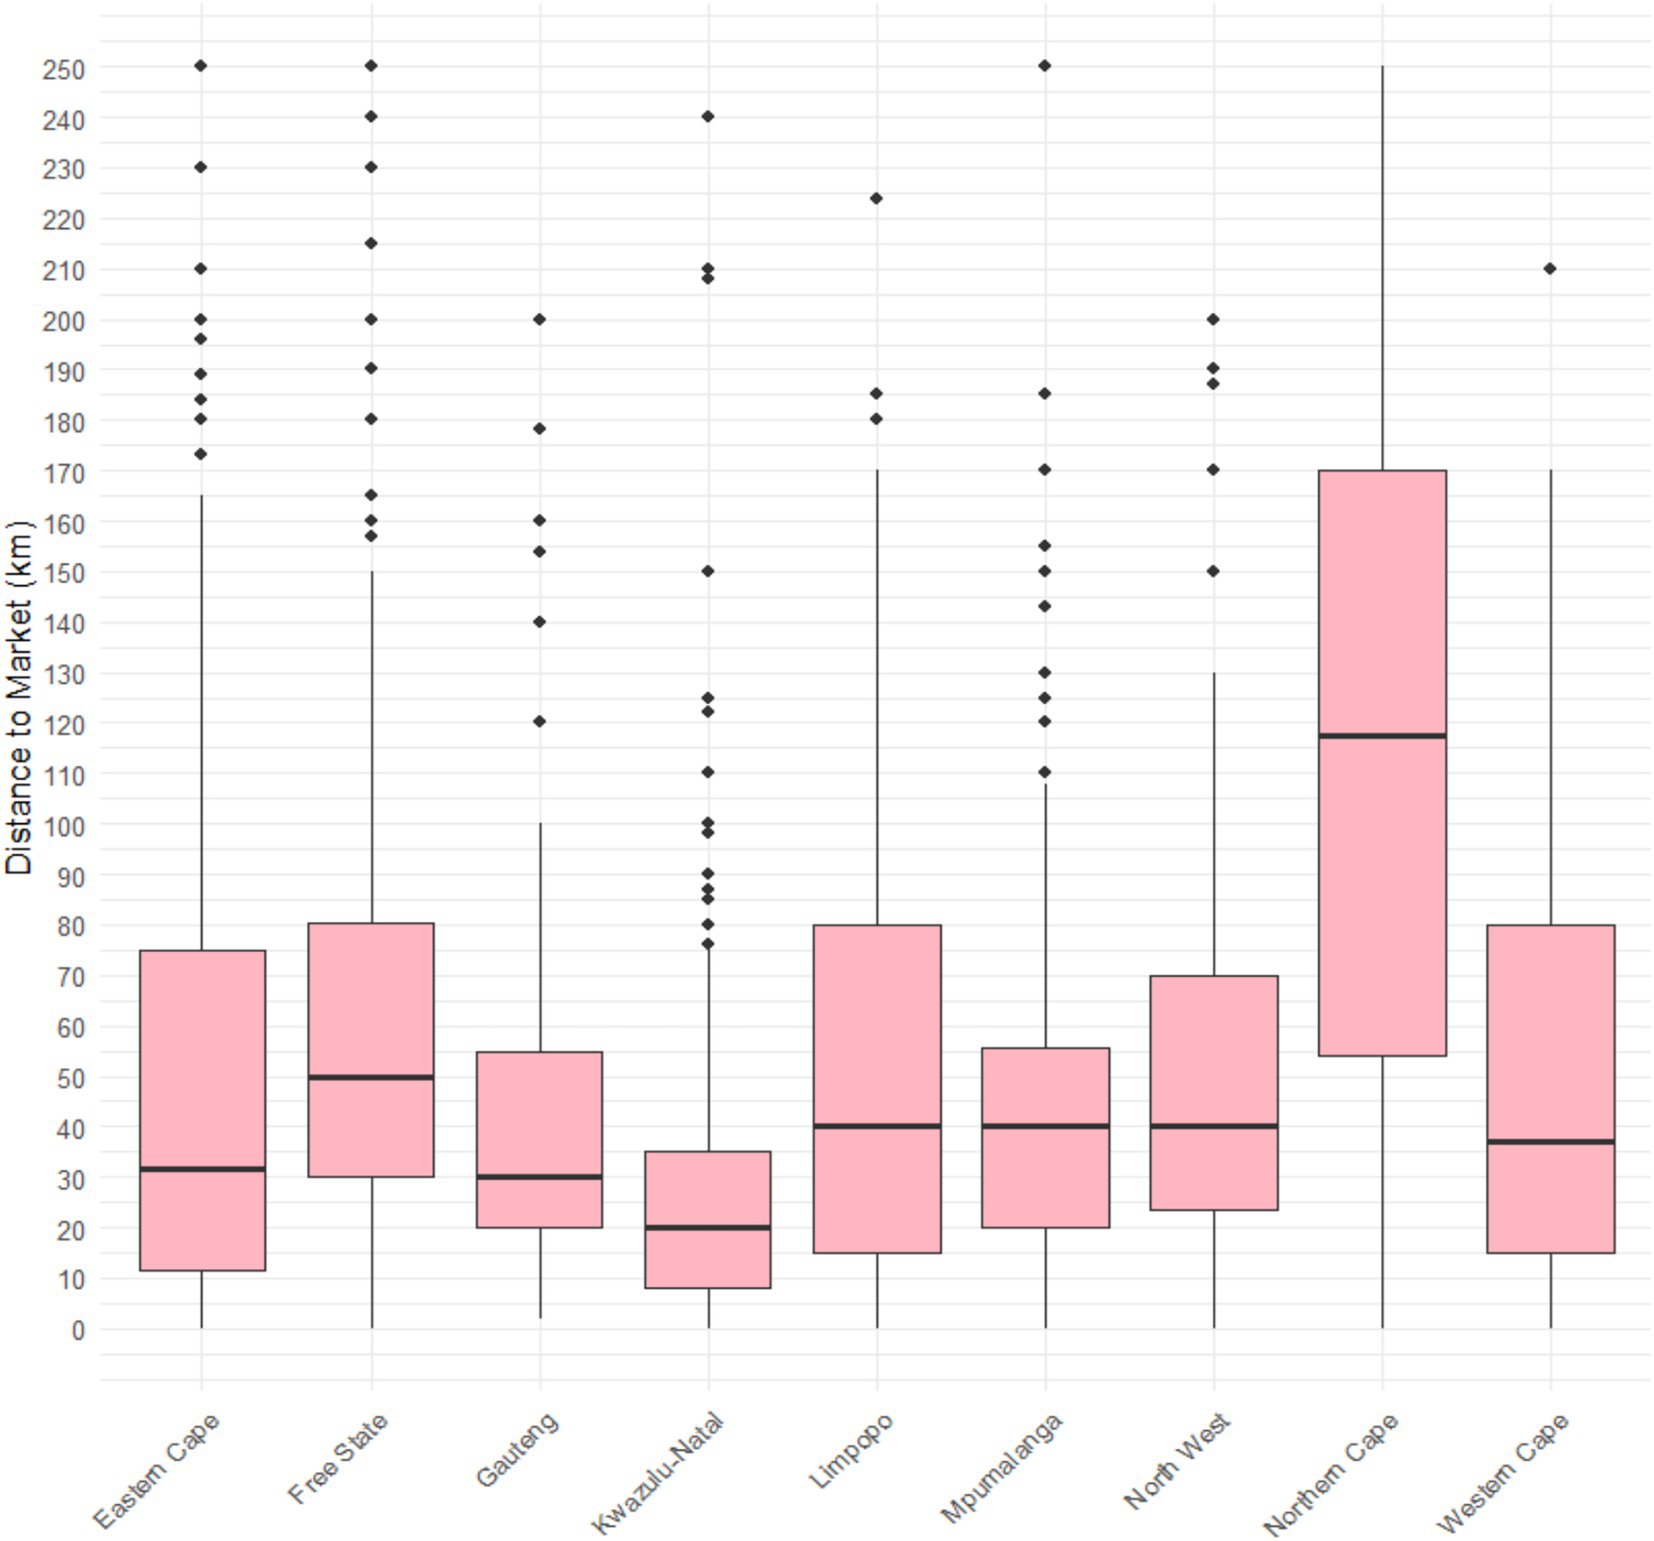
Figure 5. Average distance to the market of PLAS by province.
5.2 Factors influencing price paid for PLAS farms
Table 7 presents the results of our estimated OLS regression, which ascertains factors influencing the price paid for PLAS farms. Our OLS model was able to explain 30% variation in the data used in the estimation. As hypothesised and confirmed in the literature, many of the variables used in our OLS model showed statistically significant influence on the price paid for PLAS farms.

Table 7. OLS regression results for estimated factors influencing price paid for PLAS farms.
Such statistically significant variables include the year in which a given PLAS farm was acquired, where a positive correlation was observed. This suggests that the impact of land value is influenced by time. As previous studies have shown, agricultural land has gained value over time due to the growing demand and importance of the sector.
Farm size emerged as a statistically significant determinant of the price paid for PLAS farms, with larger farms generally attracting higher acquisition costs. While this relationship does not hold uniformly across all land types, it is consistent with the predominance of mixed and livestock enterprises in the PLAS portfolio, where extensive production systems naturally require larger tracts of land. Although the enterprise type was not statistically significant, its positive coefficient suggests that more intensive or higher-value enterprises tend to be associated with higher land prices, a relationship that could be explored further with more detailed land-quality data.
The positive and significant effect of access to extension services is more difficult to interpret, given that land acquisition occurs before beneficiaries take over management. This association may reflect underlying factors correlated with extension presence—such as better-developed agricultural regions or farms with stronger existing production potential—rather than the effect of extension support itself. Location, by contrast, exerts a clear and direct influence on land value. This is expected, as agro-ecological potential, rainfall patterns, soil quality, and proximity to high-value markets differ markedly across regions, for example, Stellenbosch wine farms command higher prices than extensive grazing land in the Northern Cape. Similarly, farms with irrigable land and valid water rights—critical for more intensive agriculture—fetch significantly higher prices, a trend accurately captured by the model.
Among variables with negative coefficients, neither age nor farming experience shows statistical significance, although the direction is consistent with broader literature suggesting that inexperienced or younger farmers may be associated with lower-value or less commercially oriented farms (Zantsi and Greyling, 2021). Distance to markets displays the expected negative relationship: farms located farther from formal markets tend to be cheaper, reflecting their higher logistical costs and lower commercial viability. This aligns with evidence from Verschoor et al. (2023), who found that remoteness reduces farm income and undermines the sustainability of land reform enterprises.
6 Discussion: linking findings to theory and policy implications
The comparative analysis of PLAS acquisition prices and open-market land transactions provides important insights into how South Africa’s land market operates and how these dynamics influence the performance of market-led land reform. The consistent finding that land acquired under PLAS is substantially cheaper than land bought by ordinary buyers aligns with the theory of price determination, which holds that land value reflects both its productive potential and broader market conditions. In this case, the lower PLAS price points suggest that the government tends to purchase land of lower quality, less strategic location, or reduced productive capacity—either intentionally, in order to stretch limited budgets, or because the state is offered land that private buyers do not demand. The regression results further reinforce this theoretical linkage: variables such as farm size, location, presence of water rights, and access to extension services are all significant determinants of price, demonstrating that land with more favourable productive attributes attracts higher valuation, consistent with the theory’s supply-and-demand expectations.
The findings also speak directly to market failure, particularly as it relates to South Africa’s willing-buyer, willing-seller approach. If PLAS farms are consistently cheaper, this indicates that the government is operating in a segmented or “second-tier” market characterised by poorer land quality, asymmetrical information, or distorted incentives. The limited availability of irrigable land (with <20% of beneficiaries holding water rights) and the long distances to markets in some provinces point to structural constraints that reduce farm viability but remain invisible in headline price statistics. This echoes Lahiff’s (2007) argument that land reform transactions often occur outside the true competitive market and that beneficiaries rarely influence price-setting. The fact that PLAS farms far from markets and with limited water infrastructure dominate the dataset suggests that the supply of suitable land remains highly constrained—an outcome consistent with incomplete markets, imperfect information, and public-good characteristics associated with land reform.
Furthermore, the price gaps observed across provinces resonate with the theory of opportunistic behaviour. While the study finds no systemic evidence of inflated prices at a national level, significant provincial variation in the price gap—especially in KwaZulu-Natal, Gauteng, and the Eastern Cape—suggests contexts in which sellers may exploit information asymmetries or state urgency to offload low-potential or distressed properties. The fact that the state is sometimes approached directly by landowners further increases the risk of strategic behaviour, consistent with Williamson’s (1985) conception of opportunism. Although prices paid appear generally lower than market averages, the risk lies not in overpayment but in the state purchasing underperforming or marginal land that undermines long-term livelihood outcomes.
6.1 Policy implications
These findings have direct implications for the design, budgeting, and governance of South Africa’s land redistribution programme. First, the strong influence of location, water rights, and farm size on price signals the need for spatially differentiated budgets that reflect provincial land markets more accurately. A single national benchmark price is inappropriate for a market characterised by wide heterogeneity. Second, the consistent price gap between PLAS and open-market purchases indicates that the state must prioritise land with demonstrable productive potential—particularly irrigable land and land closer to markets—if the goal is to secure viable and self-sustaining farming enterprises. This may require shifting from a quantity-driven approach (hectares acquired) to a quality-driven approach (productive value acquired).
Third, the evidence highlights the urgent need for standardised valuation frameworks and transparent appraisal systems, especially in provinces with large observed price differences. Clear, uniform valuation standards would mitigate opportunistic pricing and reduce the unevenness of land quality currently entering the PLAS portfolio. Fourth, the low prevalence of water rights and long distances to markets underscore the importance of integrating acquisition decisions with infrastructure and resource availability, reinforcing the need for closer alignment between land reform and broader spatial planning frameworks.
Finally, the findings bolster arguments for improved beneficiary selection and post-settlement support, as the productivity and value of redistributed land are deeply influenced by farming experience and access to extension services—both of which also affect land values. By strengthening these complementary systems, the state can better translate land acquisition into sustainable agricultural livelihoods, helping to meet redistributive targets without compromising long-term viability.
7 Conclusion and recommendations
South Africa’s market-led land redistribution has been widely criticised for its slow progress, inefficient allocation, and potential distortion of agricultural markets. This study provides the first national-level empirical analysis of land prices paid under PLAS, offering robust evidence to inform a more sustainable and equitable land acquisition strategy. Our findings show that the state has generally acquired land at prices below prevailing open-market levels, indicating no systemic inflation of acquisition costs. Instead, the evidence suggests that PLAS purchases are concentrated in lower-value farming areas, often characterised by limited water rights, long distances to markets, and lower productive potential. This pattern confirms theoretical expectations associated with market failure—particularly incomplete markets and information asymmetries—and illustrates how price determination mechanisms systematically disadvantage land reform when competing with private buyers for high-quality farmland. Weak monitoring systems and fragmented land markets also create opportunities for opportunistic behaviour, particularly in provinces where price gaps fluctuate widely.
These findings underscore a critical sustainability challenge: current acquisition patterns risk reproducing spatial inequality and may undermine the long-term viability of redistributed farms. To address this, the land reform programme must shift from a hectare-driven approach to one centred on productive capacity, resource access, and spatial suitability. Standardised valuation methods, agro-ecological zoning tools, and transparent tender systems could strengthen market functioning and reduce distortions. Prioritising irrigable land, improving coordination between land acquisition and post-settlement support, and integrating land reform into provincial spatial development frameworks are key pathways to enhancing farm performance and livelihood outcomes.
By linking empirical evidence to established economic theory, this study contributes to debates on sustainable land governance and offers a replicable analytical framework for other countries pursuing market-based land redistribution. Future research should integrate detailed land-quality indicators, macroeconomic variables, and farm-level performance data to deepen understanding of how land acquisition influences long-term sustainability across agro-ecological regions.
Although this study is based on South Africa’s PLAS programme, the observed price determinants, farm size, location, water rights, and extension access, reflect broader economic principles applicable to market-based land reform contexts. Thus, the findings may be relevant for other countries pursuing similar approaches, provided adjustments are made for local agro-ecological and institutional conditions.
For policy implications, our results suggest that land reform budgets should account for spatial and resource-based price variations, and that acquisition strategies should prioritise land with productive potential (e.g., irrigable land) while balancing cost efficiency. Furthermore, the findings underscore the need for transparent valuation standards and monitoring mechanisms to reduce opportunistic pricing and market distortions. These insights can inform national land reform policy and guide other countries implementing market-based redistribution programmes.
The limitations of the study are the absence of detailed land quality and fragmentation indicators, which may introduce omitted variable bias. A key limitation of the OLS approach in this study is the potential influence of unobserved land quality differences that are not captured in the available dataset. Although the model includes variables such as farm size, location, water rights, and enterprise type, several important attributes of land—such as soil fertility, historical management practices, micro-climate variation, infrastructural condition, and long-term productivity potential—remain unmeasured. These unobserved characteristics may systematically influence both the price of land and the location in which certain types of land are transacted, thereby introducing omitted variable bias into the regression estimates. Future research should integrate agro-ecological data and spatial fragmentation measures to improve explanatory power and robustness. Furthermore, while our model incorporates proxies for theoretical constructs, future research should integrate macroeconomic and behavioural variables to more rigorously test price determination, market failure, and opportunistic behaviour theories.
Data availability statement
The raw data supporting the conclusions of this article will be made available by the authors, without undue reservation.
Ethics statement
The requirement of ethical approval was waived by National Department of Agriculture, South Africa for the studies involving humans because this was a commissioned survey by the South African National Department of Agriculture. The studies were conducted in accordance with the local legislation and institutional requirements. Written informed consent for participation was not required from the participants or the participants' legal guardians/next of kin because the survey was for public policy review. Written informed consent was obtained from the individual(s) for the publication of any potentially identifiable images or data included in this article.
Author contributions
SZ: Writing – original draft. KS: Formal analysis, Writing – review & editing. WS: Writing – review & editing, Methodology. A-JV: Writing – review & editing, Data curation.
Funding
The author(s) declared that financial support was not received for this work and/or its publication.
Conflict of interest
The author(s) declared that this work was conducted in the absence of any commercial or financial relationships that could be construed as a potential conflict of interest.
The author SZ declared that they were an editorial board member of Frontiers, at the time of submission. This had no impact on the peer review process and the final decision.
Generative AI statement
The author(s) declared that Generative AI was not used in the creation of this manuscript.
Any alternative text (alt text) provided alongside figures in this article has been generated by Frontiers with the support of artificial intelligence and reasonable efforts have been made to ensure accuracy, including review by the authors wherever possible. If you identify any issues, please contact us.
Publisher’s note
All claims expressed in this article are solely those of the authors and do not necessarily represent those of their affiliated organizations, or those of the publisher, the editors and the reviewers. Any product that may be evaluated in this article, or claim that may be made by its manufacturer, is not guaranteed or endorsed by the publisher.
References
Aliber, M. (2019). How can we promote a range of livelihood opportunities through land redistribution? Cape Town: Institute for Poverty, Land and Agrarian Studies (PLAAS), University of the Western Cape.
Aliber, M, and Mokoena, R. (2002). The interaction between the land redistribution programme and the land market in South Africa: a perspective on the willing-buyer/willing-seller approach. Programme for Land and Agrarian Studies, School of Government, University of the Western Cape, Cape Town.
Aliber, M., Mabhera, S., and Chikwanha, T. (2018). Agrarian reform and rural development. Alice: University of Fort Hare Press.
Arenstein, A, and Groenewald, Y (2004). High price for land reform. Mail & Guardian. Available online at: https://mg.co.za/article/2004-09-10-high-price-for-land-reform (Accessed 1 June 2019).
Beinart, W., Kenyon, M., Mnwana, S., and Wotshela, L. (2024). The expansion of African private land ownership in Isidenge, Stutterheim, eastern cape 1994–2024. S. Afr. Hist. J. 76, 356–377. doi: 10.1080/02582473.2024.2447714
Dawood, G. 2018. The National Land Reform Programme and rural development. Report for submission to the Division of Revenue. Available online at: https://www.ffc.co.za/docman-menu-item/commission-submissions/1140-2017-2018-tr-chapter-3-thenational-land-reform-programme-and-rural-development
Department of Land Affairs (DLA) (1997). White paper on south African land policy. Pretoria: Government Printer.
Department of Rural Development and Land Reform (DRDLR) (2015). Implementation evaluation of proactive land acquisition strategy (PLAS). Pretoria: DRDLR.
Lahiff, E. (2005). Land reform in the eastern cape: the ongoing struggle for resources and secure rights. Soc. Dyn. 31, 39–58. doi: 10.1080/02533950508628695
Lahiff, E. (2007). “Willing buyer, willing seller”: South Africa’s failed experiment in market-led agrarian reform. Third World Q. 28, 1577–1597.
Lipton, M. (2009). Land reform in developing countries: Property rights and property wrongs. London: Routledge.
Mahlati, V., Hall, R., Karaan, M., Kriek, D., Mabasa, B., Moagi, T., et al. (2019). Final report of the presidential advisory panel on land reform and agriculture. Pretoria: Government Printer.
Mbatha, N. C., Antrobus, G. G., and van Rooyen, J. (2010). Land price premiums in South Africa’s land redistribution process: a case study of northern KwaZulu-Natal sugarcane farms. Agrekon 49, 235–254. doi: 10.1080/03031853.2010.491298
Middelberg, S. L. (2014). Agricultural land valuation methods used by financiers: the case of South Africa. Agrekon 53, 101–115. doi: 10.1080/03031853.2014.922033
Mtero, F., Gumede, N., and Ramantsima, K. (2023). Elite capture in South Africa’s land redistribution: the convergence of policy bias, corrupt practices and class dynamics. J. South. Afr. Stud. 49, 5–24. doi: 10.1080/03057070.2023.2187969
National Planning Commission (NPC) (2012). National Development Plan 2030: An integrated and inclusive rural economy. Pretoria: Presidency of South Africa.
Obi, A. (2006). Trends in south African agricultural land prices. Bloemfontein: University of the Free State, Department of Agricultural Economics.
Van Schalkwyk, H. D., and Van Zyl, J. (1993). The South African land market: An analysis of land prices. Unpublished Research Report, Pretoria: University of Pretoria.
Sihlobo, W., and Kirsten, J. (2021). “Agriculture in South Africa” in The Oxford handbook of the south African economy. eds. A. Oqubay, F. Tregenna, and I. Valodia (Oxford: Oxford University Press), 195–216.
Verschoor, A. J., Gandidzanwa, C., Newby, T., Collett, A., and Venter, S. (2023). Proposing a farm assessment toolkit: evaluating a south African land reform case study. Agrekon 62, 215–227. doi: 10.1080/03031853.2023.2279159,
Western Cape Department of Agriculture. 2024. Agricultural land transaction in South Africa. Stellenbosch.
Williamson, O. E. (1985). The economic institutions of capitalism: Firms, markets, relational contracting. New York: Macmillan.
Wooldridge, J. M. (2013). Introductory econometrics: A modern approach. 5th Edn. Boston: South-Western Cengage Learning.
Zantsi, S. (2023). Land beneficiaries need support: reform process fails to fill this development gap. New Agenda S. Afr. J. Soc. Econ. Policy 90, 30–32.
Zantsi, S., and Greyling, J. C. (2021). Land redistribution in South Africa’s land reform policy: a better way to select beneficiaries. Agrekon 60, 108–127. doi: 10.1080/03031853.2021.1906286
Keywords: land reform, PLAs, land prices, South Africa, valuation, policy implications
Citation: Zantsi S, Sotsha K, Shiba W and Verschoor A-J (2025) Trends in land prices paid for farms redistributed under the proactive land acquisition strategy in South Africa (2005–2018). Front. Sustain. Food Syst. 9:1682797. doi: 10.3389/fsufs.2025.1682797
Edited by:
Bao Tran Le, Ho Chi Minh City International University, VietnamReviewed by:
Velibor Spalevic, University of Montenegro, MontenegroXiaoyu Sun, Hubei University of Technology, China
Copyright © 2025 Zantsi, Sotsha, Shiba and Verschoor. This is an open-access article distributed under the terms of the Creative Commons Attribution License (CC BY). The use, distribution or reproduction in other forums is permitted, provided the original author(s) and the copyright owner(s) are credited and that the original publication in this journal is cited, in accordance with accepted academic practice. No use, distribution or reproduction is permitted which does not comply with these terms.
*Correspondence: Siphe Zantsi, WmFudHNpU0BhcmMuYWdyaWMuemE=