 Lei Zhang1
 Na Wang
 Jingyi Nie
- 1School of Economics, Shandong Women’s University, Jinan, China
- 2School of Economics, Beijing Technology and Business University, Beijing, China
- 3Business School, Ludong University, Yantai, China
The spatial mismatch between food consumption and water-land resources affects food security and the sustainable use of water–land resources in China. The circulation of vegetables between provinces has alleviated the supply pressure of national vegetable basket products to some extent, but its impact on water–land resources requires further research. Therefore, based on the optimal consumer utility concept of the CHINAGRO model, with the goal of minimizing freight costs, a simulation study was conducted on the circulation of vegetables between provinces in China from 2020 to 2022 using linear optimization methods. Additionally, the concepts of “virtual water” and “virtual land” were utilized to estimate the implied circulation of water–land resources in the inter-provincial vegetable circulation and to explore its impact on the country’s water–land resources. The results show that: (1) China’s vegetable production can generally meet the domestic demand, but there is a huge difference between supply and demand among provinces, and more than half of the provinces have vegetable shortages; (2) The circulation of vegetables accounted for 27.43% of the national vegetable production, showing obvious regional circulation characteristics. (3) In terms of water and land resources, the water resources implied in vegetable circulation accounted for 19.66% of the total water resources required for vegetable production in China, and the land resources accounted for 18.76%. Although the circulation of vegetables has alleviated the problem of land resource mismatch and improved the efficiency of land resource use to a certain extent, it has also led to the decline of water resource use efficiency in China. This study can provide important theoretical basis for the cultivation and transportation of vegetables between regions, as well as the comprehensive regulation and optimization of water and land resource utilization. At the same time, it can provide decision-making reference for the country to promote the sustainable transformation and development of the agricultural food system, improve the utilization rate of water and land resources, and formulate agricultural product planning and layout policies.
1 Introduction
Vegetables are essential non-staple foods for urban and rural residents. Since the reform and opening up, with the continuous improvement of China’s agricultural development level and residents’ living standards, China has become a major producer and consumer of vegetables. The demand for diversified and nutritious vegetable consumption among residents has been growing steadily. Currently, the planting area of vegetables accounts for more than 13% of China’s total crop planting area, second only to grain crops, making vegetables the most promising economic crop with significant development potential. According to statistics, China’s vegetable production accounts for approximately 60% of global output, solidifying its position as the world’s largest vegetable producer. At the same time, with the increasing regionalization and specialization of vegetable cultivation, the domestic vegetable market has gradually matured (Wu and Mu, 2016). The formation of spatiotemporal patterns in advantageous production regions across the country facilitates variety complementarity, staggered marketing, and interregional coordination, alleviating imbalances between production and sales areas. This ensures the supply of vegetables in the national market, increases farmers’ income, and guides the vegetable industry toward high-quality development.
Water and land resources are the most fundamental and critical material production factors for agricultural development, directly impacting national agricultural growth and food security. China is a large agricultural country with a massive population but also faces severe shortages of water and arable land resources. According to the latest data, China’s total water resources in 2024 reached 3,112.3 billion cubic meters, ranking sixth globally. However, the per capita water availability is only 2,340 cubic meters, less than a quarter of the world average and approaching the international water scarcity alert level (1,700 m3). By the end of 2023, China’s total arable land area was 128.6088 million hectares (approximately 1.929 billion mu), with a per capita arable land area of 1.37 mu—less than one-third of the global average (4.8 mu per capita) and ranking 126th in the world. With the acceleration of industrialization and urbanization, the conflict between the growing demand for water and land resources and their scarcity and limited availability has become increasingly acute. Issues such as regional disparities in agricultural economic development, irrational allocation of water and land resources, and competition for resources among various sectors are becoming more prominent. It is imperative to emphasize the rational use of water and land resources and adopt efficient and sustainable management measures for their matching in agriculture (Yang et al., 2022; Caro et al., 2021).
As one of the most important agricultural products, vegetables are typical resource-intensive products, requiring substantial inputs of agricultural land and water resources. A joint survey by China Agricultural University and the Beijing Agricultural Technology Extension Station revealed that the average irrigation water use for vegetables is 2.9 times that of grain crops, 6.5 times that of legumes, and 5.4 times that of forage grass. How to utilize limited water and land resources to ensure national vegetable supply security while achieving coordinated socio-economic development has become a hot topic in China’s sustainable development research. Interprovincial vegetable trade breaks the resource constraints of domestic vegetable production, facilitating the flow of virtual water and land resources across provinces. Water- and land-scarce provinces importing vegetables from resource-abundant provinces is equivalent to importing resources such as land and water. Interprovincial vegetable trade also enables the flow of virtual resources, alleviating resource shortages (Cai, 2024), thereby allowing for a reallocation of the spatial distribution of vegetable cultivation. Therefore, from the perspective of virtual resource flows, studying the impact of interprovincial vegetable trade on China’s water and land resources is of great significance for better ensuring national vegetable supply security, efficient resource utilization, and sustainable socio-economic development. This study aims to explore the virtual water-land resource flows embedded in China’s interprovincial vegetable circulation and their impacts. The core research questions are: (1) What is the pattern of interprovincial vegetable circulation in China? (2) How does this circulation affect the utilization of water and land resources at the national and regional levels? (3) What policy insights can be derived from these findings to support sustainable agricultural and food systems?”
Scholars have achieved substantial results in studying the impacts of agricultural-product circulation on water and land resources. At present, most research is based on the perspective of virtual resource flows, using the concepts of “water footprint” and “land footprint” to explore the movement of “virtual water” and “virtual land” in agricultural-product circulation. The concept of virtual water was proposed by British scholar Allan (1993), initially defined as the volume of water required during the production of an agricultural product, and later extended to mean the water resources needed in the production of any good or service. He subsequently introduced the concept of virtual water trade, a new mode of water-resource flow that emerges as goods or services are traded between countries or regions (Allan and Mallat, 1996; Duarte et al., 2019). Building on virtual water, Hoekstra and Hung (2002) proposed the concept of the water footprint, further developing and refining virtual water theory. Later, Falkenmark and Rockstrom (2006) introduced the concepts of blue water and green water, providing a new paradigm for water-resource planning and management.
In Cheng (2003) first introduced the virtual water concept into China, using the arid regions of northwest China as a case study to explore the significance of virtual water theory and strategy for China’s water management and security. After its introduction domestically, virtual water quickly attracted widespread attention from Chinese scholars. Drawing on the “virtual water” approach, both international and Chinese researchers proposed concepts such as “virtual land” and “virtual arable land,” defining them as “the amount of land resources required in the production of goods or services” (Luo et al., 2004; Liang and Zhu, 2019; Liu et al., 2020). Virtual land metrics not only quantitatively reflect the ecological spatial area implied by agricultural-product circulation or trade but also represent the actual land resources embodied in such circulation or trade, making the concept more accessible and acceptable to the public and policymakers (Guo et al., 2020).
A review of the existing literature reveals that scholars at home and abroad have mainly focused on the quantification of virtual water–land resources in agricultural-product trade (Hekmatnia et al., 2023; Han et al., 2023; Yu et al., 2021; Huang and Huang, 2016), their spatiotemporal variation (Vallino et al., 2021; Vanham et al., 2018; Rushforth and Ruddell, 2018; Ali et al., 2017), and driving factors (Shen et al., 2024; Tian et al., 2023; Tamea et al., 2014; Han and Sun, 2013). Commodity studies cover grains (Ben et al., 2016; Zhang et al., 2018; Cao, 2024; Hekmatnia et al., 2024), cotton (Zhao et al., 2009; Wang et al., 2018), soybeans (Wang et al., 2011), oilseeds, and vegetables (Hu and Tong, 2018), among others. The environmental effects of virtual water–land resources (Zhuo et al., 2016; Mayer et al., 2016; Wang et al., 2023; Mekonnen et al., 2024) and their economic impacts (Tuninetti et al., 2016; Amini et al., 2025), as well as policies for managing virtual water and arable-land resources (Searchinger et al., 2018; Streimikis and Baležentis, 2020; Motoshita et al., 2023), have also received ample attention. The interregional circulation or import–export trade of virtual water–land resources can alleviate China’s water and land-resource pressures and provide a new pathway to mitigate shortages; however, virtual water–land strategies cannot fundamentally resolve all resource-shortage problems, and their practical implementation is very complex, being influenced by many factors (Cao, 2024). When formulating policies for cross-regional agricultural circulation or import–substitution trade, deliberately importing or substituting products with high virtual water–land content while encouraging the export of products with low virtual water–land content can not only ease tensions in China’s human-land and human-water relationships but also achieve both food security and optimal economic benefits (Wang et al., 2023).
In summary, existing research has largely focused on patterns of virtual water–land flows in grain circulation, with in-depth analyses of the virtual water-land flow modes and their impacts on resources, the environment, and the economy in grain import–export trade and interprovincial grain circulation. However, studies on water and land-resource utilization issues arising from vegetable circulation directions and interprovincial vegetable flows are relatively scarce. Therefore, to better investigate China’s interprovincial vegetable circulation and its impacts on water and land resources, this paper—building on existing studies—comprehensively considers the supply and demand of vegetables across China’s 31 provincial-level regions (excluding Hong Kong, Macau, and Taiwan). It employs a linear optimization model of optimal freight to estimate interprovincial vegetable circulation volumes, explores the current status and characteristics of interprovincial vegetable flows in China, uses the “virtual water” and “virtual land” methods to calculate the embedded water–land resources, and, from the perspective of virtual-resource flows, examines the impacts of vegetable circulation on China’s water and land resources, with the aim of providing references for better ensuring vegetable supply security and sustainable water–land resource use in China.
2 Data sources and research methods
2.1 Data description and sources
This paper selects vegetables from the statistical yearbook as the subject of analysis, using the lowest transportation costs between China’s 31 mainland provincial-level administrative regions as derived from comprehensive analyses, which include various modes of transportation such as rail, road, and waterway (Gao et al., 2014). Vegetable production data are sourced from the “China Agricultural Statistical Yearbook 2021–2023,” and consumption data from the “China Statistical Yearbook 2021–2023.” Data for 2021 are chosen as the time cross-section, and to minimize biases caused by the volatility of vegetable trade, the average values from 2020 to 2022 are used.
There are issues with the consistency of statistical measures and data distortion in China’s vegetable production and consumption data, leading to significant discrepancies between reported production and consumption figures. The “China Statistical Yearbook” calculates vegetable consumption based on the number of vegetables directly purchased by households, omitting the quantities used for dining out, other production purposes, and other losses. This data is defined as the direct consumer demand for vegetables. Estimates from the “China Agricultural Statistical Yearbook” for 2020–2022 indicate that the per capital vegetable production was approximately 4.99, 5.06, and 5.10 times the consumption reported in the “China Statistical Yearbook.” The per capital vegetable consumption data used in this paper are calculated by multiplying the direct consumption from the yearbook by the ratio of net production (total vegetable output minus vegetable losses) to consumption, thereby accounting for the total vegetable demand including direct purchases, dining out, and use in other production.
Additionally, vegetables, being highly perishable fresh agricultural products, are prone to spoilage during circulation. The start of vegetable logistics in China was late, and the level of sophistication is relatively low, compounded by a shortage of professional logistics personnel specializing in vegetables. These factors result in high costs associated with vegetable circulation losses. In contrast to the 5% loss rate in vegetable logistics observed in other developed countries, China experiences a high loss rate of 25 to 30% during vegetable circulation (Xu et al., 2016) This paper adopts a fixed loss rate of 30% for conversions, drawing on the statistical methods and conclusions of previous research (Chi et al., 2022). The circulation and demand data mentioned in this paper refer to the net weight, adjusted for losses, considered from the demand side.
2.2 Research methods
2.2.1 Methods for estimating interprovincial vegetable flow volume
The circulation of vegetables is determined by various factors such as the supply and demand of vegetables, prices, and transportation costs. The decision support model for sustainable agricultural development in China (CHINAGRO model) is a spatial equilibrium model of China’s agriculture and a mathematical optimization model for maximizing consumer utility, so the CHINAGRO model can be used to simulate the inter-regional circulation of agricultural products by considering the constraints of production, trade, and resources (Yang et al., 2022; Hu et al., 2018; Gao et al., 2014). Therefore, this study is based on the idea that the highest consumer utility is the optimization goal in the CHINAGRO model, regardless of the differences in vegetable variety, quality and price between provinces, and takes the lowest transportation cost as the highest consumer utility, which is taken as the optimization goal, and comprehensively considers the supply and demand of vegetables in different provinces in China, and adopts the linear optimization method to simulate the circulation of vegetables in different provinces. In this model, the vegetables produced in each province are given priority to meet the consumption of the province, and if there is a surplus, they are shipped to other provinces, and vice versa, vegetables need to be transferred from other provinces.
China’s vegetable production exceeds the total national vegetable consumption, indicating that domestic vegetables can generally meet the country’s own demand. Therefore, this study will exclude import and export trade of vegetables to simulate inter-provincial trade flows of vegetables. Assuming that among the 31 provinces, municipalities, and autonomous regions, N provinces have vegetable shortages, the shortfall volume in these provinces can be considered as the demand from the other 31−N provinces, municipalities, and autonomous regions. In other words, the 31−N provinces with surplus vegetable supply serve as the sources of supply for the N provinces experiencing vegetable shortages. The specific linear optimization model is as follows:
the objective function is:
the constraints are:
In the Equation 1, F represents the transportation cost for inter-provincial vegetable trade, with the minimization of transportation costs as the objective function; denotes the quantity of vegetables transported from province j to province i, where i is a vegetable-deficient province and j is a vegetable-surplus province; N is the number of vegetable-deficient provinces, and 31−N is the number of vegetable-surplus provinces; is the unit transportation cost for vegetables transported from province j to province i; W is the unit transportation cost for vegetables; is the transportation distance from province j to province i; is the vegetable shortage volume in province i; and is the vegetable surplus volume in province j.
Equation 2 is the calculation formula for the unit transportation cost of vegetables between regions. Equation 3 indicates that the volume of vegetables transported from other provinces to a given province must equal the inflow restriction of the province’s shortage volume, ensuring that the vegetable demand of domestic vegetable-deficient provinces is met. Equation 4 specifies that the volume of vegetables transported from a province to other provinces must be less than or equal to the outflow restriction of the province’s surplus volume, ensuring that vegetable supply from surplus provinces remains within their own supply capacity. Equation 5 defines the sign restrictions for each variable.
This study employed Lingo 18.0 software to solve the aforementioned linear optimization model. The solution process was executed smoothly, with the software returning a “Global Optimal Solution Found” status message, confirming that the model successfully converged and obtained a globally optimal solution. The process involved a total of 118 iterations, and the final objective function value (minimizing total cost) was 5.2858 yuan. All constraints were satisfied. The obtained optimal interprovincial vegetable transfer volumes were subsequently used to determine the scale and direction of interprovincial vegetable trade in China. By incorporating the virtual water and virtual land content of vegetables, the patterns of virtual water and land resource flows resulting from interprovincial vegetable trade in China were ultimately derived.
By optimizing vegetable flows, the model indirectly determines the direction and scale of virtual water and land resource flows. Although the direct objective of the model is to minimize transportation costs, its solution reveals the most economically efficient interprovincial circulation pathways for vegetables under the existing production structure. This economic efficiency is largely coupled with resource efficiency. The circulation patterns simulated by the model objectively reflect an indirect optimization of water and land resource utilization achieved through market mechanisms (cost constraints). It demonstrates how minimizing economic costs indirectly leads to the minimization of water and land resource consumption. In practice, the purpose of this study is not to design a complex optimization model incorporating multiple policy objectives but to provide a clear baseline scenario that reveals the virtual resource flow patterns driven by current market forces. Our conclusions aim to illustrate how trade influences the patterns of water and land resource utilization rather than directly regulating and optimizing it.
2.2.2 Calculation method for virtual water trade in vegetables
Quantifying the virtual water required for vegetable production is fundamental to the study of virtual water. Currently, there are two primary methods for quantification: the product tree method proposed by Chapagain and Hoekstra (2003) and Hoekstra and Hung (2002), and the unit water usage method proposed by Zimmer and Renault (2003). This paper adopts the unit water usage method, which calculates the virtual water content by estimating the reference evapotranspiration ( ) of different agricultural products. The specific methods include the following steps:
2.2.2.1 Potential evapotranspiration
Potential evapotranspiration is the most critical parameter in calculating crop water requirements (Gong et al., 2007). This study uses the widely applied and FAO-recommended modified Penman–Monteith formula to perform these calculations. The formula is as follows:
In the Equation 6, represents the reference evapotranspiration (mm d−1); is the net radiation at the crop surface (MJ m−2); G is the land heat flux [MJ·(m2 d)−1]; T is the average air temperature (°C); is the wind speed at 2 m above the ground (m s−1); is the saturated vapor pressure (kPa); is the actual vapor pressure (kPa); ∆ is the slope of the vapor pressure curve (kPa °C−1); is the psychrometric constant (kPa °C−1). The meteorological data used in this paper are sourced from the China Meteorological Data Network1 and a meteorological website in Russia.2
2.2.2.2 Total amount of land moisture transpiration and evaporation
In the Equation 7, represents the total cumulative evapotranspiration during the actual growth period of the crop (mm d−1); is the crop coefficient, drawn from those recommended by the FAO. The crop coefficients used in this paper are calculated based on the weighted average of the yields of different crops.
2.2.2.3 Vegetable water requirement
In the Equation 8, represents the water requirement per unit area during the growth period of vegetables (m3 hm−2); 10 is the unit conversion factor that converts the unit from water depth (mm) to the volume of water per unit area (m3 hm−2).
2.2.2.4 Specific water demand
In the Equation 9, represents the virtual water content per unit mass of vegetables (m3 kg−1), and is the yield of vegetables per unit area (kg hm−2).
2.2.2.5 Total virtual water in relation to vegetable export volume
In the Equation 10, represents the total virtual water for vegetables, is identical to the variable in the linear optimization model, indicates the volume of vegetable circulation from province j to province i.
2.2.2.6 Calculation method for virtual land trade in vegetables
In the Equations 11–14, and represent the vegetable yield per unit of land in the producing province j (vegetable-surplus province) and the consuming province i (vegetable-deficient province), respectively; and denote the vegetable production in provinces i and j, respectively; and represent the vegetable planting area in provinces i and j, respectively; is identical to the variable defined above; and represent the virtual land transfer resulting from vegetable circulation as estimated from the producing province and the consuming province, respectively.
2.2.3 Research on the impact of vegetable circulation on water and land resources
In the Equations 15 and 16, and represent the difference in water resources and land resources required between the production province j and the consumption province i, respectively. and denote the water flows induced by vegetable circulation estimated from the perspective of the production province j and the consumption province i, respectively. and is identical to the variable defined above.
Based on the interprovincial vegetable trade volumes estimated by the CHINAGRO model, combined with the coefficients of virtual water and land resource consumption for vegetables, we derived the virtual water and land flows embedded in the interprovincial trade of vegetables. Here, the interprovincial vegetable flow ( ) is the core output of the linear programming model and serves directly as the input variable for the virtual water and land calculations. Therefore, the results presented hereafter reflect not only the scale and direction of interprovincial vegetable trade but also the spatial reallocation of agricultural water and land resources driven by such flows, highlighting regional disparities in resource use efficiency and potential environmental pressures. All variables in Equations 1–16 are listed in Table 1.
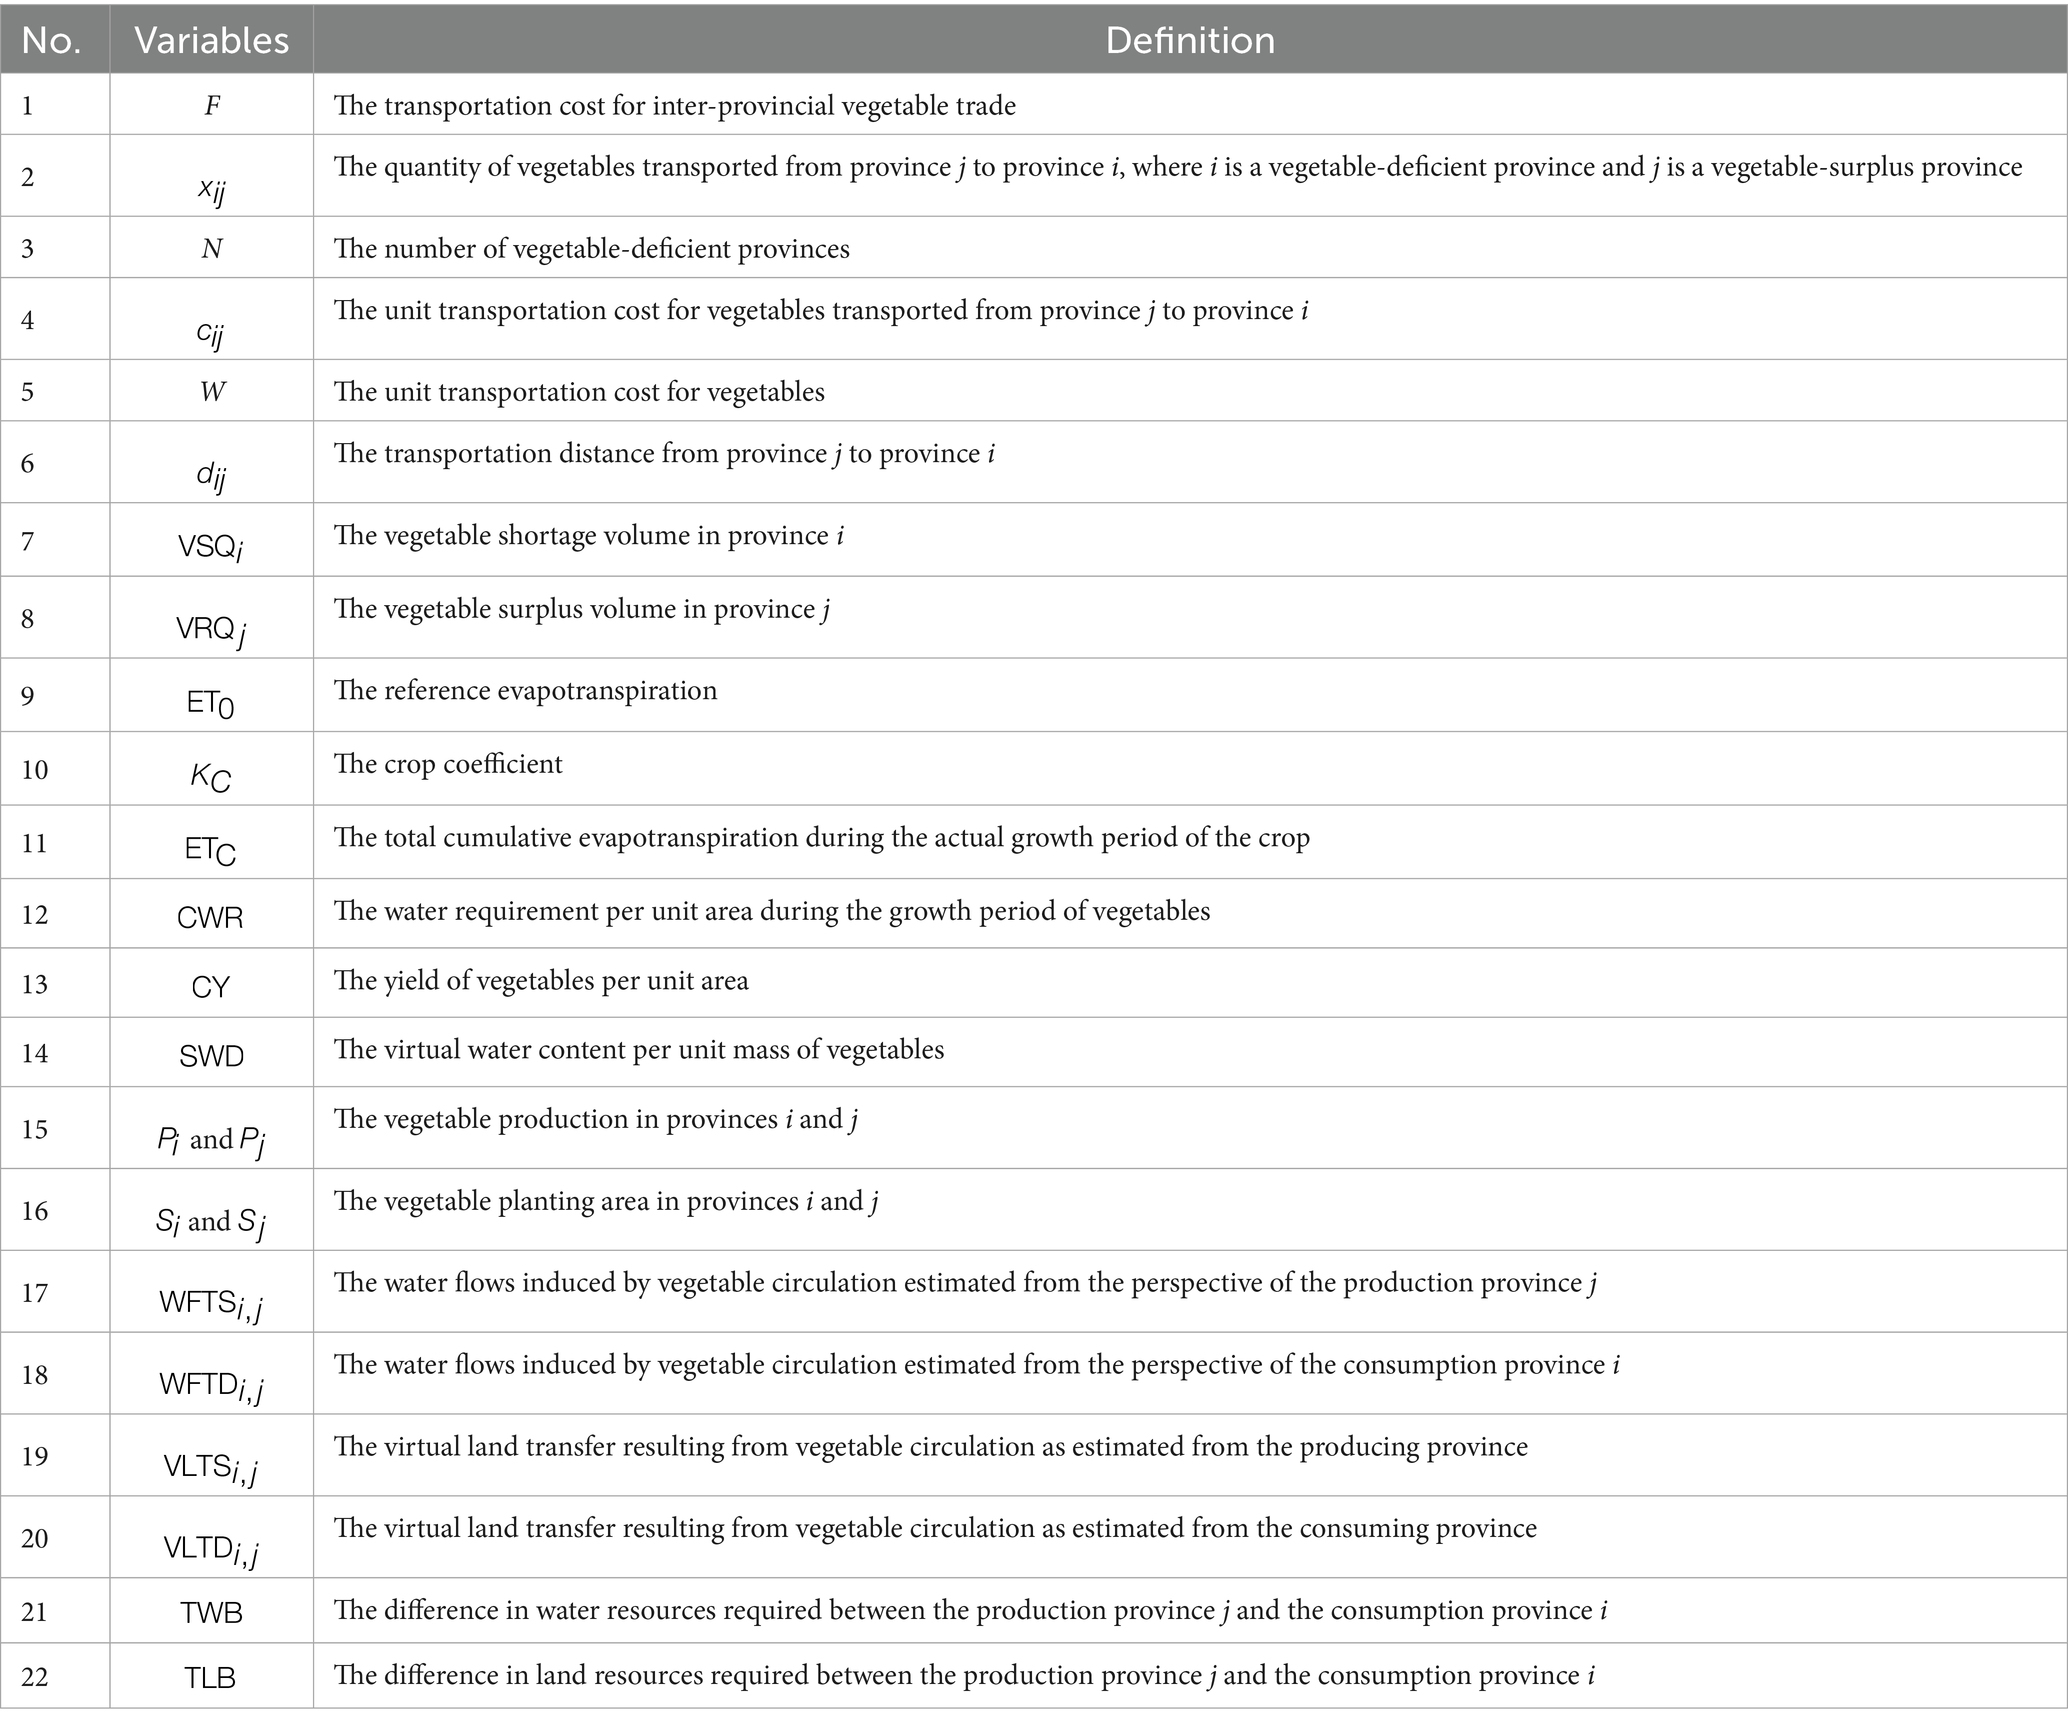
Table 1. Notation table.
2.3 Sensitivity analysis
To assess the robustness of our model results to the uncertainty of key input parameters, a one-at-a-time (OAT) sensitivity analysis was conducted. This analysis focused on two critical parameters: the vegetable circulation loss rate and the crop coefficient.
The baseline values of these parameters were perturbed by ±10%, which represent a plausible range of variation given regional disparities and data limitations. For each scenario, the national totals of virtual water flow (WFTS or WFTD) and virtual land flow (VLTS or VLTD) were recalculated while keeping all other parameters constant. The key findings of the sensitivity analysis are:
A ±10% change in the circulation loss rate led to a ∓10% change in WFTD (or WFTS) and a ∓10% change in VLTD (or VLTS). A ±10% change in the crop coefficient led to a ±10% change in WFTD, while VLTD remained unchanged (as expected, since VLTD is independent of water coefficients). More importantly, parameter variations did not alter the macro-level patterns and directions of interprovincial virtual water/land resource flows. The optimal transportation pathways determined by the optimization model—specifically, the core relationships defining “who transfers to whom”—remained unchanged.
We consider this outcome entirely reasonable and consistent with theoretical expectations. As described in “Section 2.2 Research Methods,” the circulation loss rate only affects the absolute magnitude of interprovincial vegetable trade volumes and does not influence the direction or pathways of such trade. Changes in vegetable trade volumes exhibit an inversely proportional relationship with the circulation loss rate, while virtual water/land resource quantities are directly proportional to vegetable trade volumes. Consequently, estimates of virtual water/land flows show a perfectly proportional, linear inverse response to changes in the circulation loss rate. Similarly, virtual water flows maintain a linear relationship with the crop coefficient, whereas virtual land flows are independent of the crop coefficient. Thus, changes in the crop coefficient only affect virtual water flow quantities and have no impact on virtual land flows.
The stability of flow directions and pathways strongly demonstrates that the core finding of our study—the virtual resource flow network—is highly robust. This indicates that while parameter uncertainty may affect the precision of absolute flow estimates, it does not undermine our fundamental conclusions regarding the main pathways, directions, and structural patterns of resource flows.
3 Analysis results
3.1 Analysis of vegetable circulation
3.1.1 Vegetable supply and demand
With the development of China’s economy and the improvement of residents’ living standards, both vegetable production and consumption have increased, with domestic production largely meeting national consumption needs. From 2020 to 2022, China’s vegetable production was 749 million tons, 775 million tons, and 799 million tons, respectively, showing a steady upward trend. The per capita vegetable consumption during the same period was 104.93 kg, 110.24 kg, and 108.63 kg, respectively. Over the past decade, national vegetable demand has generally shown an initial increase followed by stabilization, with an average annual compound growth rate of 1.76%, reflecting a growing demand for both the quantity and quality of vegetables among residents. Meanwhile, the gap in vegetable demand between urban and rural residents persists but is gradually narrowing. In 2015, the per capita vegetable consumption of urban residents was 100.2 kg, while that of rural residents was only 88.7 kg, amounting to 0.88 times the urban consumption. In 2020, the per capita vegetable consumption of urban residents was 105.4 kg, compared to 93.5 kg for rural residents, or 0.89 times the urban consumption. By 2022, urban residents consumed 110.9 kg of vegetables per capita, while rural residents consumed 104.6 kg, which is 94.31% of the urban consumption.
There are significant differences in vegetable production and consumption across China’s provinces. In terms of production, provinces with higher vegetable output are primarily located in the East China, Central China, and Southwest regions, accounting for 67.61% of the country’s total vegetable production, as shown in Figure 1. Among these, Shandong has the largest vegetable production, reaching 84.8 million tons. Shouguang and Shenxian in Shandong are key vegetable production bases in the country. Henan and Jiangsu also have substantial production. Sichuan is the province with the highest vegetable output in the Southwest region and is a critical national vegetable production area, particularly for the “South-to-North Vegetable Transport” and winter–spring vegetable production bases, with an output of 48.3 million tons. Qinghai has the lowest production, at only 837,000 tons. After years of development, China has established six major advantageous vegetable production regions: the winter–spring vegetable regions in the South China and Southwest heat zones, the winter–spring vegetable regions in the Yangtze River Basin, the summer–autumn vegetable regions in the Loess Plateau, the summer-autumn vegetable regions in the Yunnan-Guizhou Plateau, the summer-autumn vegetable regions in the high-latitude North, and the facility vegetable regions in the Huang-Huai-Hai and Bohai Rim areas. These six key regions ensure a continuous supply of vegetables throughout the year across the country, with overlapping production seasons and the use of methods such as the “South-to-North Vegetable Transport” and facility-grown vegetables.
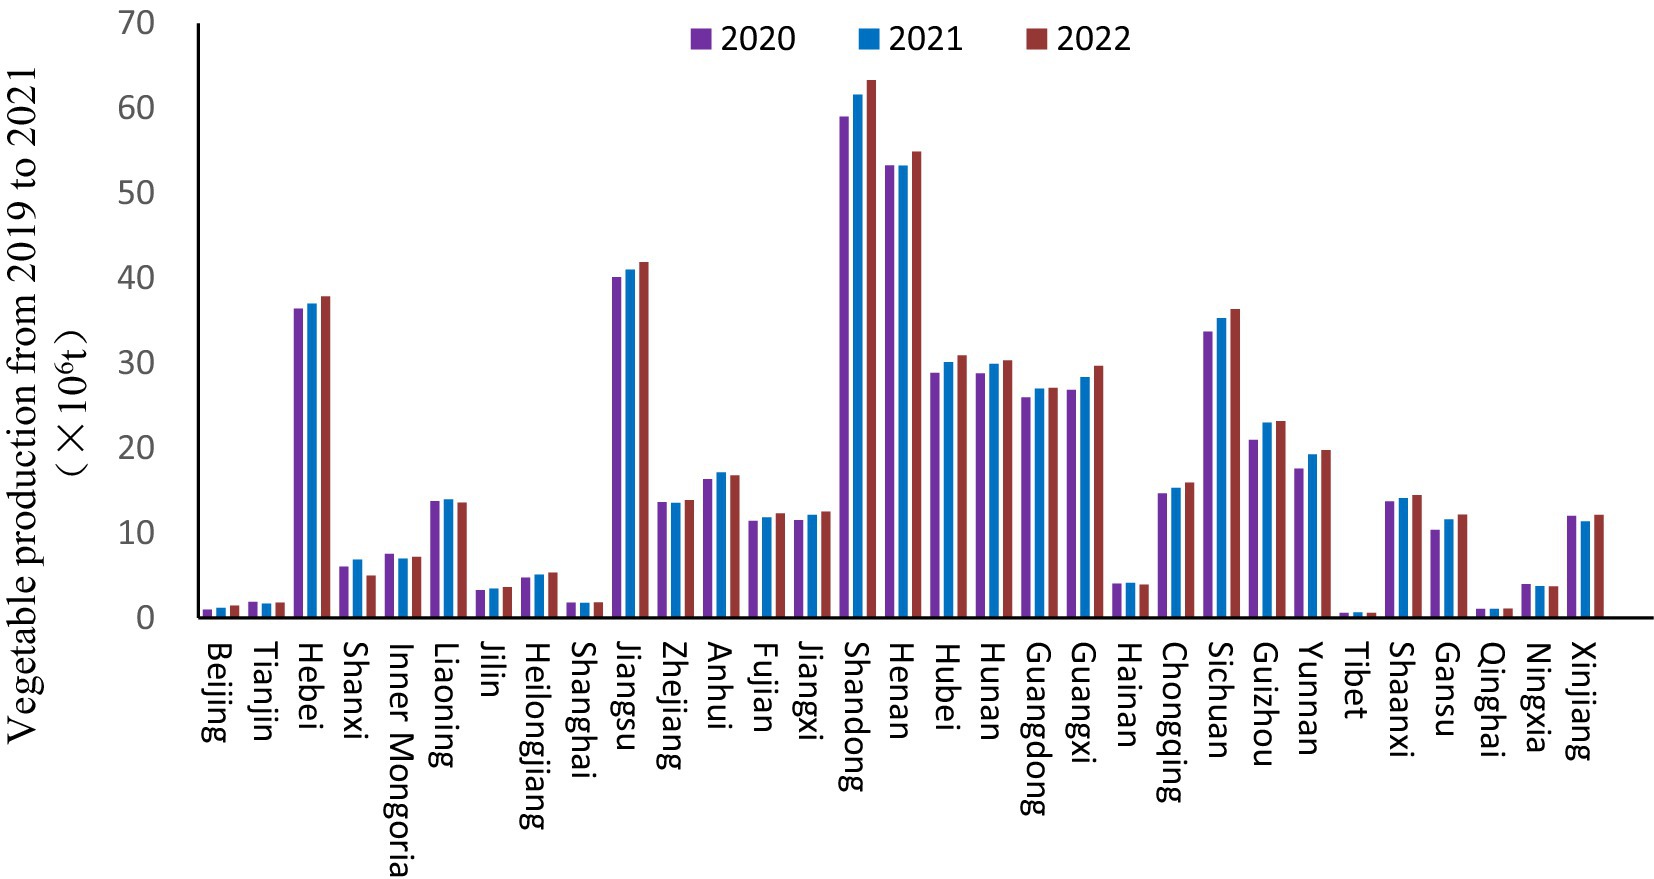
Figure 1. Vegetable production in various provinces of China in 2020–2022. Data source: China agricultural statistical yearbook 2021–2023, China statistical yearbook 2021–2023.
China’s vegetable planting area is approximately 21,444.63 thousand hectares, with a total vegetable production of 775 million tons. The distribution pattern of vegetable cultivation is largely established, with the East China region accounting for 29%, Central China for 21%, Southwest China for 17%, South China for 11%, North China for 10%, Northwest China for 8%, and Northeast China for 4%. In terms of planting area, the East China region has the largest vegetable planting area, covering 5,148.93 thousand hectares, followed by the North China, Central South, and Southwest regions. Among these, 10 provinces have a vegetable planting area exceeding one million hectares, with Guangdong having the largest area at 1.764 million hectares. Additionally, China’s average vegetable yield per unit area is 34.9 thousand tons per thousand hectares, with the highest yield per unit area found in the North China region, reaching 41.0 thousand tons per thousand hectares.
From the perspective of consumption, Guangdong has the highest vegetable consumption, reaching 46.7 million tons, which accounts for 8.63% of the total vegetable consumption in China. This is followed by Sichuan, Henan, and Jiangsu. Qinghai and Tibet have the lowest vegetable consumption, amounting to only 3.91% of Guangdong’s consumption. Additionally, Guangdong also has the highest per capita vegetable consumption, at 142.57 kg, while Guizhou has the lowest, at only 50.49 kg, which is 0.35 times that of Guangdong. The vegetable consumption in each province is closely related to the local population size, as well as factors such as economic development level and urbanization rate. By the end of 2021, Guangdong’s population was 127 million, making it the most densely populated region in the country, with an urbanization rate of 74.79%, leading to high vegetable consumption. Other provinces with high vegetable consumption, such as Sichuan, Shandong, and Henan, are also densely populated. Additionally, per capita vegetable consumption varies across provinces; in economically underdeveloped regions and areas with lower urbanization rates, per capita vegetable demand tends to be relatively lower.
China’s vegetable processing industry is increasingly becoming more sophisticated, with market supply and demand growing year by year, leading to the development of a relatively complete fruit and vegetable processing industry chain. The main types of processed vegetable products include frozen vegetables, dehydrated vegetables, pickled vegetables, fresh vegetables, vegetable juices, and canned vegetables. Currently, the vegetable processing industry across the country is making continuous progress, and industrial clusters are gradually emerging, such as the dried, canned, frozen, and pickled vegetable processing bases along the southeastern coast, and the tomato paste processing base in the northwest.
In terms of international trade, China’s vegetable exports amounted to 8.88 million tons, while imports were 323,000 tons, resulting in a vegetable trade surplus of 16.26 billion USD. The vegetable trade has the largest trade surplus among all agricultural product trades in China. Specialty vegetables occupy an important position in this trade. Specialty vegetables refer to a category of vegetables with distinct regional characteristics and prominent varietal features. Examples include processed ginger, scallions, and garlic from the Huang-Huai-Hai region, aquatic vegetables such as lotus root and wild rice stem from the Yangtze River Basin, and processed chili peppers from regions like Southwest China, Central China, and North China. Among the specialty vegetable export industries, garlic, onions, ginger, and dried chili peppers are the leading exports.
In half of China’s provinces, vegetable production is insufficient to meet local consumption needs, as shown in Figure 2, including regions such as Beijing, Shanghai, Guangdong, Heilongjiang, and Inner Mongolia. The reasons for this are varied: in economically developed areas like Beijing and Shanghai, land is highly utilized, and resources for vegetable cultivation are limited, resulting in a smaller proportion of land dedicated to vegetable farming. In provinces like Zhejiang and Guangdong, although vegetable production is relatively high, the large population leads to consumption far exceeding production, creating significant vegetable shortages. The three northeastern provinces, due to their location in the northern temperate zone, experience long winters, with only a few months suitable for vegetable cultivation each year. In regions such as Qinghai and Inner Mongolia, where livestock farming predominates, the area dedicated to vegetable cultivation is limited. Other regions, such as Shanxi, Jiangxi, and Tibet, also face low vegetable self-sufficiency due to the lack of suitable land, temperatures, and other natural resources, making them more reliant on imported vegetables.
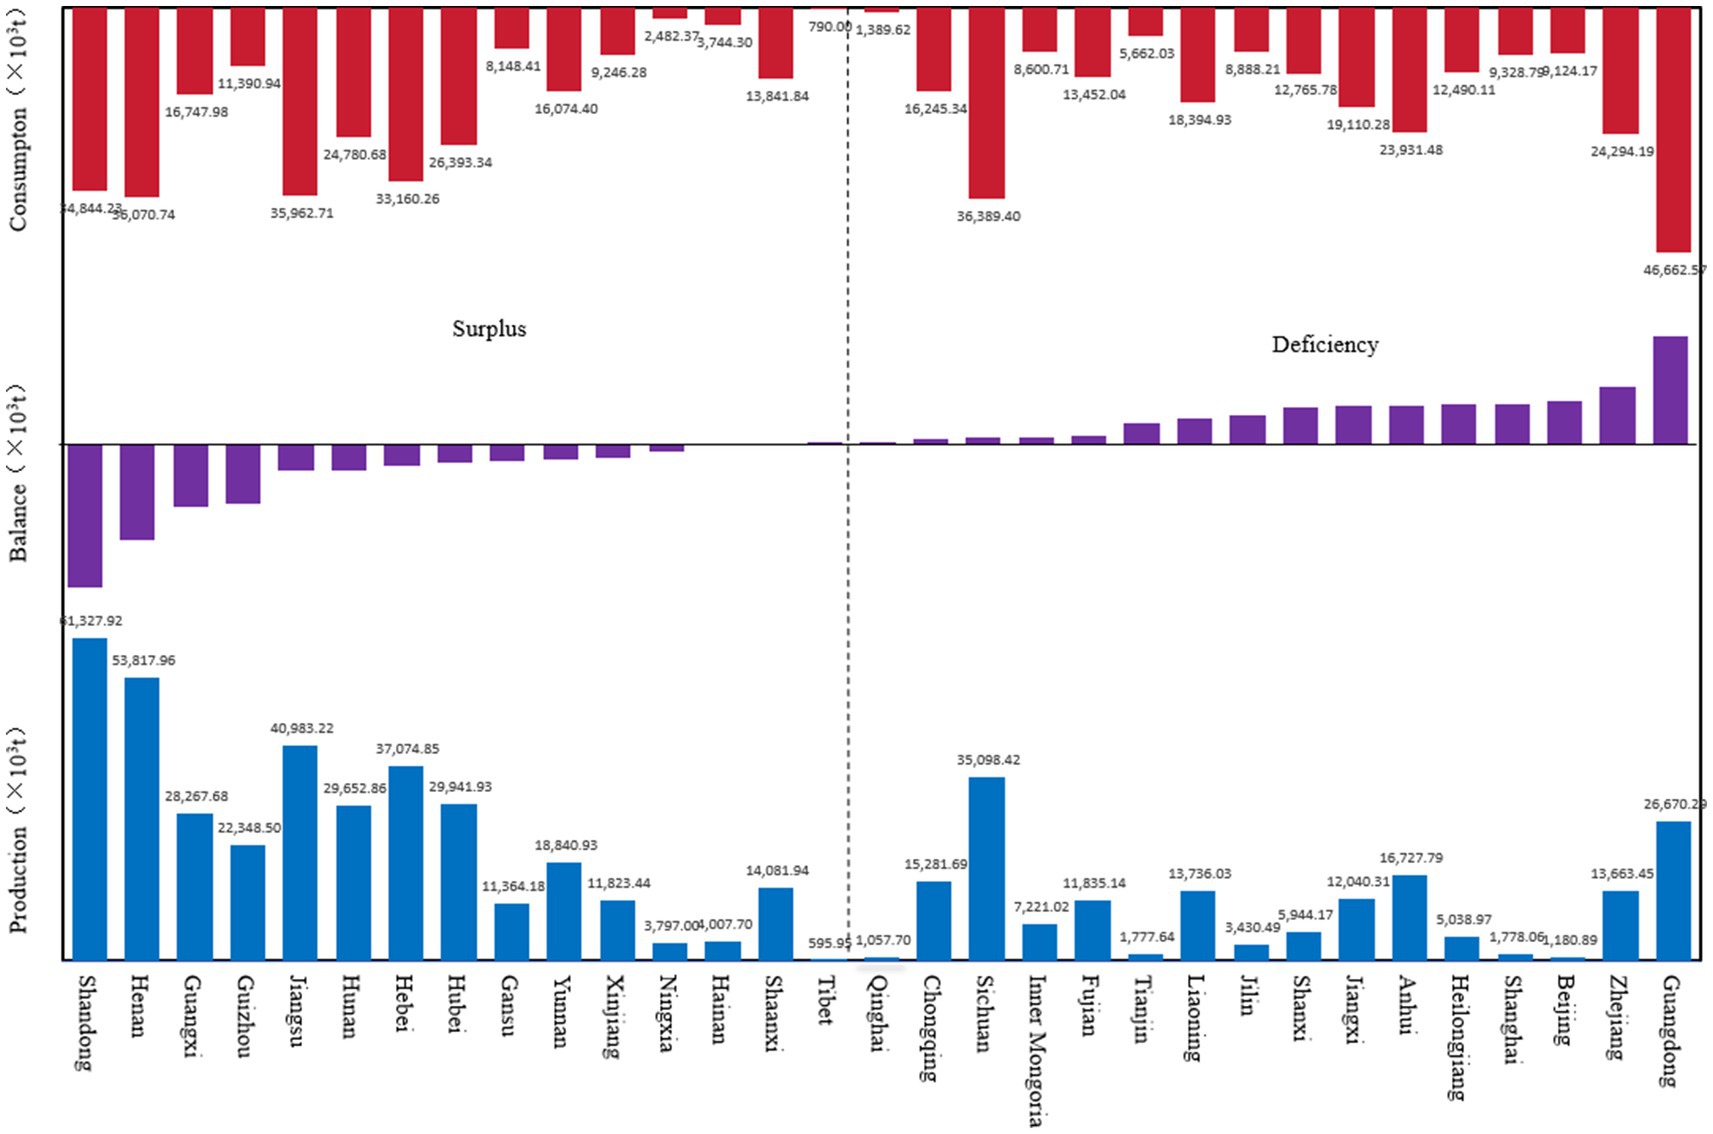
Figure 2. Vegetable production, consumption, supply and demand in all provinces of China. Data source: China agricultural statistical yearbook 2021–2023, China statistical yearbook 2021–2023.
3.1.2 Interprovincial vegetable circulation
Vegetable circulation in China exhibits distinct regional characteristics. Overall, vegetable circulation between provinces tends to prioritize meeting the needs of neighboring provinces, with a clear tendency for circulation within regions and adjacent areas, resulting in mutual satisfaction of vegetable demands between the northern and southern regions. There are a total of 65 trade routes for vegetable circulation between China’s provinces, involving all 31 provincial-level administrative regions (excluding Hong Kong, Taiwan, and Macau), with a total transportation volume reaching 149 million tons, accounting for 28.76% of the total production. A total of 24 provinces export vegetables to other provinces. Only 9.65 million tons of vegetables are used for export, accounting for 1.29% of the total production, indicating a relatively active state of vegetable trading overall.
In terms of interprovincial vegetable circulation, Shandong is the largest exporter, with an export volume of 20.5 million tons, followed by Henan with 19.3 million tons. Guangdong is the largest importer of vegetables, with an import volume of 22.6 million tons. Beijing has the lowest vegetable self-sufficiency rate at only 9.91%, followed by Shanghai at 12.69%. The largest volume of vegetable transfer between provinces is from Hebei to Liaoning, with 14.6 million tons, followed by the transfer from Guizhou to Guangdong, amounting to 11.3 million tons, as shown in Figure 3. The output of the linear optimization model is generally consistent with the interregional vegetable production and trade patterns reported in previous studies, such as Zhang and Liu (2024), Li and Mu (2019), and Shen and Mu (2019). Taking the vegetable supply in megacities like Beijing and Shanghai as examples: Beijing has a vegetable self-sufficiency rate of approximately 10%. Hebei, Liaoning, and Shandong are major contributors to Beijing’s vegetable supply, accounting for about 25, 10, and 25% of the market share, respectively. Together, these three provinces supply over 60% of Beijing’s vegetables (Zhao et al., 2011). Shanghai maintains a vegetable self-sufficiency rate of around 40%. With improvements in transportation and logistics, Shanghai’s vegetable supply system has expanded significantly in scope, distance, and diversity of sourcing regions and varieties. This trend aligns with the development of a large-scale market-driven circulation system. In terms of supply volume, northern regions (North China, Northwest, Northeast) contribute about 50% of Shanghai’s vegetable supply, neighboring regions (Yangtze River Delta, Central China) provide 30%, and southern regions (South China, Southwest) account for 20%. The top 5 external supply provinces are Jiangsu, Shandong, Zhejiang, Fujian, and Hebei (Zhou and Ao, 2016; Peng, 2022).
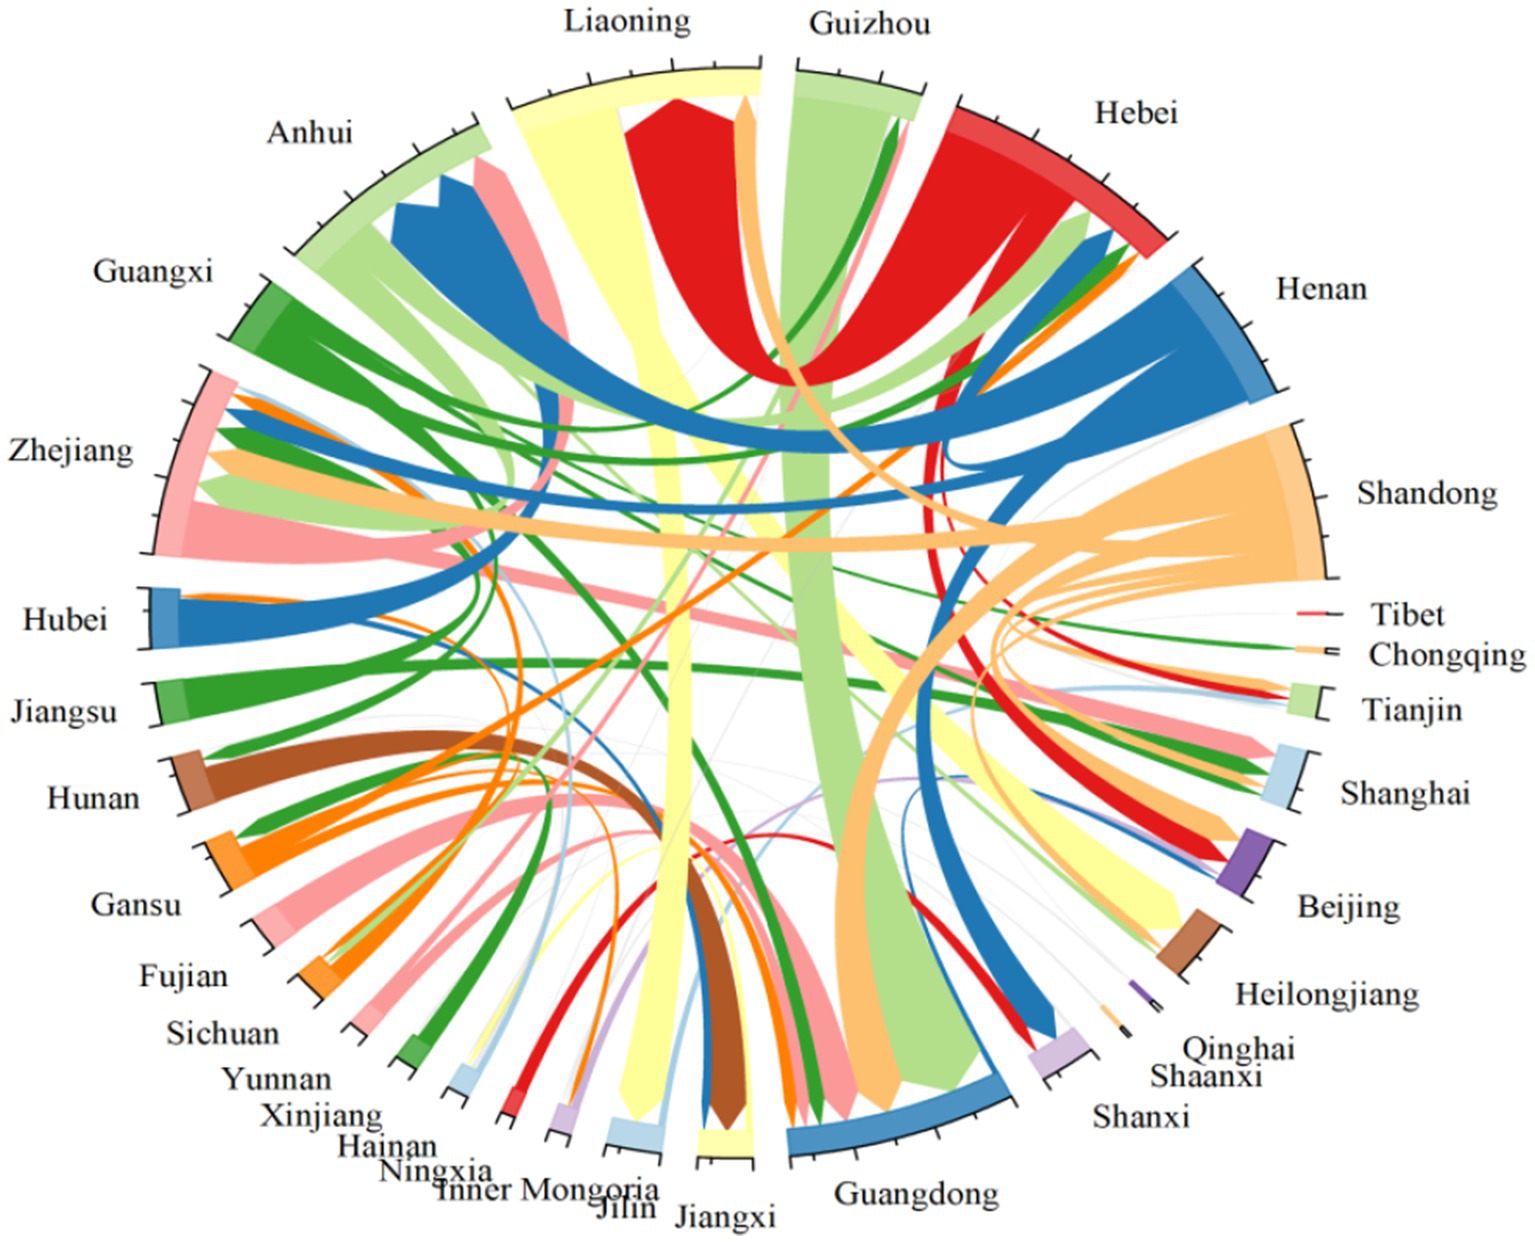
Figure 3. Vegetable circulation among provinces in China. Data source: MTALAB linear optimization results.
The East China, Central China, and North China regions have favorable growing conditions, with provinces like Shandong, Henan, and Hebei being major vegetable-exporting provinces in China. The supply from these provinces mainly goes to Beijing, Tianjin, Shanghai, Zhejiang, Anhui, and Guangdong, with some also supplied to the Northeast or used for import and export. Although Jiangsu and Zhejiang in the East China region are major vegetable-producing provinces, the high population and relatively developed economies in these areas mean that most of the vegetable production is consumed locally, with little surplus flowing to other regions. The Northeast region is a net vegetable import area, primarily sourcing vegetables from Shandong, Hebei, and other regions, totaling 16.2 million tons. The Northwest region has a surplus of vegetables, which are mainly exported to North China and South China. Guizhou and Sichuan are the largest vegetable-exporting provinces in the Southwest region, supplying not only to local provinces like Sichuan and Chongqing but also to regions in South China and East China. In South China, both Guangxi and Guangdong have high vegetable production (Guangdong with 37 million tons and Guangxi with 38.4 million tons). However, due to Guangdong’s dense population, vegetable demand far exceeds production, with a self-sufficiency rate of only 54.4%, relying on vegetable supplies from Guangxi, Guizhou, and other regions.
3.2 Analysis of the impact of vegetable circulation on water and land resources
3.2.1 The flow of water and land resources in vegetable circulation
Vegetable production in China requires 21.4 million hectares of land and consumes 226 billion cubic meters of water. The vegetables circulated between provinces (excluding imports, exports, or inventory) require 41.4 billion cubic meters of water (accounting for 19.66% of the total water consumed in vegetable production) and 4.02 million hectares of land (accounting for 18.76% of the total land consumed in vegetable production). There are significant differences in the consumption of water and land resources for vegetable production across regions. Shandong, with the largest vegetable production, consequently has the highest demand for water and land resources, reaching 20.5 billion cubic meters and 1.49 million hectares, respectively. Shandong also has the largest outflow of vegetables, with the vegetables exported requiring 4.84 billion cubic meters of water and 264,000 hectares of land. Similarly, as major vegetable-exporting provinces, Henan and Hebei each require more than 3.5 billion cubic meters of water and over 200,000 hectares of land for the vegetables they export. Guangdong has the largest inflow of vegetables, resulting in relatively high consumption of water and land resources associated with these imports, totaling 9.9 billion cubic meters of water and 782,000 hectares of land. Provinces like Anhui, Liaoning, and Zhejiang also have significant vegetable imports, with the vegetables requiring more than 3.0 billion cubic meters of water and 590,000 hectares of land. Guizhou is the province that requires the most water and land resources per unit of vegetable production, with a vegetable output of 32 million tons, but requiring 18.4 billion cubic meters of water and 578,000 hectares of land. This is related to the local climate conditions and farming practices.
Figure 4 illustrates the major vegetable flow between provinces in China, highlighting 18 main circulation routes involving 14 provincial-level administrative regions. Each of these routes handles more than 2.0 million tons of vegetables, collectively accounting for 90.35% of the national vegetable transportation volume. The movement of these vegetables results in the transfer of 37.0 billion cubic meters of water and 3.93 million hectares of land resources.
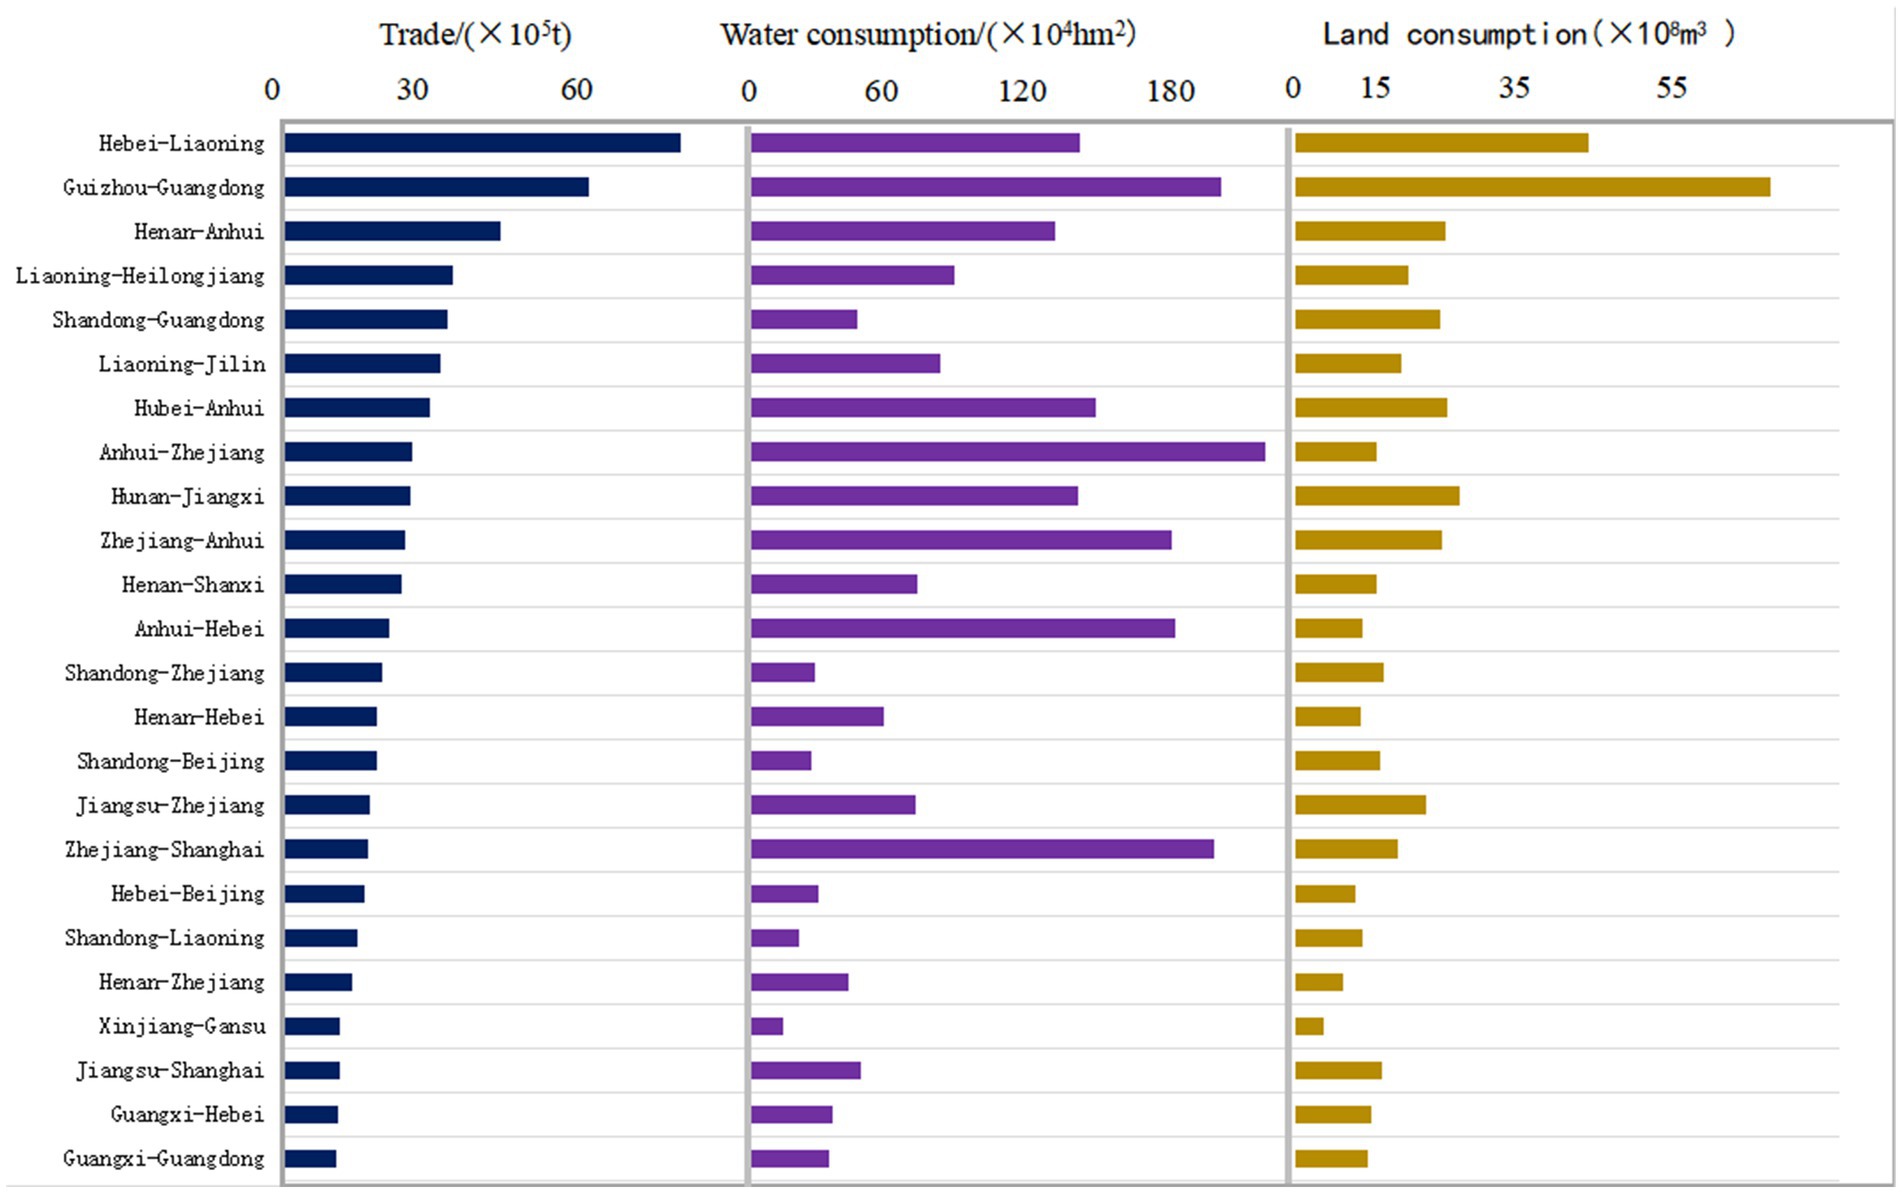
Figure 4. Vegetable circulation and its water and land resources flow among major provinces in China. Data source: China agricultural statistical yearbook 2021–2023, national agricultural product cost-benefit data compilation 2021–2023.
Among the vegetable flows, the largest volume is from Hebei to Liaoning, with an implied water resource of 2.91 billion cubic meters, equivalent to 1.56 times the water resources required for Liaoning’s current vegetable production. The implied land resource is 242,000 hectares, equivalent to 0.87 times the land resources needed for Liaoning’s current vegetable production, reflecting Hebei’s higher land resource utilization efficiency in vegetable cultivation. The second largest flow is from Guizhou to Guangdong, with an implied water resource of 7.14 billion cubic meters, equivalent to 1.44 times the water resources required for Guangdong’s current vegetable production. The implied land resource is 347,000 hectares, equivalent to 0.46 times the land resources needed for Anhui’s current vegetable production. Although the vegetable volumes flowing from Guizhou to Guangdong and from Guangxi to Guangdong are much lower than those from Hebei to Liaoning, the lower efficiency of water and land resource utilization in Guizhou and Guangxi compared to Hebei results in relatively higher implied water and land resource flows. The water resource utilization rates in Guizhou and Guangxi are 3.68 times and 2.15 times that of Hebei, respectively, while the land resource utilization rates are 3.13 times and 2.53 times that of Hebei, respectively.
3.2.2 The impact of vegetable circulation on water and land resources
From the consumption perspective, if each province were to consume only vegetables produced within its own borders, China’s annual vegetable consumption would require 235 billion cubic meters of water and 28.4 million hectares of land. The interprovincial circulation of vegetables (excluding imports, exports, and inventory) saves 6.46 million hectares of land resources, equivalent to 29.42% of the total land resources consumed in vegetable production in China. However, it also results in the waste of 8.25 billion cubic meters of water resources, equivalent to 3.64% of the total water resource consumption. The primary reasons for this situation are the uneven distribution of water and land resources and the differences in their utilization efficiency. From the consumption side, Guangdong consumes the most vegetables, leading to the highest consumption of water and land resources, at 29.1 billion cubic meters (12.98% of the national water resource consumption on the demand side) and 3.08 million hectares (10.86% of the national land resource consumption on the demand side), respectively. Guangdong is also the province with the highest consumption of water and land resources on the demand side. Jiangsu ranks second in water resource consumption on the demand side, with a consumption of 20.2 billion cubic meters, while Zhejiang ranks second in land resource consumption on the demand side, with a consumption of 2.58 million hectares. There are significant differences in the efficiency of water and land resource utilization across different regions of China. The North China region has the highest average efficiency in utilizing water and land resources nationwide, with provinces such as Shandong, Henan, Hebei, Shanxi, and Liaoning being the most efficient in land use. The flat terrain and fertile land of the North China Plain facilitate concentrated vegetable cultivation. In contrast, the South China and Southwest regions have relatively lower efficiency in utilizing water and land resources.
In the interprovincial vegetable trade in China, 33 trade flows have improved water resource utilization efficiency to some extent, saving 7.36 billion cubic meters of water. However, 45.39% of the vegetable trade flows have resulted in a waste of national water resources, requiring 15.2 billion cubic meters of water to meet the production needs of these vegetables. At the same time, only 14.49% of the vegetable trade flows have led to a decrease in land resource efficiency, while the remaining 49 trade flows have saved 6.95 million hectares of land resources. Figure 5 shows the comparison between the water and land consumption caused by major interprovincial vegetable flows and the consumption at the point of origin.
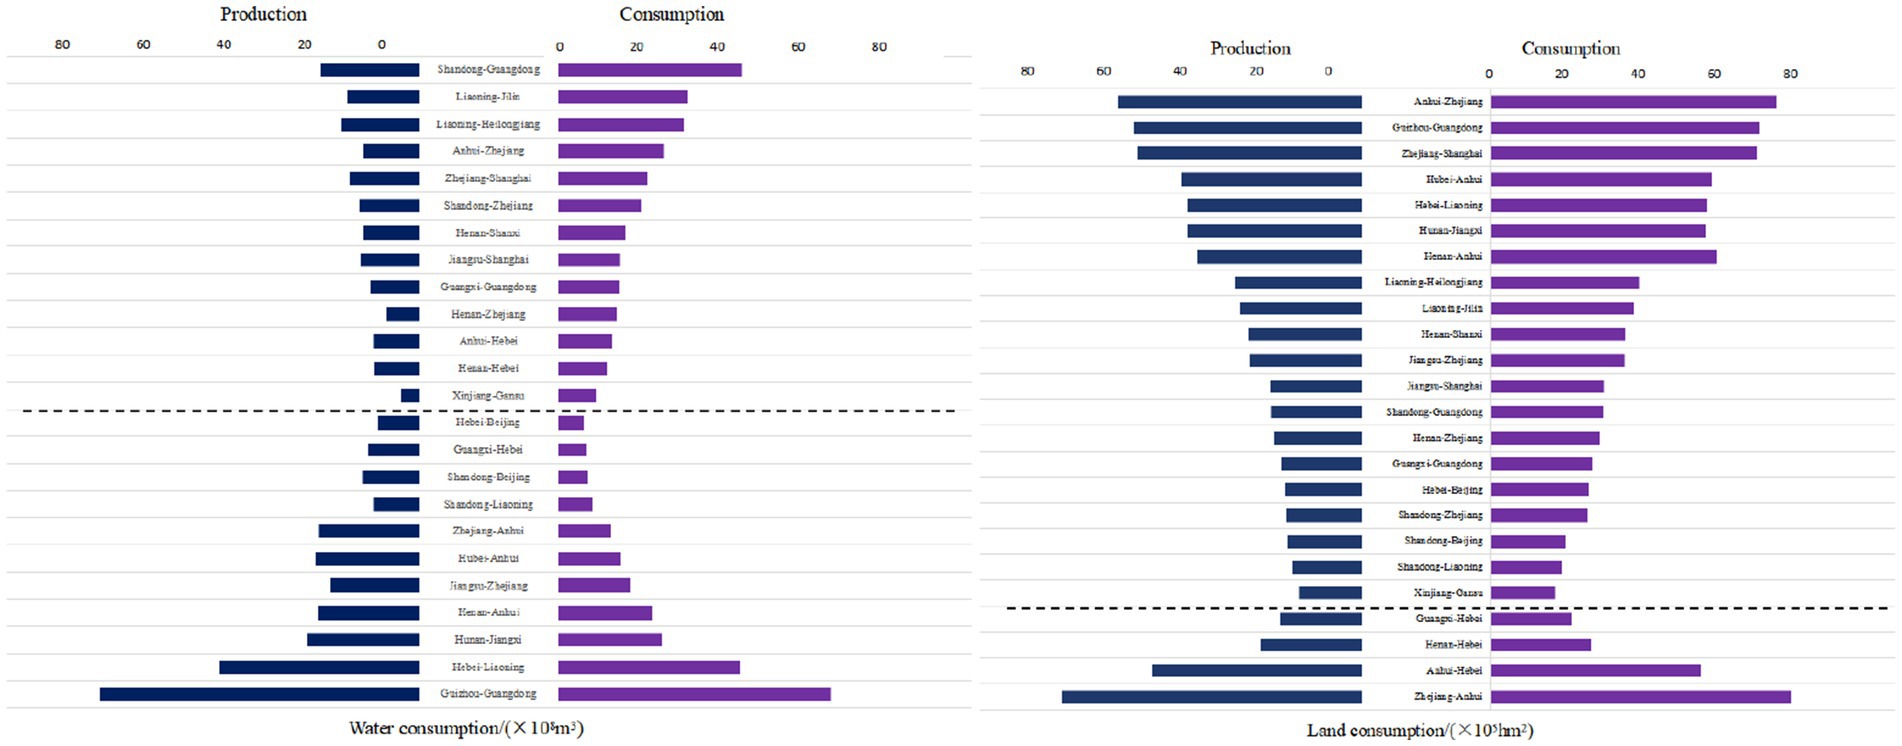
Figure 5. Impact of vegetable circulation on water and land resources among major provinces in China. Data source: China agricultural statistical yearbook 2021–2023, national agricultural product cost-benefit data compilation 2021–2023.
The vegetables transported from Hebei to Liaoning resulted in a waste of 287 million cubic meters of water but saved 62,500 hectares of land resources. This is primarily because Hebei, located at a lower latitude, has a higher average annual temperature than Liaoning, leading to higher water requirements for plant transpiration and consequently lower water resource utilization efficiency. On the other hand, Hebei has more advanced greenhouse vegetable cultivation techniques, with a more concentrated and large-scale industry, resulting in relatively higher land resource utilization efficiency. This disparity in water and land resource utilization efficiency between the two provinces is due to these differences. In regions like Shandong and Hebei, where the vegetable cultivation industry is more concentrated and developed, the vegetable production per unit of land is high. The transportation of vegetables from these areas to provinces like Liaoning, Anhui, Beijing, and Tianjin has collectively saved 329,000 hectares of land resources, thereby improving the overall land resource utilization efficiency in China and contributing to the sustainable use of land resources. However, this has also resulted in a waste of 2.58 billion cubic meters of water, indicating that there is room for improvement in irrigation technologies in these regions.
Hebei and Shandong are both key vegetable production and distribution hubs, alongside other significant vegetable-producing provinces such as Hebei, Guizhou, and Jiangsu. These areas are vital “vegetable basket” bases that play an essential role in supporting the overall vegetable circulation pattern in China. In addition to their advantageous natural resources, the concentrated scale of operations in Hebei and Shandong contributes to their status as some of the most efficient provinces in terms of water and land resource utilization for vegetable cultivation. In recent years, central government documents have emphasized the development of various forms of scale operations. For instance, the 19th National Congress report explicitly stated the need to “develop various forms of appropriately scaled operations and cultivate new types of agricultural business entities,” providing crucial policy guidance for the practical implementation of appropriately scaled operations. Innovations in scaling operations, such as land rental, full trusteeship, land shareholding, or land consolidation through “small plot for large plot” exchanges, have been encouraged (Niu et al., 2021). Appropriately scaled operations can increase farmers’ enthusiasm for cultivation and enhance the efficiency of vegetable production on a larger scale.
Guizhou’s karst topography is widespread, resulting in small and scattered plots of land used for vegetable cultivation. Additionally, Guizhou is located at the intersection of the Yunnan-Guizhou Plateau and the Central Asian subtropical climate zones. The combination of relatively dispersed vegetable growing areas and relatively abundant climate and water resources leads to the lowest efficiency in water and land resource utilization for vegetable production in the country. At the same time, Guizhou is highly suitable for the development of the vegetable industry. The province has included the vegetable industry in its twelve key specialty industries, making vegetables the second-largest crop in Guizhou’s agriculture after grain (Niu et al., 2021). In 2020, Guizhou exported 11.3 million tons of vegetables to Guangdong, accounting for 8.72% of the national vegetable circulation volume, but this also resulted in a waste of 3.41 billion cubic meters of water, which is 11.91% of the water resources needed for Guangdong’s vegetable production. Additionally, it caused a waste of 150,000 hectares of land, accounting for 11.01% of the land resources required for Guangdong’s vegetable production. Similarly, Guangxi, Guangdong, and Yunnan also exhibit low efficiency in water and land resource utilization. Therefore, in regions with relatively abundant resources, improving water resource utilization efficiency and increasing the concentration of the planting industry in a manner suited to local conditions is of great importance for better achieving sustainable resource use in China.
In summary, it is evident that selecting vegetable production models tailored to local conditions, developing specialty planting industries, implementing appropriately scaled operations, and adopting reasonable vegetable circulation models, along with improving the efficiency of water and land resource utilization and enhancing irrigation efficiency in major production areas, are crucial for better meeting the diverse vegetable demands and achieving sustainable resource use in China.
4 Discussion and conclusion
4.1 Discussion
The findings of this study reveal that China’s interprovincial vegetable circulation involves substantial flows of virtual water and virtual land, exerting complex impacts on resource sustainability at both national and regional levels.
First, our study verified the robustness of the model results through sensitivity analysis. The analysis demonstrates that although fluctuations in the circulation loss rate and crop coefficient lead to proportional linear changes in the estimated values of virtual water/land flows, the direction of virtual resource flows and the macro-level network structure among provinces remain unchanged. These results confirm that parameter uncertainty primarily affects the accuracy of absolute flow estimates, while the core conclusions of this study regarding the main pathways, key nodes, and balance conditions of virtual resource flows in China’s vegetable trade are robust. Future research could further enhance the accuracy of quantitative estimates by obtaining more localized and refined parameter data.
Second, our results indicate that major production hubs such as Shandong and Henan exhibit significantly higher water and land use efficiency in vegetable production compared to the national average. This observation aligns with the trend of regional specialization in vegetable production noted by Wu and Mu (2016), underscoring the importance of leveraging regional comparative advantages. By exporting vegetables, these provinces effectively act as conservators of national water and land resources. However, this also intensifies pressure on local resources—particularly water—and may exacerbate environmental externalities (Yang et al., 2022). The transfer of resource pressure and environmental costs across regions must be addressed in future policies aimed at promoting coordinated regional development.
Third, this study highlights that while interprovincial vegetable circulation improves the allocation efficiency of land resources, it may also reduce the overall efficiency of water use nationwide. This apparent paradox carries important policy implications. It suggests that current circulation patterns are likely driven more by economic factors—such as transportation costs and market demand—and land constraints, rather than by considerations of water sustainability. This resonates with Cai’s (2024) view on spatial resource mismatch but further indicates that addressing the imbalance of one resource (e.g., land) may come at the cost of aggravating the imbalance of another (e.g., water). Therefore, policies based on a single-resource perspective (e.g., focusing only on virtual water or virtual land) may be insufficient; a more integrated approach that combines water and land resource management is needed. The multi-objective optimization framework (such as the water-energy-food-land nexus framework) proposed by Tan et al. (2025) offers a valuable methodological pathway for designing such balanced strategies. Their approach, which integrates deep reinforcement learning and Copula-based risk assessment, can be adapted to our context of virtual resource flows in vegetable circulation. Utilize a Copula-based model (e.g., R-vine Copula) to assess the joint risk of water and land resource shortages in key vegetable production and consumption provinces, Circulation quotas or incentives can then be adjusted based on regional risk profiles. For example, flows from regions with high joint resource risk (e.g., water scarcity coupled with land degradation) could be rationally reduced or conditioned on the adoption of water-saving technologies. Drawing on Tan et al.’s Coupling Coordination Gravity Model (CCGM), the coordination degree of virtual water-land resources among provinces within the vegetable circulation network can be evaluated. Provinces with low coordination degrees (i.e., severe imbalance between water and land efficiency benefits) can be identified. Targeted policies can then be implemented, such as investing in water-saving irrigation infrastructure in these provinces or adjusting inter-provincial trade agreements, to enhance their coordination level and reduce systemic imbalances.
Moreover, the “proximity-first” regionalized characteristic observed in vegetable circulation presents a certain tension with the proposal by Zhou and Chen (2022) to establish “long-term docking mechanisms with external production bases.” While regional circulation helps reduce transportation costs and spoilage, it may also increase supply chain vulnerability in the face of regional climate disasters or market fluctuations. Thus, finding a balance between circulation efficiency and supply chain resilience represents an important direction for future research.
Finally, as noted by Jiang et al. (2015) and Ding et al. (2018), the relocation of urban vegetable supply bases has become an irreversible trend. This study quantifies the associated resource and environmental consequences from the perspective of virtual resource flows. This implies that ensuring the security of urban vegetable supply must no longer rely on outdated self-sufficiency models but should instead be integrated into nationwide resource and environmental planning. Establishing a synergistic governance mechanism that combines an “effective market” and a “proactive government” is essential to guide the formation of a vegetable production and circulation pattern that aligns with economic principles while respecting resource and environmental carrying capacities. Such an approach is crucial for achieving a sustainable transition of the agri-food system.
4.2 Conclusion
This study simulated the patterns of interprovincial vegetable circulation in China and quantified its resource effects based on the concepts of virtual water and virtual land. The main conclusions are as follows:
4.2.1 Circulation patterns
Interprovincial vegetable circulation in China is characterized by strong regionalization and proximity. North China and East China serve as core production and distribution hubs, with Shandong, Henan, and Hebei being the major exporting provinces, and Guangdong, Beijing, Shanghai and others acting as the main importers. Spatial mismatch between production and consumption is the fundamental driver of large-scale circulation.
4.2.2 Resource effects
Interprovincial vegetable circulation accounts for 28.15% of national water use and 18.76% of land use dedicated to vegetable production. While this circulation network improves the spatial allocation and utilization efficiency of land resources, it also leads to reduced efficiency in water use, highlighting an imbalance in the resource benefits of the current circulation pattern.
4.2.3 Policy implications
This study emphasizes the need for future agricultural policies to adopt an integrated approach that coordinates water and land management, moving beyond single-resource optimization. While leveraging the decisive role of the market and regional comparative advantages, governments should guide production and circulation through scientific planning, with a focus on improving irrigation efficiency in major production areas. This will help balance multiple objectives including national vegetable supply security, sustainable resource use, and environmental protection.
The original contribution of this study lies in its systematic construction of a nationwide interprovincial vegetable circulation network and its coupled analysis of the impacts on both water and land resources. It provides new evidence for understanding the resource and environmental effects of agricultural product circulation in China and offers a scientific basis for designing strategies for the sustainable transformation of the agri-food system.
4.3 Limitations and future research
The analysis in this study is based on several key parameter assumptions. Critical parameters such as circulation loss rates and crop coefficients were adopted using uniform national values or simple weighted averages, which do not fully account for differences in regional logistics efficiency or variations among vegetable types. This approach was primarily necessitated by the difficulty in obtaining high-resolution parameter data for multiple vegetable categories across all 31 provincial-level regions in China. The simplification was employed to establish a national-scale benchmark assessment. However, this approach may lead to deviations in estimating the scale of virtual water and land flows—potentially overestimating flows in regions with underdeveloped logistics infrastructure while underestimating them in areas with high logistics efficiency.
In addition, due to the lack of data on interprovincial vegetable trade volumes and flows, as well as inconsistencies in the statistical calibers of vegetable production and consumption data from the National Bureau of Statistics, this study did not fully account for vegetables consumed in dining-out occasions, used for processing, or lost during production and circulation. This may lead to inaccuracies in the total vegetable demand estimation.
Although this study provides valuable insights into the overall direction of vegetable flows and the trends in resource reallocation, we should interpret the absolute values of interprovincial virtual resource flows with caution. Future research could improve the accuracy and reliability of simulations by collecting more detailed, category-specific and region-specific parameter data, and by developing dynamic parameter models that better reflect actual interprovincial virtual water–land resource flows (Ren et al., 2024).
Data availability statement
The original contributions presented in the study are included in the article/supplementary material, further inquiries can be directed to the corresponding author.
Author contributions
LZ: Conceptualization, Writing – original draft. NW: Writing – review & editing. JN: Writing – review & editing. GL: Writing – original draft.
Funding
The author(s) declare that financial support was received for the research and/or publication of this article. This work was supported by the National Social Science Foundation of China: “Spatial Structure, Market Docking, Optimization and Regulation of the Supply of ‘Vegetable Basket’ Products in Large and Medium-sized Cities under the Perspective of Domestic General Circulation” (22BJY258).
Acknowledgments
We would like to express our sincere gratitude to all those who contributed to this research, and we appreciate the valuable feedback and support provided by our colleagues and mentors throughout this study.
Conflict of interest
The authors declare that the research was conducted in the absence of any commercial or financial relationships that could be construed as a potential conflict of interest.
Generative AI statement
The authors declare that no Gen AI was used in the creation of this manuscript.
Any alternative text (alt text) provided alongside figures in this article has been generated by Frontiers with the support of artificial intelligence and reasonable efforts have been made to ensure accuracy, including review by the authors wherever possible. If you identify any issues, please contact us.
Publisher’s note
All claims expressed in this article are solely those of the authors and do not necessarily represent those of their affiliated organizations, or those of the publisher, the editors and the reviewers. Any product that may be evaluated in this article, or claim that may be made by its manufacturer, is not guaranteed or endorsed by the publisher.
Footnotes
References
Ali, T., Huang, J. K., Wang, J. X., and Xia, W. (2017). Global footprints of water and land resources through China’s food trade. Glob. Food Secur. 12, 139–145.
Allan, J. A. (1993). Fortunately there are substitutes for water: otherwise our hydro political futures would be impossible In: Priorities for water resources allocation and management (London: Overseas Development Administration), 13–26. Available online at: https://www.ircwash.org/sites/default/files/210-93PR-11967.pdf?
Allan, J. A., and Mallat, C. (1996). Water in the Middle East: legal, political, and commercial issues. London: Tauris Academic Press, 360–677.
Amini, A., Othman, K., Abassi, F., and Booij, M. J. (2025). Determining virtual water, physical and economic indices to optimize agricultural water consumption in three different climates. Int. J. Environ. Sci. Technol. 22, 2941–2954. doi: 10.1007/s13762-024-05967-0
Ben, P. Q., Wu, S. H., Li, X. T., and Zhou, S. L. (2016). China’s inter-provincial grain trade and its virtual cultivated land flow simulation. Geogr. Res. 35, 1447–1456. doi: 10.11821/dlyj201608004
Cai, W. (2024). Research on the countermeasures to improve the efficiency of vegetable circulation in China. J. Shanghai Econ. Manag. Coll. 22, 1–13. doi: 10.19702/j.cnki.jsemc.2024.01.001
Cao, C. (2024). Regional difference, distribution dynamics and convergence of imports of grain virtual cultivated land resources in China. Geogr. Geoinf. Sci. 40, 95–101. doi: 10.3969/j.issn.1672-0504.2024.04.014
Caro, D., Alessandrini, A., Sporchia, F., and Borghesi, S. (2021). Global virtual water trade of avocado. J. Clean. Prod. 285, 124917.1–124917.8. doi: 10.1016/j.jclepro.2020.124917
Chapagain, A. K., and Hoekstra, A. Y. (2003). Virtual water flows between nations in relation to trade in livestock and livestock products. Value of water research report series no. 13. UNESCO-IHE, Delft, The Netherlands
Cheng, G. D. (2003). Virtual water: a new idea of China’s water resources security strategy. Chin. J. Acad. Sci. 4, 260–265. doi: 10.3969/j.issn.1000-3045.2003.04.006
Chi, X. J., Song, Y. Z., and Li, Y. (2022). Investigation and research on the loss of vegetable industry chain in Shandong Province. China Fruit Vegetable 42, 78–84. doi: 10.19590/j.cnki.1008-1038.2022.05.014
Ding, X. L., Zhang, L. L., and Wang, Z. Z. (2018). Comprehensive benefit analysis of virtual water based on inter-provincial grain trade. Resour. Environ. Yangtze Basin 27, 978–987. doi: 10.11870/cjlyzyyhj201805005
Duarte, R., Pinilla, V., and Serrano, A. (2019). Long term drivers of global virtual water trade: a trade gravity approach for 1965–2010. Ecol. Econ. 156, 318–326. doi: 10.1016/j.ecolecon.2018.10.012
Falkenmark, M., and Rockstrom, J. (2006). The new blue and green water paradigm: breaking new ground for water resources planning and management. J. Water Resour. Plan. Manag. 132, 129–132. doi: 10.1061/(ASCE)0733-9496(2006)132:3(129)
Gao, S. J., Guo, G. Y., and Dai, X. B. (2014). Research of inter-provincial grain transport costs based on GIS network analyst. Logist. Sci. Tech. 37, 135–139. doi: 10.3969/j.issn.1002-3100.2014.05.046
Gong, Y., Wang, P., and Wang, C. L. (2007). Analysis on quantity and contribution of virtual water in China’s grain trade. J. Huazhong Agric. Univ. (Soc. Sci. Ed.) 5, 38–43. doi: 10.3969/j.issn.1008-3456.2007.05.010
Guo, S., Wang, Y., Shen, G., and Wang, H. (2020). Virtual built-up land transfers embodied in China's interregional trade. Land Use Policy 94:104536. doi: 10.1016/j.landusepol.2020.104536
Han, A., Liu, A., Guo, Z., Liang, Y., Chai, L., and Bateman, L. J. (2023). Measuring gains and losses in virtual water trade from environmental and economic perspectives. Environ. Resour. Econ. 85, 195–209. doi: 10.1007/s10640-023-00763-9
Han, X., and Sun, C. Z. (2013). Virtual water flow patterns embedded in major crops in China. Resour Sci 35, 1567–1576.
Hekmatnia, M., Ardakani, A. F., Isanezhad, A., and Monibi, H. (2023). A novel classification of virtual water trade for the sustainability of global freshwater resources. Environ. Dev. Sustain. 26, 7377–7408. doi: 10.1007/s10668-023-03012-7
Hekmatnia, M., Ghaleno, N. D., Ardakani, A. F., and Zafarani, N. (2024). Modifying the virtual water trade of rice for global sustainability of freshwater resources. Sustain. Water Resour. Manag. 10:187. doi: 10.1007/s40899-024-01164-6
Hoekstra, A. Y., and Hung, P. Q. (2002). Virtual water trade: a quantification of virtual water flows between nations in relation to international crop trade. Value of Water Research Report Series No. 11, IHE, Delft. Available online at: https://www.waterfootprint.org/resources/Report11.pdf?
Hu, R. B., and Tong, G. H. (2018). The soil conservation effect and potential of import and export trade of the Main agricultural products in China under the perspective of the virtual soil. Reform 13, 151–159.
Hu, M. M., Zhang, C. B., Dong, L., Xiang, P. C., and Zhang, Q. (2018). Economical pillar of sustainability assessment on resource circulation development and application of life cycle costing approach. Chin. Environ. Sci. 38, 4788–4800. doi: 10.19674/j.cnki.issn1000-6923.2018.0542
Huang, M., and Huang, W. (2016). Measurement of virtual water trade and its impact factors in China. China Popul. Resour. Environ. 26, 100–106. doi: 10.3969/j.issn.1002-2104.2016.04.013
Jiang, Y., Zhang, X., and Wang, S. S. (2015). Case analysis of vegetable fresh E-commerce model. Coop. Econ. Technol. 7, 125–127. doi: 10.3969/j.issn.1672-190X.2015.07.068
Li, L., and Mu, Y. (2019). A study on the price linkage of agricultural products between major producing and marketing areas: evidence from the vegetable market around Beijing. Xinjiang State Farms Econ. 9, 18–26.
Liang, L. T., and Zhu, K. C. (2019). Interregional agricultural eco-compensation based on virtual cultivated land flow:regional division and compensation standard accounting. Geogr. Res. 38, 1932–1948. doi: 10.11821/dlyj020180549
Liu, Y. J., Lu, C. X., and Huang, S. L. (2020). Virtual water consumption and flow in the development of the vegetable industry in Zhangjiakou City. Pratacult. Sci. 37, 1397–1404. doi: 10.11829/j.issn.1001-0629.2020-0059
Luo, Z. L., Long, A. H., Huang, H., and Xu, Z. M. (2004). Virtual land strategy and socialization of management of sustainable utilization of land resources. J. Glaciol. Geocryol. 26, 624–631. doi: 10.3969/j.issn.1000-0240.2004.05.018
Mayer, A., Mubako, S., and Ruddell, B. L. (2016). Developing the greatest blue economy: water productivity, fresh water depletion, and virtual water trade in the Great Lakes basin. Earths Future 4, 282–297. doi: 10.1002/2016EF000371
Mekonnen, M. M., Kebede, M. M., and Demeke, B. W. (2024). Trends and environmental impacts of virtual water trade. Nat. Rev. Earth Environ. 5, 890–905. doi: 10.1038/s43017-024-00605-2
Motoshita, M., Pfister, S., and Sasaki, T. (2023). Responsibility for sustainable water consumption in the global supply chains. Resour. Conserv. Recycl. 196:107055. doi: 10.1016/j.resconrec.2023.107055
Niu, L. L., Wu, J. L., and Cao, J. H. (2021). Development status and countermeasures of vegetable industry in Anshun City, Guizhou Province. Yangtze River Vegetables 16, 4–6. doi: 10.3865/j.issn.1001-3547.2021.16.002
Peng, B. (2022). Analysis and thoughts on the supply and development of Shanghai vegetable market. Shanghai Rural Econ. 5, 29–32. doi: 10.3969/j.issn.1671-6485.2022.05.010
Ren, J. N., Lü, X. Y., Li, W. F., Chen, L. D., and Han, L. J. (2024). Study on the influence of changing virtual water flow patterns in the Beijing-Tianjin-Hebei urban agglomeration on regional water pressure. Water Resour. Hydropower Eng. 55, 148–158. doi: 10.13928/j.cnki.wrahe.2024.06.012
Rushforth, R. R., and Ruddell, B. L. (2018). A spatially detailed blue water footprint of the United States economy. Hydrol. Earth Syst. Sci. 22, 3007–3032. doi: 10.5194/hess-22-3007-2018
Searchinger, T.D., Wirsenius, S., Beringer, T., and Dumas, P. (2018). Assessing the efficiency of changes in land use for mitigating climate change. Nature, 2018, 564, 249–253. doi: 10.1038/s41586-018-0863-y
Shen, S., Jiang, Y., and Cheng, C. (2024). Inversed virtual water flow pattern and its influencing factors in Northwest China. Ecol. Indic. 158:111340. doi: 10.1016/j.ecolind.2023.111340
Shen, C., and Mu, Y. (2019). Spatial and temporal characteristics of vegetable circulation in Beijing market based on production-marketing linkage: cases of Chinese cabbage, cucumber and tomato. China Vegetables 11, 10–15. doi: 10.19928/j.cnki.1000-6346.2019.11.004
Streimikis, J., and Baležentis, T. (2020). Agricultural sustainability assessment framework integrating sustainable development goals and interlinked priorities of environmental, climate and agriculture policies. Sustain. Dev. 28, 1702–1712. doi: 10.1002/sd.2118
Tamea, S., Carr, J. A., Laio, F., and Ridolfi, L. (2014). Drivers of the virtual water trade. Water Resour. Res. 50, 17–28. doi: 10.1002/2013wr014707
Tan, Z., Li, H., Zhu, Z., Hou, J., and Wang, Z. (2025). A water-energy-food-land nexus framework for multi-objective optimization and risk assessment integrating deep reinforcement learning and copula-based modeling. Water Res. 287:124474. doi: 10.1016/j.watres.2025.124474
Tian, Q., Yu, Y., Xu, Y., Li, C., and Liu, N. (2023). Patterns and driving factors of agricultural virtual water imports in China. Agric. Water Manag. 281:108262. doi: 10.1016/j.agwat.2023.108262
Tuninetti, M., Tamea, S., Laio, F., and Ridolfi, L. (2016). To trade or not to trade: link prediction in the virtual water network. Adv. Water Resour. 110, 528–537. doi: 10.1016/j.advwatres.2016.08.013
Vallino, E., Ridolfi, L., and Laio, F. (2021). Trade of economically and physically scarce virtual water in the global food network. Sci. Rep. 11:22806. doi: 10.1038/s41598-021-01514-w
Vanham, D., Comero, S., Gawlik, B. M., and Bidoglio, G. (2018). The water footprint of different diets within European sub-national geographical entities. Nature Sustain. 1, 518–525. doi: 10.1038/s41893-018-0133-x
Wang, W. F., Liu, A. M., and Qiang, W. L. (2011). Virtual land trades and external dependences of China’s soybean resources. J. Nat. Resour. 26, 1139–1147. doi: 10.11849/zrzyxb.2011.07.006
Wang, Y. F., Ma, Q., Kang, H. Y., and Hou, Y. L. (2018). Study on influencing factors of cotton import in China from the perspective of virtual land resources. Xinjiang State Farms Econ. 12, 17–21. doi: 10.3969/j.issn.1000-7652.2018.12.003
Wang, T., Mao, D., and Jiang, Z. (2023). Quantitative assessment of agricultural horizontal ecological compensation in China, from the perspective of virtual land and virtual water. Environ. Sci. Pollut. Res. 30, 22885–22899. doi: 10.1007/s11356-022-23220-4
Wu, S., and Mu, Y. Y. (2016). Analysis on the determinants and regional trade of vegetables in China based on the Spatio-temporal characteristics. J. Bus. Econ. 2, 18–25. doi: 10.3969/j.issn.1000-2154.2016.02.002
Xu, L., Chen, X. N., Chang, X. G., Yang, X. F., Huang, J., and Wang, Z. Y. (2016). Loss rate of major supply chain models for four kinds of leaf vegetables in Beijing. Chin. Agric. Sci. Bull. 32, 43–47.
Yang, T. T., Zhang, X. N., Gao, X., Hu, Q. Y., Wang, Q. H., Lun, F., et al. (2022). Study on inter-provincial grain trade and its impacts on virtual water and soil resources in China. Pratacult. Sci. 39, 1686–1697. doi: 10.11829/j.issn.1001-0629.2021-0441
Yu, H., Liu, K., Bai, Y. Y., Luo, Y., Wang, T., Zhong, J., et al. (2021). The agricultural planting structure adjustment based on water footprint and multi-objective optimisation models in China. J. Clean. Prod. 297:126646. doi: 10.1016/j.jclepro.2021.126646
Zhang, J., and Liu, Y. (2024). Evolution and driving factors of vegetable production agglomeration pattern in Chinese provinces. J. Shenyang Agric. Univ. 55, 605–615. doi: 10.3969/j.issn.1000-1700.2024.05.011
Zhang, Q. N., Zhang, F. F., Li, F. D., Fu, H. Y., and Yang, X. H. (2018). Study on the impact of grain virtual water flow on water resources and regional economy. Chin. J. Agric. Resour. Reg. Plan. 39, 21–28. doi: 10.7621/cjarrp.1005-9121.20180704
Zhao, J. L., Liu, C., Shi, R. X., and Wang, Z. X. (2009). Virtual water resource in cotton trade between China and Europe union since China’s entry into WTO. Chin. Popul. Resour. Environ. 19, 115–118. doi: 10.3969/j.issn.1002-2104.2009.06.021
Zhao, Y., Zhao, A., and Wang, C. (2011). Investigation on the geographical sources of vegetables in Beijing market. Food Nutr. China 17, 41–44. doi: 10.3969/j.issn.1006-9577.2011.08.011
Zhou, Y., and Ao, Y. (2016). Current situation and characteristics of external vegetable consumption in Shanghai market. Acta Agric. Shanghai 32, 95–99. doi: 10.15955/j.issn1000-3924.2016.01.21
Zhou, G. Q., and Chen, X. Y. (2022). Consumer choice in entity vegetable distribution terminals:a planned behavior approach. Chin. Melon Vegetables 35, 113–120. doi: 10.3969/j.issn.1673-2871.2022.06.020
Zhuo, L., Mekonnen, M. M., and Hoekstra, A. Y. (2016). The effect of inter-annual variability of consumption, production, trade and climate on crop-related green and blue water footprints and inter-regional virtual water trade: a study for China (1978-2008). Water Res. 94, 73–85. doi: 10.1016/j.watres.2016.02.037
Keywords: inter-provincial circulation, vegetable, virtual water and land, resource utilization efficiency, CHINAGRO model
Citation: Zhang L, Wang N, Nie J and Li G (2025) The interprovincial circulation of vegetables in China and its impact on virtual water and virtual land resources. Front. Sustain. Food Syst. 9:1685599. doi: 10.3389/fsufs.2025.1685599
Edited by:
Alessandro Bonadonna, University of Turin, ItalyReviewed by:
Giovanni Peira, University of Turin, ItalyZuowen Tan, Shanghai Ocean University, China
Copyright © 2025 Zhang, Wang, Nie and Li. This is an open-access article distributed under the terms of the Creative Commons Attribution License (CC BY). The use, distribution or reproduction in other forums is permitted, provided the original author(s) and the copyright owner(s) are credited and that the original publication in this journal is cited, in accordance with accepted academic practice. No use, distribution or reproduction is permitted which does not comply with these terms.
*Correspondence: Na Wang, bGR1d25AbGR1LmVkdS5jbg==