 Juanjuan Hu
 Jianjun Zhang
- College of Economics and Management, Inner Mongolia Agricultural University, Hohhot, China
Introduction: Analyzing the spatial–temporal evolution law and driving mechanism of soybean production patterns in Inner Mongolia provides a decision-making basis for optimizing agricultural structures and ensuring regional food security in arid and semi-arid regions.
Methods: The study comprehensively utilized the logarithmic mean divisia index, spatial Gini coefficient, industrial concentration rate, and gravity center migration model to reveal the spatial–temporal evolution characteristics of county-level soybean production patterns across Inner Mongolia from 2002 to 2022, and established a spatial Durbin model to explore the multi-dimensional driving mechanism underlying the spatial–temporal pattern evolution of soybean production.
Results: The findings illustrated: (1) Temporally, soybean production capacity in Inner Mongolia has generally shown an upward trend, progressing through four distinct stages—fluctuating adjustment, yield breakthrough, scale expansion, and transformation-optimization. (2) Spatially, soybean production exhibits an overall distribution pattern of “eastern concentration and central-western diffusion,” with persistently high spatial agglomeration and a shifting gravity center within the agricultural belt along the eastern foothills of the Greater Khingan Mountains. (3) Regarding driving factors, the expansion of the sown area served as the primary internal driver of production growth. Meanwhile, external factors—including precipitation, cultivated land resources, regional economic development, comparative benefits of agriculture and soybeans, labor scale, mechanization level, fertilizer input, and fiscal expenditure—significantly influenced the production landscape.
Conclusion: Policy recommendations for optimizing the soybean production layouts in Inner Mongolia were proposed from the dimensions of consolidating the advantages of production areas, reinforcing technological innovation, deepening regional collaboration and optimizing fiscal mechanisms.
1 Introduction
Food security is of paramount national importance, and the low self-sufficiency rate of soybeans currently represents a significant shortcoming in China’s food security system (Chen, 2020; Wang et al., 2023; Niu et al., 2021). As a primary source of dietary protein, a key repository of plant-based oils, and a fundamental feedstock for livestock breeding, soybeans encapsulate the triple-value proposition as a “food-oil-feed” commodity, thus serving as fundamental materials underpinning national livelihoods and strategic resources safeguarding food security. However, turbulent geopolitical landscapes, resurgent anti-globalization trade protectionism, and escalating tariff barriers have exacerbated fluctuations in the international food market in recent years (Zhu et al., 2021), consequently, soybean production in China is confronted with systemic challenges in sustainable cultivation and stable supply. Specifically, on the production side, low yields and insufficient profitability impede endogenous development (Wang et al., 2024); on the consumption side, supply fragility is highlighted by an import dependency rate exceeding 80% (Wei et al., 2021); and on the trade side, China occupies a subordinate market position characterized by “global procurement without pricing power” (Xiao et al., 2015).
Scientific and rational planning of the soybean production patterns is of great significance for stabilizing and increasing soybean yields and consolidating the food security barrier (Cai and Tao, 2021; Feng et al., 2022; Yu et al., 2023). The Ministry of Agriculture and Rural Affairs of China, in the general requirements of the “14th Five-Year (2021–2025) National Planting Industry Development Plan,” explicitly identified “ensuring the security of grain supply” as the primary task. The plan advocates coordinated efforts to “guarantee quantity, diversity, and quality,” and to enhance grain production capacity and self-sufficiency by adjusting and optimizing industrial structure and regional layout. Furthermore, the State Council’s 2024 issuance of the “New Round of 50-Billion-Kilogram Grain Capacity Enhancement Action Plan (2024–2030)” designated soybeans as a core crop for capacity improvement, establishing a crop yield-increase strategy of “consolidate and boost staple grains, focus on corn and soybeans, and simultaneously consider potatoes and miscellaneous grains.” It intends to consolidate and upgrade advantageous production areas, adjust and optimize the grain production pattern, and strive to achieve the goal of an additional grain production capacity of over 50 billion kilograms by 2030. Thus, enhancing soybean production potential through the optimization of production patterns and structural adjustment has become an inevitable trend and a clear policy direction.
Understanding the spatial–temporal evolution patterns and influencing mechanisms of soybean production is a crucial theoretical foundation for scientifically optimizing its production structure and spatial pattern. In terms of temporal evolution characteristics of soybean production, scholars commonly rely on macro-level data and use descriptive statistical analysis to reveal dynamic trends in key indicators such as unit yield, sown area and total yield (Song et al., 2021; Liu et al., 2024a; Kong et al., 2024). In terms of spatial evolution characteristics of soybean production, quantitative methods such as the Gini coefficient, industrial concentration index, comparative advantage index, kernel density estimation, and standard deviational ellipse are employed to assess regional distribution characteristics and changes (Li et al., 2008, 2016; Clemente et al., 2017; Maltauro et al., 2025). Existing research indicates that the total soybean production of major global and regional producers generally shows a “fluctuating upward” trend (Zhang and Zhang, 2024; Li and He, 2024), with industrial patterns increasingly concentrating in advantageous regions (Yao et al., 2020; Wang et al., 2020; Zhang and Zhang, 2024). For instance, in-depth analysis of cases like the United States and China reveals that soybean production not only follows this fluctuating upward trend temporally but also exhibits significant spatial agglomeration and centroid shift characteristics—such as the sustained dominance of the U. S. Midwest (Yang et al., 2022) and the “Northeast concentration, Southwest diffusion” gradient pattern in China (Chen et al., 2022). Similarly, at the regional level, studies by scholars such as Chang et al. (2024) and Du et al. (2024) have revealed significant spatial agglomeration in soybean production patterns: a trend of gradual concentration i n the hilly areas of central Sichuan Province, and a notable northward concentrated trend of the soybean cultivation zone has been observed in Northeast China.
In terms of the influencing mechanisms of spatial pattern evolution, cutting-edge studies mostly adopt spatial econometric methods, focusing on comprehensive factors such as resources, economy, market, technology, and policies to examine the spatial spillover effects of soybean production (Chen et al., 2022; Chang et al., 2024). Prevailing studies agree that analyzing the spatial patterns of crop industries must fully consider spatial correlation between regions (Zhang et al., 2025; Shao et al., 2025), a concept theoretically rooted in Tobler’s First Law of Geography, which elaborates on the principle of spatial dependence. Geographically adjacent areas are interconnected through shared natural bases, farming practices, market links, and policy pathways (Huang et al., 2020), leading crop production systems to exhibit “similarity varying with distance” and resulting in significant positive or negative spatial spillovers. Spatial panel models can test whether spatial factors significantly influence the evolution of soybean production patterns. For example, Chen et al. (2022) applied ESDA and the spatial Durbin model to explore the spatial effects of soybean-production determinants, indicating strong positive spatial dependence in China’s soybean sector, and with decomposed spatial effects revealing that agricultural mechanization levels, soybean industry labor scale, agricultural comparative benefits, transportation accessibility, and urbanization levels in adjacent regions all had notable spillover effects on local soybean production. Similarly, Li and He (2024) utilized a dual fixed-effects spatial Durbin model to analyze the transition mechanism in China’s soybean production spatial pattern, confirmed that temperature, precipitation, urbanization, agricultural machinery power, technological inputs, and policy factors exerted significant localized and spillover effects on soybean production. These findings indicate that the formation of the spatial pattern of soybeans is not an isolated local phenomenon, but is embedded in the regional linkage mechanism and jointly shaped by cross-regional economic, social and natural conditions.
While the aforementioned studies have laid a solid foundation regarding the spatial–temporal evolution patterns and spatial driving mechanisms of soybean production, and methodologies have evolved from traditional descriptive analysis to more quantitative spatial econometric approaches with increasing emphasis on spatial correlation and causal explanation. However, significant research gaps remains: (1) Current analyses of soybean production patterns in ecologically fragile arid and semi-arid regions continue to be insufficient;(2) When examining the driving mechanisms of soybean production pattern evolution, existing studies have not clearly distinguished between internal factors (indicators such as unit yield and sown area) and external factors (indicators such as natural conditions, market dynamics, and policies). Inner Mongolia, as a traditional soybean production stronghold in China, maintains its dominant position in national soybean production by virtue of its unique resource endowments and competitive advantages in large-scale cultivation. Statistics show that in 2024, Inner Mongolia’s soybean sown area reached 1.2688 million hectares (accounting for 12.5% of China’s total sown area) (Li et al., 2025) and its yield reached 2.481 million tons (accounting for 12.0% of China’s total yield) (People’s Government of the Inner Mongolia Autonomous Region, 2025), ranking it as the second-largest provincial-level soybean production unit in China. Against this backdrop, the article took Inner Mongolia—a representative semi-arid region—as the research area and constructed a “temporal–spatial–mechanism” analytical framework to clarify the evolutionary trends of county-level soybean production patterns and the driving mechanisms, further providing theoretically grounded and policy-relevant insights for optimizing regional soybean production layouts and enhancing agricultural productivity in Inner Mongolia.
2 Materials and methods
2.1 Overview of the study area
Known as the “Northern Granary,” the Inner Mongolia Autonomous Region is located between 37°24′N–53°23′N and 97°12′E–126°04′E, straddling three major geographic regions—Northeast China, North China, and Northwest China. The region’s topography is dominated by three mountain ranges (the Greater Khingan, Yin Mountains, and Helan Mountains) and the Inner Mongolian Plateau, which collectively shape three distinctive agricultural zones—the northeast black soil belt, the Hetao irrigation district, and the dryland farming zone north of the Yin Mountains.
As a critical grain production base and the core area of China’s “Northern Grain to Southern China” strategy, Inner Mongolia has maintained an annual grain output exceeding 35 million tons for five consecutive years (historically surpassing 40 million tons in 2024) with an annual grain outflow of nearly 25 million tons (Inner Mongolia Autonomous Region Committee, 2024). The region’s premium soybean cultivation belt is concentrated in the four eastern leagues or cities: Hulunbuir, Xing’an, Tongliao, and Chifeng, contributing over 90% of the region’s total sown area and yield. In particular, the non-genetically modified high-protein soybeans in Hulunbuir and Xing’an have a protein content of over 42%, establishing a strategic reserve base for high-end soybean raw materials. Morin Dawa Daur Autonomous Banner, known as the county-level “Soybean Capital,” has ranked first in soybean yield among all counties nationwide for many years. In 2019, “Morin Dawa Soybeans” was certified as a national geographical indication product, establishing a benchmark for China’s premium non-GMO soybean production.
2.2 Data sources and processing
The data employed in this study constitute a spatial panel dataset spanning the period from 2002 to 2022, covering 103 county-level administrative units in Inner Mongolia. The county-level research system encompassed the entire territorial scope of urban districts, county-level cities, banners, counties, and autonomous banners. The core production data, including soybean yield and planting area, were derived from the Inner Mongolia Survey Yearbook and the Inner Mongolia Economic and Social Survey Yearbook. Attribute indicators, including socioeconomic conditions, agricultural production conditions, and fiscal expenditure were collated from the China Regional Economic Statistical Yearbook, the China County Statistical Yearbook, and statistical yearbooks of various prefectures and cities in Inner Mongolia. Meteorological indicators such as monthly precipitation and temperature were extracted from the standardized grid dataset released by the National Tibetan Plateau Data Center. Spatial vector data of county-level administrative divisions were obtained from the National Fundamental Geographic Information System Database. Moreover, the research employed systematic linear interpolation to address partial missing values in the dataset, and conducted natural logarithmic transformation on all continuous variables to effectively mitigate potential heteroscedasticity.
2.3 Research methods
2.3.1 Logarithmic mean divisia index
The Logarithmic Mean Divisia Index (LMDI) method, recognized as a classic approach in the field of factor decomposition analysis, employs a residual-free mathematical model to disaggregate changes in total indicators into contributions from multiple driving factors. It is widely applied in areas such as energy consumption, carbon emissions, and economic growth. Drawing on the methodological frameworks (Liu et al., 2014a; Liu et al., 2014b) established in the literature, this study employed LMDI to quantitatively analyze the main factors contributing to changes in soybean yield and their differential impacts. The core value of this model lies in its ability to decompose changes in total output into contributions from two independent factors: unit yield variation (yield effect) and sown area variation (area effect), thereby clearly determining their respective influence. The core specification is shown in Equation 1:
In the formula, ΔY signifies the total change in soybean output over the study period (t); ΔYA and ΔYS respectively denote the contributions of the unit yield effect and the area effect to the change in total yield (t); Yt0 and Yt1 refer to soybean outputs at the beginning and end of the study period (t); At0 and At1 refer to unit yield at the beginning and end of the study period (kg/hm2); St0 and St1 refer to sown area at the beginning and end of the study period (hm2).
2.3.2 Spatial Gini coefficient
The Gini coefficient was originally developed to measure the equity of income distribution, and has been extended to serve as a key indicator reflecting the spatial agglomeration degree of specific industries. Drawing on the calculation method proposed by Zhang (2007), the research adapted the spatial Gini (GINI) coefficient to characterize the imbalance in the spatial distribution of county-level soybean production in Inner Mongolia. The coefficient ranges between [0, 1], where a higher value indicates a more pronounced spatial agglomeration of soybean production. The specific formula is shown in Equation 2:
In the formula, GINI denotes the spatial Gini coefficient for county-level soybean production in Inner Mongolia; n represents the number of groups based on the ranking of soybean production, which means that all county-level units are ranked by soybean yield in ascending order and then divided into 34 groups using a grouping method (n = 34); Wi is the proportion of cumulative soybean yield from group 1 to group i relative to the total soybean yield of all counties (%).
2.3.3 Industry concentration index
The Gini coefficient has certain limitations in terms of geographical unit setting and industrial classification (Pu, 2011), necessitating the integration of the geographical concentration (industry concentration) index to comprehensively analyze the spatial characteristics of a specified industry. The industrial concentration index (CRₙ) quantifies the cumulative market share (e.g., output, output value, sales volume, etc.) occupied by the top n regions or enterprises in the relevant market of a certain industry. Its index ranges from [0, 1], where larger numbers signify more robust spatial agglomeration. The research introduced the industry concentration index to analyze the agglomeration characteristics of county-level soybean production in Inner Mongolia, and the specific calculation formula is shown in Equation 3:
In the formula, CRₙ represents the spatial concentration degree of soybean production; Y represents the total soybean yield of the province (t); Yi denotes the soybean yield of the i-th county (t); reflects the proportion of the total provincial soybean yield contributed by the top n counties; n is the number of selected top-producing counties (in this research, the top 3, 5, and 10 counties were selected, n = 3, 5, or 10).
2.3.4 Gravity center migration model
The gravity center migration model is employed to quantitatively characterize the spatial agglomeration and dynamic shifts of production factors during regional development. The research utilized the gravity center migration model to simulate the gravity center coordinates and spatial migration trajectories of soybean production in Inner Mongolia across different years. The production gravity center represents the spatial centroid of regional soybean production factors within a given period, where migration direction indicates regional production concentration trends and migration distance reflects the magnitude of changes in production equilibrium. The specific calculation formulas are shown in Equations 4–6:
In the formulas, (Xt, Y t ) denote the coordinates of the spatial distribution gravity center Gt of soybean production in year t; xi and yi, respectively, represent the longitude and latitude of the geographical center of county i (°); pit is the observed value of actual soybean yield of county i in year t; n is the total number of county-level units; Dt-k is the actual migration distance of the gravity center from year t to year k (km); c is the conversion coefficient for spherical distance, with a value of 111.111 km.
2.3.5 Spatial autocorrelation test
Spatial autocorrelation analysis is applied to examine whether a spatial phenomenon is significantly associated with the attribute values of its adjacent units in the geographic space. Global spatial autocorrelation reveals the degree of spatial association and differentiation across the entire region, and local spatial autocorrelation describes the heterogeneity characteristics of geographic phenomena within localized areas. In this study, Moran’s I was selected to examine the spatial autocorrelation of soybean production in the counties of Inner Mongolia. Moran’s I ranges between −1 and 1: a positive value indicates positive spatial autocorrelation, a negative value indicates negative autocorrelation, and the magnitude of |I| reflects the strength of the spatial association. The formulas are shown in Equations 7–9:
In the formulas, Global Moran’s I denotes the global Moran index, Local Moran’s I denotes the local Moran index; n is the number of county units, xi and xj, respectively, represent the observed soybean yields in counties i and j; is the mean of the observed values (t), S2represents the sample variance (t2); wijis the (i,j) element of the spatial weight matrix for the county-level units in the study area.
2.3.6 Spatial Durbin model
When the observed attribute values between regions exhibit significant spatial correlation characteristics, the traditional panel OLS regression method fails to account for the spatial correlation among geographical units. By contrast, the core of spatial panel models lies in characterizing the correlation mechanisms between regions through spatial lag terms or error term structures. It mainly includes the spatial Durbin model (SDM), spatial lag model (SLM), and spatial error model (SEM). The SLM incorporates the spatial lag of the dependent variable, the SEM includes the spa-tial lag of the error term, while the SDM integrates both the spatial lags of the dependent and independent variables as well as the spatially autoregressive error term. The SDM provides a more comprehensive framework for capturing interactive effects among spatial units and unobserved spatial heterogeneity, and it is the specific model capable of simultaneously estimating both local direct effects and spatial spillover effects. This study initially constructs the SDM of soybean yield influencing factors, and subsequently determines whether the SDM can be degenerated into SEM or SLM through statistical tests. The general form of the model is shown in Equation 10:
In the formulas, Yit stands for the soybean yield in region i during period t (t); Xit represents various factors affecting soybean yield; Wij signifies the adjacency spatial weight matrix; ρ denotes the spatial autoregressive coefficient of the dependent variable, capturing the spillover effects of soybean production in neighboring counties on local soybean production; β represents the regression coefficient of the independent variables, reflecting the direct impact of local factors on local soybean production; γ indicates the spatial lag coefficient of the independent variables, measuring the indirect influence of independent variables from neighboring counties on local soybean production. μi and vt represent individual effects and time effects; ϵit is the random error term. Equation 10 characterizes the relationship between local soybean production (Yit) and soybean production in neighboring counties (∑WijYit), local influencing factors (Xit, such as cultivated area and mechanization level), as well as influencing factors from neighboring counties (∑WijXit).
3 Results and analysis
3.1 Temporal evolution characteristics of soybean production
3.1.1 Production trend analysis
Generally, the sown area, total yield, and unit yield of soybeans in Inner Mongolia from 2002 to 2022 exhibited an overall upward trend with fluctuations. As illustrated in Figure 1, total soybean yield increased from 964,000 tons in 2002 to 2,454,000 tons in 2022, with a total growth of 155% and an average annual growth rate of 4.73%. Notably, the output hit periodic lows in 2003, 2007, and 2014, entered a period of rapid growth after 2017, exceeded 2,347,000 tons in 2020, and reached a peak in 2022. The sown area expanded from 596,000 hectares in 2002 to 1,222,000 hectares in 2022, with a total growth of 105% and an average annual growth rate of 3.65%. Notably, the area fluctuated frequently in the early period from 2002 to 2014, rebounded rapidly after hitting the lowest point in 2014, and grew by 23.6% from 2017 to 2022. The unit yield rose from 1,616 kg/ha in 2002 to 2,008 kg/ha in 2022, with a total growth of 24% and an average annual growth rate of only 1.09%. Notably, the unit yield peaked in 2013 at 2,121 kg/ha and then steadied within the range of 1,600–2,000 kg/ha after 2014 as a result of advancements in agricultural technology.
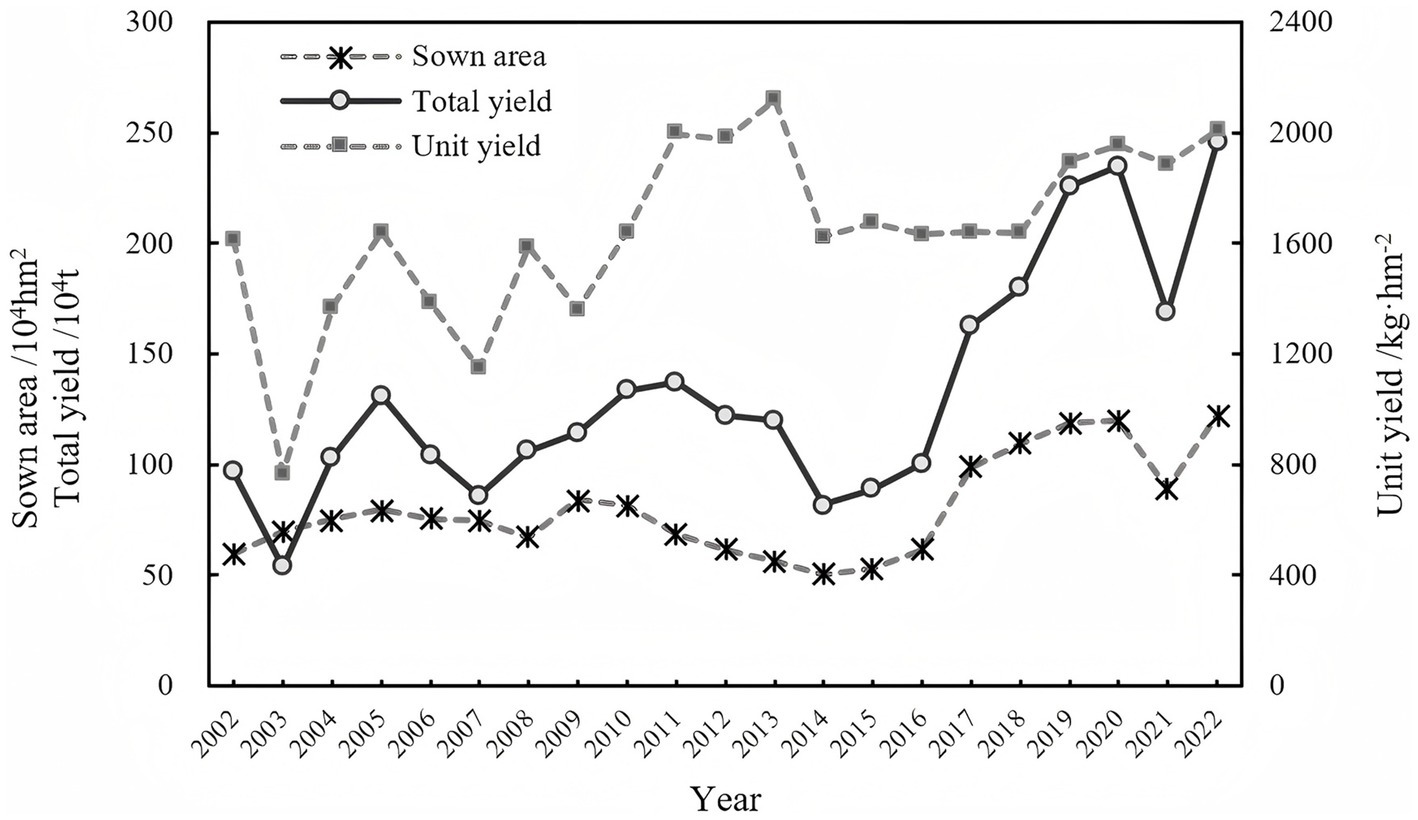
Figure 1. Trends in total yield, sown area, and unit yield of soybeans in Inner Mongolia.
Specifically, soybean yield in Inner Mongolia from 2002 to 2022 exhibited distinct phased characteristics, which can be summarized as “fluctuating adjustment–yield breakthrough–scale expansion–transformation and optimization.” ① Fluctuating Adjustment Period (2002–2007): The sown area fluctuated but showed an overall increase (596,000–747,000 hectares), while unit yield experienced sharp volatility (1,616–1,147 kg/ha). In 2003, the unit yield plummeted to 769 kg/ha due to severe drought in Inner Mongolia, resulting in a 30% crop failure rate for soybeans. ② Yield Improvement Period (2008–2013): The sown area initially rose before declining (668,000–564,000 hectares), but unit yield significantly increased (1,362–2,121 kg/ha). From 2011 to 2013, yields consistently exceeded 1,900 kg/ha and reached a historical high of 2,121 kg/ha in 2013, clearly demonstrating the effectiveness of technological advancements. ③ Scale Expansion Period (2014–2020): The sown area expanded dramatically (504,000–1.202 million hectares), while the unit yield stabilized before showing an upward trend (1,600–1,953 kg/ha). The most rapid expansion occurred between 2016 and 2018, which prompted a shift from corn to soybeans in the “Liandawan” regions driven by the national policy to abolish temporary corn reserves. ④ Transformation and Optimization Period (2021–2022): The sown area initially declined before rebounding sharply, exhibiting a pronounced “V-shaped” trend, while unit yield achieved a new phased breakthrough. The area briefly shrank to 893,000 hectares in 2021, but it rebounded to 1.222 million hectares in 2022 with the unit yield surpassing 2,000 kg/ha. It highlights the current development path of the soybean industry with the dual-oriented goals of scale expansion and quality improvement.
3.1.2 Decomposition of yield growth effect
The evolutionary characteristics of soybean production in Inner Mongolia—“fluctuating adjustment–yield breakthrough–scale expansion–transformation and optimization”—indicate that its production pattern is undergoing a temporal evolution from being yield-driven to area-driven. This led us to consider whether other quantitative analysis methods could be used to deeply verify these phased characteristics of soybean production. Based on this, our study adopts the LMDI model, following the previously defined time periods, aiming to accurately analyze the differences in the contributions of sown area and unit yield to the soybean production increase in Inner Mongolia, verify the dominant driver type (yield-dominated or area-dominated) in each stage, and ultimately clarify the intrinsic drivers behind soybean yield changes.
Area expansion has emerged as the primary driver of soybean production growth in Inner Mongolia. The LMDI model was further employed to decompose the contributions of sown area and unit yield to the increase of soybean production in Inner Mongolia. The results are shown in Table 1. ① 2002–2007: Yield decline dominated output reduction. Total production decreased by 106,798 tons. Although the expansion of sown area contributed to an increase of 205,170 tons (accounting for −192.11% of the total change, with the negative sign indicating an opposite direction to the total output change), the decline in unit yield led to a loss of 311,968 tons (accounting for 292.11% of the total change). The strong inhibitory effect of yield decline offset the positive pull from area expansion, ultimately resulting in a decrease in total output. ② 2008–2013: Unit yield improvement Reversed the output trend. Total production increased by 136,094 tons. Although the reduction in sown area caused a loss of 190,124 tons (accounting for −139.70% of the total change), the increase in unit yield contributed 326,218 tons (accounting for 239.70% of the total change). The positive effect of unit yield growth not only offset the negative impact of area reduction but also drove total output from decline to growth, making “unit yield improvement” the core driver of production increase in this stage. ③ 2014–2020: Area expansion dominated output growth. Total production increased significantly by 1,528,402 tons. The expansion of sown area contributed 1,262,141 tons (accounting for 82.58% of the total change), while unit yield improvement contributed only 266,261 tons (accounting for 17.42%). The contribution of area expansion far exceeded that of unit yield, marking a shift toward an “area-dominated” growth pattern. ④ 2021–2022: Continuation of the area-dominated pattern. Total production increased by 768,948 tons. The expansion of sown area contributed 641,229 tons (accounting for 83.39% of the total change), while unit yield improvement contributed 127,719 tons (accounting for 16.61%). The dominant role of area expansion continued to strengthen, remaining the key driver of steady output growth. The analysis of phased characteristics indicates that the early period (2002–2013) was a stage dominated by fluctuations in unit yield, with changes in production primarily dependent on agricultural technological improvements and climate adaptability enhancements. In contrast, the later period (2014–2022) shifted to a stage dominated by sown area expansion, with adjustments in planting scale under policy regulation becoming the decisive factor. In summary, the decomposition results of factors contributing to soybean yield increase verify that the soybean production system in Inner Mongolia has transformed from being unit-yield-driven (the second phase of yield improvement) to area-driven (the third phase of area expansion). Meanwhile, it reflects that the current expansion of planting scale has become the core internal driver promoting the growth of regional soybean output.
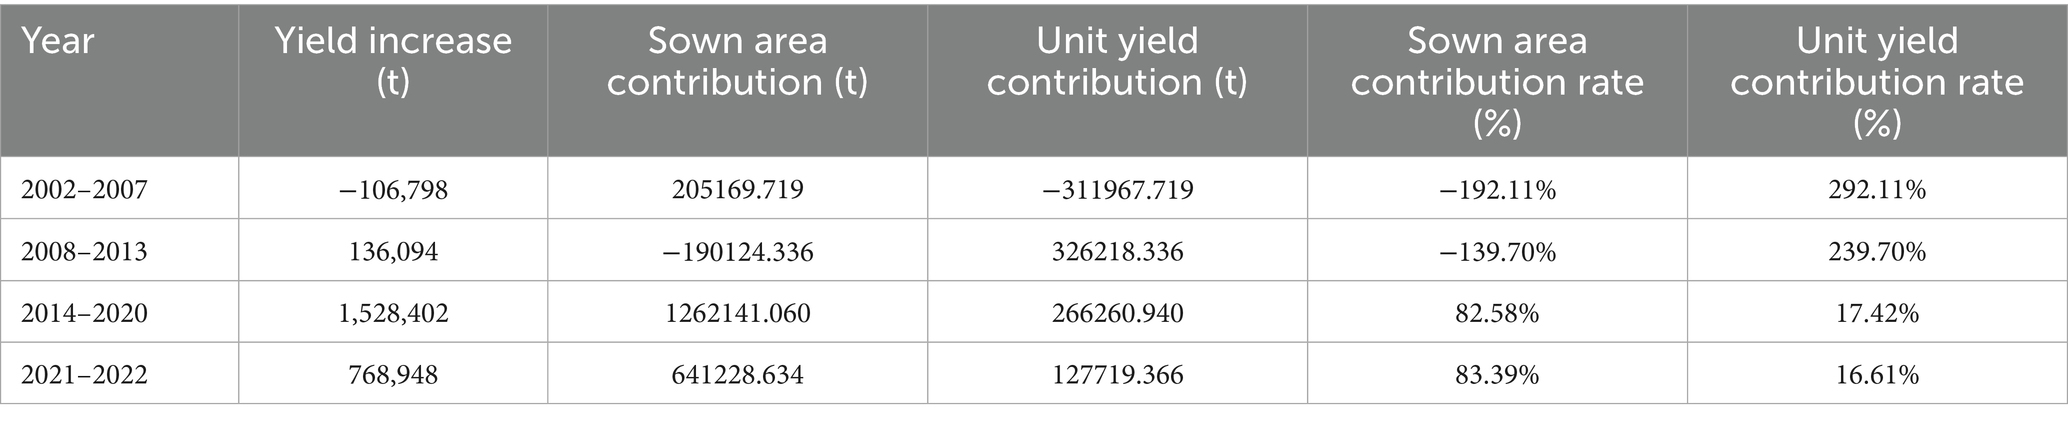
Table 1. Decomposition results of factors for increased soybean production.
3.2 Spatial differentiation characteristics of soybean production
3.2.1 Regional disparity analysis
The spatial distribution of soybean production in Inner Mongolia exhibited a distinct pattern characterized by “eastern concentration and central-western diffusion.” Based on natural resource endowments and crop cultivation practices, the agricultural areas of Inner Mongolia can be divided into three distinct production zones: eastern, central, and western. Figure 2 illustrates their respective contribution ratios to the total provincial yield, revealing significant geographical disparities in soybean production. ① The eastern region had maintained overwhelming dominance in soybean production, consistently accounting for over 90% of the regional yield in all years. The southern areas of Tongliao and Chifeng, the northern regions of Xing’an League and Hulunbuir, and the southern foot of the Greater Khingan Mountains agricultural belt constitute a geographic extension of the Songnen Plain. These regions benefited from fertile chernozem soils and an annual precipitation of 400–500 mm, creating naturally favorable conditions for soybean cultivation. Furthermore, the systematic adoption of modern “large-scale farming” models from Heilongjiang’s agricultural reclamation system had facilitated contiguous, scaled soybean cultivation, consolidating the eastern region’s position as the “ballast stone” of Inner Mongolia’s soybean production. ② The production bases in the central and western regions were comparatively small, but had experienced notable growth in recent years. The western region featured “punctiform breakthroughs” in production expansion, and the central region displayed “gradual penetration,” collectively forming a “central-western collaborative diffusion” pattern. Despite this diffusion trend, their combined contribution to the total provincial yield remained below 5%, highlighting the rigid constraints of natural conditions: arid and rainless climates in the west and fragmented land plots in the central region restricted large-scale contiguous soybean cultivation. Therefore, soybean production in Inner Mongolia remained centered on large-scale cultivation in the eastern plains, supplemented by characteristic production in the central-western regions, forming a diversified spatial pattern of “eastern concentration and central-western diffusion.”
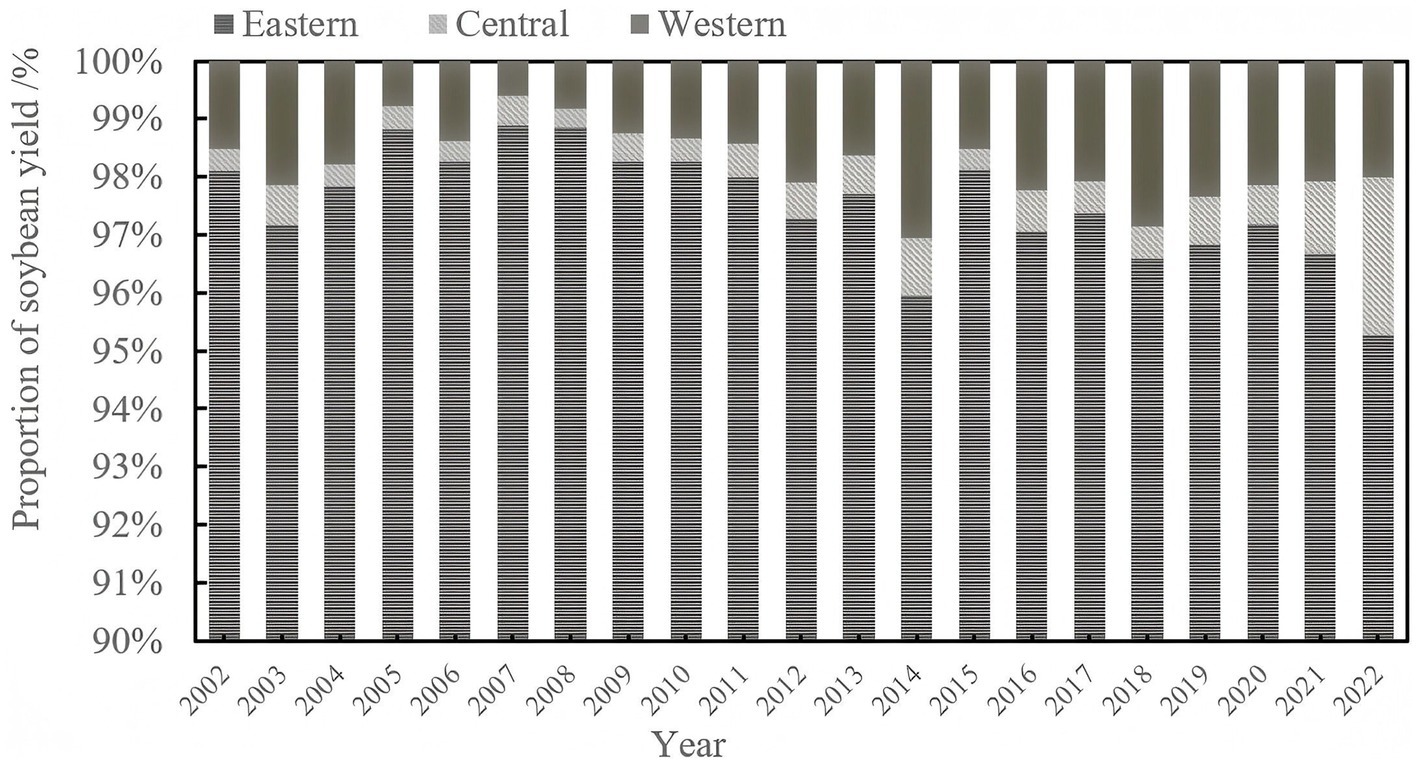
Figure 2. Proportion of soybean yield in eastern, central and western production areas in Inner Mongolia.
3.2.2 Spatial agglomeration analysis
Soybean production in Inner Mongolia exhibited a core characteristic of “long-term high agglomeration.” The changing trend of the overall agglomeration degree of Inner Mongolia’s soybean production space is shown in Figure 3. The spatial Gini coefficient (GINI) presented an overall fluctuating and slightly decreasing trend (from 0.932 to 0.906), yet it has consistently remained within the range of (0.889, 0.949)—significantly higher than conventional thresholds for industrial spatial agglomeration. Meanwhile, the industry concentration index (CR5) displayed more pronounced fluctuations, dropping to 0.661 in 2003 and peaking at 0.928 in 2015, yet generally stabilizing around or above 0.8 in most years. The changing trends of GINI and CR5 reflected periodic strengthening and weakening adjustments in the spatial agglomeration degree of soybean production, indicating a dynamic process of production factor concentration and dispersion across different years, highlighting the flexible characteristics of industrial spatial organization. Importantly, the persistently high-level thresholds confirm that regional production remained markedly centralized—Even with notable variability, the fundamental pattern of high agglomeration had remained intact. The mutually corroborating results from GINI and CR5 measurements collectively demonstrate that Inner Mongolia’s soybean production was characterized by “long-term high agglomeration with periodic fluctuations.” This pattern reflects the concentration of production factors and output in specific regions, forming a stable agglomeration configuration that embodies the spatial centralization and large-scale nature in the production space.
Figure 3. Variation trend of spatial agglomeration degree of soybean production in Inner Mongolia.
Soybean production in Inner Mongolia has formed a clustered development characteristic with Morin Dawa Daur Autonomous Banner, Arun Banner, and Oroqen Autonomous Banner as core production regions. Table 2 presents the spatial concentration indices and changes in core production areas across key years. ①Morin Dawa Banner had maintained its leading position in soybean production for 20 consecutive years, with an average contribution rate of 26.4%. Morin Dawa Daur Autonomous Banner, Arun Banner, and Oroqen Autonomous Banner constituted a stable “iron triangle” production cluster with a cumulative contribution consistently remaining above 50%, forming a core growth pole for industrial development and playing a “strong driving” force in the soybean industry. Morin Dawa Banner has a contiguous black soil belt of 386,000 hectares, featuring high soil organic matter content and strong water and fertilizer retention capacity. This lays an irreplaceable natural foundation for the high and stable yield of soybeans, forming a strengthening cycle of “black soil resources–large-scale operation –technological progress and policy preference–sustained leading yield.” Essentially, Morin Dawa Banner is a resource-driven stable growth pole, whose leading position is determined by immobile factor endowments. ②The composition of secondary production areas (ranks 5–10) showed notable dynamism, with frequent entry and exit of counties such as Horqin Right Front Banner, Jalaid Banner, and Naiman Banner. For example, Bairin Left Banner appeared in the top 10 in 2002, 2012, and 2022, but dropped out in 2007 and 2017, while Ongniud Banner entered the top 10 for the first time in 2022. These shifts indicate the expansion and contraction of production scales in peripheral regions, which reflects dynamic replacement of “peripheral” production zones. Ongniud Banner’s recent rise can be attributed to focused efforts on enhancing soybean production capacity. First, it has actively promoted the precision regulation model of integrated water and fertilizer management for the entire soybean growth cycle, adopting a fertilization method that combines base fertilizer with 1–2 rounds of topdressing. This improved field management practice enhanced water and fertilizer use efficiency, significantly increasing land productivity. Second, the Ongniud Banner Bureau of Agriculture and Animal Husbandry continued to vigorously extend the soybean-maize strip intercropping model, achieving the dual objective of maintaining maize yield while increasing soybean production. A comprehensive comparative analysis of the CR₃, CR₅, CR₁₀ indices and changes in core producing areas shows that the core advantageous counties (Morin Dawa Daur Autonomous Banner, Arun Banner, and Oroqen Autonomous Banner) had formed stable growth poles for soybean production, while secondary counties (e.g., Zhalantun City, Barin Left Banner, Wengniute Banner, and Kailu County) realized a regulatory mechanism for production buffer through dynamic replacement. Thus, these patterns constitute a structural characteristic of “strong driving by core advantageous counties and stable support by secondary counties.”
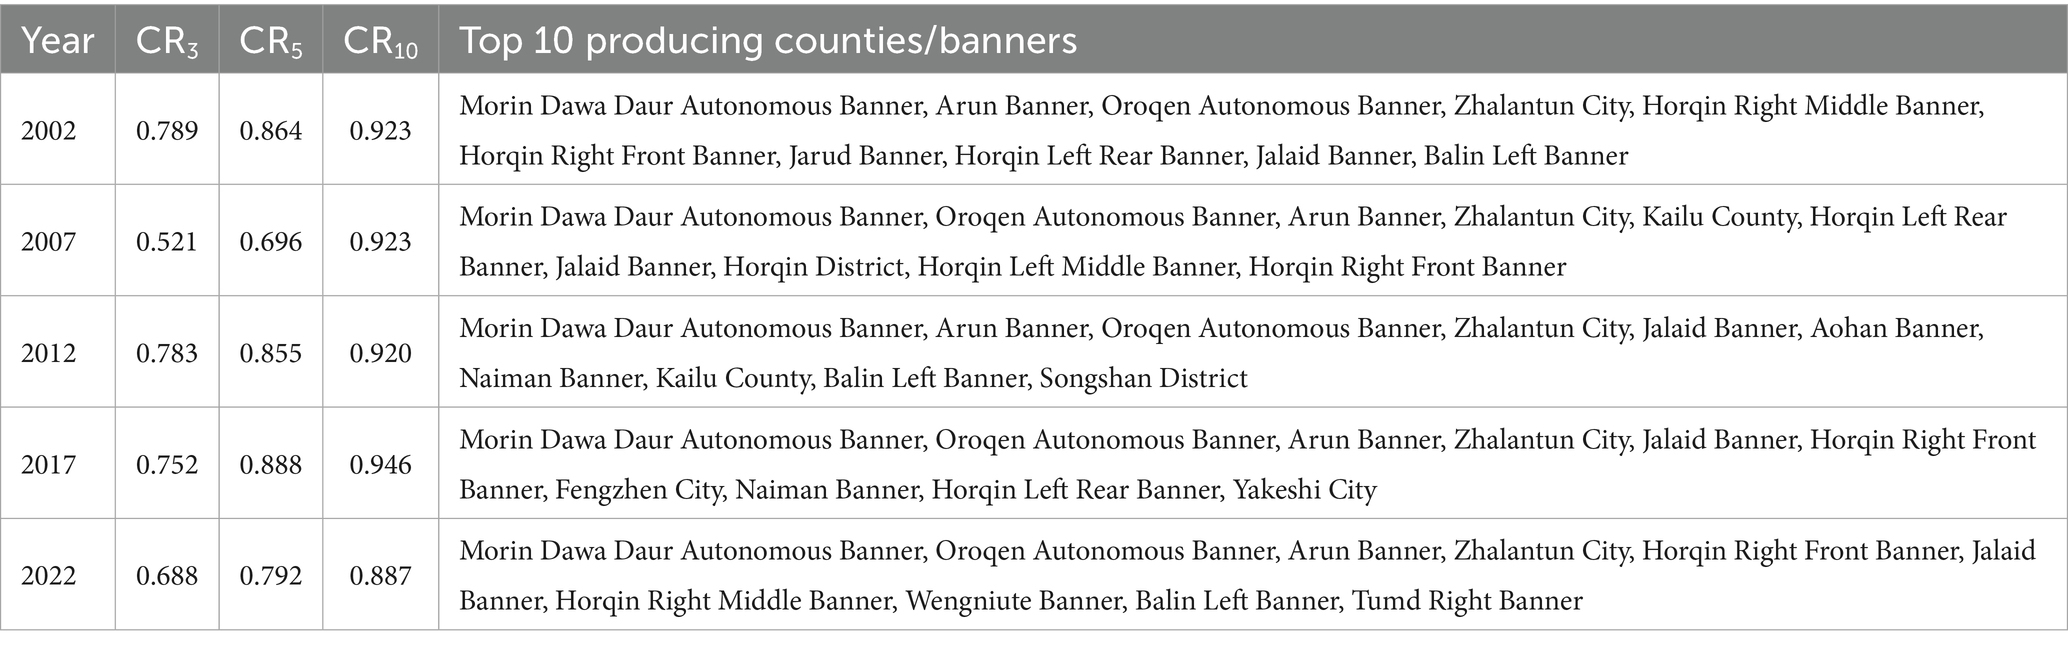
Table 2. Spatial concentration of soybean production and distribution of major production areas in major years.
3.2.3 Gravity center migration analysis
The gravity center of soybean yield in Inner Mongolia presents the migration characteristics of “pronounced north–south oscillation, minor east–west adjustment.” In this study, spatial modeling and trajectory visualization were conducted on the gravity center of county-level soybean yield in Inner Mongolia from 2002 to 2022, and the results are detailed in Table 3 and Figure 4. From the analysis of the displacement amplitude of the gravity center, the latitudinal variation range reached 1.473° (47.214°N-48.615°N) corresponding to a north–south span of about 163 kilometers, the longitude fluctuation was only 0.579°(122.635°N -123.214°N) corresponding to an east–west span of about 55 kilometers, which demonstrates obvious migration characteristics dominated by the north–south direction. In terms of different time periods, from 2002 to 2007, the gravity center of soybean yield shifted significantly to the southwest, migrating from Arun Banner to Jalaid Banner with a moving distance of 125.956 km to the south west at an average annual movement of 25.191 km. The large migration amplitude during this period may be related to the development of marginal land driven by the rise in international soybean prices. From 2007 to 2012, the gravity center of soybean yield showed a significant reverse return characteristic, moving back to Arun Banner in the north-east direction with a moving distance of 118.231 kilometers at an average annual movement of 23.646 kilometers. The reverse migration characteristic reflects the guidance of policy regulation on the stabilization of production capacity. From 2012 to 2017, the gravity changed by a smaller margin, moving slightly 43.569 kilometers in the north-west direction within Arun Banner at an average annual movement of 8.714 kilometers. The smallest migration amplitude during this phase is likely attributable to the restriction of expansion by the protective tillage system for black soil. From 2017 to 2022, the gravity center shifted significantly to the southwest again, moving 91.016 kilometers to Zhalantun City in the south-west direction at an average annual movement of 18.203 kilometers. The gravity center position reached the northernmost end during the research period, possibly linked to the northward expansion of the accumulated temperature zone in Northeast China. With regard to the change region of gravity center, the regions involved in the gravity center were all located in the agricultural belt on the eastern foot of the Greater Khingan Mountains, forming a dynamic triangle around Arun Banner, Jalaid Banner, and Zhalantun City. A complete closed loop of “Arun Banner–Jalaid Banner–Arun Banner” was presented from 2002 to 2012, and then a new path of “Arun Banner-Zhalantun City” was formed from 2012 to 2022. In conclusion, the soybean production gravity center in Inner Mongolia during 2002–2022 demonstrated significant spatial heterogeneity. The dynamic trajectory was mainly confined to the core area of the eastern Greater Khingan agricultural belt—the triangular region formed by Arun Banner, Jalaid Banner, and Zhalantun City. The overall trajectory of the gravity center showed the evolutionary characteristics by pronounced north–south fluctuations and relative east–west stability.
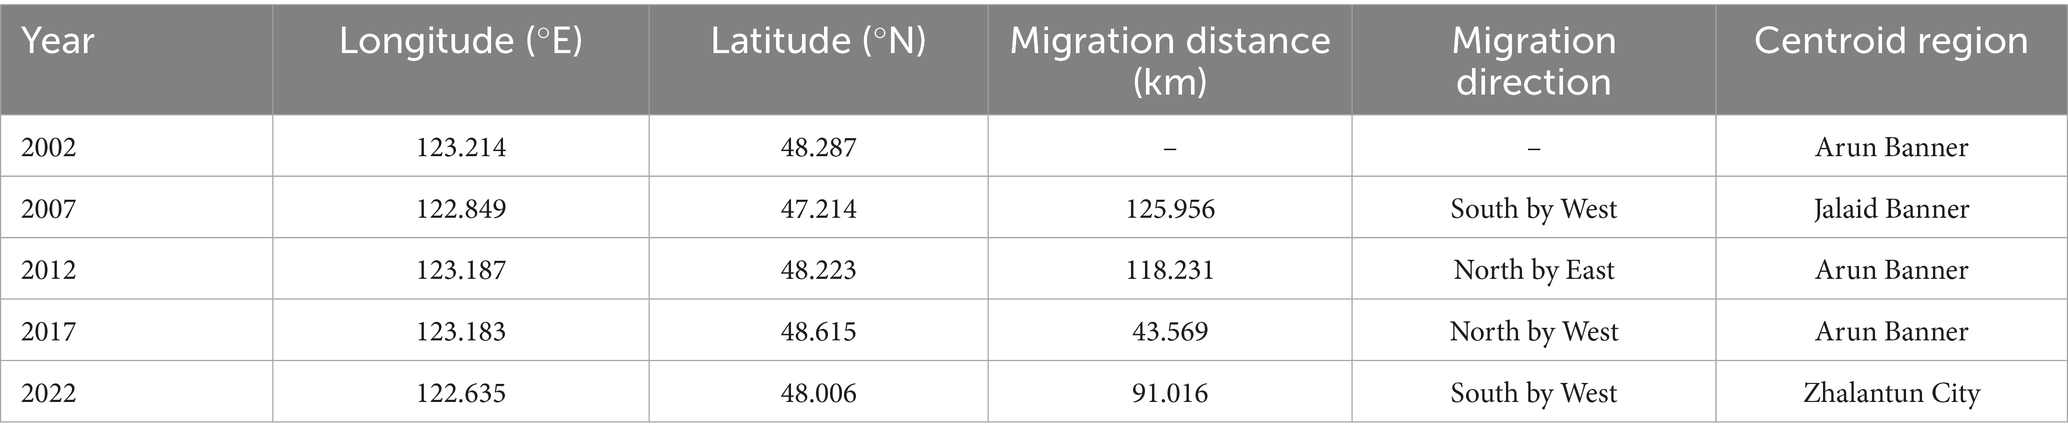
Table 3. Changes in gravity center migration of soybean yield in Inner Mongolia.
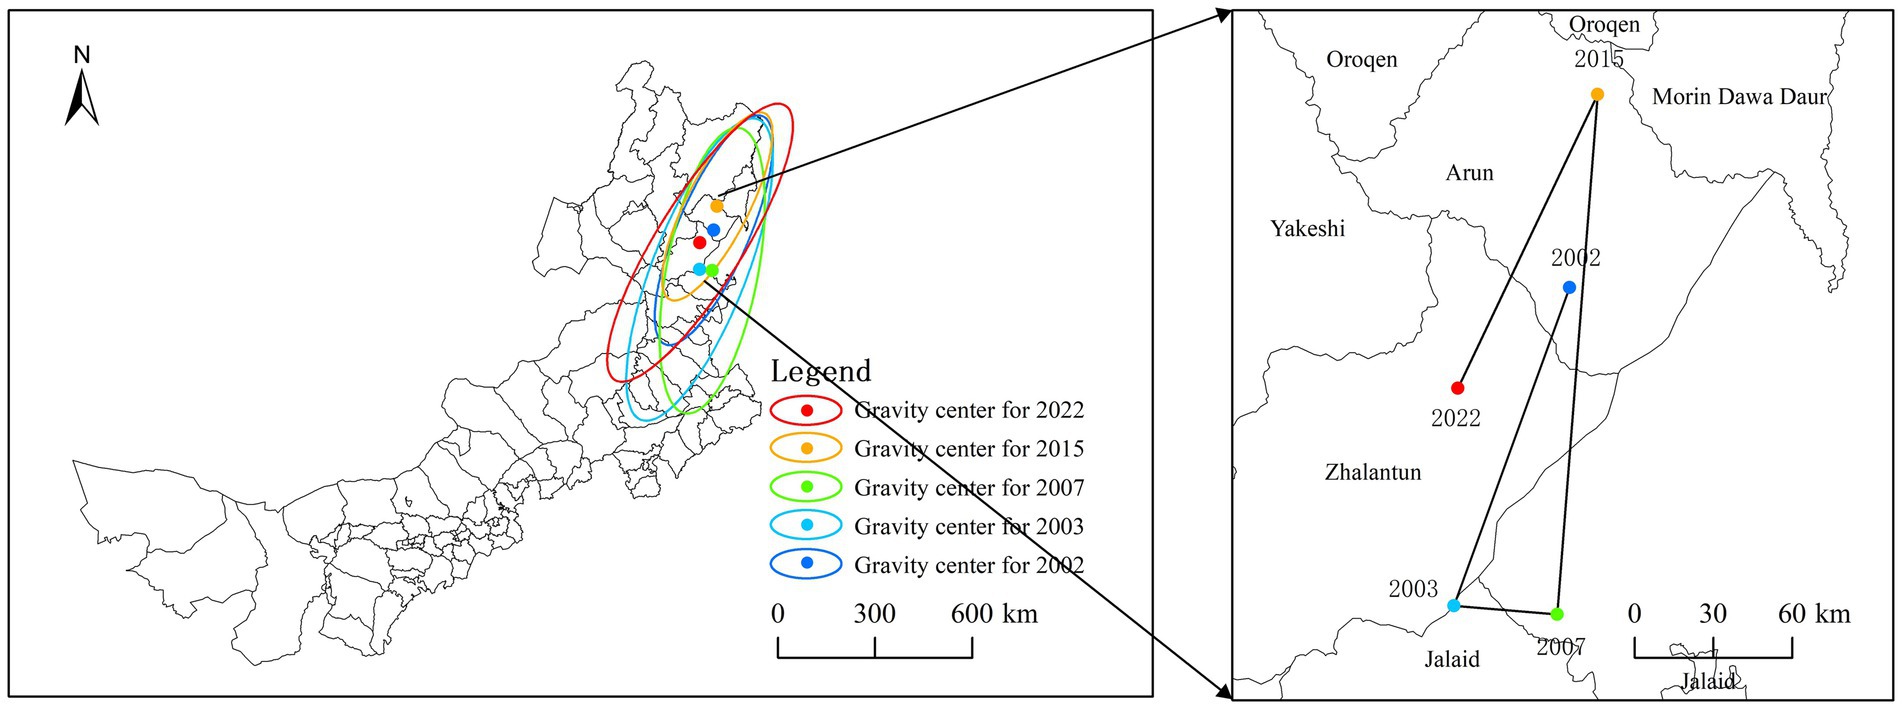
Figure 4. Migration trajectory of soybean yield gravity center in Inner Mongolia.
3.3 Driving mechanism of soybean production patterns
3.3.1 Theoretical mechanism
Soybean production is a complex open system shaped by the interaction of external natural and human factors such as water, soil, climate, land, capital, technology, labor, market and policies (Tu et al., 2022). The evolution of its pattern follows the four-dimensional synergistic mechanism of “natural constraint-market dominance-factor empowerment-policy regulation,” exhibiting a transition from “natural constraint dominance” to “technology-policy-market collaborative drive” (Figure 5).
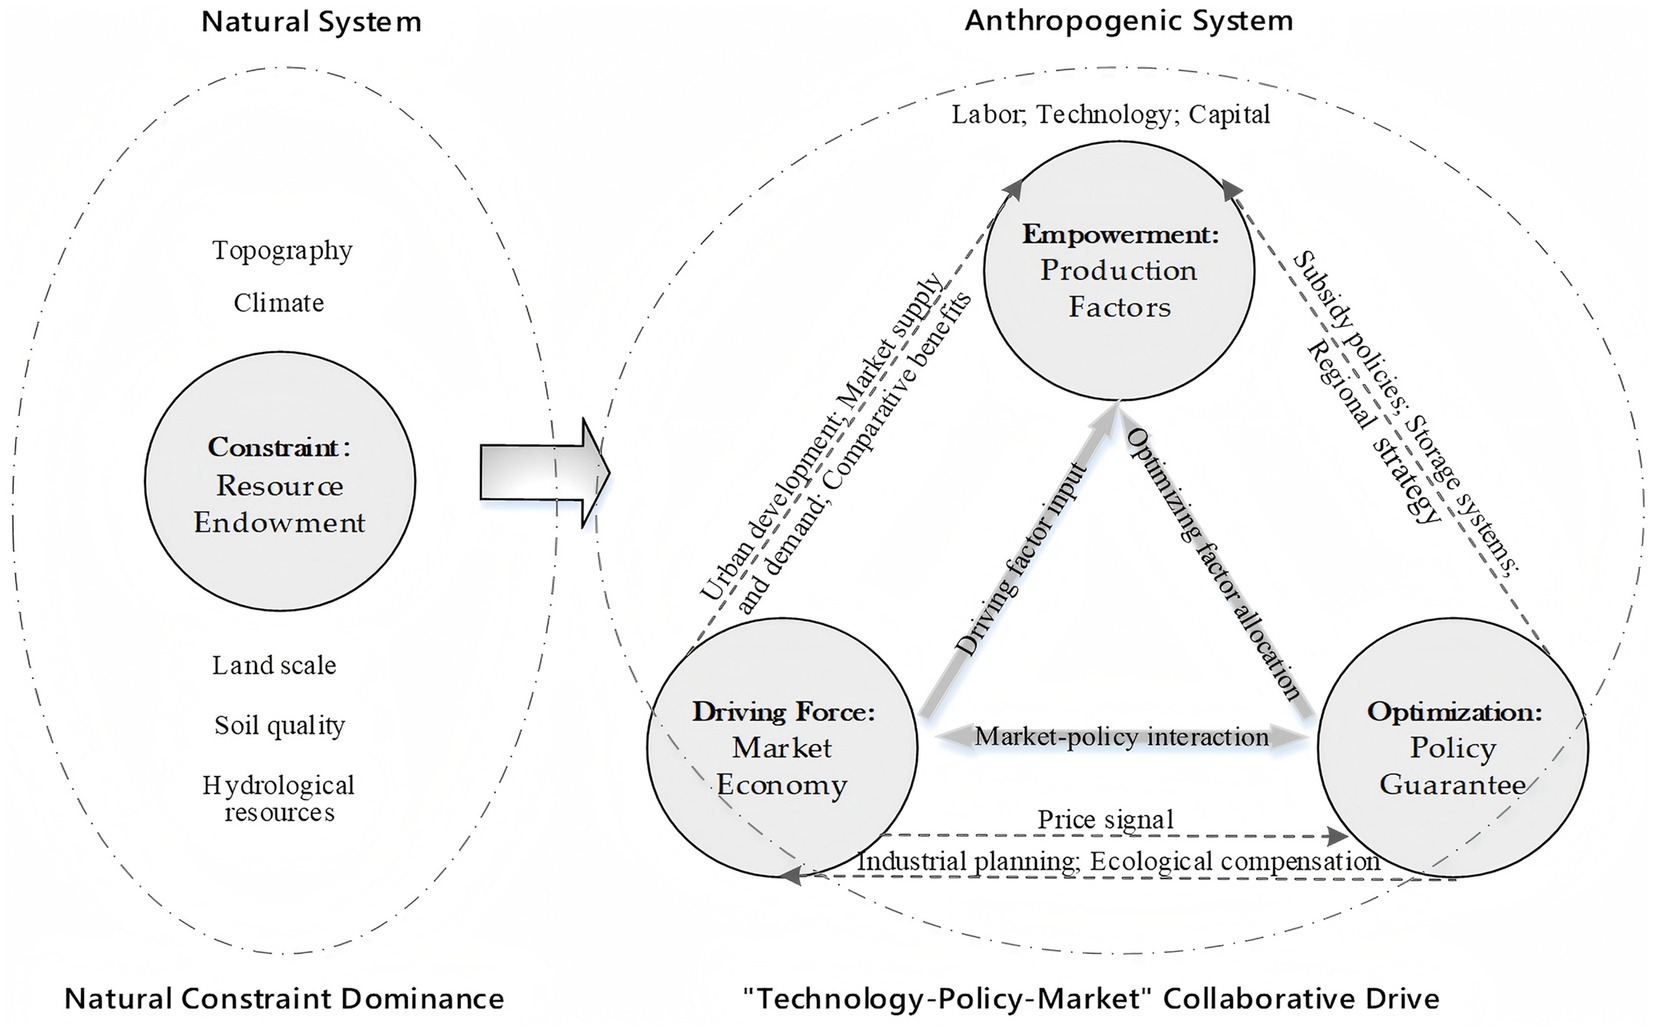
Figure 5. Theoretical mechanism.
Fundamental constraints of natural resource endowments. Natural factors such as light and heat conditions, topography, hydrological resources, soil fertility, and cultivated land scale serve as the “geographical genes” of regional agricultural systems. The rigid constraints are manifest in defining the ecological suitability thresholds of different crops and the feasibility of initial spatial layouts (Wang and Xia, 2024), while the flexible constraints create path dependence in crop cultivation through intergenerational transmission of planting practices (Li et al., 2012). For instance, the natural endowments of the Autonomous Region delineate the geographic boundaries for soybean cultivation, with the eastern plains becoming the main production zone due to climatic and soil advantages, while the western regions only form scattered planting patches.
Dominant driving role of regional economic and market development. The pattern of crop industries achieves an institutional leap from “path dependence on natural selection” to “economic and market orientation” through market-based allocation of agricultural resources. The upgrading of agricultural product consumption triggered by economic and urbanization development constitutes the underlying driving force, while factors such as market supply–demand dynamics and differences in comparative benefits lead to adaptive restructuring of soybean production scale and structure. For instance, the difference in output value or price ratio between soybeans and corn drives adjustments in planting structures.
Core empowering role of agricultural production factors. The factor empowerment mechanism in production patterns is essentially a process of resource reallocation synergistically driven by the scarcity substitution effect and technological multiplier effect. The scarcity substitution effect compensates for labor and land constraints with capital and technology, and the technological multiplier effect amplifies the efficacy of capital and labor through technological penetration. For instance, the autonomous region has developed high-yield, high-oil, and stress-resistant soybean varieties through independent research and introduction of transgenic technologies. The “Maiyu 526” variety in Xing’an League has achieved a 20% increase in yield compared to traditional varieties.
Regulatory and optimizing role of policy and institutional environment. The in-herent spontaneity and lag of market regulation may result in resource misallocation and negative ecological externalities, whose effects are fed back to the “visible hand” government through price signals. The government conducts systematic regulatory intervention and optimized guidance on the evolution of crop production patterns by formulating re-gional development strategies, industrial positioning plans, and implementing ecological protection policies. For instance, the government determined storage prices based on the principle of covering soybean production costs plus a reasonable profit, which served to correct the market-driven evolutionary path of production.
3.3.2 Variable selection and definition
Building upon the theoretical framework of driving mechanisms underlying the evolution of soybean production patterns and synthesizing existing research (Du et al., 2023; Li and He, 2024; Zhang and Cai, 2024; Liu et al., 2024b) on influencing factors of crop production, this study employed county-level soybean output (Sy) in Inner Mongolia as the explained variable to characterize the dynamic evolution of the soybean production pattern. A multi-tiered indicator system encompassing 12 key drivers was constructed across four dimensions: resource endowment, market economy, production factors, and policy environment. The specific components include: (1) Resource endowment factors. Monthly average precipitation (Rain) and monthly average temperature (Temp) during the critical growth period of soybeans from April to September were chosen to quantify the impact of climatic resource endowment on the soybean growth cycle. Additionally, the cropland area (Land) was introduced to represent the rigid constraints imposed by land resource endowment on production potential. (2) Market economy factors. The per capita disposable income of rural residents (Econ) was used to reflect the crowding-out or pulling effect of regional economic level on agricultural investment. The urbanization rate (Urb) was employed to measure the potential impact of labor’s non-agricultural transfer on soybean production under the process of urbanization. Agricultural comparative benefit (Acb) and soybean comparative benefit (Scb) were utilized to evaluate the overall efficiency of the agricultural sector and the relative competitiveness of soybean cultivation, with these shifting ratios offering a viable explanation for substitution behavior in crop planting. (3) Agricultural production factors. The effective irrigated area (Irr) and agricultural mechanization level characterized the stable improvement effect of facility conditions and technological substitution on soybean production efficiency. The labor force scale (Lab) and fertilizer application rate (Fer) reflected contributions of labor-intensive and capital-intensive inputs to soybean yield. (4) Policy environment factors. Local general fiscal budget expenditure (Gov) is used to measure the intensity of policy support and analyze the guiding effect of public investment on soybean production. The variable names, measurement methods and descriptive statistics are presented in Table 4.
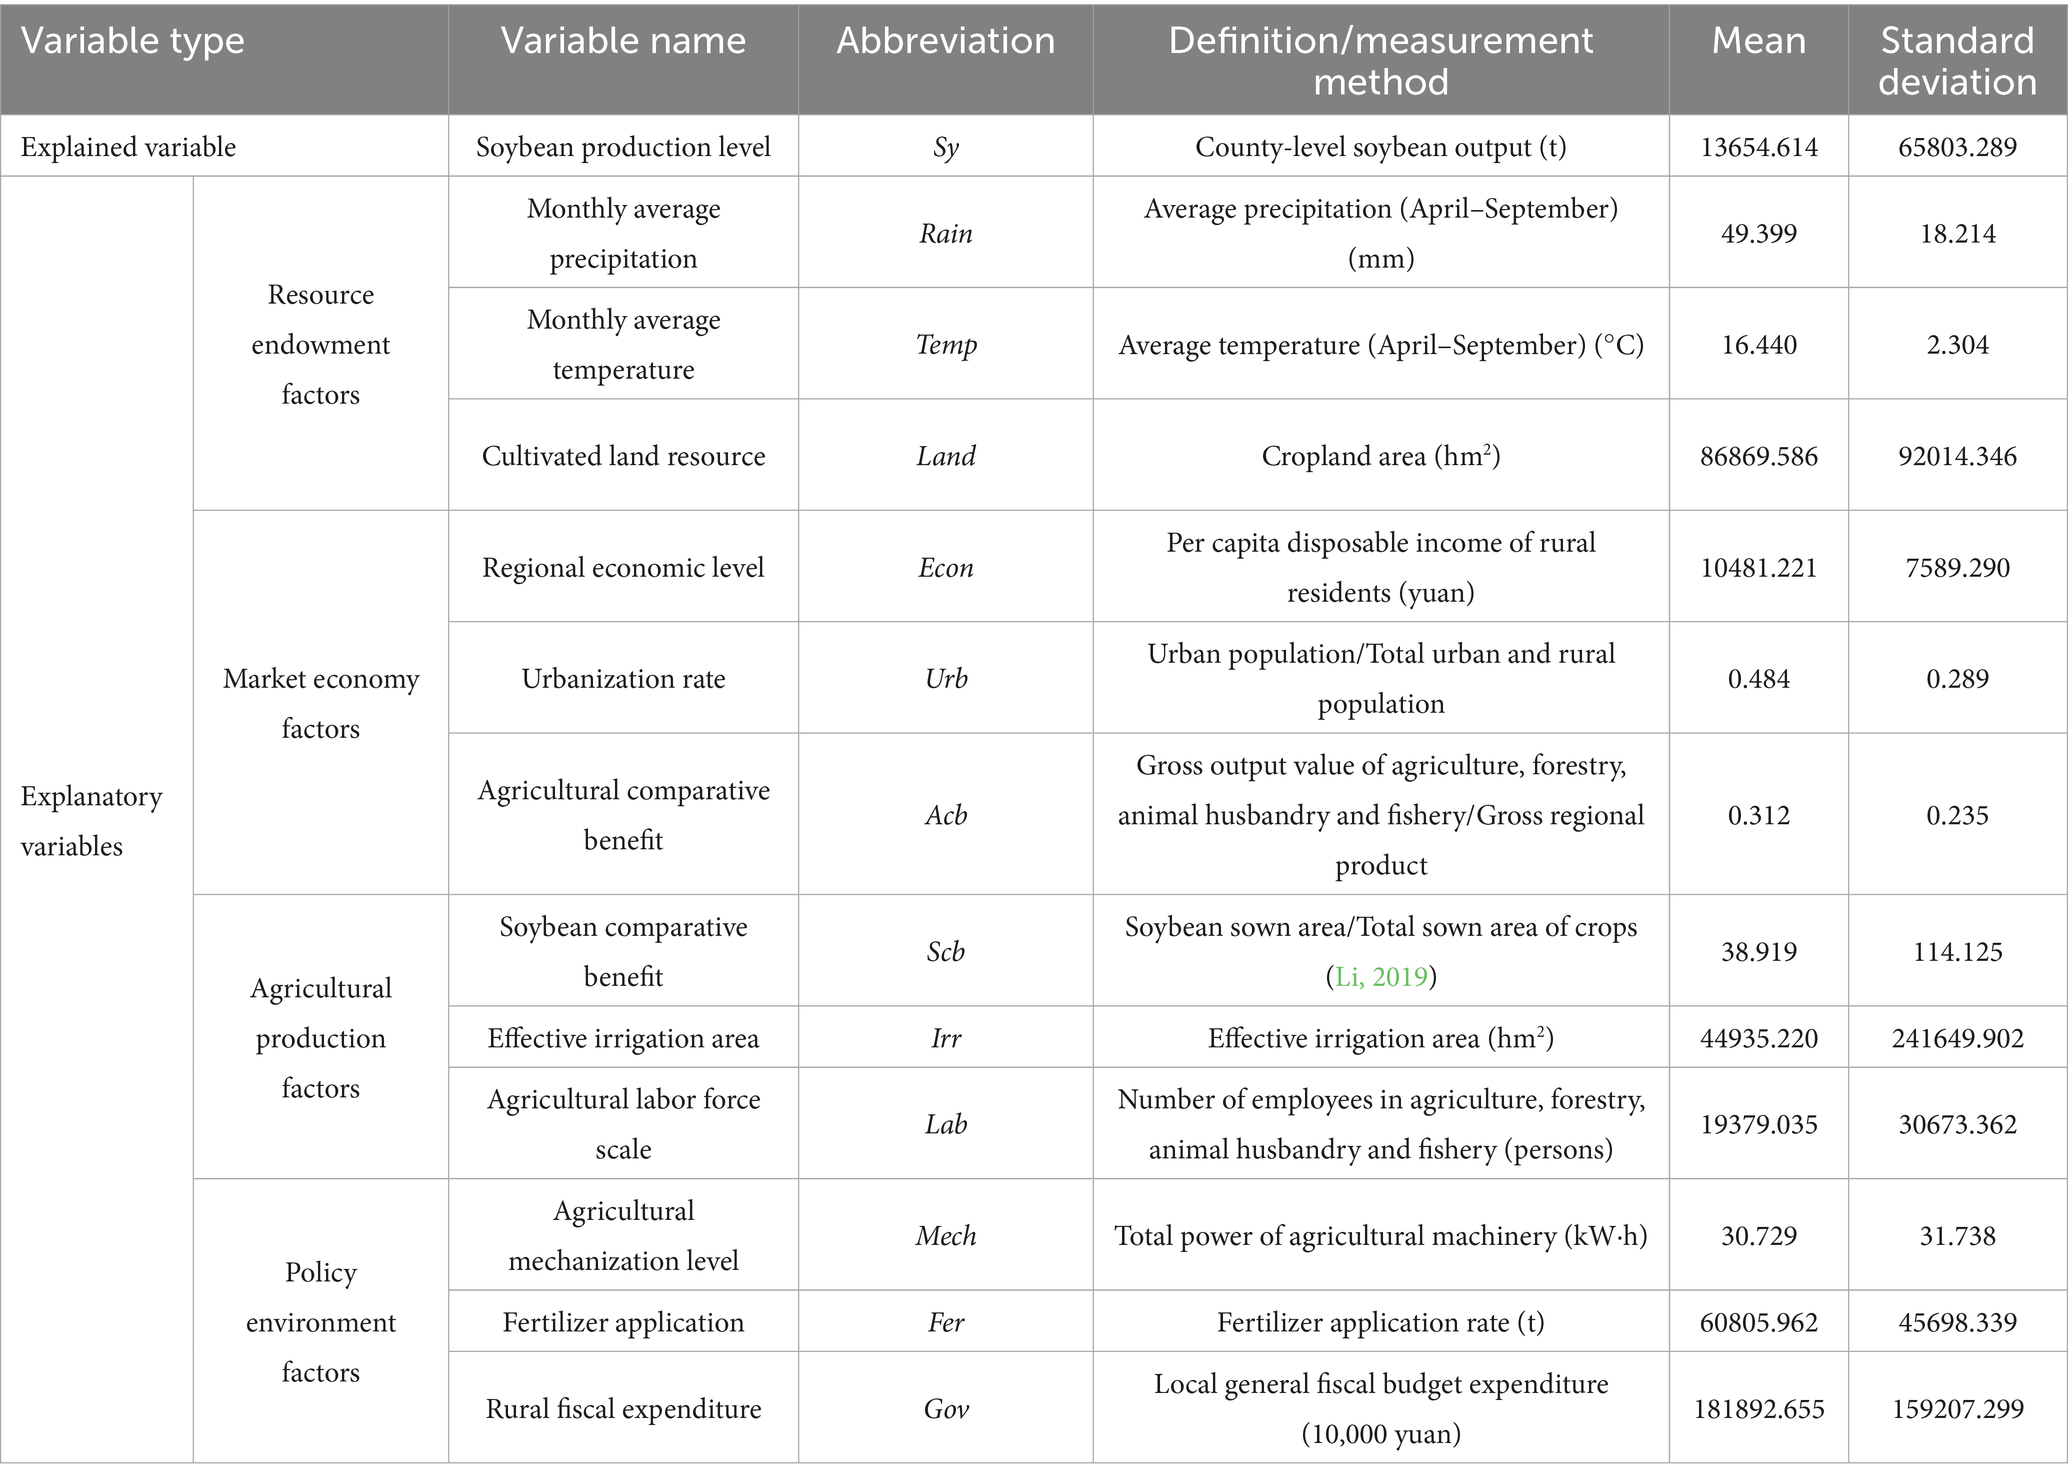
Table 4. Variable definition and descriptive statistical analysis of the evolution of soybean production pattern.
3.3.3 Spatial autocorrelation test
3.3.3.1 Global autocorrelation analysis
The Global Moran’s Index is employed to assess the spatial autocorrelation of data across the entire study area. On the basis of Global Moran’s I index to assess the spatial pattern of county-level soybean production in Inner Mongolia from 2002 to 2022, the results in Table 5 showed that the calculated Moran’s I values during the study period were all significantly positive (0.249–0.427), with all statistics passing the 1% significance level test. This indicated that there was a consistent and significant positive spatial autocorrelation in county-level soybean yields in Inner Mongolia, meaning spatial units exhibited a homogeneous agglomeration pattern: counties with high yields were spatially clustered (high-high clusters), while counties with low yields also showed spatial proximity (low-low clusters).
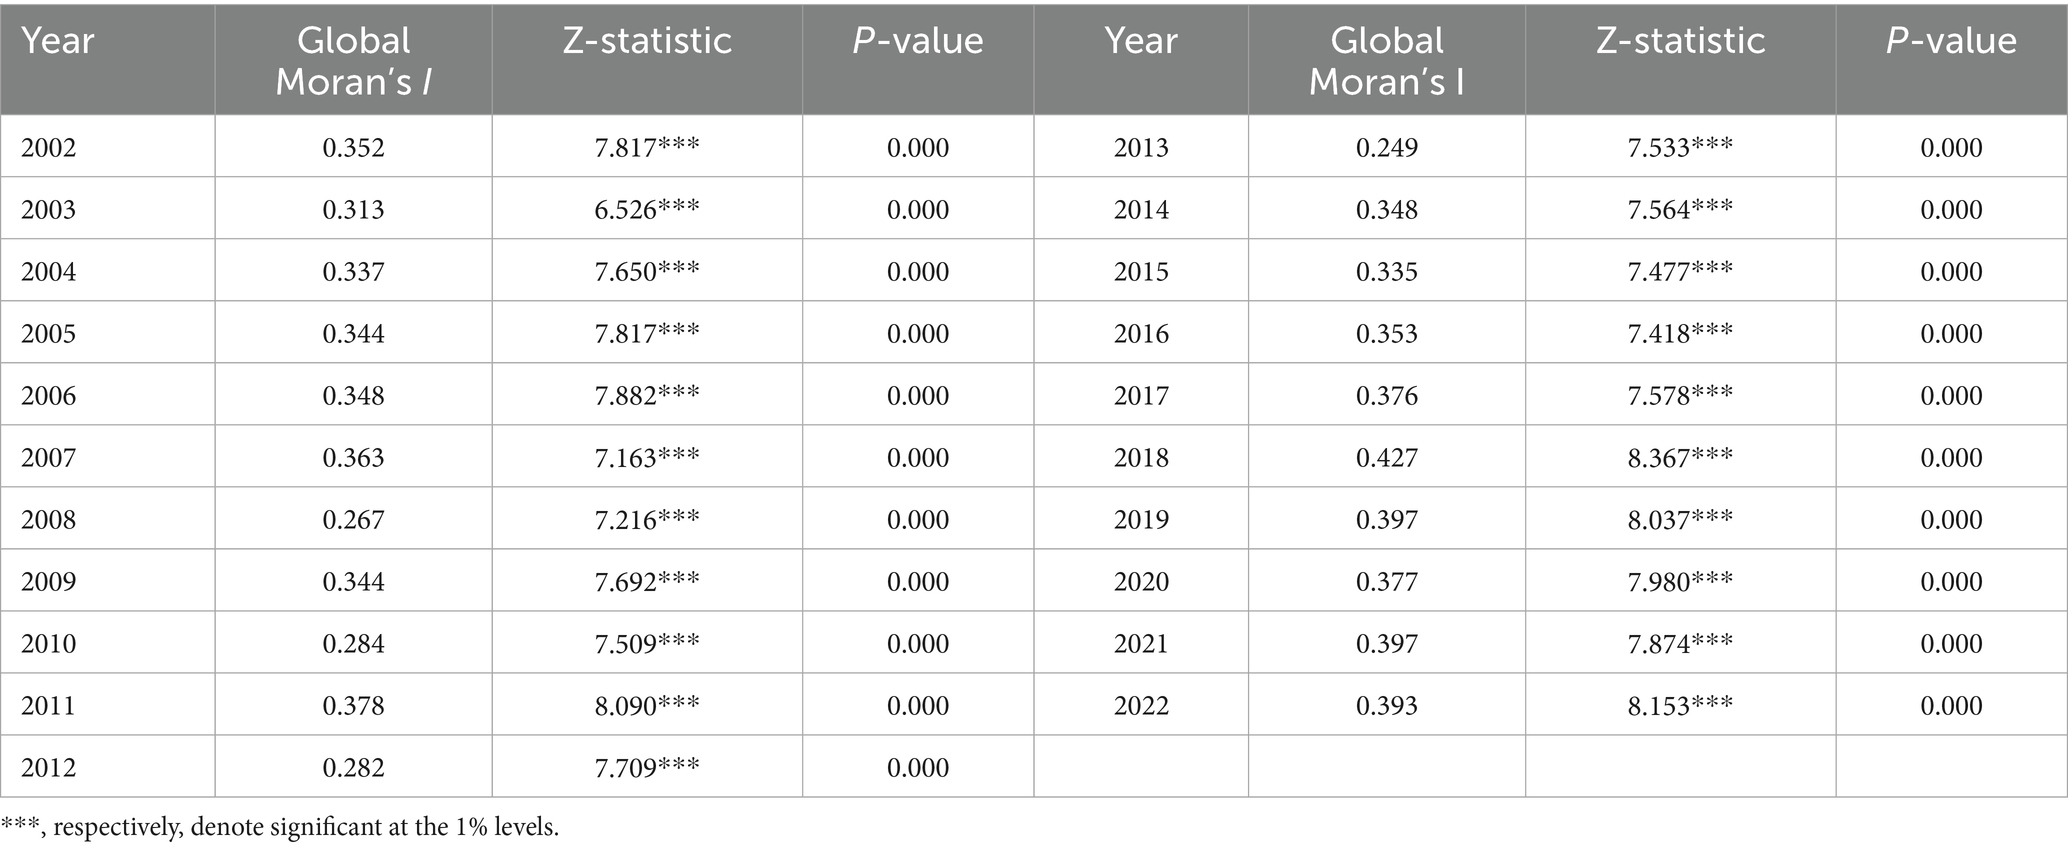
Table 5. Global Moran’s I test results of soybean yield.
3.3.3.2 Local autocorrelation analysis
The scatter plot of the local Moran’s I index is used to further analyze the spatial autocorrelation within local regions. On the basis of the global Moran’s I index analysis, this study continued to draw the scatter plots of the local Moran’s I index (LISA cluster maps) for the typical initial and final years of 2002 and 2022. As can be seen in Figure 6, the observation points were concentrated in the first quadrant (HH type: high-value and high-value agglomeration) and the third quadrant (LL type: low-value and low-value agglomeration). This indicated a significant positive spatial correlation in county-level soybean production in Inner Mongolia at the local spatial scale, which mutually confirmed the detection result of the global Moran’s I index.
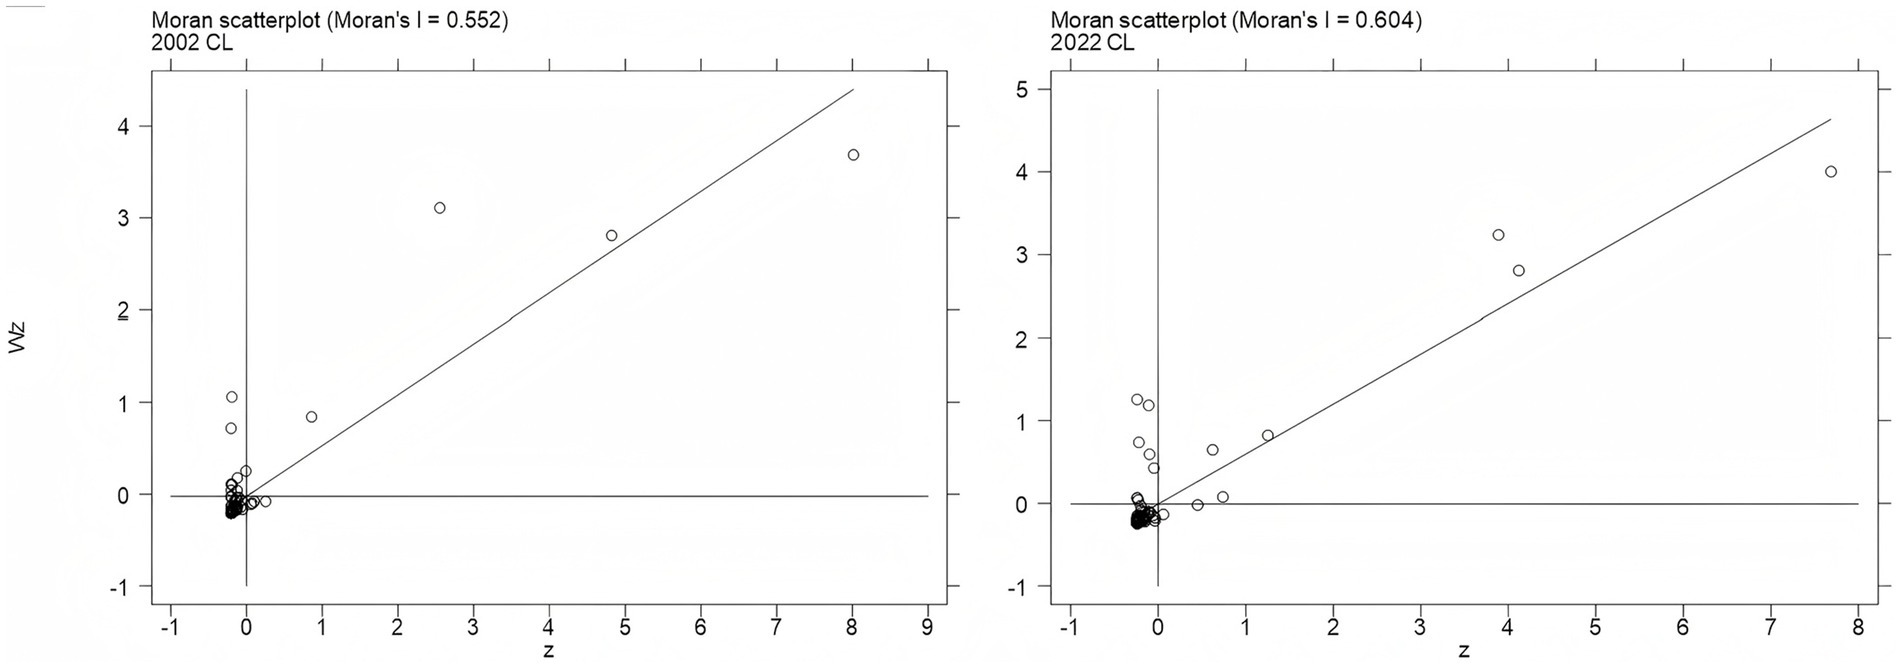
Figure 6. Local Moran’s I scatter plot of soybean yield.
In summary, it was concluded from the analysis of Moran’s I index that the influence of spatial effects on the soybean production layout would need to be taken into account in the study of changes in the.
3.3.4 Selection testing of spatial econometric model
The selection of spatial econometric models generally adheres to the classical methodological framework proposed by Elhorst (2014), employing a systematic diagnostic procedure involving pre-estimation specification tests and post-estimation verification. Specifically, the general spatial econometric model is first subjected to Lagrange Multiplier (LM) tests, followed by validation through Hausman tests, Likelihood Ratio (LR) tests, and Wald tests. As presented in Table 6, the diagnostic results of this research revealed: ①The statistical values of LM test and robust LM test (R-LM) based on OLS regression were statistically significant at the 1% level (p < 0.01), indicating the joint presence of spatial error and spatial lag effects in the model. As a result, the ordinary mixed-panel OLS regression was rejected, and the spatial Durbin model (SDM) incorporating both spatial error terms and lagged terms was preliminarily selected. ②The Hausman test result was significant (p < 0.000), clearly rejecting the random effects hypothesis. Therefore, it was determined that a fixed effects model should be adopted to control for individual heterogeneity or time fixed-effects. ③Taking the fixed-effects spatial Durbin model as the baseline hypothesis, the LR/Wald test examined whether it could be simplified into a Spatial Lag Model (SLM) or a Spatial Error Model (SEM). The test statistics rejected the original hypothesis at the 1% significance level, confirming that the lag and spatial error terms in the spatial econometric model could not be eliminated. Consequently, the spatial Durbin model with fixed-effects emerged as the optimal specification for our analysis.
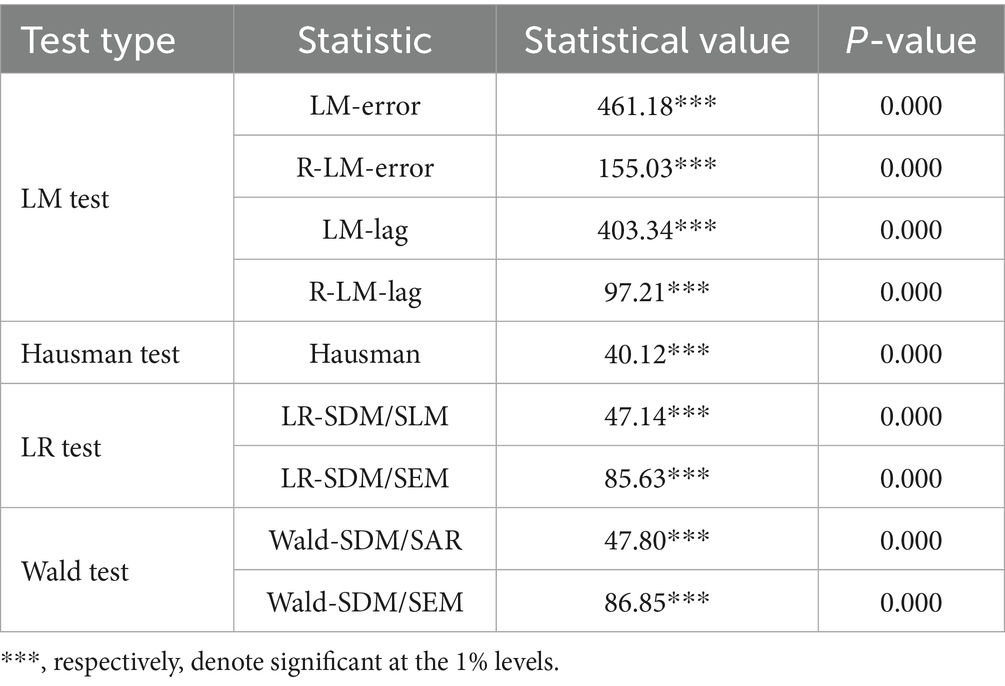
Table 6. Test Results of spatial econometric model selection.
3.3.5 Estimation results and analysis
Table 7 presented the parameter estimation results of the spatial panel Durbin model with individual fixed-effects, time fixed-effects, and dual fixed-effects specifications. As illustrated by the model comparison, the spatial Durbin model with time fixed-effects and the spatial Durbin model with time fixed-effects demonstrated superior performance in key indicators, including goodness-of-fit (R2 = 0.867) and log-likelihood statistic (Log-likelihood = −3590.009). Therefore, this model is selected as the benchmark analytical framework. Consequently, it was decided that the spatial Durbin model with time-fixed effects would serve as our benchmark analytical framework.
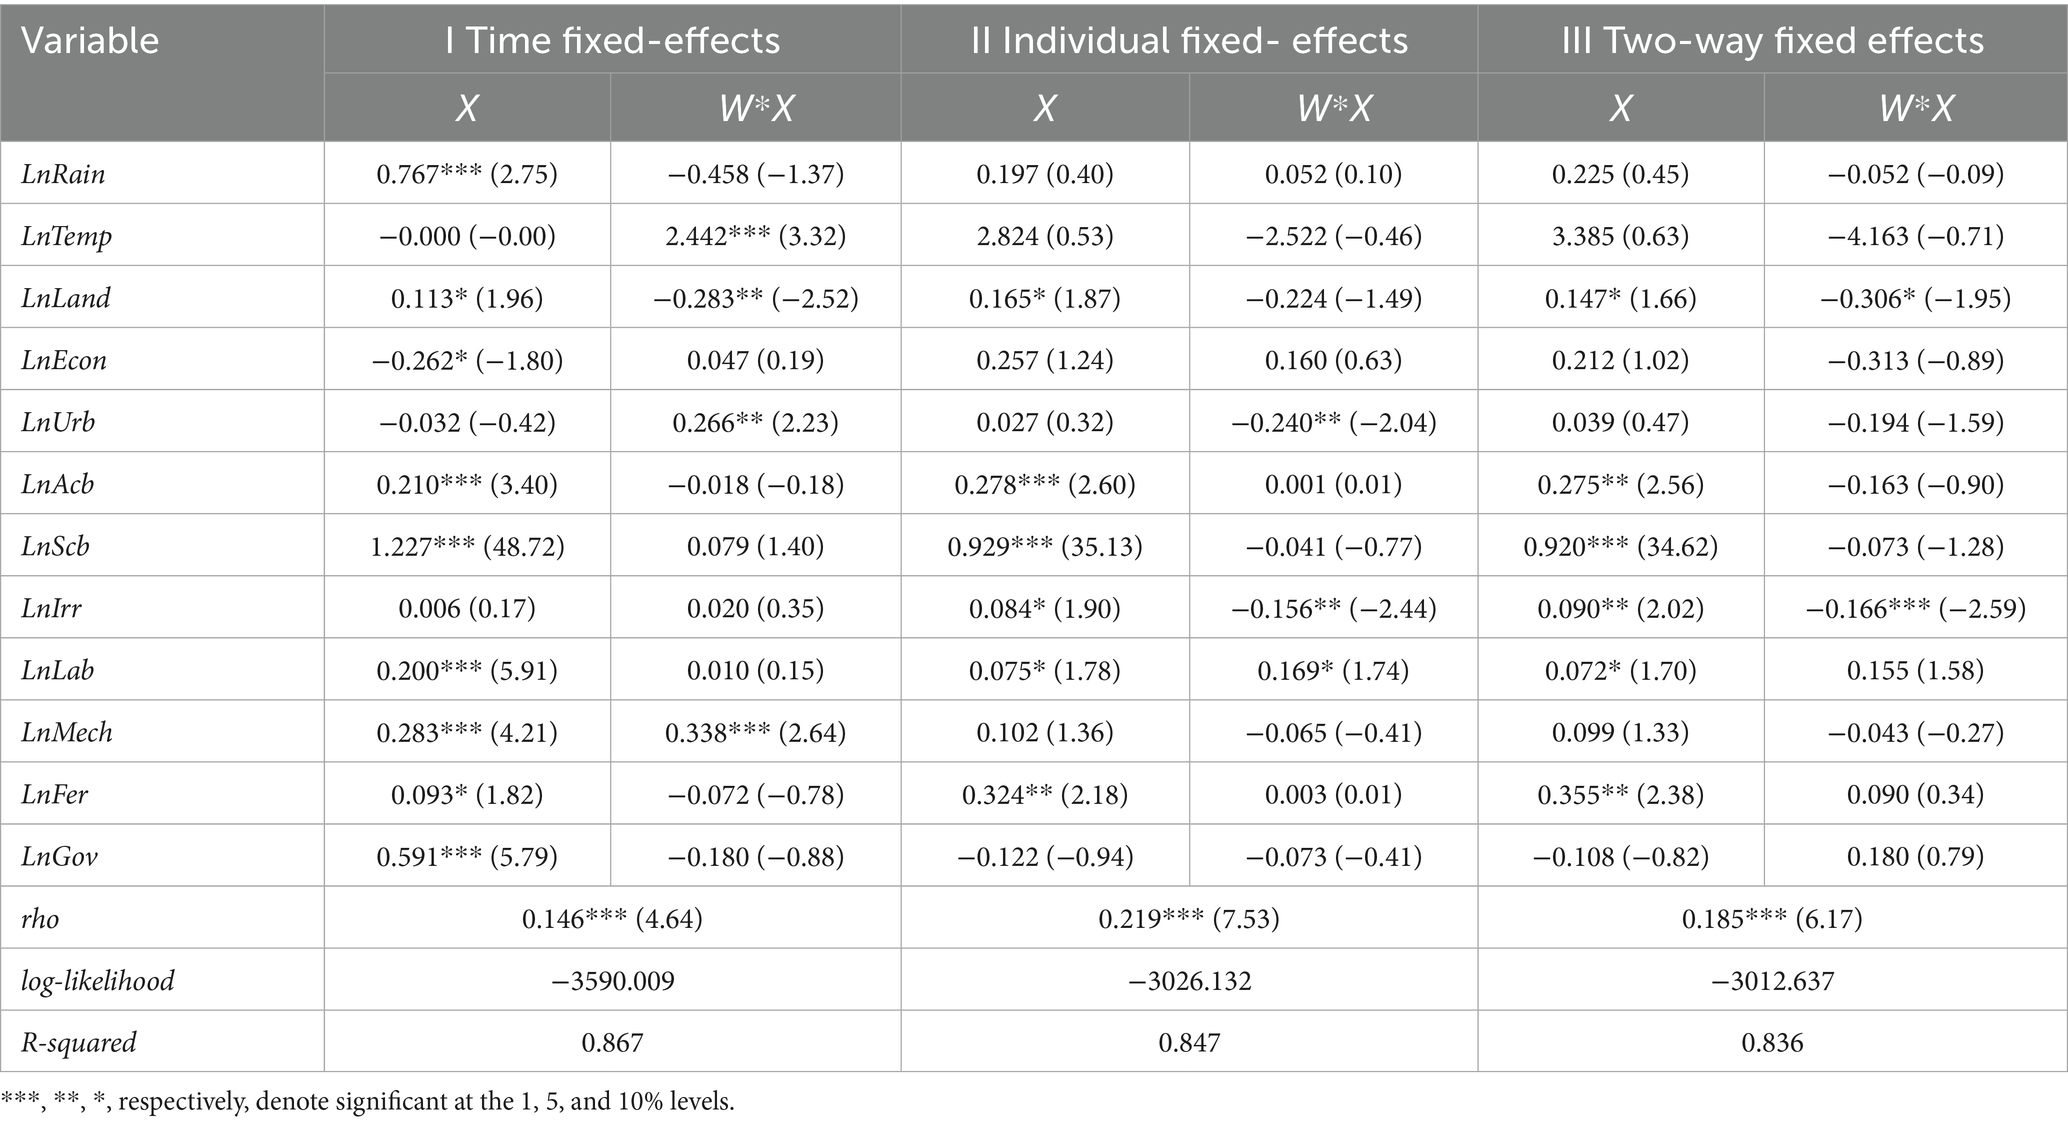
Table 7. Results of fixed effects estimation for spatial Dubin model.
The estimation results of Model I indicate that the spatial autoregressive coefficient ρ (rho) is positive and statistically significant at the 1% level, which aligns with prior Moran’s I spatial autocorrelation tests. It indicates that soybean production in Inner Mongolia’s counties exhibits significant spatial spillover effects, along with obvious imitation effects of production decisions and technology diffusion mechanisms among regions. Nevertheless, there is a limitation in the endogeneity interpretation of the parameter estimation results of the spatial Durbin model. Its regression coefficients can only reflect the marginal association intensity among variables and cannot directly separate the net impacts of the local direct effects and the neighborhood spatial spillover effects. Accordingly, this study adopted the spatial partial differential decomposition framework proposed by LeSage and Pace (2009), and decomposed the influence coefficients of independent variables on soybean production patterns into three distinct components: direct effect (Impact of local independent variables on the local dependent variable), the indirect effect (Impact of neighboring regions’ independent variables on the local dependent variable through spatial spillover effects), and the total effect (Summation of direct and indirect effects). The results of the spatial effect decomposition are presented in Table 8.
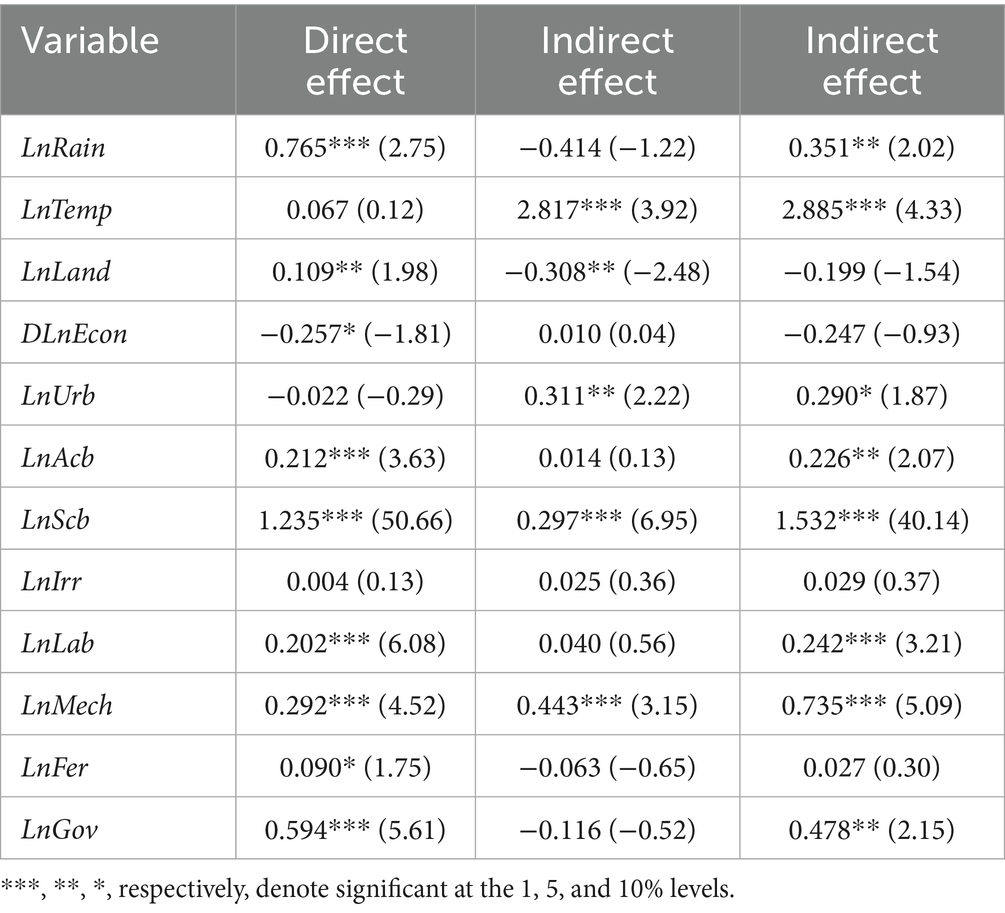
Table 8. Results of spatial effect decomposition.
Decomposition of direct effects. The direct effects of monthly average precipitation, cultivated land resource, agricultural comparative benefit, soybean comparative benefit, agricultural labor force scale, agricultural mechanization level, fertilizer application rate, and rural fiscal expenditure were significantly positive, while regional economic development level showed a significant negative direct effect. The key findings include:
The regression coefficient of the direct effect of the precipitation factor was 0.765, meaning that every 1% increase in local precipitation corresponded to 0.765% yield improvement. It indicates that an increase in local precipitation directly enhances local soybean yield and simultaneously reflects the core constraint of water resources on dry-land farming. Most regions in Inner Mongolia are relatively arid and have long struggled with water scarcity, so crop production heavily depends on irrigation from rivers and groundwater. As a natural water supplement, more precipitation can directly alleviate regional water resource pressure in Inner Mongolia and enhance soybean production levels through mechanisms such as enhancing soil moisture and promoting photosynthesis. The regression coefficient of the direct effect of the cultivated land resource factor was 0.109, meaning that every 1% expansion in cultivated area generated a marginal 0.109% yield gain. The weak positive effect suggests that the marginal productivity of land expansion is constrained by factors such as heterogeneity in soil quality or inefficiencies in land utilization. Eastern regions in Inner Mongolia benefit from black soil belts and plain advantages, resulting in contiguous cultivated land and a high land reclamation rate. In contrast, central and western regions are restricted by desertification and ecological protection policies, leading to obvious fragmentation of cultivated land. Consequently, eastern regions leverage their land resource endowment to directly reduce marginal production costs and indirectly enhance soybean production capacity through scaled planting and intensive land use. The regression coefficient of the direct effect of agricultural comparative benefit factor was 0.212, meaning that every 1% increase in primary sector profitability raised soybean output by 0.212%. It illustrates that an increase in the overall returns of local agricultural sector will attract more resources to be invested in the planting industry, forming an indirect support for soybean production. When agricultural comparative benefits are relatively high, farmers tend to retain or allocate factors such as labor and land to the agricultural sector, and it may also attract external capital from agricultural enterprises and cooperatives into soybean production. The regression coefficient of the direct effect of soybean comparative benefit factor was 1.235, meaning that every 1% increase in the local soybean planting proportion, the yield surged by 1.235%. It demonstrates the strongest marginal effect, reflecting the powerful economies-of-scale effect brought about by centralized planting in reducing unit costs. Significant advantages in soybean comparative returns incentivize optimization of the planting structure, whereby farmers tend to expand the cultivation area of this more profitable crop. Furthermore, high soybean comparative benefit incentivizes farmers to increase specialized production inputs (such as selecting high-yield and high-quality varieties, optimizing fertilization schemes, and adopting precision irrigation technology), all of which drive regional soybean yield growth. The regression coefficient of the direct effect of agricultural labor force scale factor was 0.202, meaning that every 1% increase in agricultural labor force (primary sector employment) corresponded to a 0.202% rise in soybean output. The persistent reliance on labor force highlights the need for manual farming techniques, especially where mechanization technology has not yet taken hold. As a fundamental production input, changes in labor force size directly affect various stages of soybean production, such as sowing, weeding, fertilization, and pest control. An increase in agricultural workers directly ensures the quality and timeliness of operations in these stages. The regression coefficient of the direct effect of agricultural mechanization factor was 0.292, meaning that every 1% expansion in agricultural machinery power generated 0.292% yield improvement. It shows that mechanization reduces the dependence on manpower and highlights the efficiency advantage of technology replacing labor. As a carrier of agricultural technology, mechanization significantly shortens the soybean planting cycle and gradually replaces high-intensity manual labor, alleviating labor shortages caused by the aging and part-time employment of agricultural labor. This cost advantage encourages farmers to expand their planting scale, thereby achieving dual improvements in “economies of scale” and “technical efficiency.” The regression coefficient of the direct effect of fertilizer application factor was 0.090, meaning that every 1% increase in local fertilizer inputs, soybean yield slightly increased by 0.090%. It reveals that the appropriate amount of fertilizer inputs still has the effect of increasing yields, but the marginal utility has shown a decreasing trend. Fertilizer input compensates for shortcomings in natural soil fertility by precisely supplementing essential elements like nitrogen, phosphorus, and potassium, meeting the nutrient demands during key growth stages of soybean. However, the relatively low coefficient also suggests that current fertilizer inputs may be approaching a point of diminishing returns, necessitating a shift toward precision and sustainability by combining soil testing-based fertilizer recommendation with organic fertilizer substitution. The regression coefficient of the direct effect of rural financial expenditure factor was 0.594, meaning that every 1% increase in local rural fiscal expenditure led to 0.594% growth in output. It reflects that policy funds directly benefit farmers through farmland infrastructure construction and production subsidies to promote soybean production, with a distinct localization feature of the policy effect. Fiscal policy essentially involves the government supplying public goods to address market failures. Through vehicles such as modernizing farmland water conservancy, constructing high-standard farmland, providing subsidies for superior seeds, and developing digital agriculture platforms, fiscal expenditure enhances the allocation efficiency of agricultural factors and builds sustainable development mechanisms. This underscores the leveraging role and multiplier effect of fiscal policy within the national food security strategy. Furthermore, the regression coefficient of the direct effect of economic development factor was −0.257, meaning that every 1% increase in the disposable income of local rural residents resulted in a 0.257% decline in soybean output. It reflects the resource competition exerted on the agricultural sector by non-agricultural economic development. The reallocation of factors triggered by economic development can create a crowding-out effect on the traditional agricultural sector. Rising economic development levels in Inner Mongolia are accompanied by increased non-agricultural employment opportunities, prompting an industrial shift toward secondary and tertiary sectors. The transfer of production factors like labor and capital to these sectors, coupled with rising rural labor costs or competition for agricultural land, directly compresses the actual planting area available for soybean.
Decomposition of indirect effects. The indirect effects of monthly average temperature, urbanization rate, soybean comparative benefit, and degree of agricultural mechanization were significantly positive, while cultivated land resource showed a significant negative indirect effect. The key findings include:
The regression coefficient of the indirect effect of urbanization rate factor was 2.817, meaning that every 1°C increase in temperature in neighboring regions would lead to a 2.817% rise in local soybean yield. It reflects a form of “ecological synergistic spillover” facilitated by the spatial continuity of climatic elements. Temperature exhibits natural spatial continuity. On one hand, warming in adjacent regions can suppress the cross-regional spread of pests and diseases, directly reducing local soybean yield losses caused by such biological stressors. On the other hand, it can optimize conditions for the crop growth cycle. The relevant technical experience, transmitted across regions, enhances the stability of local soybean yields. The regression coefficient of the indirect effect of monthly average temperature factor was 0.311, meaning that every 1% increase in the urbanization rate of neighboring regions would drive 0.311% growth in local yield. It highlights the “urban-led rural development” market radiation effect formed by urbanization. The urbanization of surrounding areas can boost local demand for soybean processing, and promote the downscaling of the industrial chain through models such as contract farming and production-sales connection, thereby indirectly facilitating the growth of local soybean output. The regression coefficient of the indirect effect of soybean comparative benefit factor was 0.297, meaning that every 1% increase in the proportion of soybean planting in adjacent regions would result in 0.297% growth in local yield. It suggests that the comparative benefit of soybean cultivation generate positive productive spillovers through spatial transmission. The optimization of planting structures in surrounding areas can be transmitted to the local region through channels such as technology imitation and information sharing, indirectly improving local production efficiency and soybean yields. The regression coefficient of the indirect effect of agricultural mechanization level factor was 0.443, meaning that every 1% increase in agricultural machinery power in neighboring regions would boost local yield by 0.443%. It indicates that the cross-regional diffusion of mechanical technology plays a synergistic role in promoting local production. The improvement of agricultural machinery levels in neighboring areas helps realize the sharing of agricultural machinery services, optimize the allocation of regional production resources, and reduce efficiency losses and cost pressures in local production links—thus generating positive technological spillover effects on the local region. Furthermore, the regression coefficient of the indirect effect of cultivated land resource factor was −0.308, meaning that every 1% expansion of cultivated land scale in neighboring regions would cause a 0.308% decline in local yield. It implies that the expansion of cultivated land in neighboring regions may inhibit local production due to resource competition. The expansion of cultivated land in surrounding areas could create competition with the local area for production factors such as water resources and labor, thereby exerting a certain resource crowding-out effect on local soybean production.
4 Discussion and conclusion
4.1 Discussion
4.1.1 Sustainability crisis of the “area-dominated” model: a dialectical examination of short-term gains and long-term concerns
This study identifies a regional development pathway in Inner Mongolia’s soybean production characterized primarily by the expansion of the sown area, which stands in sharp contrast to the “yield-dominated” production increase model observed at the national level (Yan et al., 2024). We contends that this pathway is a historical choice shaped by the coupling of regional resource endowments and specific policy opportunities. While it has rapidly expanded the production “pie” in the short term, it has simultaneously sown the seeds of a profound sustainability crisis. First, ecological constraints have intensified. As highlighted by Du et al. (2025), the large-scale and intensive cultivation of cropland has led to the quantitative loss and qualitative degradation of black soil in Northeast China, manifested in thinner, less fertile, and harder black soil layers. Similarly, Sun et al. (2024) emphasized that the continuous expansion of agricultural planting scale increases the pressure on resources and the ecological environment in major grain-producing areas. Essentially, the path of “trading area for production capacity” amounts to the accelerated discounting of natural capital such as soil and water resources. If ecological thresholds are continually breached, the stability and reproductive foundation of the regional soybean production system will face fundamental challenges. Second, unit yield bottlenecks have continuously weakened production resilience. Soybean yield in Inner Mongolia has long lingered at a low level, ranging from 1,600 to 2,000 kg/ha—presenting a stark contrast to the high growth of sown area, and significantly lower than the levels in major producing regions such as Jilin and Heilongjiang provinces as well as the national average. This gap reflects the inherent issues of insufficient technological input and weak innovation-driven momentum in Inner Mongolia, manifesting in practical challenges including low coverage of high-quality seeds and delayed application of precision agricultural technologies.
Such a low-efficiency scale expansion path deviates markedly from the national strategic orientation of “large-scale unit yield enhancement.” Continued reliance on area expansion will cause Inner Mongolia’s soybean production increments to hit a “ceiling,” potentially placing it at a disadvantage in future agricultural policy adjustments and market competition. Therefore, the development of Inner Mongolia’s soybean industry has reached a critical juncture for transformation. There is an urgent need to shift from the “path dependence” pursuing scale to “path innovation” focused on efficiency and resilience. The core of this transition lies in reconciling the tension between “ecology and economy,” breaking the bottleneck in the coordinated improvement of “scale and technology,” and ultimately fostering a fundamental transition in development logic from “quantitative expansion” to “quality and efficiency oriented enhancement.”
4.1.2 Formation logic of the spatial pattern: a coupled driving framework of “nature-market/policy-technology”
The research reveals a spatial differentiation pattern in Inner Mongolia’s soybean production characterized by “concentration in the east and diffusion into the central-western regions,” alongside a long-term macro trend of high agglomeration. This pattern is essentially the geographical manifestation of the non-linear coupling of four key driving dimensions: natural resource endowment, agricultural production factors, market economic benefits, and macro-policy regulation. (1) Natural resource endowment serves as the foundational and constraining condition for the highly agglomerated spatial pattern. The extremely high Location Gini Coefficient (GINI > 0.88) and the long-term stability of the “Iron Triangle” core area are fundamentally determined by the superior soil and water–heat conditions of the extended section of the Northeast China black soil belt, which provide irreplaceable innate natural advantages for soybean growth. (2) The combined effect of policy regulation and market mechanisms constitutes a key force influencing agglomeration dynamics and regional diffusion. The analysis finds that “phasic fluctuations” in the degree of spatial agglomeration and the “southwestward shift” of the production center of gravity are closely linked to policy intervention nodes. For instance, the decline in the Gini coefficient after 2003 correlates with the implementation of the “Grain for Green” program regulations, while the systematic decline in agglomeration after 2015 directly benefited from the “Characteristic Soybean Revitalization Project” fostering new production areas. At the same time, market-oriented tools such as target price subsidies effectively adjusted the comparative benefits of planting, encouraging farmers in the “Sickle Bend” region to switch from corn to soybean cultivation, thereby driving the southwestward migration of the production gravity center. (3)The scale agglomeration and technological spillovers of production factors act as reinforcing mechanisms for pattern solidification. The flat terrain of the eastern core region provides the essential conditions for large-scale agricultural mechanization. Furthermore, this study confirms a significant positive spatial spillover effect of mechanization level, indicating rapid technology diffusion across geographically proximate areas. This process gradually creates “economies of scale barriers,” accelerating path dependency and lock-in effects in regional development.
Thus, the spatial differentiation of soybean production in Inner Mongolia results from a sequence where the natural base sets the initial framework, policy and market signals guide factor mobility, and technology and economies of scale amplify regional advantages. Future policy formulation must deeply understand this spatial heterogeneity. The eastern core region should transition from “scale agglomeration” to “quality improvement,” while the central-western peripheral areas should shift from “passive diffusion” to “proactive breakthrough,” thereby achieving the overall layout optimization goal of “consolidating the core and stimulating the periphery.”
4.1.3 Innovations and limitations of this study
The dynamic variation in grain crop yield is fundamentally determined by the synergistic effect of unit yield and scale effect, while other socioeconomic and policy elements exert indirect influence by shaping these two core dimensions (Zhang et al., 2018). This study further defines unit yield and sown area as internal factors, distinguishing them from external factors such as natural conditions, market economy, agricultural inputs, and policy environment indicators. A dual-dimensional analytical framework is constructed to examine the evolution of soybean production patterns, incorporating both internal factor decomposition and external spatial effects. Internal factors decomposition: The LMDI method is introduced to rigorously quantify the relative contribution of unit yield gains and area expansion to total output growth; External spatial effects analysis: Guided by a four-dimensional driving theoretical mechanism of “nature-market-factor-policy,” the SDM model is applied to illuminate how local drivers and regional synergies jointly reshape the spatial configuration of soybean production networks. By integrating micro-level factor decomposition with macro-level spatial interactions, the research establishes a closed-loop analytical system that offers a methodological innovation for the multi-scale coupling research of the geographical system of agricultural production patterns.
This study also has limitations, primarily related to data. Due to constraints on the research scale and data availability, potential variables such as soil fertility and disaster events have not been incorporated into the analytical framework, and the transmission effect of international trade factors on regional production structures has not been fully revealed. Incorporating soil fertility gradients could enhance the explanatory power of cultivated land resources on yield and potentially clarify effect differences between eastern and western regions. Similarly, introducing metrics for extreme climate event frequency (e.g., drought days, extreme precipitation) would allow for a more direct assessment of the impact of climate variability on production stability. Future research should expand the study scale, utilize the Difference-in-Differences (DID) method to more precisely identify the causal effects of key policies, and apply gravity models to further investigate the influence of trade policies on domestic soybean market integration and inter-provincial circulation patterns.
4.2 Conclusion
Based on county-level spatial panel data of Inner Mongolia from 2002 to 2022, this study comprehensively employed the logarithmic mean divisia index, spatial Gini coefficient, industrial concentration rate, and gravity center migration model to reveal the spatiotemporal evolution laws of soybean production patterns in Inner Mongolia, additionally utilized a spatial Durbin model to investigate the driving mechanisms. The main findings are as follows:
(1) Temporal evolution characteristics. The total output, sown area, and unit yield of soybeans from 2002 to 2022 in Inner Mongolia showed an overall fluctuating upward trend, with production evolution exhibiting phased characteristics of “fluctuation adjustment–unit yield breakthrough–scale expansion–transformation and optimization.” Factor decomposition also confirmed that soybean production in Inner Mongolia is undergoing a temporal transition from yield-driven to area-driven growth. The expansion of sown area is the internal core driving force for yield growth, reflecting the increased dependence of the current production capacity improvement model on land resources, as well as the growing difficulty in sustaining yield growth through technological innovation.
(2) Spatial differentiation characteristics. Soybean production remained persistent high agglomeration (GINI >0.88) with four eastern leagues—Hulunbuir, Hinggan, Tongliao, and Chifeng—consistently contributing over 90% of regional capacity, forming an “iron-triangle” core zone—Morin Dawa Banner, Arun Banner, and Oroqen Banner—accounting for more than 50% of total production; The production centroid has oscillated predominantly north–south with its trajectory concentrated in the agricultural belt at the eastern foot of the Greater Khingan Mountains. These characteristics indicate that soybean production in Inner Mongolia possesses significant spatial concentration and regional driving potential, with the advantageous production zones playing a critical role in stabilizing the region’s overall capacity and optimizing its layout.
(3) Driving mechanism. Empirical results demonstrate that the evolution of the soybean production pattern is a complex process driven jointly by local direct effects and neighboring spatial spillover effects. In terms of direct effects: Precipitation, cultivated land resources, agricultural comparative benefits, soybean comparative benefits, agricultural labor scale, agricultural mechanization level, fertilizer application, and fiscal expenditure significantly promoted local soybean production, while economic development suppressed local yield through resource crowding-out effect. In terms of spatial spillover effects: Temperatures, urbanization rates, soybean comparative benefits, and mechanization level in neighboring counties generated positive spillovers through regional collaboration and technology diffusion, whereas the expansion of cultivated land in neighboring counties might exert negative impacts due to resource competition. Evidently, the evolution of the soybean production pattern is a regionally interconnected process with strong spatial dependency. Optimizing the overall production capacity cannot be achieved solely by increasing local factor inputs; it necessitates integrated consideration of regional coordination and spatial externalities.
5 Policy implications
5.1 Consolidating advantages of core production areas and building a resilient production system
Inner Mongolia’s soybean production exhibits a distribution pattern characterized by concentration in the east and diffusion in the central-western regions, thus region-specific optimization pathways are proposed to enhance the resilience of core production areas. Key strategies include: ①Stabilizing production and improving quality in the eastern production areas. Establish full-chain demonstration parks in core production areas; Facilitate contractual agreements between leading enterprises such as COFCO, Jiusan and the major soybean-producing townships in the east for dedicated soybean varieties; Leverage the advantageous regions such as Morin Dawa to create regional seed breeding centers and germplasm resource conservation bases, focusing on cultivating high-protein specialty varieties and developing lodging-resistant, cold-tolerant, and early-maturing varieties. ②Achieving ecological adaptation in the central and western production areas. Promote drought-resistant soybean varieties and pilot strip intercropping models in ecologically suitable areas of the central and western drylands; Support cooperative joint operations to integrate scattered plots through land transfers aiming at improving land utilization efficiency.
5.2 Reinforcing technological innovation to shatter bottlenecks in unit yield improvement
With the contribution of unit yield declining in Inner Mongolia, a collaborative innovation system combining the seed industry, agronomy, and digital technology should be established to strengthen yield-enhancing technological breakthroughs. Key strategies include: ① Advancing seed industry revitalization. Increase RandD investment in high-yield and high-quality varieties; Prioritize development and dissemination of drought-tolerant, stress-resistant, and high-protein soybean cultivars; Establish a tripartite breeding collaboration among research institutions, enterprises, and growers to enhance seed quality and technical adaptability. ② Integrating high-yield cultivation technologies. Combine technologies such as water saving irrigation, precision fertilization and integrated pest management, and promote Agro-Ecological Coupling (ARC) technology for quality enhancement and nitrogen fixation to develop a synergistic system pairing improved seeds with optimized cultivation practices. ③ Accelerating smart agriculture adoption. Leverage satellite remote sensing, drones and IoT devices to establish an integrated “air-space-ground” monitoring network, and conduct real-time monitoring of soil moisture, pests and diseases and crop growth to enhance the intelligence and digitalization level of soybean production management.
5.3 Focusing on spatial spillover effects to deepen regional collaboration and market linkages
In view of the positive and negative spillover effects revealed by spatial econometric analysis, it is necessary to establish regional cooperation and market stabilization mechanisms. Key strategies include: ① Establishing cross-county collaborative alliances. Leverage positive spillovers (e.g., temperature, urbanization, mechanization) from neighboring areas to develop a technology assistance mechanism between core eastern and emerging central-western production regions. In practice, with a soybean production alliance to foster cooperation in variety selection, cross regional mechanization services and joint disaster prevention. To counteract the negative spillovers associated with cultivated-land resources, regional planting plans for each area should be formulated to optimize factor allocation and prevent disorderly competition for labor and agricultural inputs. ② Strengthening market linkage and stability mechanisms. Develop a digital production-marketing data platform integrating data on production, processing, supply chain, and pricing; Establish a market risk early warning and reserve adjustment mechanisms to reduce the impact of market fluctuations on production.
5.4 Optimizing fiscal subsidy mechanisms to stimulate production vitality
Innovate policy instruments should be deployed to address resource and production factors constraints, forming a diversified incentive system. Key strategies include: ① Restructuring soybean subsidy frameworks. Reform the traditional subsidy model that prioritizes area over unit yield by introducing targeted subsidies that reward yield gains and green production, thereby creating a dual incentive scheme based on “sown area and yield (unit yield) technology.” ② Enhancing precision fiscal support. Increase investment in county-level infrastructure such as farmland water conservancy and storage logistics; Prioritize high-standard farmland construction in ecologically fragile zones of central and western regions. ③ Establishing and refining intra-provincial and inter-provincial grain benefit compensation mechanisms. To address growing disparities in soybean production-marketing patterns between provinces and within provinces, collaboratively promote regional grain cooperation through financial compensation, industrial support, and technical assistance.
Furthermore, considering the significant positive driving effect of precipitation factors on soybean yield, it is advisable to appropriately construct small reservoirs and irrigation canals in the eastern regions to improve the utilization rate of natural rainfall, and promote rainwater harvesting irrigation systems in the central-western regions to effectively alleviate drought stress. To address the elastic constraints on the comparative benefits of soybeans and agriculture, a combined policy of “soybean producer subsidies and price insurance” is recommended to safeguard farmers’ income stability; Simultaneously, establishing industrial clusters for soybean intensive processing should be prioritized to elevate market value-added potential. Regarding the significant impacts of labor scale and mechanization level, accelerating agricultural mechanization development is essential to alleviate human resource shortages caused by rural labor outflow. Specifically, the intensified promotion and adoption of efficient machinery such as combine harvesters and precision seeders is recommended. In response to the diminishing marginal returns of chemical fertilizers, it is necessary to promote the application of organic fertilizers or microbial fertilizers to replace partial chemical fertilizers. Specifically, actions to reduce chemical fertilizers while increasing efficiency should be implemented in the eastern black soil region, complemented by crop rotation to improve soil organic matter content.
Data availability statement
The raw data supporting the conclusions of this article will be made available by the authors, without undue reservation.
Author contributions
JH: Conceptualization, Investigation, Methodology, Software, Writing – original draft, Writing – review & editing. JZ: Conceptualization, Formal analysis, Funding acquisition, Investigation, Project administration, Resources, Supervision, Validation, Writing – review & editing.
Funding
The author(s) declare that financial support was received for the research and/or publication of this article. This work was supported by the National Natural Science Foundation of China under the project titled “Research on the Interest Linkage Mechanism of the Grassland Livestock Product green supply chain from the Perspective of Pastoral Area Modernization” (72163025), the Natural Science Foundation of Inner Mongolia under the project titled “Research on the Mechanism and Path of Enhancing the Added Value of Inner Mongolia Agricultural Products from the Perspective of the Supply Chain” (2025MS07005), the Basic Research Funds Project of Inner Mongolia Agricultural University for Young Teachers’ Research Ability Enhancement Special Project “Research on Coordination Mechanism of Green Supply Chain for Livestock Products in Inner Mongolia”(BR220201), and the Inner Mongolia Rural Revitalization Strategy Research Base.
Conflict of interest
The authors declare that the research was conducted in the absence of any commercial or financial relationships that could be construed as a potential conflict of interest.
Generative AI statement
The authors declare that no Gen AI was used in the creation of this manuscript.
Any alternative text (alt text) provided alongside figures in this article has been generated by Frontiers with the support of artificial intelligence and reasonable efforts have been made to ensure accuracy, including review by the authors wherever possible. If you identify any issues, please contact us.
Publisher’s note
All claims expressed in this article are solely those of the authors and do not necessarily represent those of their affiliated organizations, or those of the publisher, the editors and the reviewers. Any product that may be evaluated in this article, or claim that may be made by its manufacturer, is not guaranteed or endorsed by the publisher.
References
Cai, R., and Tao, S. (2021). Evolution of China’s grain production layout and decomposition of spatial mechanisms: 1978-2018. J. Arid Land Resour. Environ. 35, 1–7. doi: 10.13448/j.cnki.jalre.2021.150
Chang, J., Lin, Z., Gao, W., and Du, X. (2024). Spatiotemporal evolution and driving factors of 818 soybean production in Sichuan Province. Chin. J. Eco-Agric. 32, 476–489. 819. doi: 10.12357/cjea.20230386
Chen, Y. (2020). Research on China's soybean self-sufficiency rate and soybean supply rate. Stat. Decis. 36, 63–67. doi: 10.13546/j.cnki.tjyjc.2020.06.013
Chen, Y., Jiang, Y., and Zhang, Y. (2022). Spatio-temporal evolution and influencing factors of 823 soybean production in China. Econ. Geogr. 42, 87–94. doi: 10.15957/j.cnki.jjdl.2022.03.009
Clemente, A. M., Júnior, O. A. D. C., Guimarães, R. F., McManus, C., Turazi, C. M. V., and Hermuche, P. M. (2017). Spatial-temporal patterns of bean crop in Brazil over the period 1990–2013. ISPRS Int. J. Geo Inf. 6:107. doi: 10.3390/ijgi6040107
Du, R., Liu, S., and Cai, R. (2023). The characteristics and driving mechanism of China’s grain spatial production pattern evolution. On Economic Problems, 92–102. doi: 10.16011/j.cnki.jjwt.2023.08.014
Du, G., Ma, M., Zhang, R., and Liu, Z. (2024). Change of maize-soybean cropping patterns and 836 its link with climate warming in Northeast China between 2000 and 2020. Resour Sci 46, 2251–2262. doi: 10.18402/resci.2024.11.12
Du, G., Yao, X., and Zang, L. (2025). Evolution of farming system and its influencing factors in the black soil region of Northeast China. Chin. J. Eco-Agric. 33, 646–655. doi: 10.12357/cjea.20240434
Elhorst, J. P. (2014). Spatial econometrics: From cross-sectional data to spatial panels. Heidelberg: Springer.
Feng, F., Zhang, Z., Gu, Y., He, J., and Tian, Z. (2022). Discussion on approaches to improving soybean supply capacity in China. Bull. Chin. Acad. Sci. 37, 1281–1289. doi: 10.16418/j.issn.1000-3045.20220622002
Huang, X., Yao, F., Ma, L., and Chu, X. (2020). Study on pattern evolution and spatial agglomeration of tea production: a case study of Guangdong Province. J. Tea Sci. 40, 415–429. doi: 10.3969/j.issn.1000-369X.2020.03.012
Inner Mongolia Autonomous Region Committee. (2024). Deepen and solidify the construction of a national important agricultural and livestock products production base. Available online at: http://www.nmgsjw.cn/djyd/202401/t20240131_30454.html (Accessed May 28, 2025).
Kong, W., Wei, M., Khan, N., Liang, J., Han, D., and Zhang, H. (2024). Assessing sustainable future of import-independent domestic soybean production in China: policy implications and projections for 2030. Front. Sustain. Food Syst. 8:1387609. doi: 10.3389/fsufs.2024.1387609
LeSage, J., and Pace, R. K. (2009). Introduction to spatial econometrics. Boca Raton: Chapman and Hall/CRC.
Li, W. (2019). Spatiotemporal evolution characteristics and influencing factors of wheat production in China. Chin. J. Agric. Resour. Reg. Plan. 40, 49–57. doi: 10.7621/cjarrp.1005-9121.20191007
Li, Z., and He, X. (2024). Influencing factors and optimization countermeasures of spatial and 884 temporal evolution patterns of soybean production in China. Soybean Sci. 43, 782–792. 885. doi: 10.11861/j.issn.1000-9841.2024.06.0782
Li, E., Pang, A., and Zhu, J. (2012). Analysis of the evolution path and mechanism of China’s agricultural agglomeration and geographic pattern. Geogr. Res. 31, 885–898. doi: 10.11821/yj2012050012
Li, E., Wei, S., and Xu, Y. (2016). Evolution of the geographical agglomeration pattern of soybean cultivation in China. Econ. Surv. 33, 37–42. doi: 10.15931/j.cnki.1006-1096.2016.03.008
Li, Q., Zhang, H., and Chen, F. (2008). Analysis of the characteristics of changes in the planting pattern of food crops in the northeast agricultural region of China. J. China Agric. Univ. 13, 74–79. doi: 10.3321/j.issn:1007-4333.2008.03.013
Li, Y., Zhang, S., Guo, L., Yang, X., Li, C., Bao, D., et al. (2025). Analysis of crop seed yield supply and demand situation and countermeasures in Inner Mongolia in 2024. China Seed Industry, 5–7. doi: 10.19462/j.cnki.zgzy.20241215001
Liu, Y., Gao, B., Pan, Y., and Gao, Y. (2014a). Investigating contribution factors to China’s grain output increase based on LMDI model during the period 1980 to 2010. J. Nat. Resour. 29, 1709–1720. doi: 10.11849/zrzyxb.2014.10.007
Liu, J., Hao, S., Wang, G., and Liu, J. (2024b). Changes in China's feed-grain production pattern and its influencing factors. Chin. J. Agric. Resour. Reg. Plan. 45, 11–20. doi: 10.7621/cjarrp.1005-9121.20240802
Liu, Y., Meng, D., Zhou, Y., and Gao, B. (2014b). Contribution factors to grain prouction increase based on gravity center model and LMDI model in Beijing-Tianjin-Hebei region from 1990 to 2010. Econ. Geogr. 34, 125–130. doi: 10.15957/j.cnki.jjdl.2014.08.047
Liu, F., Zhao, X., Yin, F., Yang, P., Guo, Z., Zhang, H., et al. (2024a). Analysis on changes in the regional pattern of soybean production and influencing factors in Shandong Province. Soybean Sci. 43, 793–804. doi: 10.11861/j.issn.1000-9841.2024.06.0793
Maltauro, T., Uribe-Opazo, M., Guedes, L., Galea, M., and Nicolis, O. (2025). Spatial-temporal variability of soybean yield using separable covariance structure. Agriculture 15:1199. doi: 10.3390/agriculture15111199
Niu, Y., Xie, G., Xiao, Y., Liu, J., Wang, Y., Luo, Q., et al. (2021). Spatiotemporal patterns and determinants of grain self-sufficiency in China. Foods 10:747. doi: 10.3390/foods10040747
People’s Government of the Inner Mongolia Autonomous Region. (2025). 2024 National Economic and social development statistical bulletin of the Inner Mongolia Autonomous Region. Available online at: http://www.nmg.gov.cn/tjsj/sjfb/tjsj/tjgb/202504/t20250402_2692478.html (Accessed May 28, 2025).
Pu, Y. (2011). Understanding locational Gini index: limitations and selection of benchmark distribution. Stat. Res. 28, 101–109. doi: 10.3969/j.issn.1002-4565.2011.09.016
Shao, Y., Yang, R., and An, Y. (2025). Grain production spatial evolution and its influencing factors in China. Trans. Chin. Soc. Agric. Eng. 41, 265–277. doi: 10.11975/j.issn.1002-6819.202504045
Song, X., Hansen, M., Potapov, P., Song, X. P., Hansen, M. C., Adusei, B., et al. (2021). Massive soybean expansion in South America since 2000 and implications for conservation. Nat. Sustain. 2021, 784–792. doi: 10.1038/s41893-021-00729-z
Sun, Z., Yang, C., and Li, Z. (2024). New ideas for improving the benefit compensation mechanism in China’s major grain-producing areas. Agric. Econ. Manag. 83, 1–11. doi: 10.3969/j.issn.1674-9189.2024.01.001
Tu, S., Jian, D., Long, H., Li, T., and Zhang, Y. (2022). Evolution characteristics and mechanism of major crops production patterns in Guangxi. Acta Geograph. Sin. 77, 2322–2337. doi: 10.11821/dlxb202209013
Wang, H., Fang, Y., and Liu, J. (2020). Spatio-temporal evolution of crop-planting structure in Heilongjiang Province, 2005–2015. Areal Res. Dev. 39, 168–174. doi: 10.3969/j.issn.1003-2363.2020.01.030
Wang, Y., Liu, X., Ma, C., Liu, C., Zhang, W., Huang, J., et al. (2023). Can China get out of soy dilemma? A yield gap analysis of soybean in China. Agron. Sustain. Dev. 4:43. doi: 10.1007/s13593-023-00897-6
Wang, F., and Xia, Y. (2024). Spatio-temporal pattern evolution and influencing factors of main crops production in arid region: a case of Xinjiang. Arid Land Geogr. 48, 444–454. doi: 10.12118/j.issn.1000-6060.2024.201
Wang, Y., Yu, H., and Shu, K. (2024). Trends and countermeasures of China’s soybean industry development. Soc. Sci. Front 346, 253–258.
Wei, Y., Zhang, H., and Zhu, J. (2021). An analysis of dependence risk and market layout optimization for soybean import of China under the new development pattern. Chin. Rural Econ., 66–86.
Xiao, Q., Li, J., and Liu, D. (2015). Development countermeasures of China’s soybean industry under the impact of genetically modified soybean. Forum Sci. Technol. China, 137–141. doi: 10.3969/j.issn.1002-6711.2015.06.025
Yan, M., Zhou, X., Liu, Z., and Zhang, Y. (2024). Pattern and contributing factors of increasing production of oilseed in China. China Oils and Fats 49, 1–8. doi: 10.19902/j.cnki.zgyz.1003-7969.230054
Yang, X., Yang, Q., Wang, Y., and Liu, S. (2022). The analysis of spatial-temporal pattern changes of soybean production in the United States in recent 100 years. World Agric. 515, 25–35. doi: 10.13856/j.cn11-1097/s.2022.03.003
Yao, C., Yang, Y., and Yin, W. (2020). Geographical agglomeration and spatial evolution of non-staple food production in China. Econ. Geogr. 40, 155–165. doi: 10.15957/j.cnki.jjdl.2020.12.018
Yu, Y., Tang, H., Hua, J., Zhang, X., and Zhang, M. (2023). Spatiotemporal evolution characteristics and influencing factors of soybean production in China. J. Henan Agric. Univ. 57, 874–883. doi: 10.16445/j.cnki.1000-2340.20230421.002
Zhang, J. (2007). A convenient method to calculate Gini coefficient. J. Shanxi Agric. Univ. Soc. Sci. Ed. 6, 275–278, 283. doi: 10.3969/j.issn.1671-816X.2007.03.015
Zhang, S., and Cai, R. (2024). Market-oriented reform of soybean purchase and storage system 948 and its production pattern in China. J. Arid Land Resour. Environ., 38, 31–41. 949 doi: 10.13448/j.cnki.jalre.2024.138
Zhang, X., Hou, L., and Zhang, Y. (2025). Spatio-temporal evolution of county-level grain production pattern and agricultural machinery driving in China. J. Chin. Agric. Mech. 46, 41–48. doi: 10.13733/j.jcam.issn.2095-5553.2025.10.005
Zhang, Z., Lou, Y., Zhang, Y., Guo, X., Feng, S., and Zheng, M. (2018). Spatial-temporal patterns and contribution factors of Henan’s grain output increase during 2003–2015. Agric. Resour. Reg. Plan. 39, 28–34. doi: 10.7621/cjarrp.1005-9121.20180605
Zhang, B. R., and Zhang, J. Y. (2024). Spatio-temporal evolution characteristics and driving factors of major oil crops production in China during 2000–2020. Southwest China J. Agric. Sci. 37, 1377–1385. doi: 10.16213/j.cnki.scjas.2024.6.028
Keywords: soybean production, food security, spatial–temporal evolution, spatial Durbin model, Inner Mongolia
Citation: Hu J and Zhang J (2025) Spatial–temporal evolution and driving mechanism in soybean production patterns: a case study of Inner Mongolia, China. Front. Sustain. Food Syst. 9:1686721. doi: 10.3389/fsufs.2025.1686721
Edited by:
Xin Wang, Longyan University, ChinaReviewed by:
Xu Yue Yue, Shanxi Agricultural University, ChinaXiaodong Chang, Northeast Normal University, China
Qiang Liao, Sichuan Academy of Agricultural Sciences, China
Copyright © 2025 Hu and Zhang. This is an open-access article distributed under the terms of the Creative Commons Attribution License (CC BY). The use, distribution or reproduction in other forums is permitted, provided the original author(s) and the copyright owner(s) are credited and that the original publication in this journal is cited, in accordance with accepted academic practice. No use, distribution or reproduction is permitted which does not comply with these terms.
*Correspondence: Jianjun Zhang, amd5empqQGltYXUuZWR1LmNu