 Abdelbaset S. El-Sorogy1
 Talal Alharbi1Sattam A. Almadani1Salim Shoaib1
 Naji Rikan1Jose Emilio Meroño de Larriva2
 Mohamed S. Shokr3*
- 1Department of Geology and Geophysics, College of Science, King Saud University, Riyadh, Saudi Arabia
- 2Department of Graphic Engineering and Geomatics, Campus de Rabanales, University of Cordoba, Cordoba, Spain
- 3Department of Soil and Water, Faculty of Agriculture, Tanta University, Tanta, Egypt
Introduction: Global health, food security, and agricultural production are all seriously threatened by soil pollution. The main objective of this work is to conduct a comprehensive assessment of soil pollution in the Al-Muzahmiya region west of Riyadh, Saudi Arabia using a multidisciplinary approach.
Methodology: This involves measuring concentrations of nine heavy metals (Co, Cr, Cu, Fe, Mn, Ni, Pb, V, Zn), applying contamination indices, and employing Principal Component Analysis (PCA), Hierarchical Cluster Analysis (HCA), and Geographic Information System (GIS) for source identification and spatial analysis. To determine the level of heavy metal (Co, Cr, Cu, Fe, Mn, Ni, Pb, V, and Zn) contamination in the soil, 31 surface soil samples were selected at random from the study area. The PLI ranged from 0.23 to 0.85, with an average of 0.49, suggesting relatively uncontaminated soil pollution load index (PLI < 1). With the exception of sample number 12 (1.09), all nine soil heavy metals in the research region had Nemerow pollution index (NPI) values less than 0.7, indicating that the study area samples were not affected by pollution.
Results and discussion: The PCA analysis revealed two primary components. For the HMs being studied, the correlation matrix of the geogenic source is supported by PC1. The loadings suggest that zinc on PC2 may have originated from the application of phosphate fertilizers and fungicides in agricultural fields to boost yields. The research region was split into two clusters according to the concentrations of HMs. Higher concentrations of particular heavy metals most likely identify the samples in the second cluster. This increase may be due to their proximity to agricultural areas, where practices such as the usage of phosphate fertilizers may help to accumulate these elements in the soil.
Conclusions: In conclusion, the integrated approach of contamination indices, PCA, and GIS successfully established a comprehensive environmental baseline. The results confirm that the area is currently unpolluted, underscoring the importance of periodic monitoring to preserve this condition. Future food security, sustainable agricultural development (which is in line with UN SDG 2: Zero Hunger), and the preservation of the region’s natural resources for future generations all depend on this recent findings.
1 Introduction
Humans rely on soil as a habitat in addition to it being a valuable natural resource (Zhao et al., 2021). Due to rapid economic growth and human activities like mining, metal processing, smelting, chemical production, factory drainage, and sewage irrigation, the concentration of heavy metals in soil has increased, placing a significant strain on ecosystem, human health, and soil resources (Xu et al., 2014; Yang et al., 2018). A global problem for the management of the environment and human health is the emergence of new contaminants in the environment as a result of economic expansion (El-Sorogy and Al Khathlan, 2024). Heavy element soil pollution is a serious and persistent environmental problem with significant ramifications for human society (Wang et al., 2008; Ali et al., 2013; Ali et al., 2017; Alharbi et al., 2018a; Alharbi et al., 2018b). In addition to being naturally occurring, these heavy metals are also produced by a variety of human activities (Wang et al., 2018).
Even while these components are necessary for biological processes, high amounts of them can be harmful. Indeed, even at very low concentrations, certain heavy metals are harmful (Alloway, 2012). Arsenic (As), asbestos, cadmium (Cd), uranium, lead (Pb), thallium, mercury (Hg), antimony, manganese (Mn), barium, chlorine (Cl), zinc (Zn), beryllium (Be), bromine, and bismuth are among the heavy metals that are especially dangerous (Benhaddya and Hadjel, 2014). Importantly, since recent times, some heavy metals have been recognized as highly dangerous compounds. Saudi Arabia is the largest nation in the Middle East, with a total area of over 2.25 million km2 (Al-Dosary, 2022). Mountains, plateaus, plains, valleys, and sand dunes are just a few of the topographic elements that define it. Saudi Arabia is divided into four different geological terrains (Laurent, 1993). The narrow Red Sea coastal plain of Tertiary and Quaternary sedimentary rocks and coral reefs, the Proterozoic Arabian Shield of metamorphosed volcano sedimentary successions intruded by granite and gabbro, the Arabian platform gently dipping eastward, and the Tertiary “harrats” primarily covering the Shield (Sheta, 2004). Saudi Arabian soil can be classified as follows using the current US soil classification system: Mollisols, which are rich in organic matter and concentrated in the southwest region of the Saudi Kingdom; Entisols, which are sandy soils and valleys that make up modern landforms; and Aridisols, which are dry soils with lime and salt accumulations (Sheta, 2004; Al-Dosary, 2022). Due mainly to a lack of rainfall, the majority of Saudi Arabia’s soils are regarded as immature or young (Ashraf, 1991). The soil in the research area and the central region of Saudi Arabia can be divided into three types: Torriorthents, Torrifluvents, and Torripsamments (Shadfan et al., 1984; Alharbi et al., 2024). Torriorthents are shallow soils that can be loamy sand, fine sandy loam, sandy loam, loam, or clay loam. They usually form in weathering-resistant rocks and residuum or colluvium on slopes that are actively eroding. Conversely, stratified Entisols known as Torrifluvents form in alluvial sediments as a result of sporadic stream flooding. On stream terraces, well-sorted sandy deposits with a turbulent moisture regime give rise to Torripsamments. Two well-known multivariate analytic methods that are frequently used for data identification, classification, and modeling are (PCA) and Hierarchical Cluster Analysis (HCA). PCA has ability to process large amounts of data without being limited to a particular number (Abdel-Fattah et al., 2020). Additionally, PCA was utilized to identify various sources of soil pollution, including industrial or agricultural processes, as well as the proportion of heavy metals that contribute to soil contamination in arid areas (Mohamed et al., 2023; Alzahrani et al., 2024; Mohamed et al., 2024). Additionally, HCA looks at sample distances, grouping the most comparable spots into a single cluster. It is an unsupervised classification method that iteratively combines the closest two clusters. The most crucial aspect of HCA, because to its recursive structure, is figuring out how to automatically halt the procedure when the clustering error rate drops to its lowest value 22 (Irpino and Verde, 2006).
These analytical techniques greatly advance our comprehension of the data and play a crucial role in directing well-informed decision-making across a range of domains, such as environmental management and soil science (Csomós et al., 2002; Jalhoum et al., 2024). Although soil pollution has been identified in Saudi Arabia by earlier studies, there is a substantial lack of thorough spatial analysis and mapping of a larger range of heavy metals and petrochemical pollutants using sophisticated geostatistical techniques combined with GIS to pinpoint contamination hotspots and their sources. Thus, the primary aim of this study is to evaluate the level of soil pollution in the Al-Muzahmiya region, which is located west of Riyadh, Saudi Arabia, by combining contamination indicators, multivariate techniques, and GIS. The specific objectives are: (i) to use GIS to measure the concentrations of Co, Cr, Cu, Fe, Mn, Ni, Pb, V, and Zn contamination in the research area’s soils and map their spatial distribution; (ii) to compare the concentrations of these heavy metals in the study area with those in soils throughout the world and in various environmental contexts; (iii) to calculate the degree of contamination using contamination indices; (iv) and to identify the heavy metal source using multivariate analysis.
2 Materials and methods
2.1 Study area
Al-Muzahmiya region located west of Riyadh, Saudi Arabia. With a total area of 14918.28 ha, it is located between latitudes 46° 9′30′′, 46°0.20′30′′ N, and longitudes 24° 19′30′′ and 24°0.30′′ E (Figure 1). Riyadh’s weather is characterized by persistent hot winds and little precipitation. Temperatures in the summer range from 45 to 50 °C Celsius. Temperatures can change by 15 °C on a regular basis. Temperatures in the winter range from 20 to 5 °C (Alsabhan et al., 2022). The geology of the Al-Muzahmiya region is defined by sedimentary rock formations, principally limestone and sandstone, that date back to the Paleozoic and Mesozoic eras. The region’s proximity to the Tuwaiq Escarpment increases its geological richness and attracts scholars interested in sedimentary basins (Alsharhan and Rizk, 2020). The geological sequence in the studied region consists of the Middle Jurassic Dhruma and Tuwaiq Mountain Limestone formations, as well as Quaternary eolian sand, alluvial terraces, and gravel sheets. The sequence is distinguished by limestones, claystones, and sands (Youssef and El-Sorogy, 2015; EL-Sorogy et al., 2016). The geological composition has a direct influence on the region’s soil quality, which is generally calcareous and mineral-rich. This type of soil is ideal for date palm production, a primary crop in the area. However, its low organic content is a barrier for other forms of agriculture, necessitating the application of fertilizers and soil conditioners. The interaction between geology and agriculture emphasizes the significance of sustainable land management methods in Al-Muzahmiya (FAO, 2022).
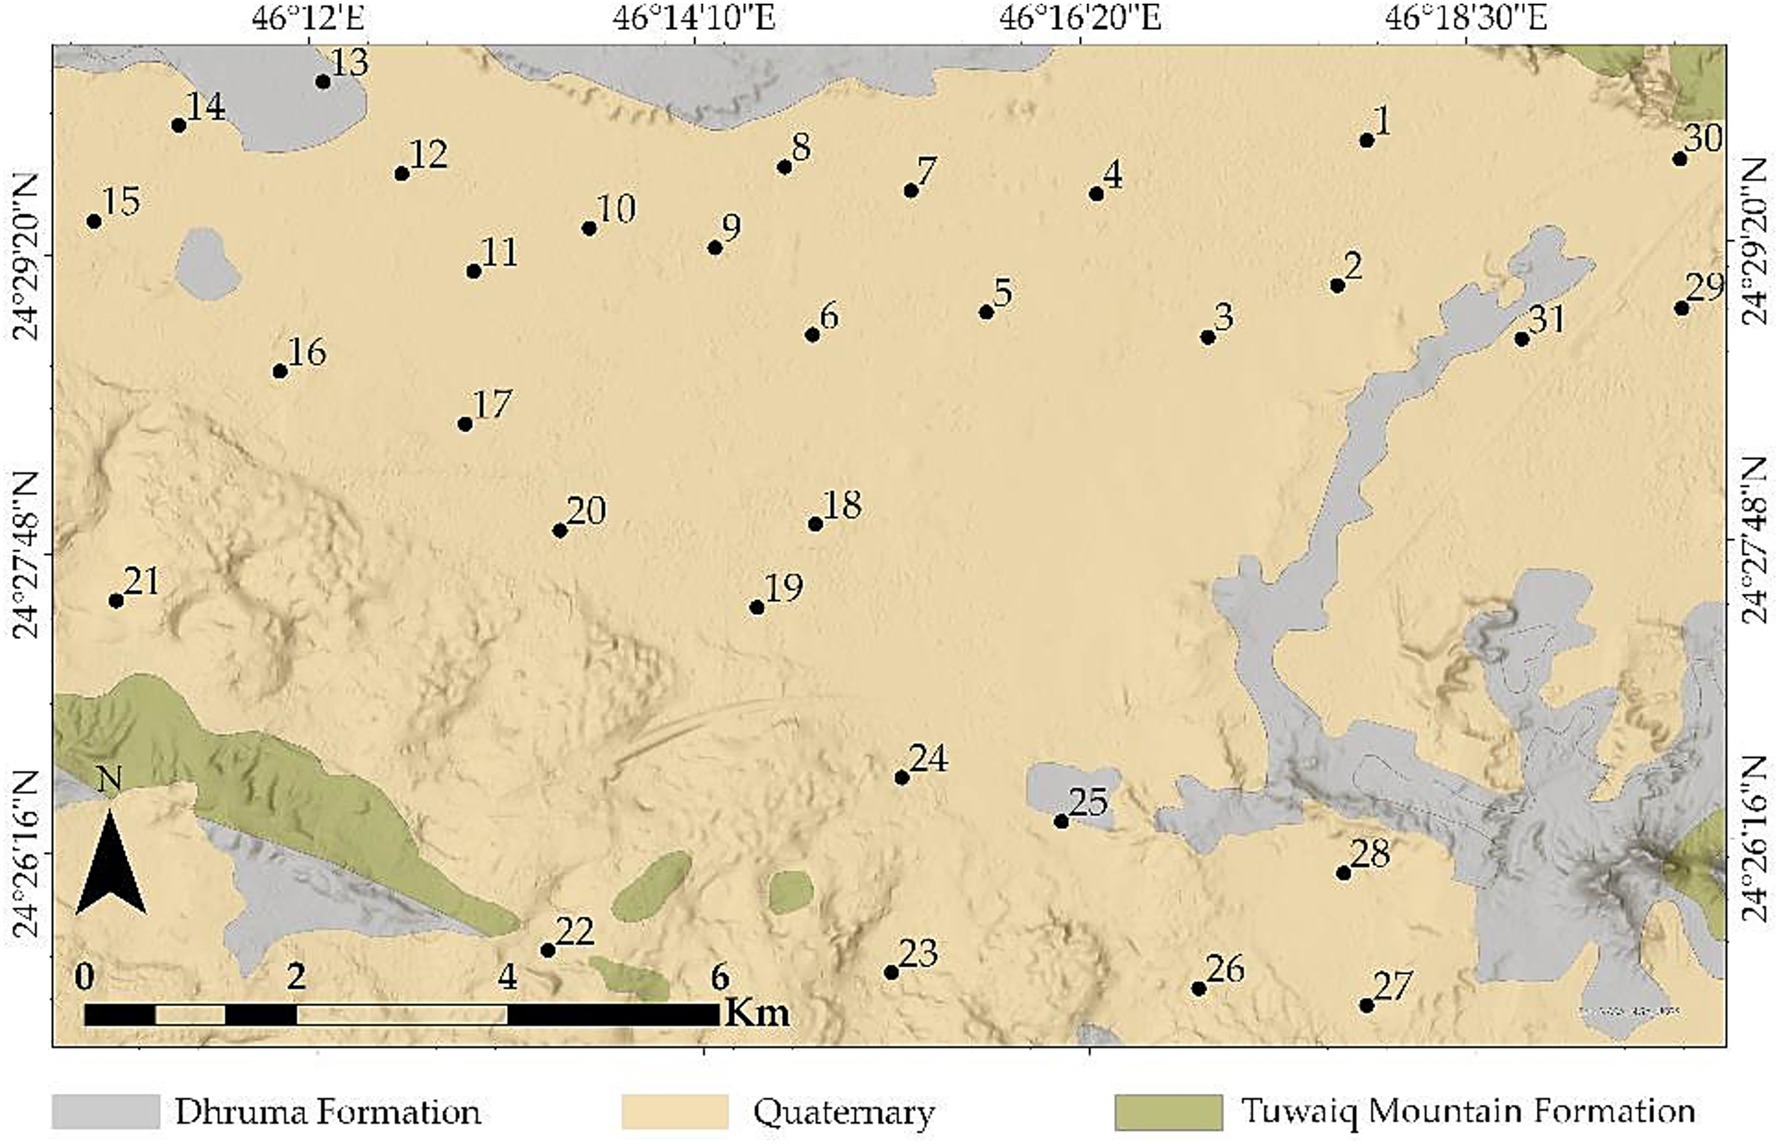
Figure 1. Geologic map of the study area with sampling locations.
2.2 Soil survey and laboratory analysis
Thirty-one surface soil samples were randomly chosen from the study region in January 2025 to assess the degree of heavy metal pollution in the soil (Figure 1) and ensure that the samples collected cover a wide range of possible soil conditions within the site’s geographic area. A representative sample was created by mixing three subsamples into a composite sample, which was thereafter packed in plastic bags and kept in box. The samples were gathered at a depth of less than 30 cm using a hard plastic hand trowel to prevent contamination. The soil samples were carefully cleaned of big stones and organic materials after being allowed to dry in the atmosphere. Agate mortar and pestle were then used to grind the material into a powder. Inductively coupled plasma-atomic emission spectrometry (ICP-AES) has been used in the ALS Geochemistry Lab, Jeddah branch in Saudi Arabia, to analyze major elements (Ca, Mg, and K) and nine heavy metals (Co, Cr, Cu, Fe, Mn, Ni, Pb, V, and Zn). Using aqua regia, roughly and 0.50 g of each sample is digested for 45 min at temperatures ranging from 60 to 120 °C in a graphite heating block. Their vulnerability to risks to human health and the environment is acknowledged for the chosen HMs (Jaishankar et al., 2014; El-Sorogy and Al Khathlan, 2024). By computing the concentration equal to three times the standard deviation of blank solution measurements divided by the slope of the measurement, the limit of detection (LOD) for the ICP-AES technique was determined curves of calibration for every component. This validation method follows accepted practices (Papadoyannis and Samanidou, 2004). The precision and accuracy of the analytical methods used for the multi-element evaluation of soil samples, including two certified reference materials from Western Australia (CRM11: EMOG17 and CRM2: OREAS 45f) to ensure data precision prior to release and a blank agent to measure the background, were evaluated using Certified Reference Material (CRM) (Supplementary Tables S1, S2). The precision of the employed methodology is reliably indicated by recoveries with a range of 98.07–118.18% (Nazzal et al., 2016; Chandrasiri et al., 2019).
2.3 Pollution indices
2.3.1 Contamination factor
The degree of soil contamination is frequently ascertained using the factor of contamination. It is described by the following Equation 1 (Hakanson, 1980). The classification of CF illustrated in Supplementary Table S3
From which the element’s geochemical background is represented by Cm geochemical background, whereas the metal content in the sample is represented by Cm sample.
2.3.2 Pollution load index
PLI is mostly used to assess the total level of soil heavy metal pollution in a study region as well as each sample site (Zhou et al., 2016). PLI can show which heavy metals are the most dangerous as well as how much each one contributes to pollution in the environment. The following is the PLI Equation 2:
where n is the number of soil heavy metals. The background values of Wedepohl (1994) were used for evaluation standard in this work. PLI less than or equal 1 indicates uncontaminated; 1 ≤ PLI < 2 indicates uncontaminated to moderately contaminated; 2 ≤ PLI < 3 indicates moderately to strongly contaminated; and PLI ≥ 3 indicates strongly contaminated.
2.3.3 Nemerow pollution index
To fully reflect the average pollution level of different pollutants in the soil and draw attention to the role of more dangerous pollutants, the comprehensive pollution index considers both the average value and the highest value of the single factor pollution index (Guan et al., 2014; Kowalska et al., 2018). The Nemerow pollution index (NPI) is typically used to assess the overall level of heavy metal pollution in soil (Ma et al., 2018). The Equation 3 for calculation is:
Where n is the number of HMs, where is the average value of the single pollution index for each heavy metal, and the is the maximum value of the single pollution index for each heavy metal. According to Kowalska et al. (2018) NPI classified soil quality into five classes: clean (≤0.7), warning limit (0.7–1.0), slight pollution (1–2), moderate pollution (2–3), and serious contamination (≥3).
2.4 Statistical analysis
Three duplicates of each sample were taken, and the mean, standard deviation, skewness, kurtosis, and coefficient of variance were used to summarize the data. SPSS v.22 (IBM, United States) and Python software V3.10 were the tools utilized for this analysis. Principal component analysis (PCA) and hierarchical cluster analysis (HCA) are two effective multivariate approaches for identifying the origins of variability in the HMS contents (Sun et al., 2010). To determine the connections between HMs and their mode of origin, HCA was utilized. Ward’s technique was followed, and Euclidean distance was used as a similarity metric. The findings, which provide an overview of clusters for HMs, are displayed as dendrogram (Marrugo-Negrete et al., 2017). The fundamental purpose of PCA is to reduce the HMs to a more manageable set of variables. Following the Kaiser–Meyer–Olkin (KMO) test, which evaluated the appropriateness of sampling for every variable, PCA was carried out (Peres-Neto et al., 2005). The KMO value of 0.745 was determined to be more than 0.5 since soil samples were judged suitable (Supplementary Table S4; Said et al., 2020). The Shapiro–Wilk test was used to determine whether the distribution of metals in soil was normal (Korzeniowska, 2022). To investigate the correlations between metals in soils, Pearson’s correlation was used (Abuzaid et al., 2023). Absolute loading values over 0.75, 0.75–0.5, and 0.49–0.30 were regarded as significantly, moderately, and weakly associated to the PC, respectively, and only PCs with eigenvalues >1.0 were taken into consideration (Fan et al., 2019).
2.5 Method of spatial distribution
The Inverse Distance Weighting (IDW) interpolation technique is used in ArcGIS software 10.8 to estimate attribute values of HMs at unsampled locations using data obtained at sample sites IDW is an accurate interpolation technique that bases weighting on the distance impact is IDW interpolation. The local maximum’s effect range and the polluted area’s prediction range both increase with the significance of the distance weighting coefficient (Isaaks and Srivastava, 1989; Hodam et al., 2017; Zhao et al., 2021). The most dependable IDW interpolation results occur when the power parameter values fall between 0.5 and 3, with 2 being the most commonly used value (Gotway et al., 1996; Gong et al., 2014). As a result, the value of p was set at 2, and the search radius varied with 12 nearby samples. The selection of soil samples for this study was based on their unequal distribution. This distribution resulted from problems encountered during sample collection on the site, including access problems in certain areas and the presence of private farms that made routine or dense sampling challenging.
2.6 Calculation of vegetation status in the study area
The most used index for examining the condition of vegetation is the Normalized difference vegetation index (NDVI) (Tarpley et al., 1984; Gitelson et al., 2003; Thenkabail and Gamage, 2004; Dutta et al., 2015). Google Earth Engine (GEE) uses Sentinel-2 data collected in January 2025 to calculate NDVI, a high-spatial resolution evaluation of vegetation density and health. The Equation 4 was used to determine the NDVI.
Where: B8 and B4 = band 8, and band 4 of Sentinel-2 satellite image.
A red channel at around 0.66 μm and a near-IR channel at about 0.86 μm are used to derive the index based on radiances or reflectance (Gao, 1996).
While leaf chlorophyll and other pigments absorb a significant amount of the visible (VIS) radiation, the inner mesophyll of healthy green leaves, which is highly reflective of near-infrared (NIR) radiation, is what the NDVI measures. When unwholesome vegetation is present, the range reflecting the inverted composition of the inner leaf (Dutta et al., 2015; Ghafarian Malamiri et al., 2018). Healthy vegetation often falls between values of 0.2 and 0.8 on the NDVI index, which by definition spans from −1 to +1 (Chuvieco et al., 2004; Cai et al., 2014; Gandhi et al., 2015).
The detection and recognition of diverse land cover and land use types are one of the most significant applications of remote sensing. Machine learning techniques for crop classification have been evolving recently. Users can apply a range of advanced categorization approaches to examine different satellite datasets using a cloud-based platform called Google Earth Engine (Clemente et al., 2020; Xue et al., 2023). Using Landsat 5 optical data from January 2000 and Sentinel-2 (10 m) high-resolution optical data from January 2025, crops were categorized using the Random Forest (RF) algorithm (Akbari et al., 2020; Tariq and Shu, 2020). Seventy percent of the 3,000 ground truth data points that were used to evaluate the accuracy of the model were reserved for model calibration, allowing for the adjustment of features and parameters. By ensuring that the model can consistently generalize its findings outside of the calibration dataset, the calibration-validations split enhances the model’s credibility. The remaining type center was set aside for the validation of the model. For agricultural planning, management, and observation, this tool aids in more precise and dependable crop pattern identification (Hendawy et al., 2024).
2.7 Creation of land surface parameters of the study area
The elevation and slope of the research region were determined using the Digital Elevation Model (DEM), which was created by the NASA Shuttle Radar Topographic Mission (SRTM) and has a spatial resolution of 30 m.
3 Results and discussion
3.1 Land use and land cover (LILC) pattern and NDVI in the investigated area
Sentinel-2 image of the study region is ranked by NDVI values in the figure; an NDVI of less than 0.60 corresponds to orange and yellow, while an NDVI of more than 0.6 indicates green (NDVI is calculated in the range of −1 to 1) (Figure 2a). By using satellite imagery and the NDVI to monitor land quality, we can determine the extent of soil contamination and soil cover (Gantumur et al., 2021).
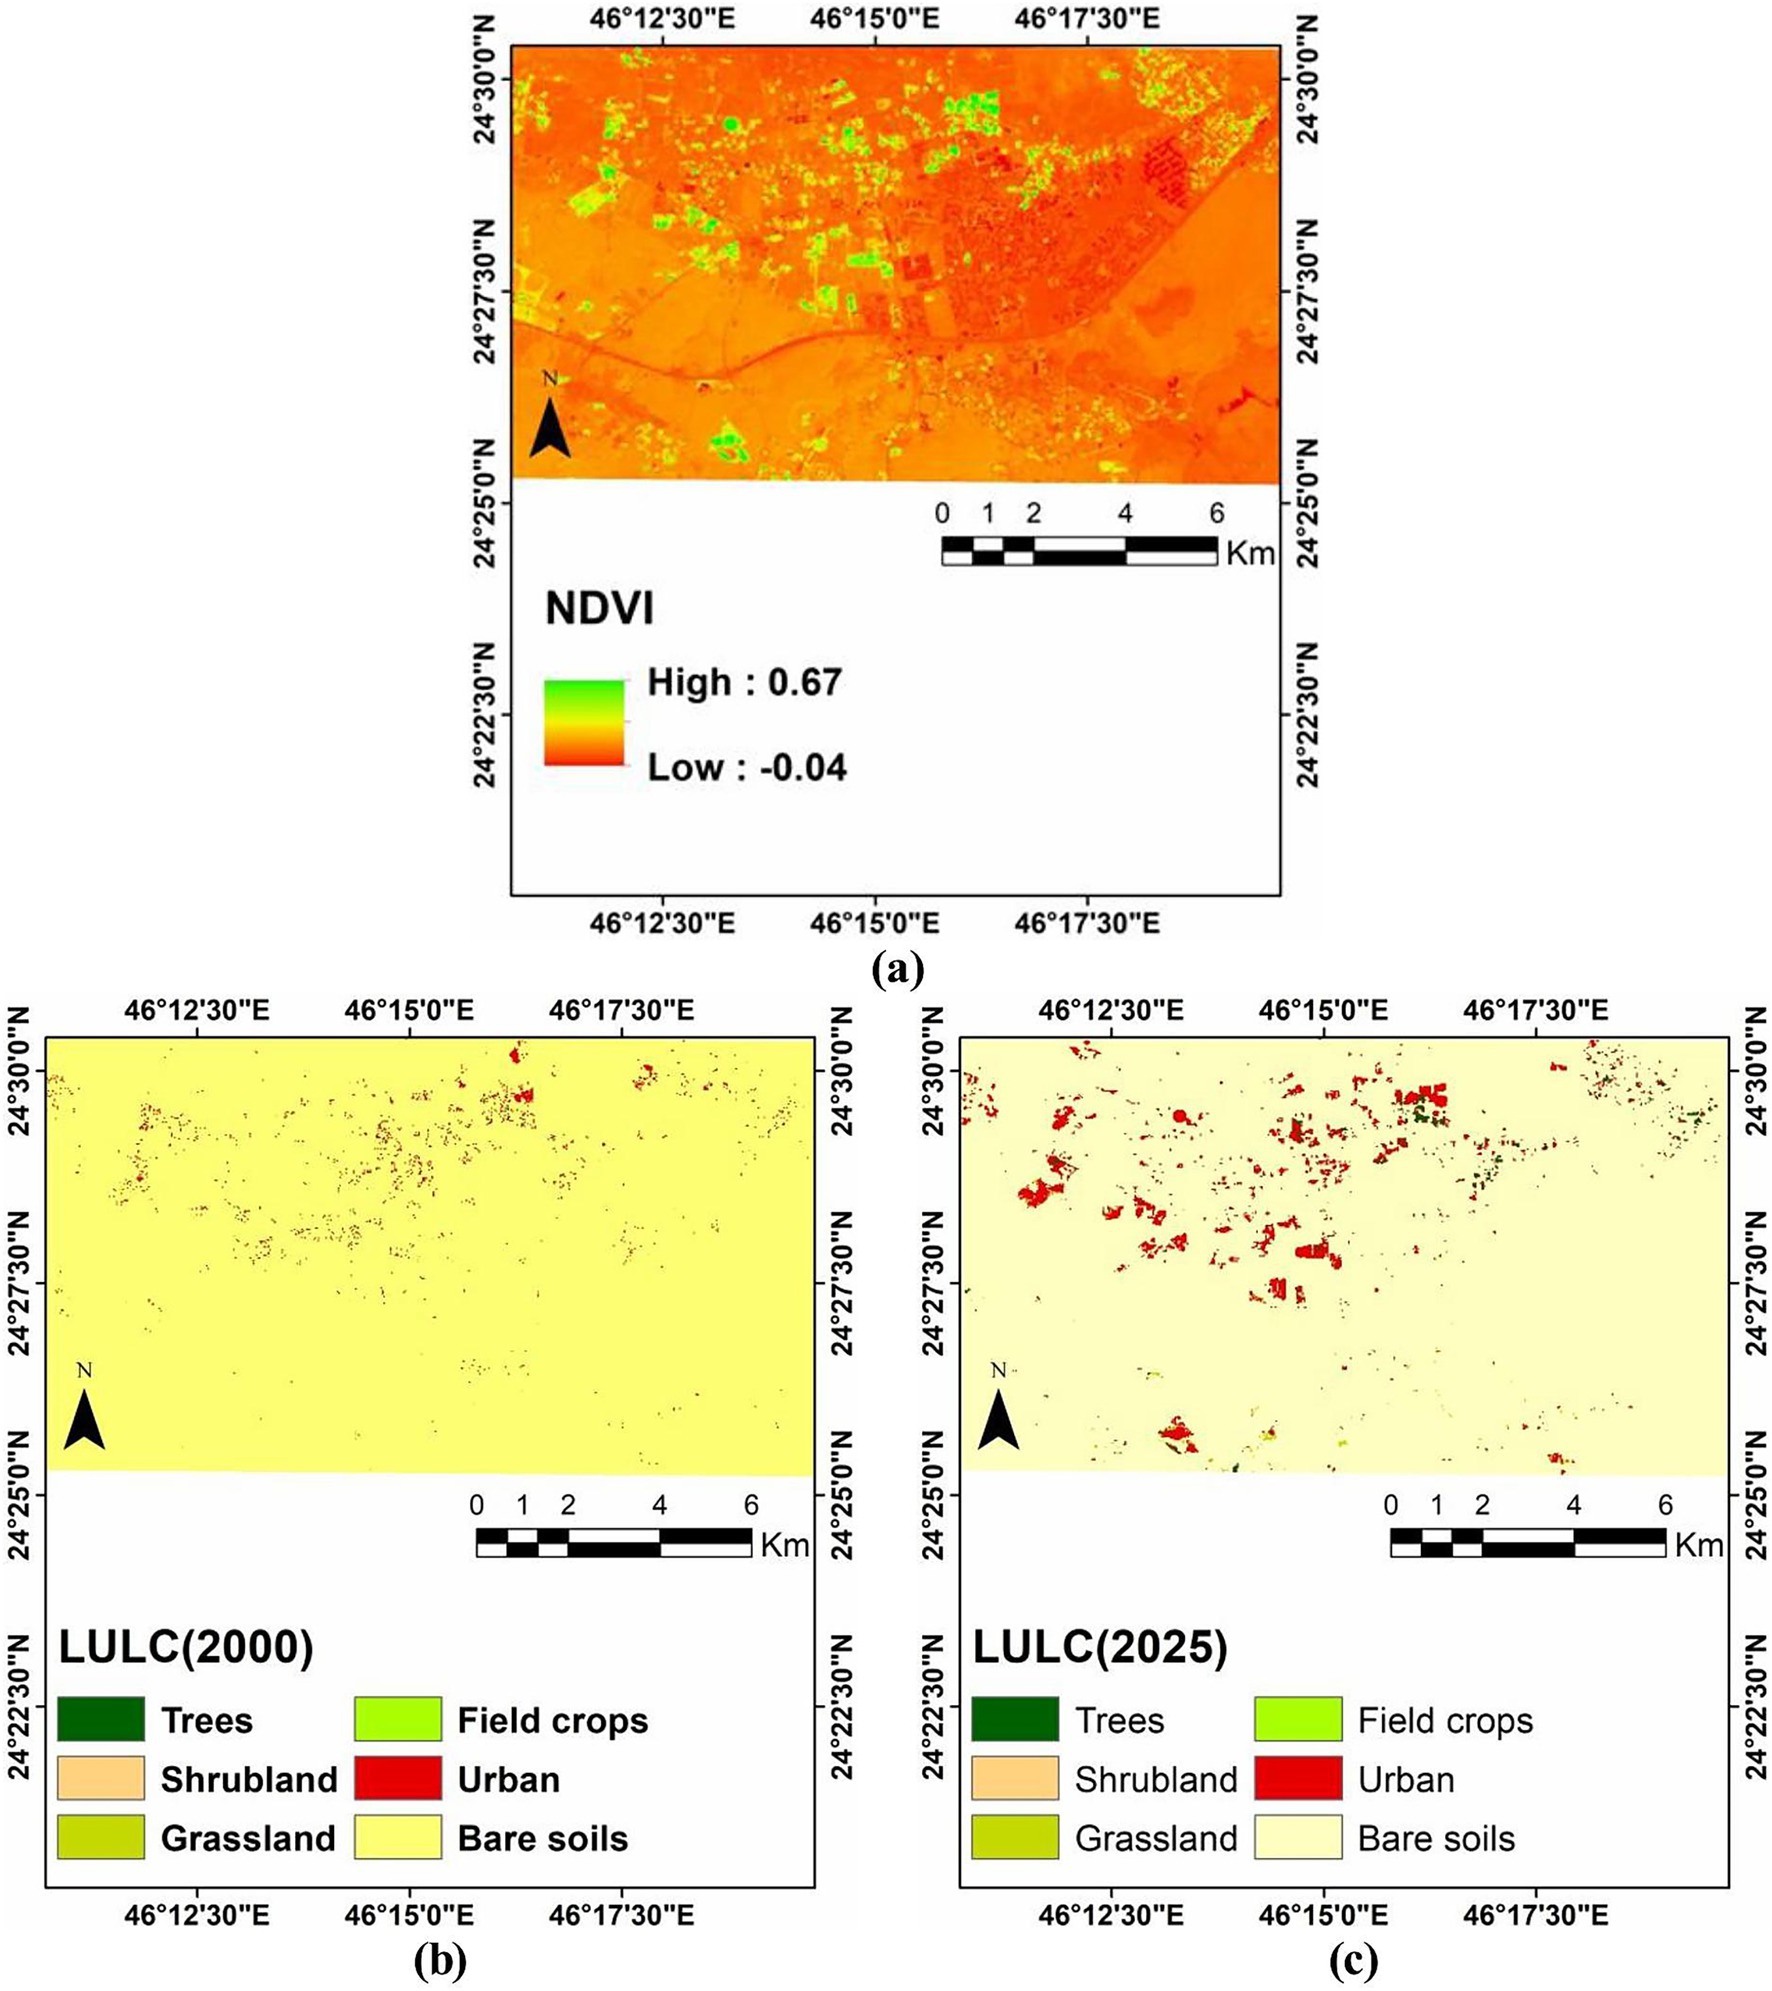
Figure 2. (a) NDVI, (b) LULC (2000), and (c) LULC (2025) of the study area.
Our knowledge of historical trends is improved by tracking and studying land use and land cover. Land cover change models can be used to examine the intricate driving forces that affect the spatiotemporal patterns of land use/land cover changes, as well as to analyze and better understand the causes and effects of such changes (Verburg et al., 2004). Land use and landcover variations in Riyadh City which the study area is a part of it have been the subject of numerous research (e.g., Rahman, and Planning, 2016; AlQurashi and Kumar, 2017; Aina et al., 2019; Alghamdi and Cummings, 2019).
The main land use patterns in the study region are trees, shrubland, grassland, field crops, urban areas, and barren soils, as shown by the comparison of the Sentinel-2 image taken in January 2025 with the Landsat-5 image taken in January 2000 (Figures 2b,c). The development of the study area for these primary classes was investigated from 2000 to 2025. 9.90 ha of trees, 6.39 ha of shrubland, 0.81 ha of grassland, 129.90 ha of field crops, 1109.85 ha of urban, and 13661.43 ha of bare soils were the primary LULC classes in the research region in 2000. The field crop was 386.92 ha (257 ha increase), the urban area was 1953.48 ha (843.63 ha increase), the bare soils area was 12,513 ha (a 1148.4 ha decrease), the trees were 48.28 ha (a 38.38 ha increase), the shrubland was 15.86 ha (a 9.47 ha increase), and the grassland was 0.74 ha (0.07 ha decrease) in 2025 (Table 1) Saudi Arabia’s primary strategic objectives were agricultural productivity, rural development, food security, and sustainable resource management, all of which contributed to the growth of agricultural regions. Geographically, the expansion has been dispersed, and the Agricultural Development Fund has played a crucial role in promoting technology utilization, investment facilitation, and the wise use of resources (Shomrany, 2024). The overall classification accuracy for sentential 2 and Landsat-5 images was 99.40 and 98.2%, respectively. These findings are consistent with those of Abdelkarim (2025), who showed that over the next three decades, urbanization and the expansion of agricultural activities will continue to result in built-up areas and agricultural fields in arid regions.
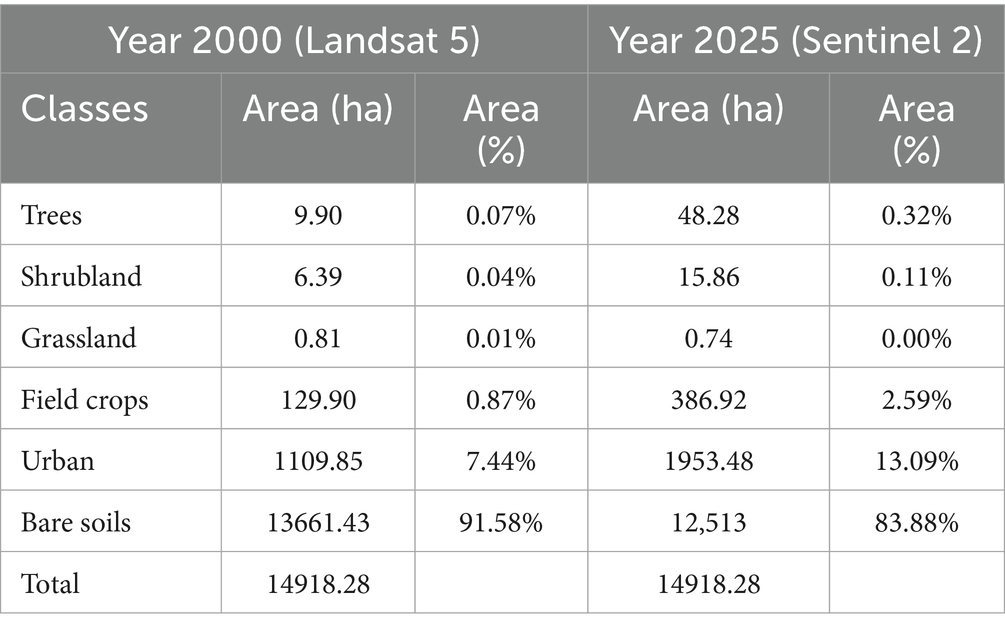
Table 1. Areas of LULC in 2000 and 2025.
3.2 Land surface parameters and heavy metal concentration in the study area
The elevation of the study area ranged from 590 to 950 m.a.s.l (Figure 3). The following is a decreasing order of the average concentrations of the investigated HMs (mg kg−1) in the study area: Table 2 shows that Fe (16819) > Mn (234.52) > Zn (40.45) > Cr (24.94) > V (17.13) > Ni (16.32) > Cu (9.32) > Pb (4.71) > Co (3.45).
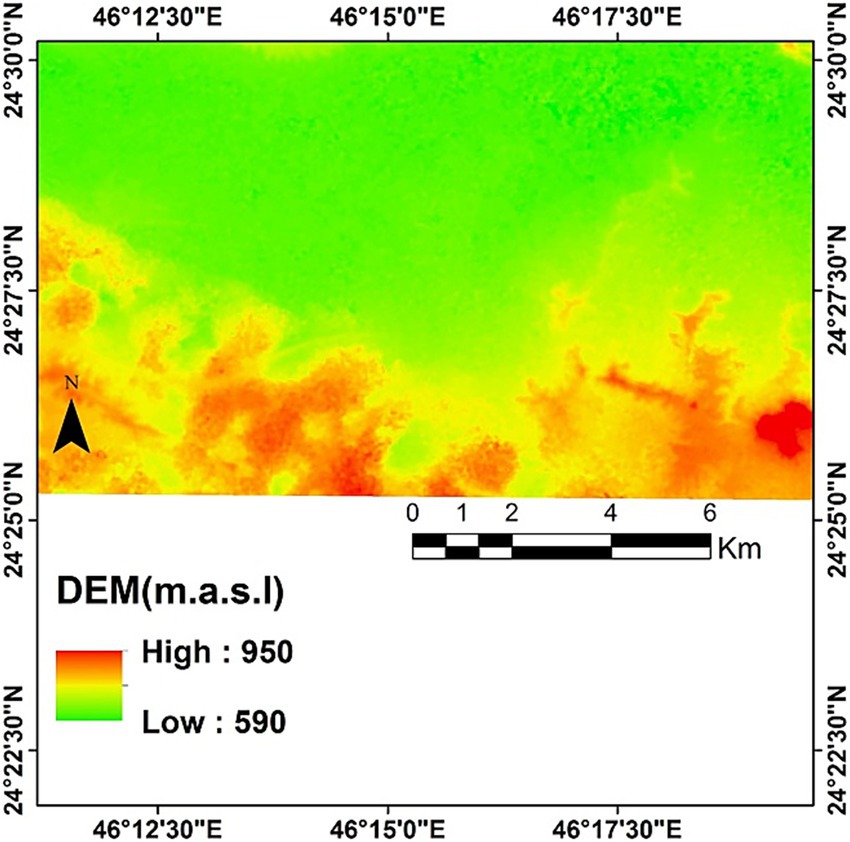
Figure 3. Digital elevation model (DEM) of the study area.
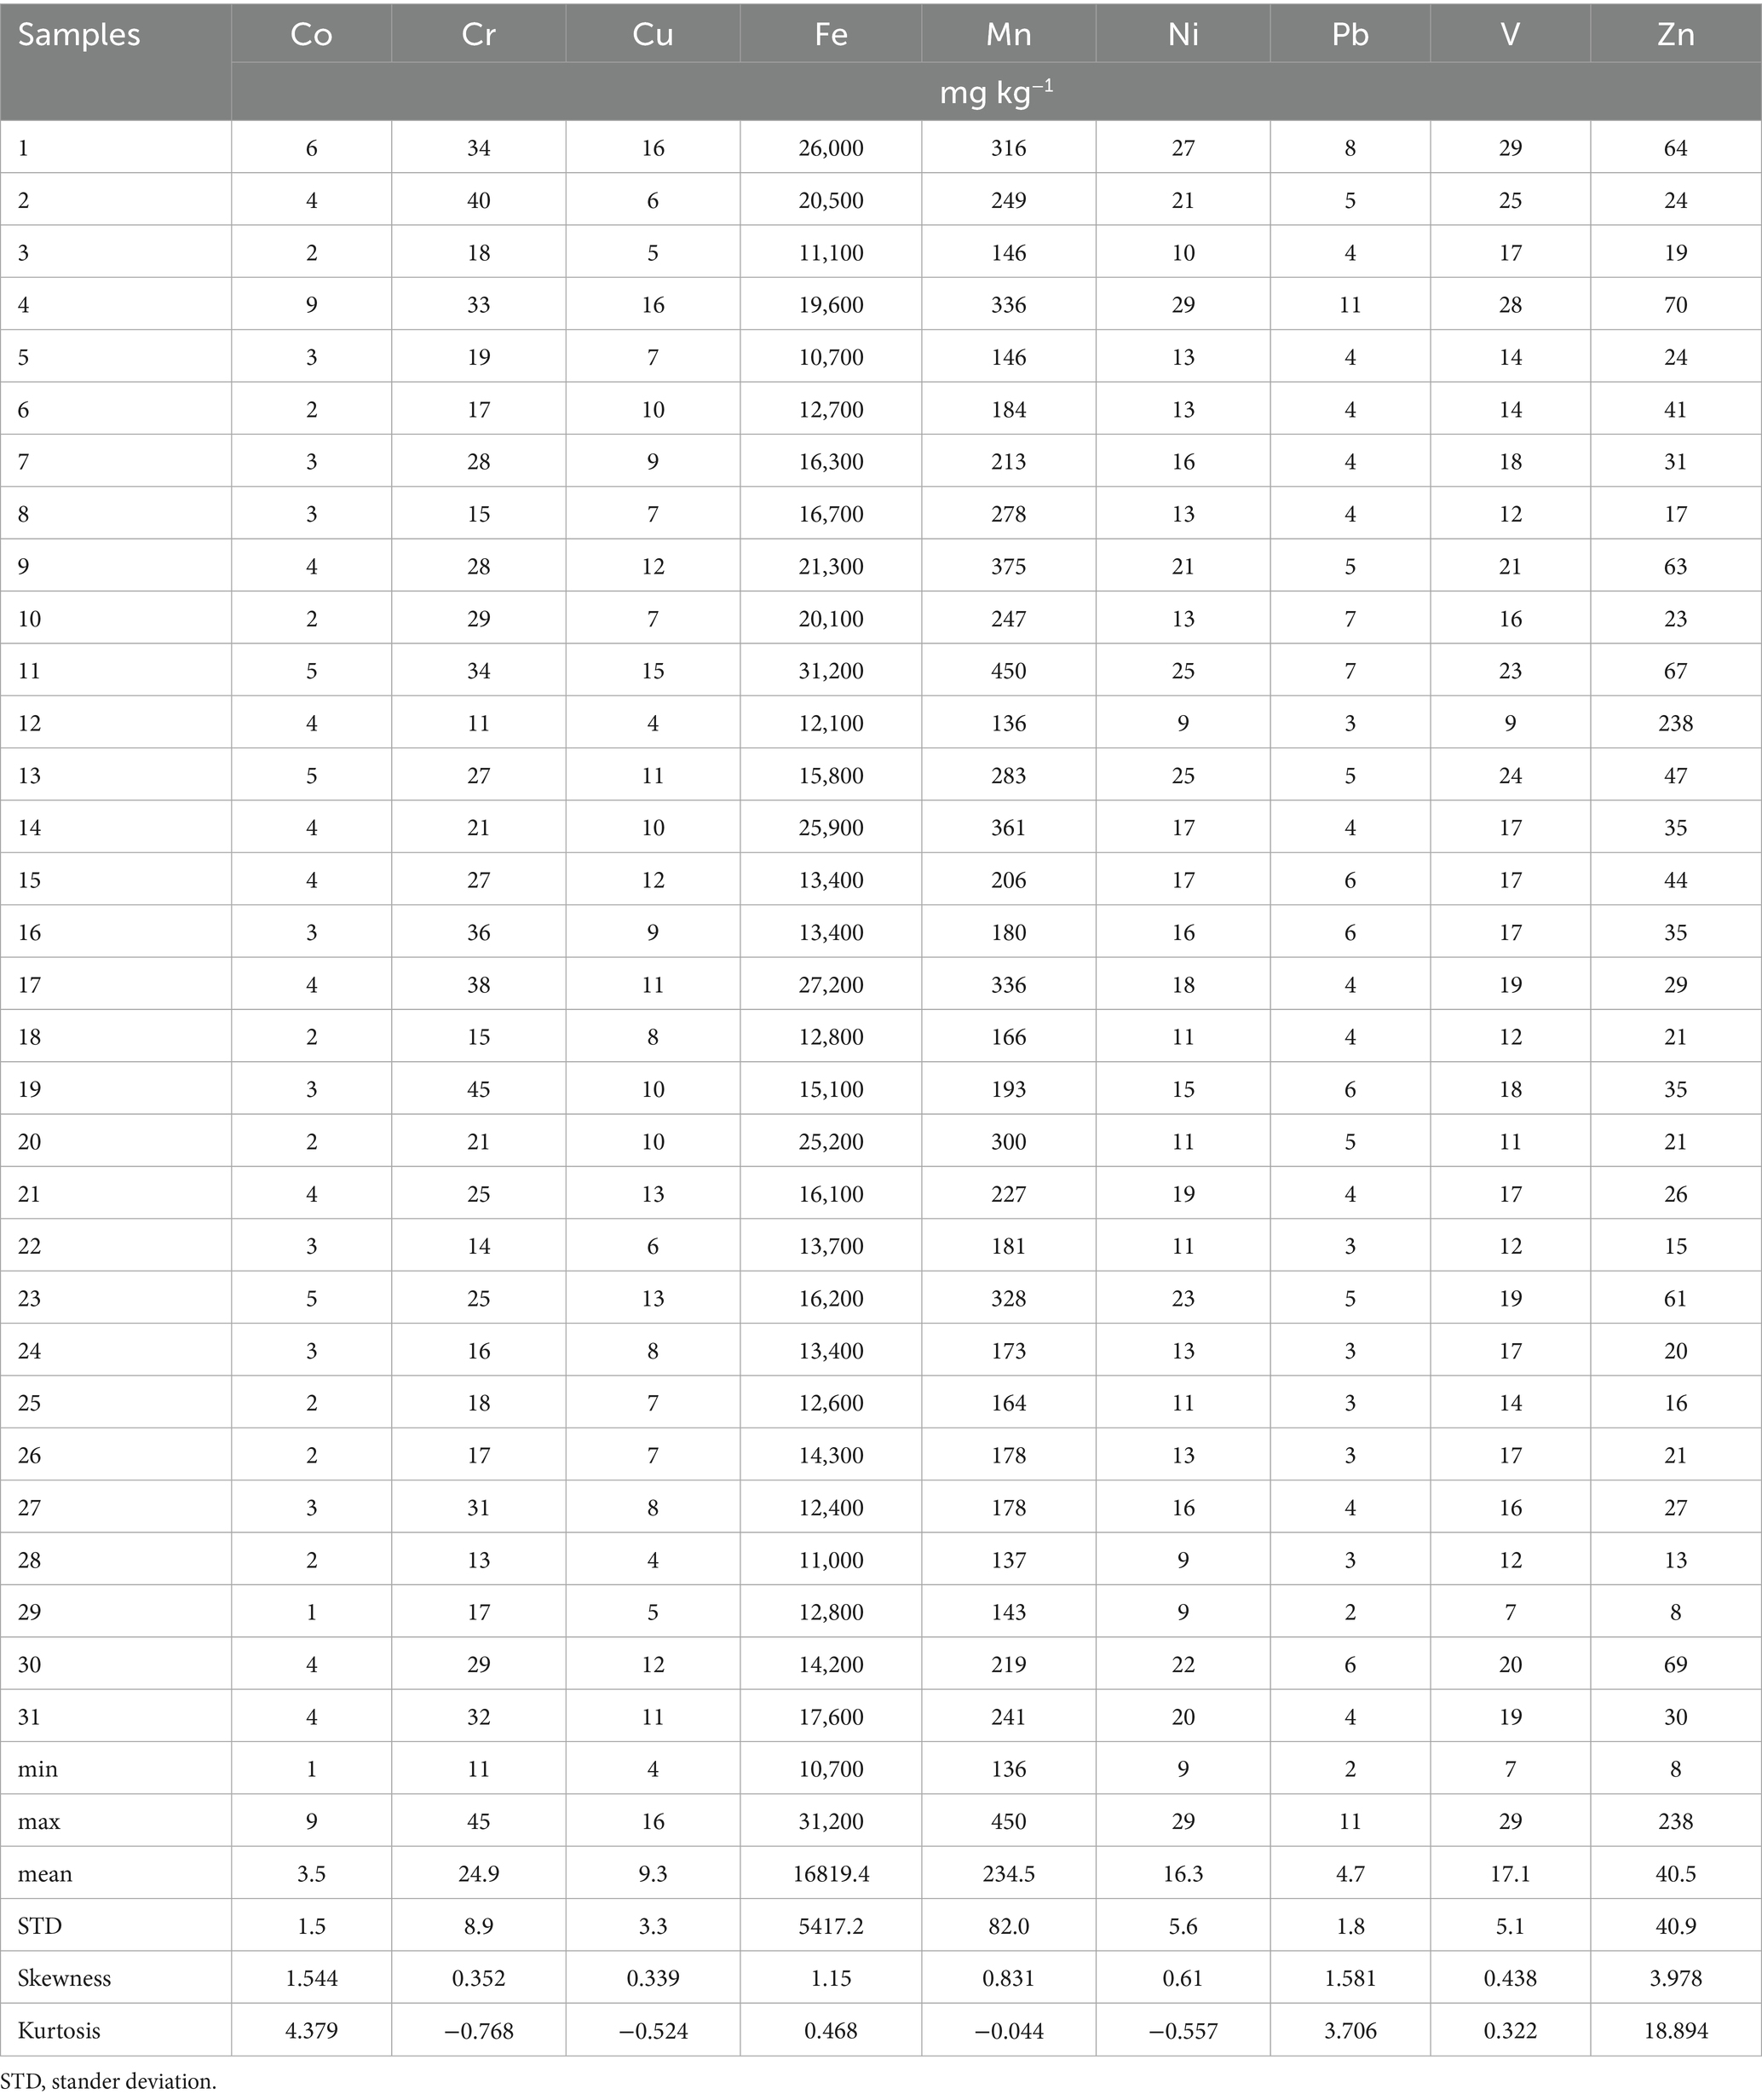
Table 2. Statistics of HMs concentration within investigated area.
The findings show that all of the metals under study have positive skewness, which is characterized by longer tails to the right, a concentration of lower values, and a few high outliers. Kurtosis findings show that whereas Cr (−0.76), Cu (−0.52), Mn (−0.04), and Ni (−0.55) have the lowest kurtosis values, indicating flatter distributions, K (5.27), Co (4.37), and Zn (18.89) have high kurtosis values, indicating peaked distributions with extreme values (Yousif et al., 2025). According to the spatial analysis, the northwestern region’s sites 11 and 12 have the highest concentrations of Fe (31,200 mg kg−1), Mn (450 mg kg−1), and Zn (238 mg kg−1). Cr (45 mg kg−1) is more prevalent in the central section, particularly at site 19, while Co (9 mg kg−1) Cu (16 mg kg−1), Ni (29 mg kg−1), and Pb (11 mg kg−1) are showing higher concentrations in the northern region at site-4 (Figures 4a–h). Possible depletion of the local geological composition and decreased anthropogenic input are indicated by the observed changes in Mn concentration levels, which are much lower than regional and global reference values. Its comparatively low levels indicate restricted industrial discharge and a natural deficiency in Mn-rich minerals in the sedimentary source materials. Mn frequently plays a crucial role in redox reactions and biogeochemical cycling (El-Sorogy A. S. et al., 2025). The HMs’ spatial patterns were comparatively consistent. The conclusion drawn from PCA and correlation analysis that these elements are primarily sourced from natural geological sources is supported by their homogenous distribution (Fehér et al., 2025).
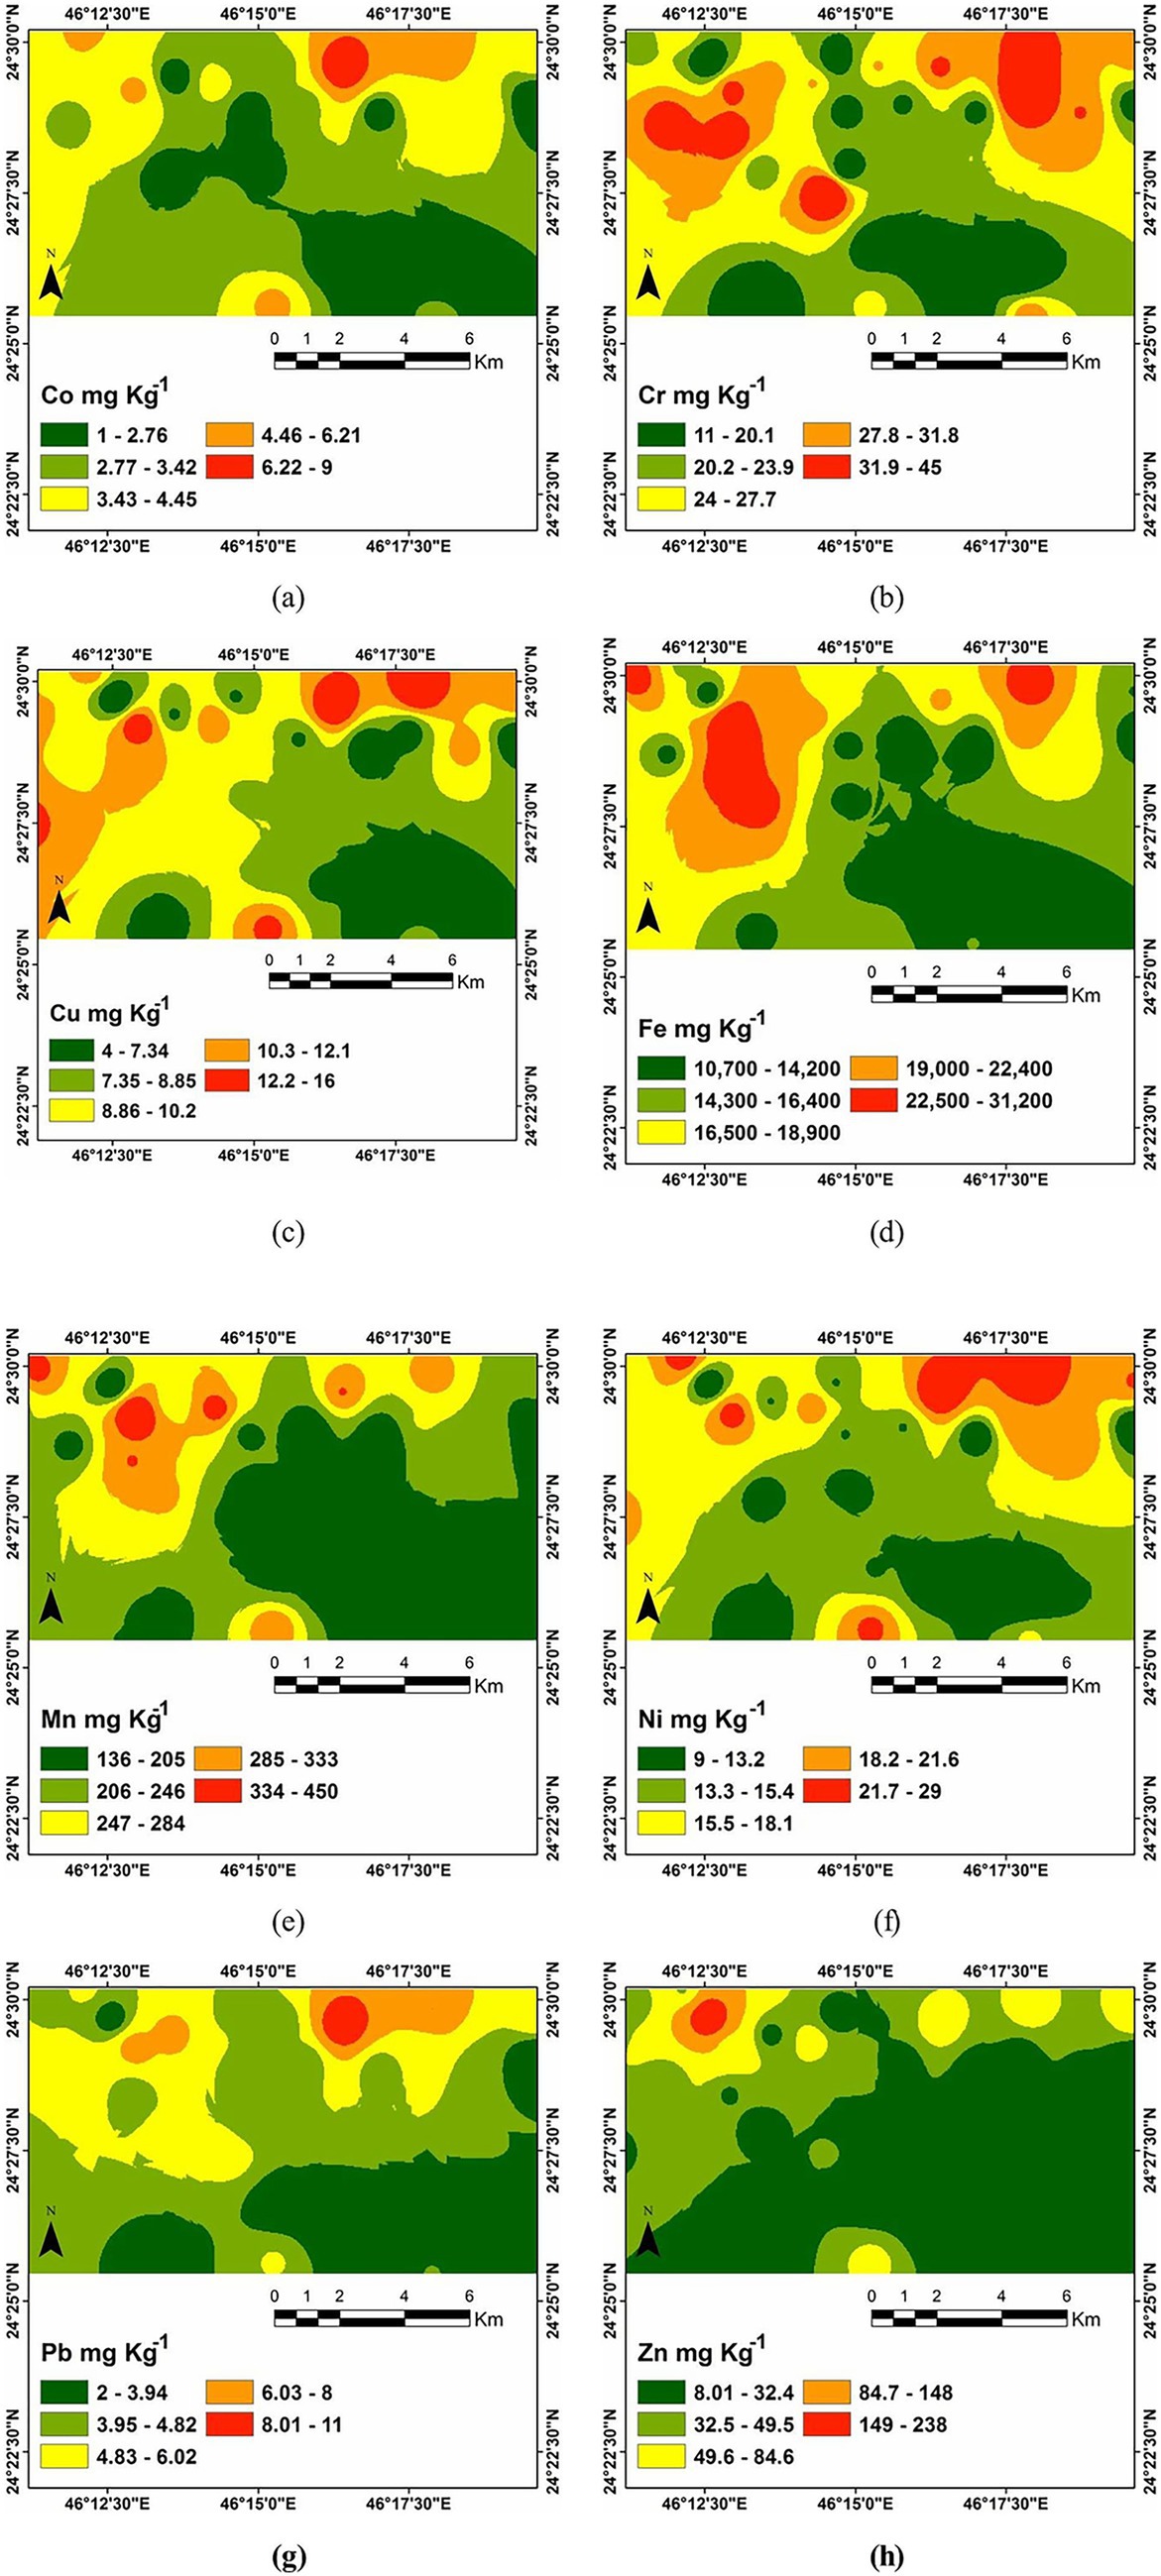
Figure 4. Interpolated maps of HMs concentration in mg Kg−1 within study area: (a) Co, (b) Cr, (c) Cu, (d) Fe, (e) Mn, (f) Ni, (g) Pb, and (h) Zn.
3.3 Comparison between current study and other regions concentrations
Understanding environmental contamination requires comparing the concentrations of heavy metals in soils across various regions of Saudi Arabia. A comparison between the actual concentrations of heavy metals in the soil of different sites has been applied in numerous studies across arid regions (El-Sorogy A. et al., 2025; Hendawy et al., 2025; Kahal et al., 2025). This comparison makes it possible to identify regions with higher levels, which could be caused by human activities like industrialization or agriculture or by natural factors. Implementing focused monitoring and remediation measures to safeguard the environment and public health requires such assessments. The average concentration of Co was higher than the concentrations from the Al-Ahsa Oasis, and Al Uyaynah–Al Jubailah soils (Alharbi et al., 2024; Alharbi and El-Sorogy, 2021), but lower than the other concentrations displayed in Table 3 (Al-Boghdady and Hassanein, 2019; Kahal et al., 2025; Kabata-Pendias and Pendias, 2011). The average Cr concentration was higher than the background values by Wedepohl (1994) and the soil from Al-Ammariah, Saudi Arabia and lower than the other concentrations displayed in Table 3 (Alarifi et al., 2022). Compared to the other values in Table 3, the average of Cu and Fe were lower (Alharbi et al., 2024; Alharbi and El-Sorogy, 2021; Al-Boghdady and Hassanein, 2019; Kahal et al., 2025; Kabata-Pendias and Pendias, 2011). The current study’s Mn concentration was lower than the other concentrations in Table 3, and greater than the soils of Al-Ammariah and Al-Ahsa Oasis. Our average Ni, Pb, V, and Zn concentrations were lower than those shown in Table 3. This comparative analysis consistently demonstrates that the heavy metal levels in the Al-Muzahmiya region are generally lower than or comparable to those in many other studied areas, reinforcing the conclusion that the area is currently unpolluted and providing a valuable baseline for future monitoring.
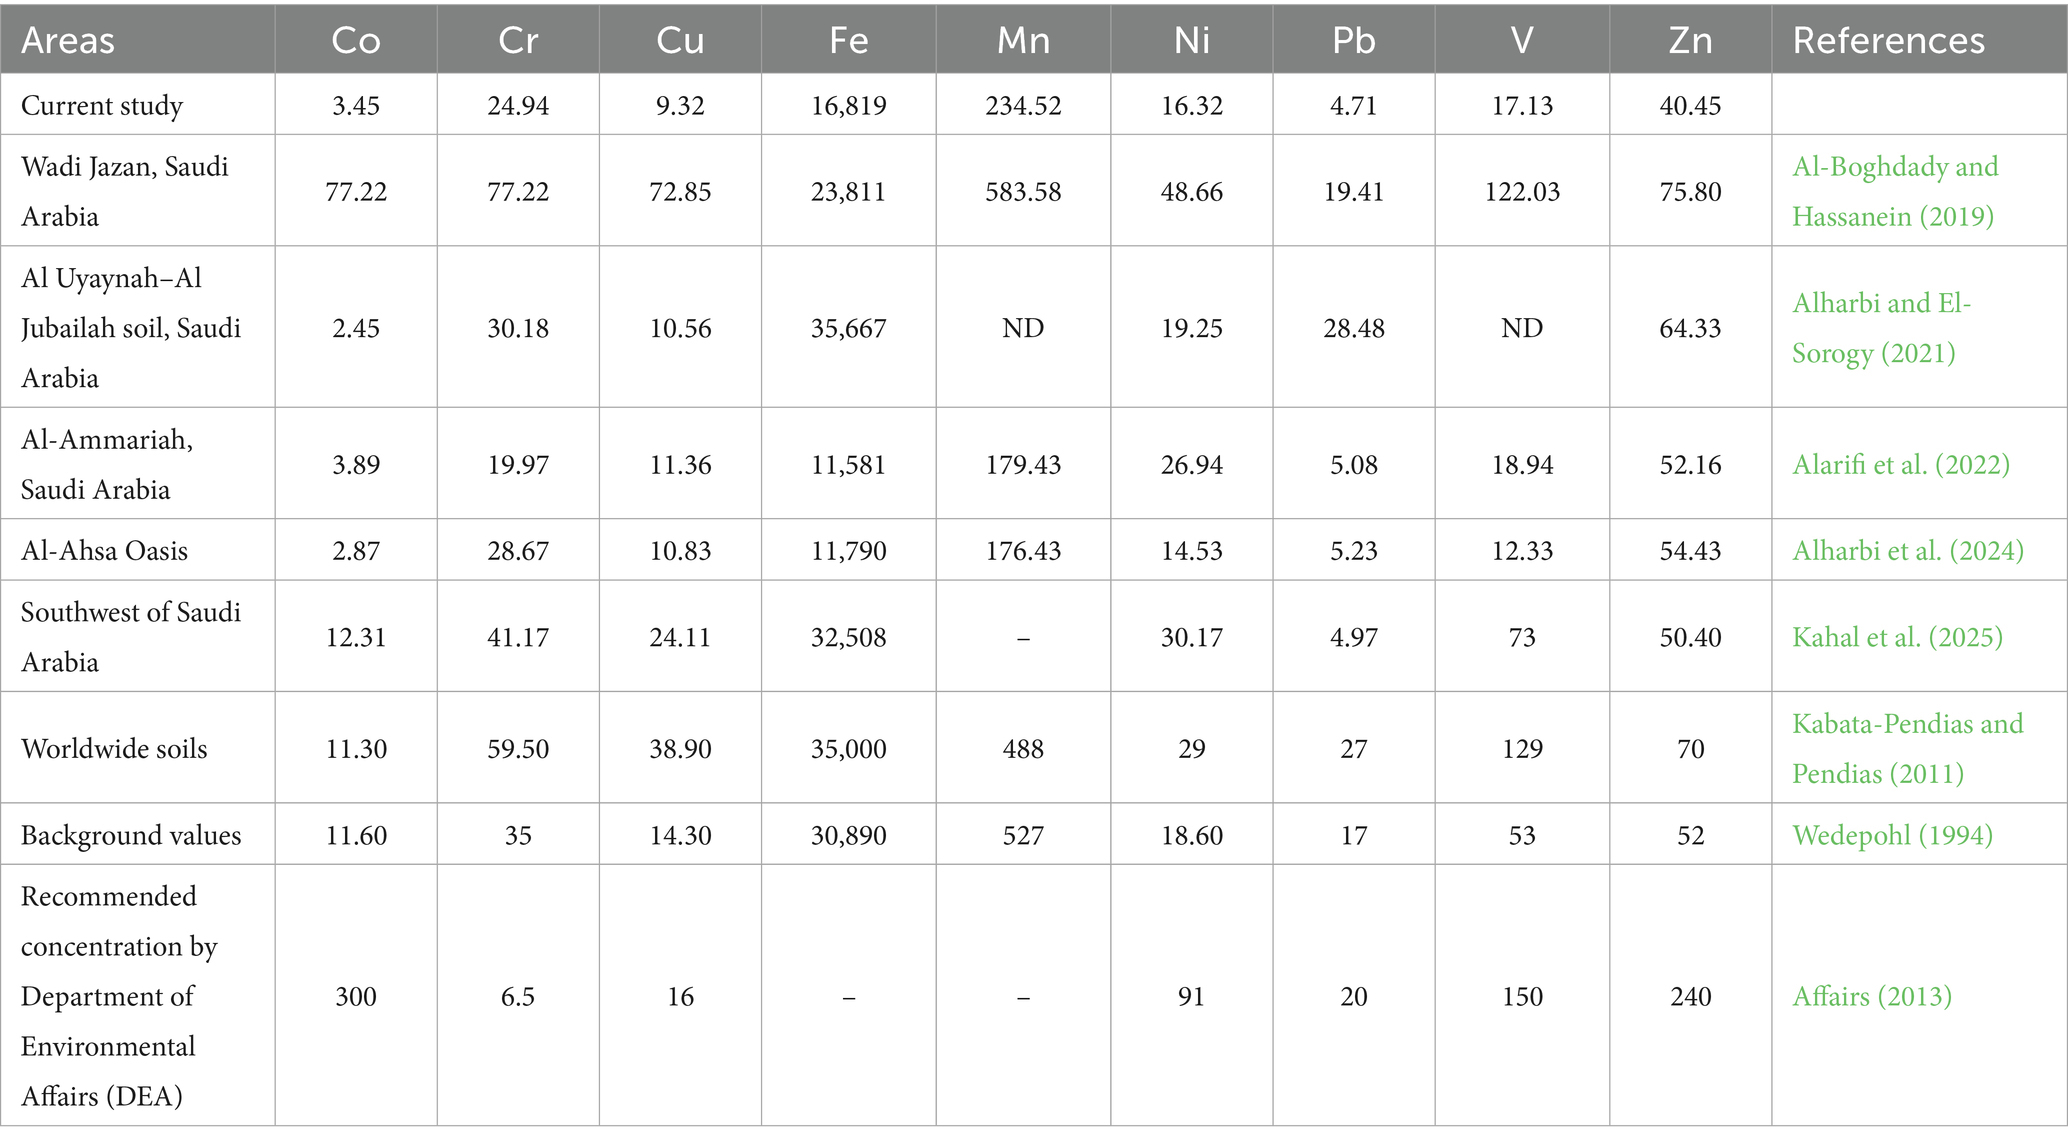
Table 3. Comparison between heavy metals concentrations and other concentrations in the study area.
3.4 Statistical analysis
3.4.1 Normality test
For heavy metal concentrations (n = 31 samples), the Shapiro–Wilk normality test results show clear distribution patterns. This test is a statistical process used to ascertain whether a full sample of data is representative of a normal distribution, which is a fundamental premise of many statistical techniques. In order to perform the test, the symmetric estimate of variance is divided by the square of a linear combination of sample order statistics (Shapiro and Wilk, 1965). Strong deviations from normality are shown by the significantly non-normal distributions (p < 0.05) for cobalt (Co, p = 0.001), iron (Fe, p = 0.001), lead (Pb, p = 0.001), manganese (Mn, p = 0.018), and zinc (Zn, p = 0.001). Vanadium (V, p = 0.372), Nickel (Ni, p = 0.058), Copper (Cu, p = 0.357), and Chromium (Cr, p = 0.239) all showed no statistically significant deviation from normality (p > 0.05) (Table 4 and Figure 5).
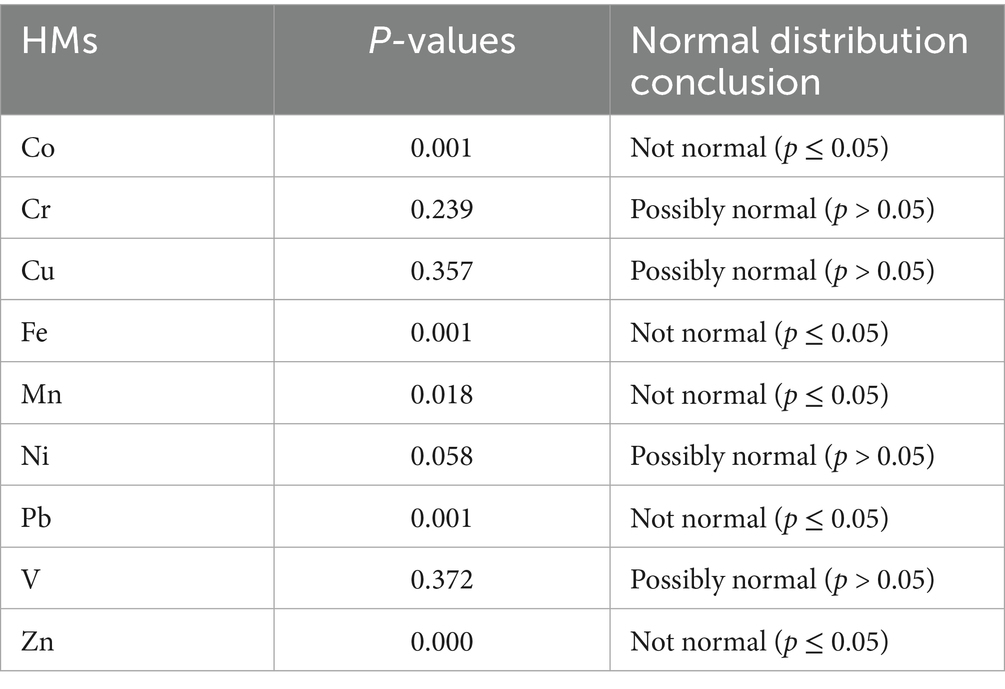
Table 4. Shapiro–Wilk normality test of studied HMs.
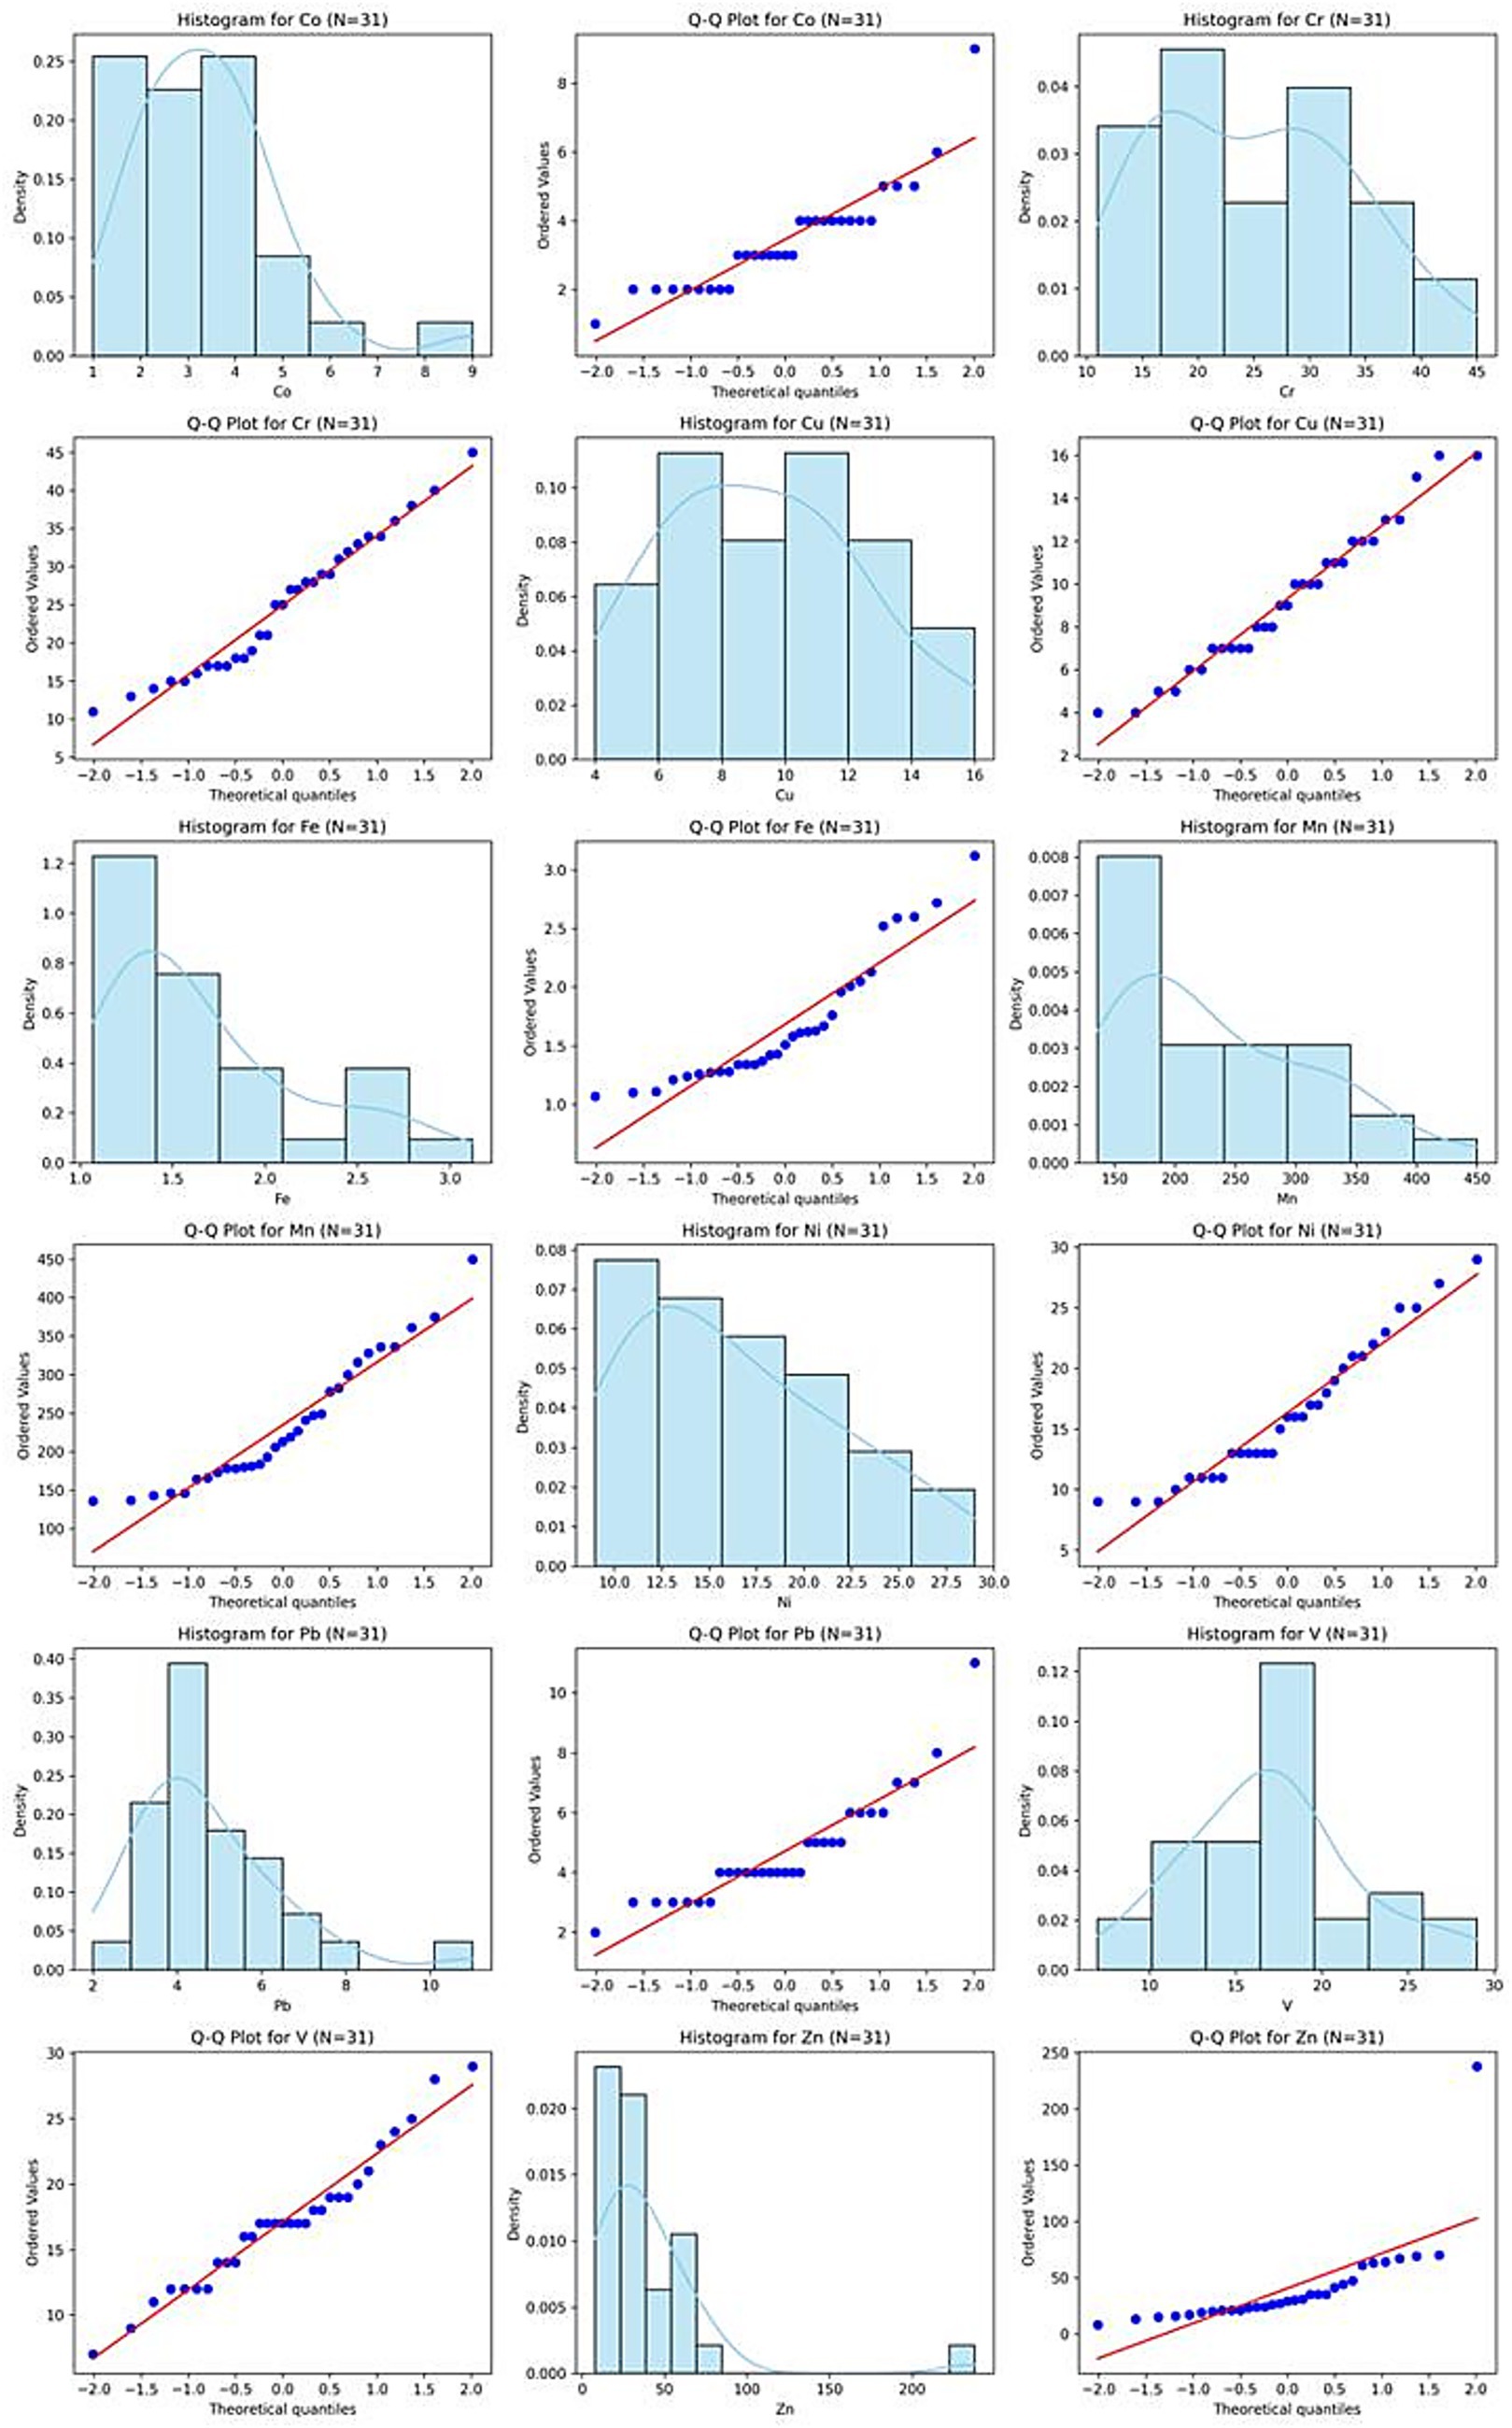
Figure 5. Normality test distribution test of studied HMs.
3.4.2 Correlation matrix for studied elements
Relationships between elements reveal information on the sources and routes of heavy metals. Except for Zn, all metals showed high significant (p < 0.01) based on the Pearson correlation coefficient values (Figure 6). The strong positive correlations observed between most heavy metals in this study (Figure 6) align with findings from other arid regions, such as those reported by El-Sorogy et al. (2021), who also documented significant inter-element relationships. The significant correlations between elements like Cd, Co, and Pb with Fe and Mn, as reported by Nieder et al. (2018), indicate a likely mechanism of adsorption onto or co-precipitation with Fe-Mn oxides, which could explain the cohesive behavior of the main metal group in our soils. Only with Co did Zn exhibit a substantial positive correlation (p < 0.05). This could suggest that the Zn in the studied soils has a different origin or governing factors (Dragović et al., 2008).
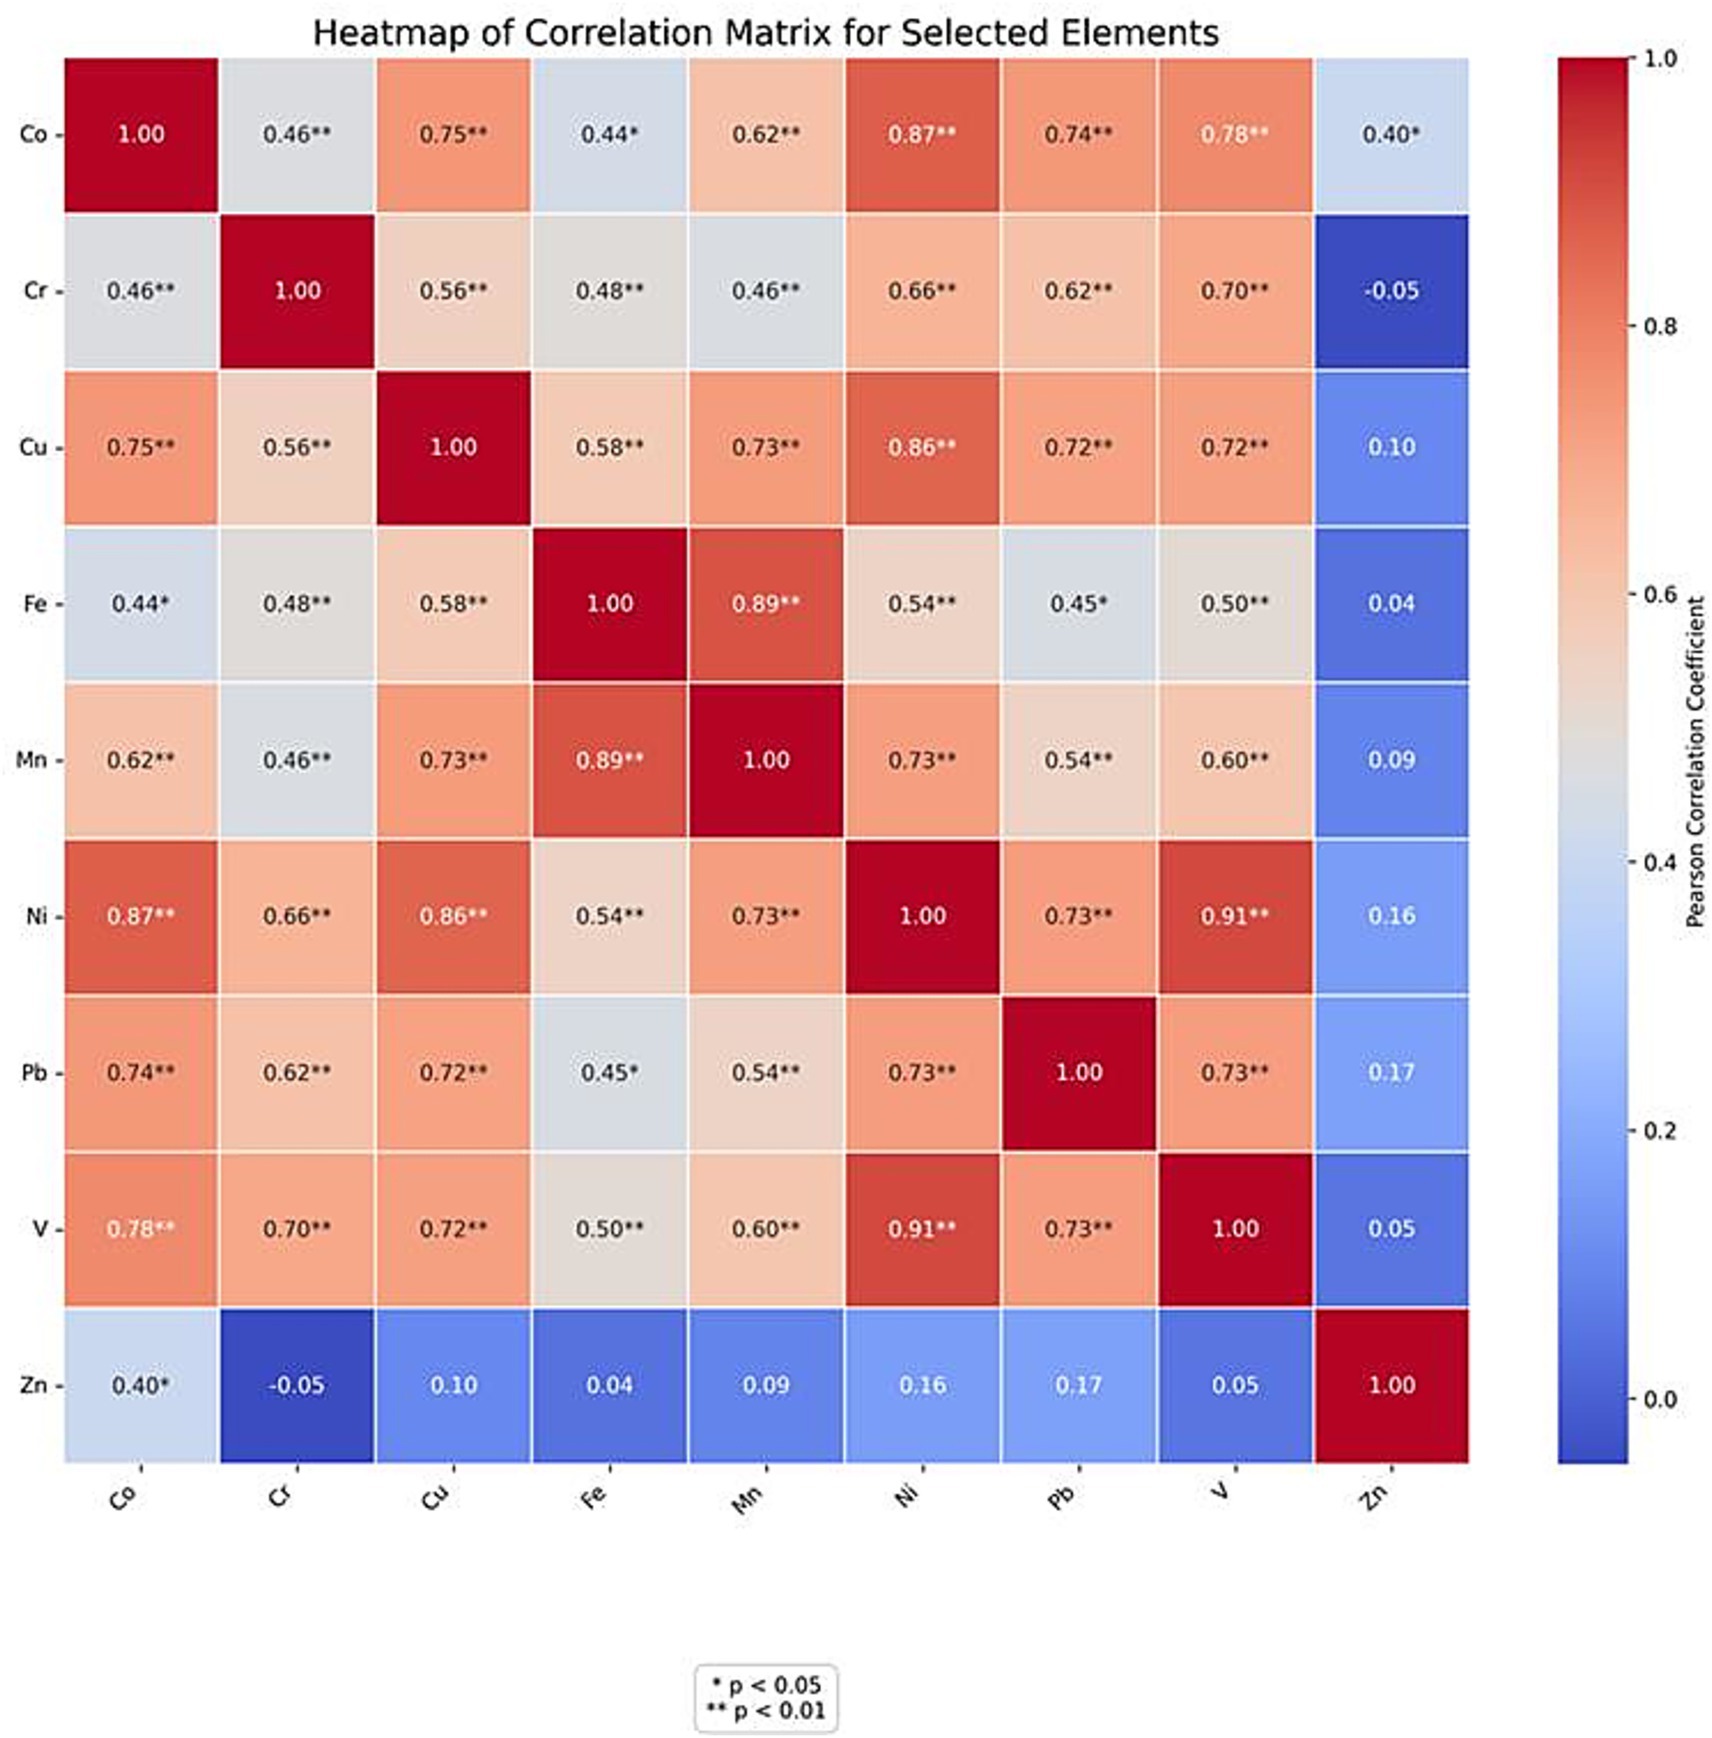
Figure 6. Heat map correlation matrix of studied elements. * Correlation is significant at the 0.05 level; ** Correlation is significant at the 0.01 level.
3.4.3 Non-linear relationships between major cations and heavy metals in soil samples
According to the graphical analysis, there is a positive but non-linear correlation between cobalt (Co) and magnesium (Mg), however the relationships between Co and calcium (Ca) seem to be non-linear. On the other hand, there is a weak or no correlation between Co and potassium (K). Similar to this, there are non-linear trends rather than strict linearity in the interactions of chromium (Cr), copper (Cu), iron (Fe), manganese (Mn), nickel (Ni), lead (Pb), vanadium (V), and zinc (Zn) with Ca, Mg, and K. This implies that the impact of Ca, Mg, and K on the mobility and distribution of these trace elements vary with changes in cation levels rather than remaining constant throughout all concentration ranges. These results demonstrate the complexity of soil geochemistry, where cation–trace element interactions are probably controlled by a number of factors such as ionic strength fluctuations, competition, and adsorption (Figure 7).
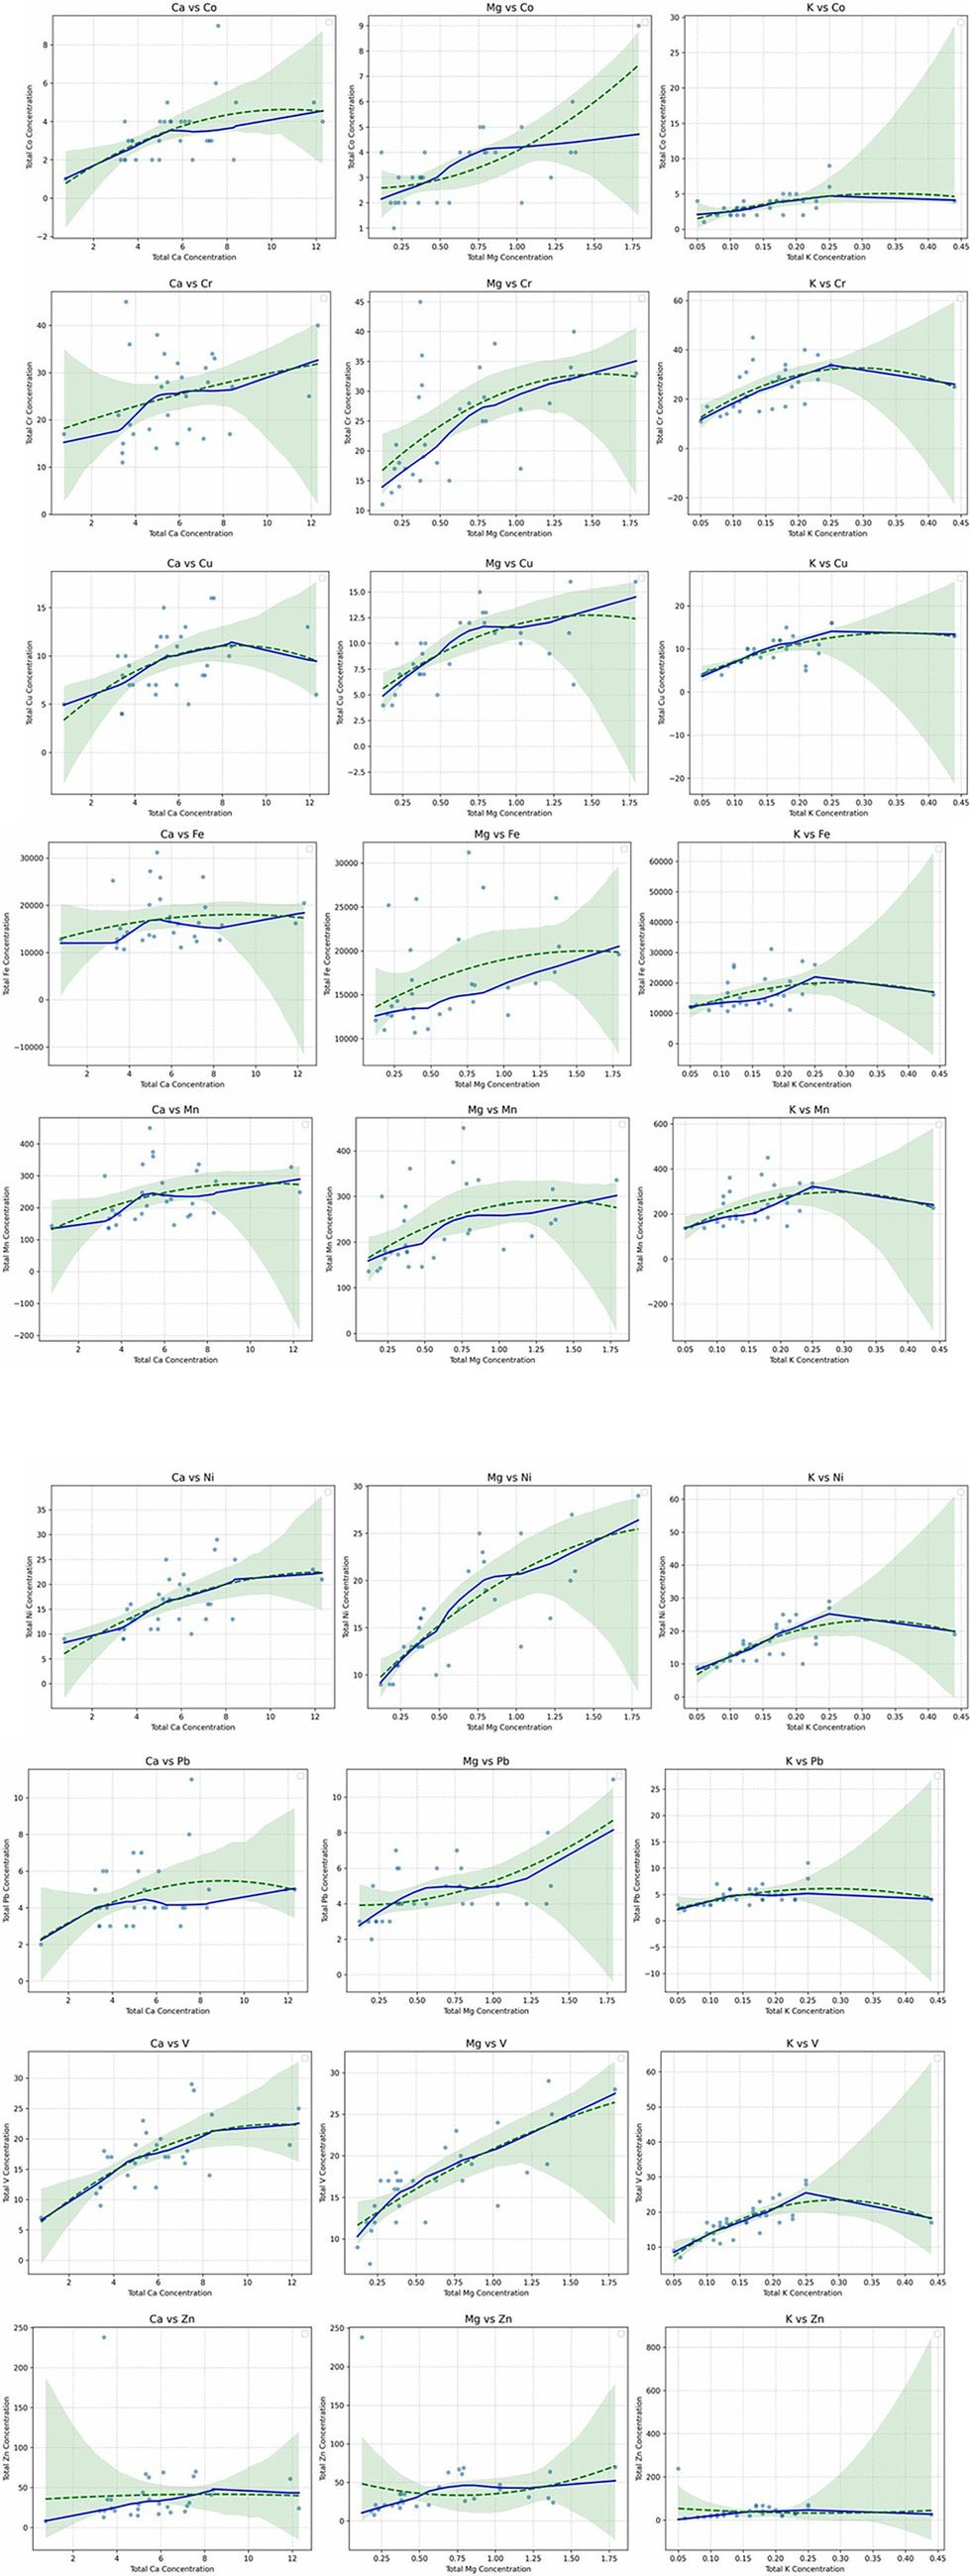
Figure 7. Non-linear relationships between major cations and heavy metals (HMs) in soil samples.
3.4.4 PCA and cluster analysis
A strong technique for locating possible sources of Heavy metals in agricultural soils, Principal Component Analysis (PCA) successfully outlined the sources of heavy metals in the study area (Hammam et al., 2022; Abuzaid and Bassouny, 2020; Emam and Soliman, 2022). For Co, Cr, Cu, Fe, Mn, Ni, Pb, and V, Principal Component 1 (PC1), which explains most of the variance (62.87%), displayed substantial positive loadings. A shared origin or governing factor, most likely the natural geogenic background generated from parent rock materials, is indicated by the high clustering of the majority of metals inside a single component. In contrast, a very high loading for Zn (0.904) dominates Principal Component 2 (PC2), which accounts for 13.03% of the variation (Figure 8 and Table 5). As previously indicated by the correlation study, Zn′s distinct and separate origin is clearly confirmed by its obvious segregation from the major elemental group. This particular source of zinc is probably caused by a particular anthropogenic activity, such farming (e.g., usage of phosphate fertilizers).
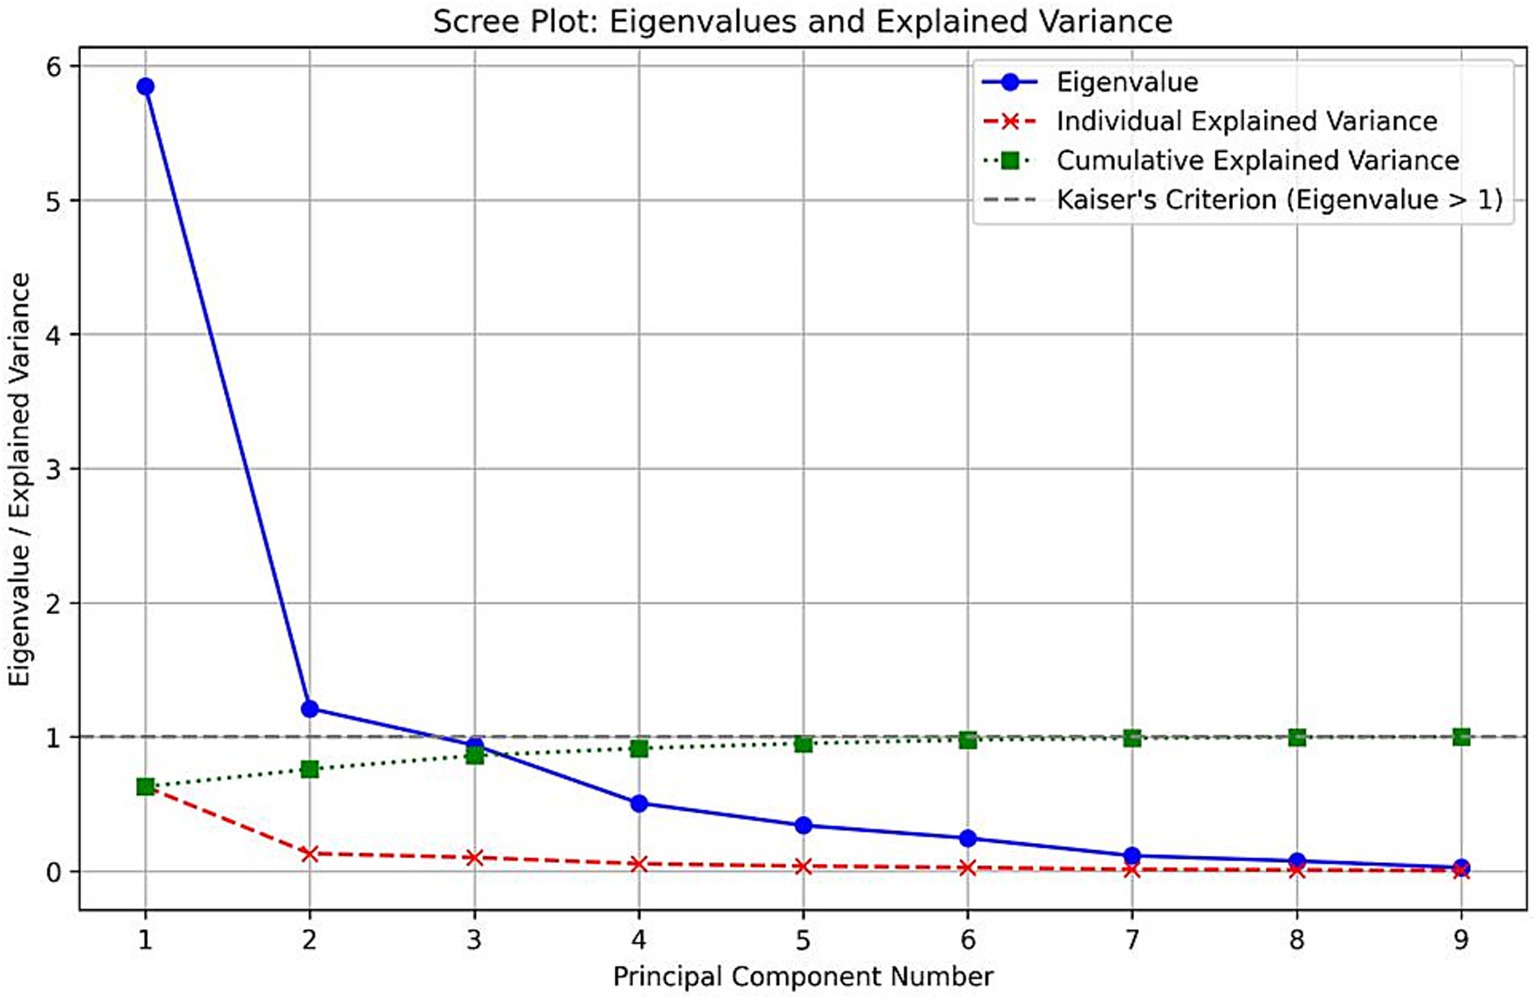
Figure 8. Eigenvalues and explained variance of PCs.
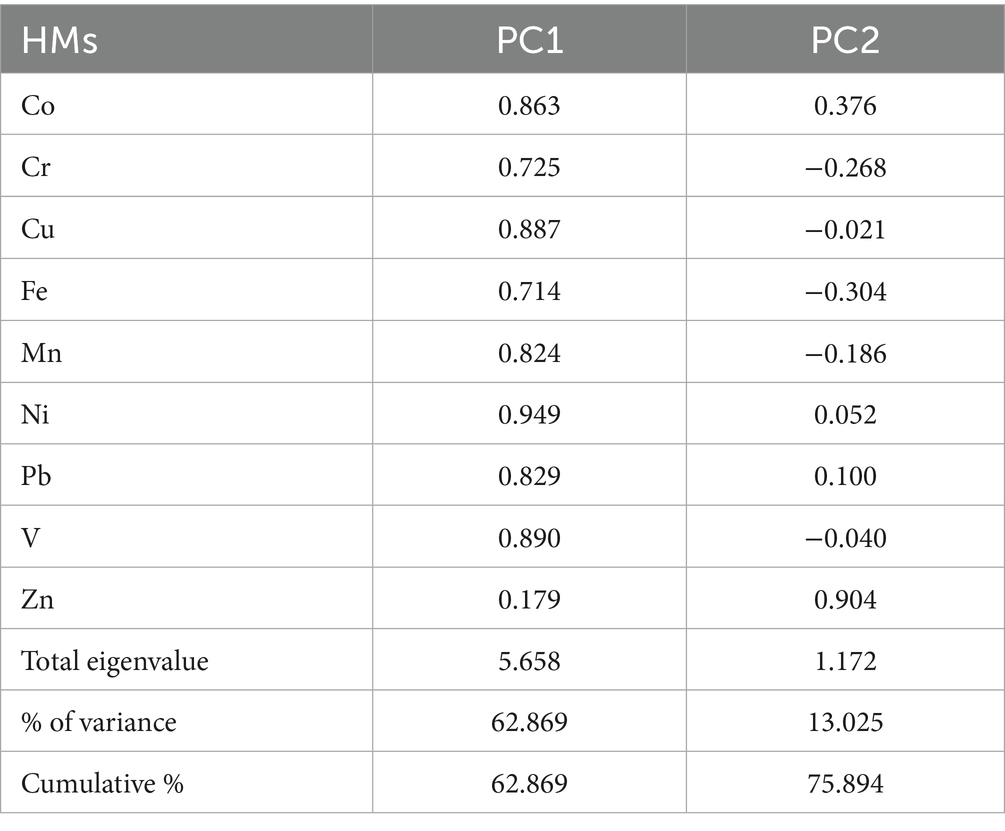
Table 5. Prinicpls components (PC1, and PC2) of the studied elements.
The 31 sampled sites were divided into two groups via the Q-mode hierarchical cluster analysis (HCA) based on the HMs concentrations (Figure 9). Samples 2, 3, 4, 5, 6, 7, 8, 9, 10, 12, 13, 15, 16, 18, 19, 21, 22, 23, 24, 25, 26,27,28, 29, 30, and 31 made up the first group. Their mean concentrations of Co, Cr, Cu, Fe, Mn, Ni, Pb, V, and Zn were 3.31 ± 1.54, 24.04 ± 8.94, 8.73 ± 3.09, 14842.31 ± 3,014, 15.69 ± 64.75, 454 ± 1.3, 4.54 ± 1.79 16.62 ± 4.73, and 39.92 ± 44 mg kg−1, respectively. Higher concentrations of Co, Cr, Cu, Fe, Mn, Ni, Pb, V, and Zn were shown by the second group, which was represented by samples 1, 11, 14, 17, and 20 (4.2 ± 1.48, 29.6 ± 8.01, 12.4 ± 12.40, 27,100 ± 2,402, 352.6 ± 59, 19.6 ± 6.46, 5.6 ± 1.81, 19.8 ± 6.72, and 43.2 ± 20.98 mg kg−1, respectively) (Table 6). The second cluster’s samples are probably distinguished by higher levels of specific heavy metals. Their closeness to agricultural regions, where methods like applying phosphate fertilizers might lead to in the buildup of these elements in the soil, may be the cause of this growth (Khan et al., 2024). The concentration levels of all heavy metals in this cluster stay below the acceptable and safe ranges set by environmental regulations. This suggests that although anthropogenic farming practices are a noticeable contributing factor, the environmental impact is not yet a serious concern. These findings are consistent with studies conducted in other agricultural regions of Saudi Arabia, such as Al Qassim, and Jazan, which also reported generally low levels of heavy metal contamination in soils (El-Sorogy A. et al., 2025; Kahal et al., 2025).
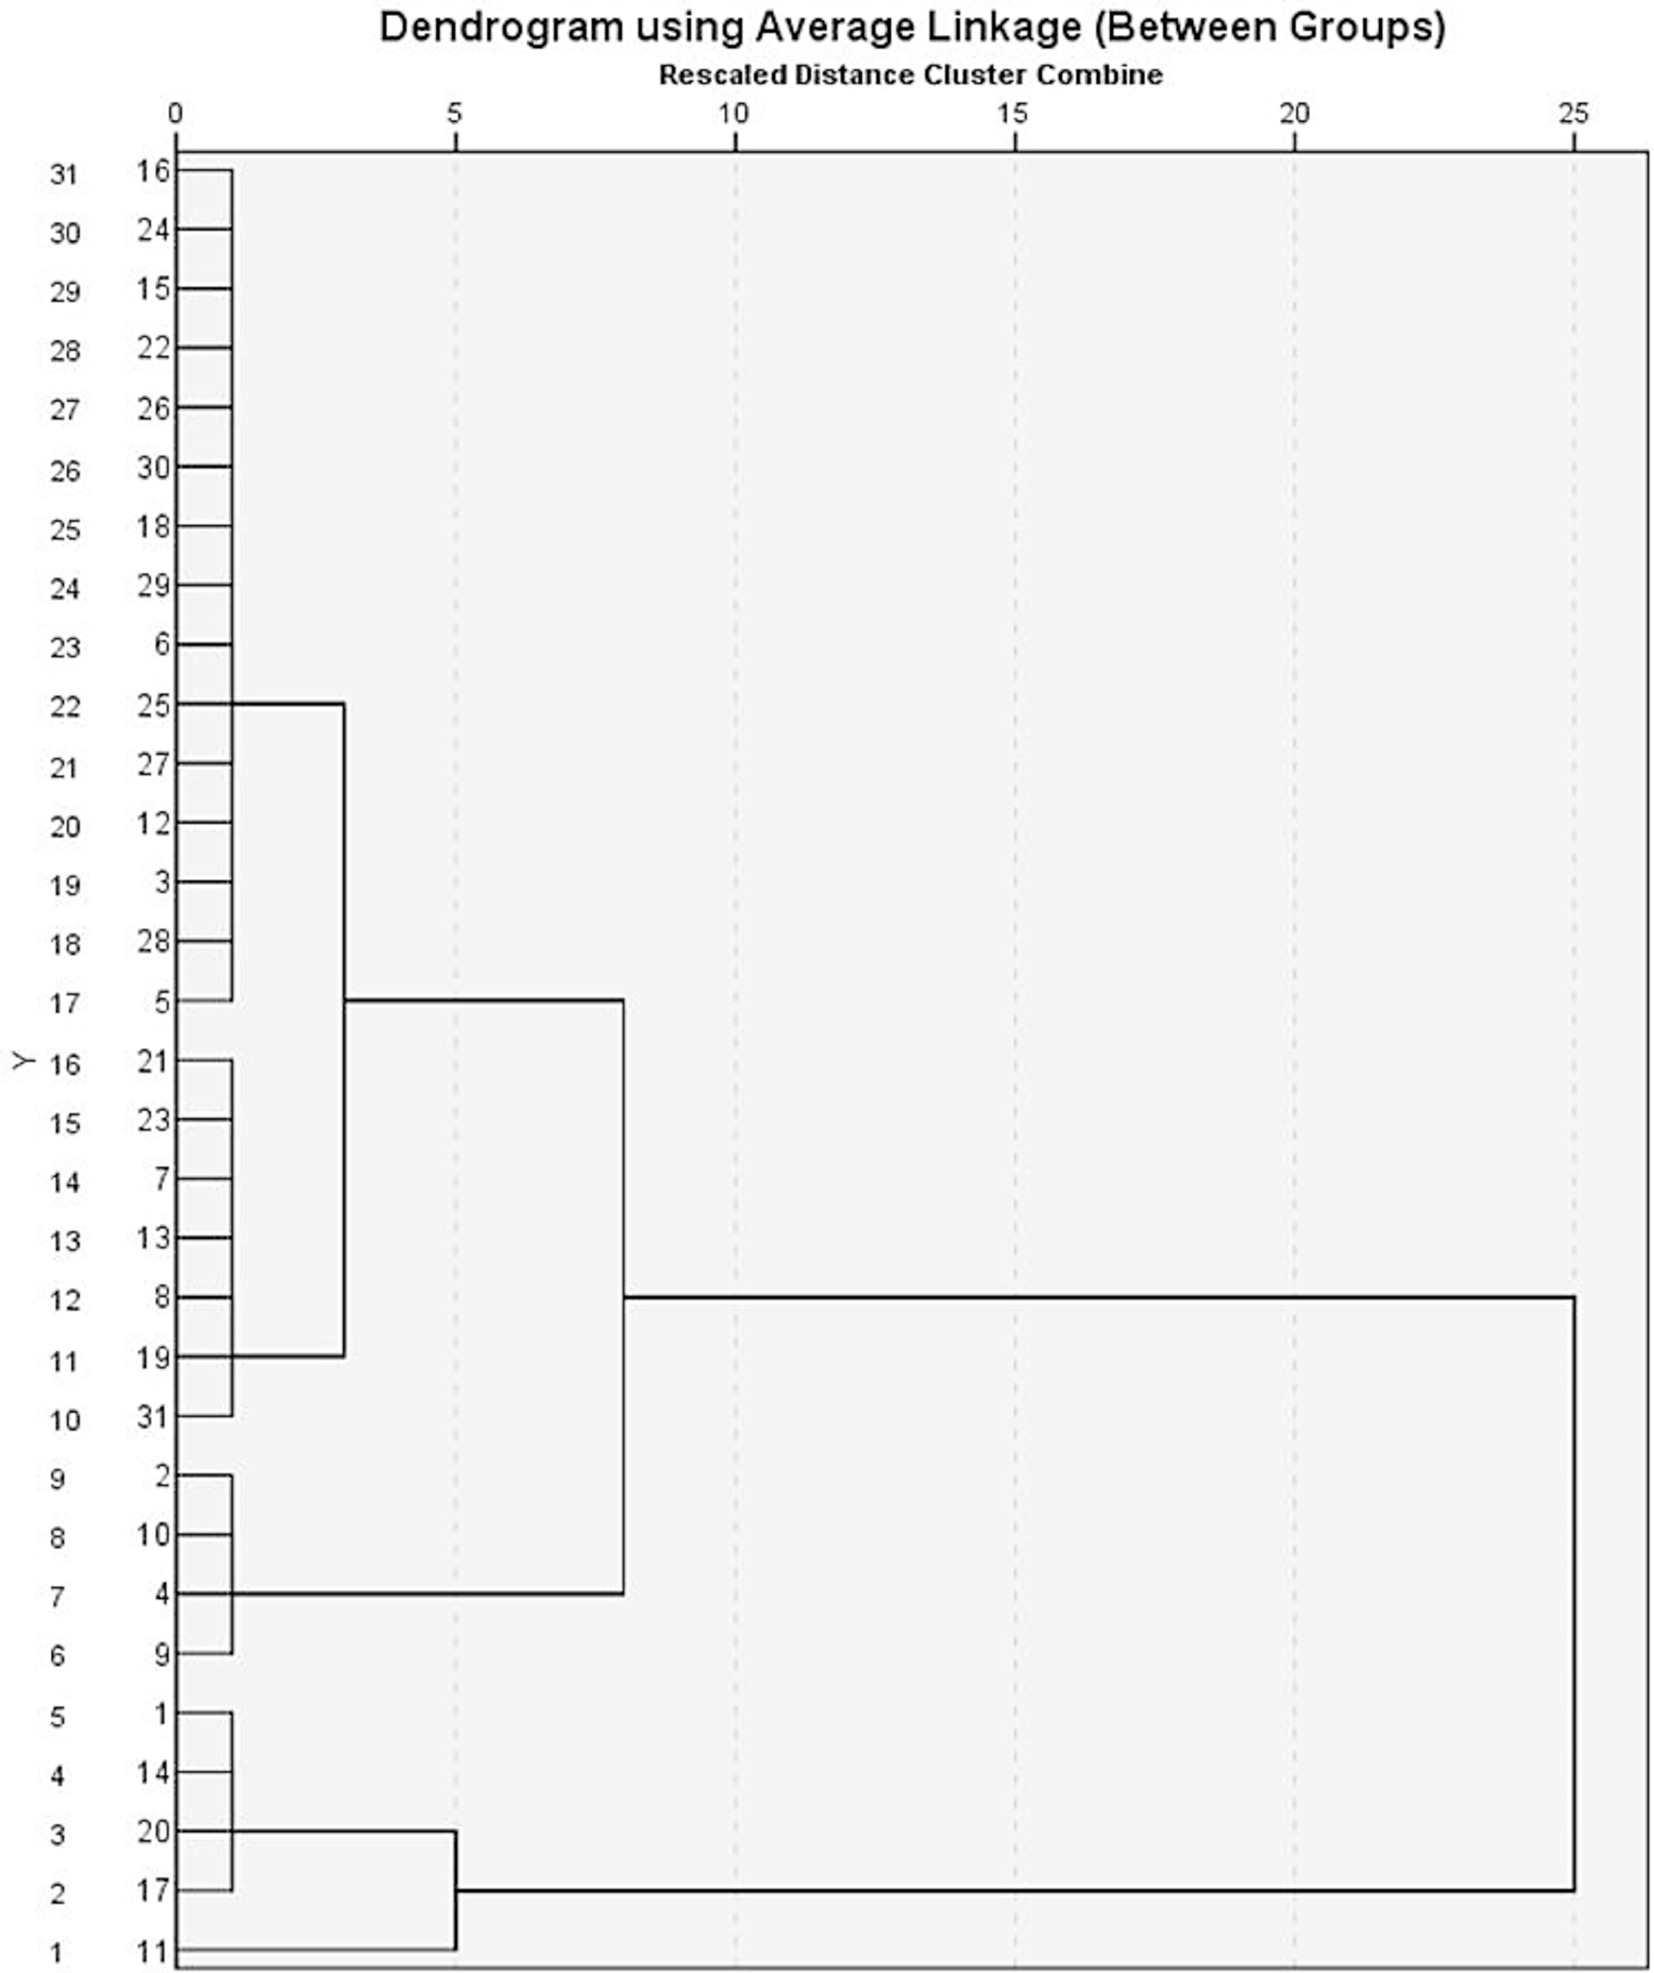
Figure 9. Dendrogram of studied HMs.
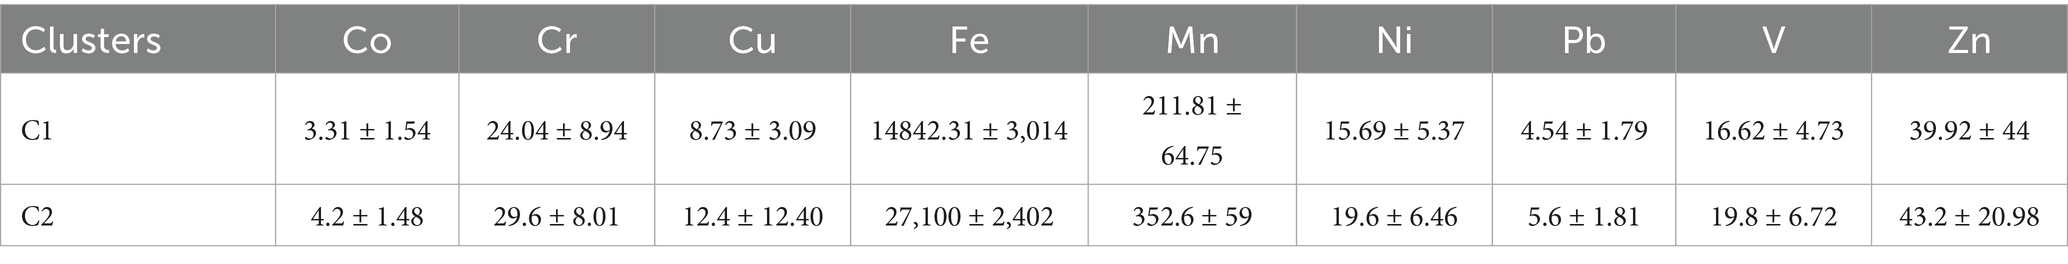
Table 6. Comparison between two studied clusters.
3.5 Contamination status
Low contamination with all HMs was indicated by the average CF values for the HMs in the soil under investigation (Table 7). Furthermore, some individual samples showed very high contamination for Zn (CF = 4.58) and moderate contamination for Cr (CF = 1.29). Agricultural practices and the nonferrous metal industry are examples of anthropogenic sources of zinc (Kabata-Pendias and Pendias, 2011). All nine soil heavy metals in the research region had NPI values less than 1, with the exception of sample number 12 (1.09), suggesting that there were no enrichment effects on the study area samples (Table 7 and Figure 10a).
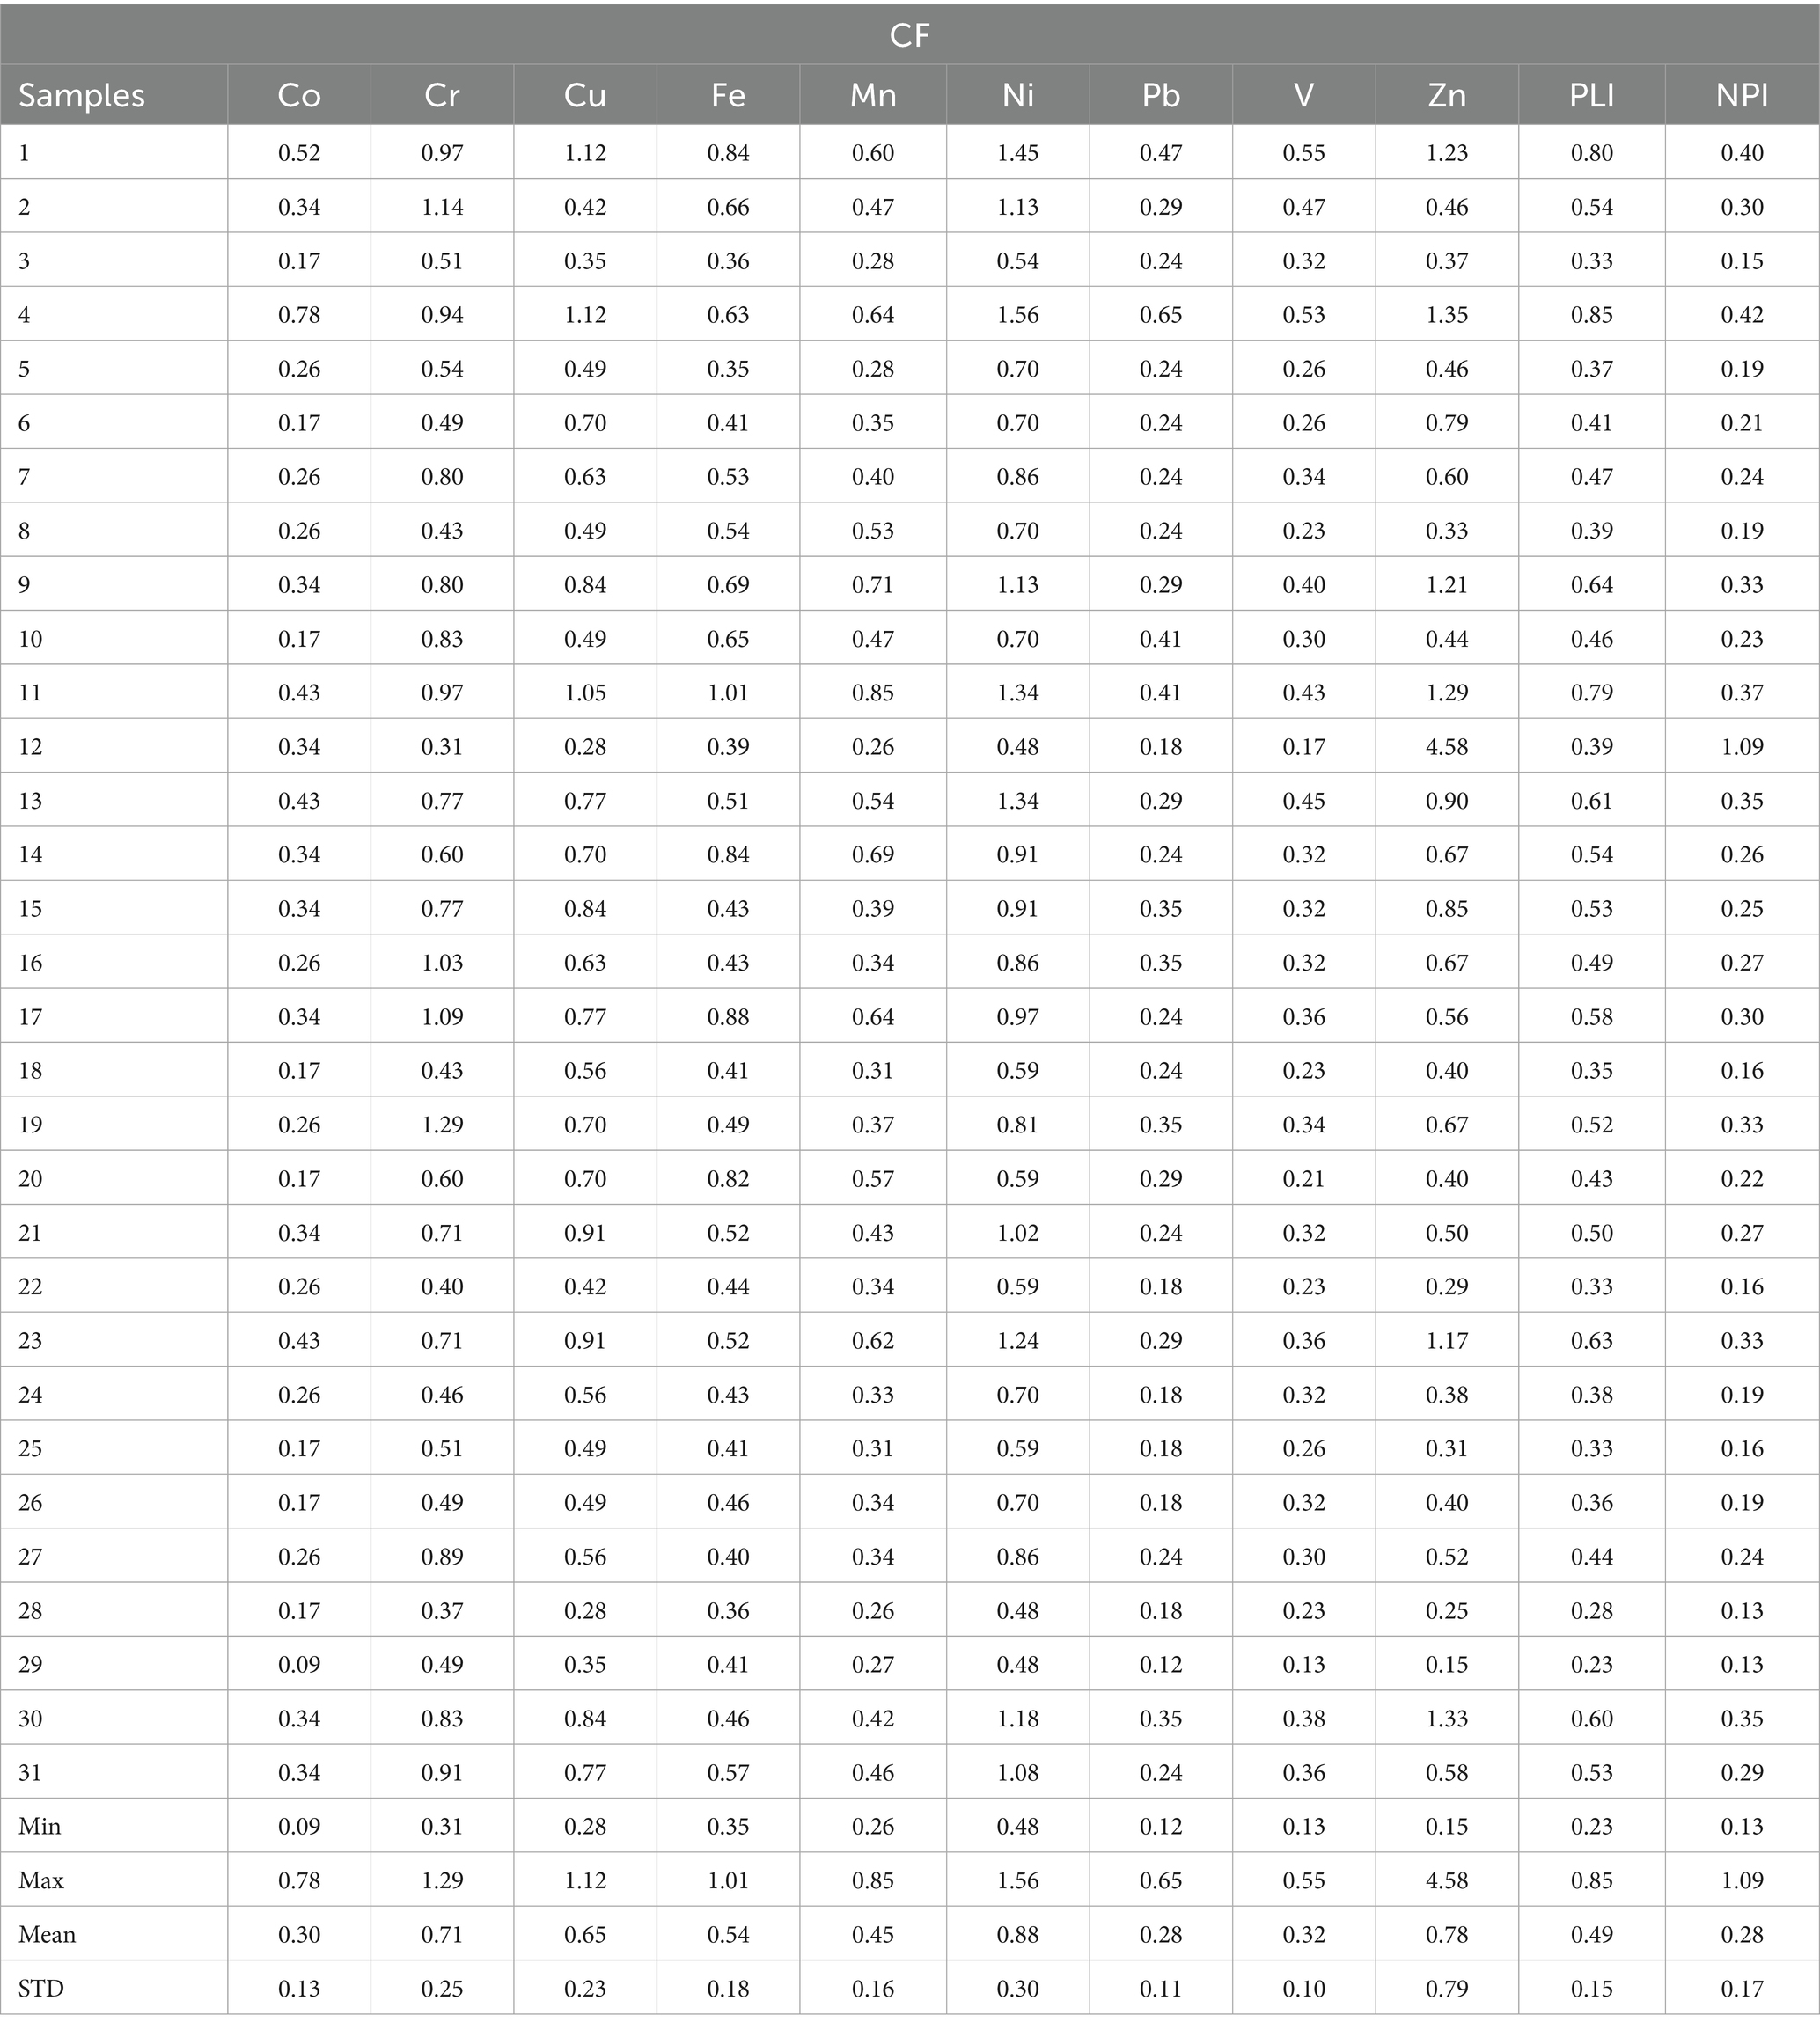
Table 7. Statistics of contamination indices of investigated area.
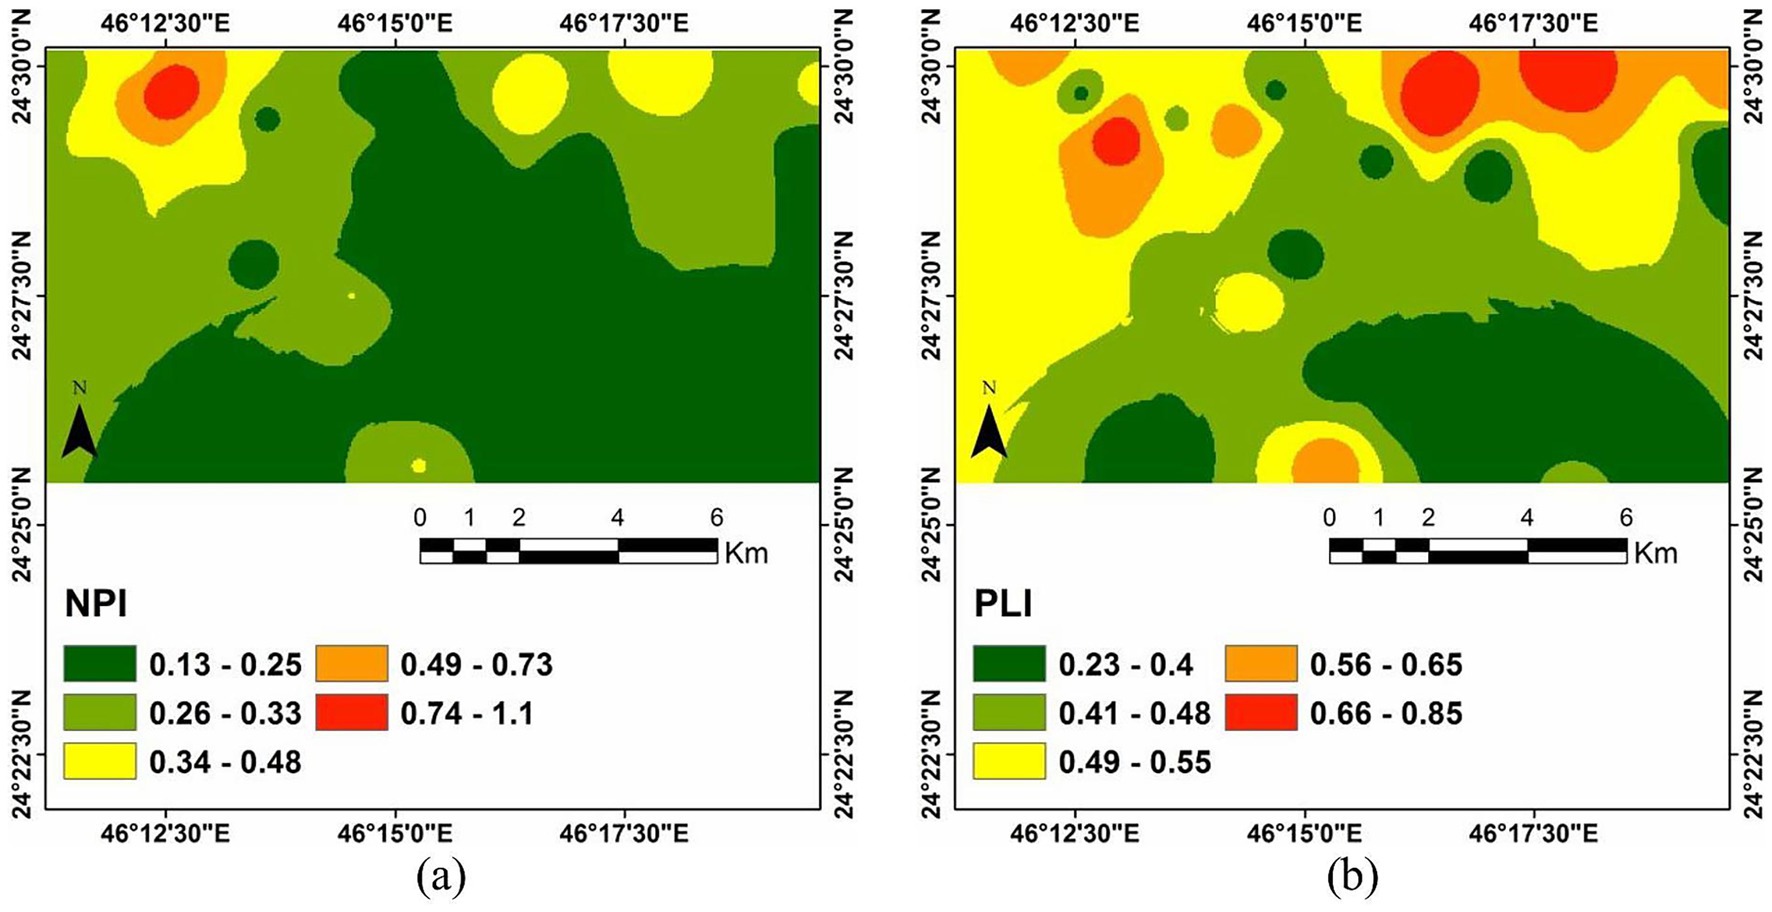
Figure 10. Interpolation maps of (a) NPI, and (b) PLI contamination indices of the study area.
PLI is used to show how soil conditions have deteriorated as a result of HMs accumulation (Varol, 2011). It had an average of 0.49 and ranged from 0.23 to 0. 85 (Table 7 and Figure 10b), indicating comparatively uncontaminated soil (PLI < 1). The results of the NDVI analysis show that there is vegetation cover in the Al-Muzahimiyah area, despite the low level of pollution currently observed there. Additionally, it is anticipated that this green cover would greatly increase in alignment with the lofty objectives of the Saudi Green Initiative, which is a pillar of Saudi Arabia’s Vision 2030. Despite the fact that this environmental development is very beneficial, these areas still require vigilant and ongoing environmental monitoring. The main worry is that future pollution levels may rise as a result of increased human activity brought on by urbanization and agricultural growth. Thus, it is not only advised but also necessary to put in place a strict program for routine monitoring in order to stop future contamination and guarantee sustainable development in tandem with greening initiatives.
3.6 Limitations of the current study
This study has limitations even if it offers insightful information. Predicting the spatial distribution of heavy metals using the Inverse Distance Weighting (IDW) interpolation approach is the main methodological limitation. IDW is a popular and practical deterministic approach, but it has built-in limitations. Its primary flaw is that it has a propensity to create “bull’s-eye” patterns around sample locations, which could over smooth the real spatial variability and result in artifacts that do not accurately represent contamination gradients. Additionally, the sample size and distribution limited the interpolation’s accuracy. An optimal sampling method was hampered by a number of field challenges, despite the fact that a larger number of systematically distributed samples is always preferred for reliable geostatistical analysis. Physical access was restricted due to the difficult terrain, which was characterized by steep hills and mountainous places. Furthermore, the existence of private farms and limited properties made it impossible to get samples from otherwise appropriate sites, which led to a sampling network that was less homogeneous and dense than originally intended. The interpolated contamination surfaces are rather imprecise due to the combined effects of these factors. Although factors like pH, soil salinity and organic carbon, which might impact metal mobility, were not measured in this study, their impact is significantly less in arid conditions. The solubility and translocation of heavy metals are restricted by the research area’s typical low rainfall and negligible leaching, which increases the accuracy of the total concentration data for source identification. This will be a crucial factor in upcoming, in-depth assessments.
4 Conclusion
To ensure sustainable agricultural output and avoid the buildup of hazardous contaminants in the food chain, it is essential to preserve uncontaminated soil, as this study has demonstrated. A particularly potent and comprehensive assessment of contamination in the study area was made possible by the combined use of sophisticated multivariate statistical techniques, particularly PCA and HCA, in conjunction with GIS and pollution indices. The PLI indicated comparatively uncontaminated soil (PLI < 1). All nine soil heavy metals in the investigated region had NPI values less than 0.7, with the exception of sample number 12 (1.09), suggesting that enrichment had no effect on the study area samples. Two principle components were identified by the PCA analysis. The PC1supports the correlation matrix of the geogenic source for the HMs under study. According to the loadings, phosphate fertilizers and fungicides used in agricultural fields to increase yields may be the source of zinc in PC2. Based on the HM concentrations, the study area was divided into two clusters. The samples in the second cluster are probably identified by higher quantities of specific heavy metals. Their closeness to agricultural areas, where methods like applying phosphate fertilizers may aid in the buildup of these elements in the soil, could be the cause of this increase. The absence of significant soil pollution is confirmed by this study, providing decision-makers with a crucial environmental baseline for the area under investigation. The preservation of the region’s natural resources for future generations, sustainable agricultural development (which aligns with UN SDG 2: Zero Hunger), and future food security all depend on these new findings. Establishing a regular monitoring program is highly advised to protect the environmental quality of the research region, even in light of the recent findings regarding safe heavy metal levels. To identify any possible future accumulation, this program should concentrate on monitoring the concentrations of important components. Moreover, to guarantee sustainable land-use practices, the thorough baseline data produced by this study should also be incorporated into agricultural and urban planning initiatives. And to maintain the area’s pristine state over time, it is also imperative to launch public awareness efforts to inform nearby people and companies about the significance of preventing soil pollution.
Data availability statement
The original contributions presented in the study are included in the article/Supplementary material, further inquiries can be directed to the corresponding author.
Author contributions
AE-S: Conceptualization, Data curation, Formal analysis, Funding acquisition, Methodology, Project administration, Resources, Writing – original draft. TA: Conceptualization, Formal analysis, Funding acquisition, Project administration, Supervision, Writing – original draft. SA: Conceptualization, Investigation, Resources, Writing – original draft. SS: Conceptualization, Formal analysis, Investigation, Resources, Writing – original draft. NR: Conceptualization, Formal analysis, Methodology, Visualization, Writing – original draft. JM: Methodology, Software, Visualization, Writing – original draft, Writing – review & editing. MS: Conceptualization, Data curation, Formal analysis, Investigation, Methodology, Project administration, Resources, Software, Validation, Visualization, Writing – original draft, Writing – review & editing.
Funding
The author(s) declare that financial support was received for the research and/or publication of this article. This research was financially supported by the Ongoing Research Funding program (ORF-2025-1044), King Saud University, Riyadh, Saudi Arabia.
Acknowledgments
The authors extend their appreciation to Ongoing Research Funding program (ORF-2025-1044), King Saud University, Riyadh, Saudi Arabia.
Conflict of interest
The authors declare that the research was conducted in the absence of any commercial or financial relationships that could be construed as a potential conflict of interest.
Generative AI statement
The authors declare that no Gen AI was used in the creation of this manuscript.
Any alternative text (alt text) provided alongside figures in this article has been generated by Frontiers with the support of artificial intelligence and reasonable efforts have been made to ensure accuracy, including review by the authors wherever possible. If you identify any issues, please contact us.
Publisher’s note
All claims expressed in this article are solely those of the authors and do not necessarily represent those of their affiliated organizations, or those of the publisher, the editors and the reviewers. Any product that may be evaluated in this article, or claim that may be made by its manufacturer, is not guaranteed or endorsed by the publisher.
Supplementary material
The Supplementary material for this article can be found online at: https://www.frontiersin.org/articles/10.3389/fsufs.2025.1695962/full#supplementary-material
References
Abdel-Fattah, M. K., Abd-Elmabod, S. K., Aldosari, A. A., Elrys, A. S., and Mohamed, E. S. (2020). Multivariate analysis for assessing irrigation water quality: a case study of the Bahr Mouise Canal, eastern Nile Delta. Water 12:2537. doi: 10.3390/w12092537
Abdelkarim, A. (2025). Monitoring and forecasting of land use/land cover (LULC) in Al-Hassa oasis, Saudi Arabia based on the integration of the cellular automata (CA) and the cellular automata-Markov model (CA-Markov). J. Geol. Ecol. Landsc. 9, 13–44. doi: 10.1080/24749508.2022.2163741
Abuzaid, A. S., and Bassouny, M. A. (2020). Total and DTPA-extractable forms of potentially toxic metals in soils of rice fields, North Nile Delta of Egypt. Environ. Technol. Innov. 18:100717. doi: 10.1016/j.eti.2020.100717
Abuzaid, A. S., Jahin, H. S., Shokr, M. S., El Baroudy, A. A., Mohamed, E. S., Rebouh, N. Y., et al. (2023). A novel regional-scale assessment of soil metal pollution in arid agroecosystems. Agronomy 13:161. doi: 10.3390/agronomy13010161
Affairs, D. O. E. (2013). National Norms and standards for the remediation of contaminated land and soil quality in the Republic of South Africa. PretoriaSouth Africa: Department of Environmental Affairs (DEA).
Aina, Y. A., Adam, E., Ahmed, F., Wafer, A., and Alshuwaikhat, H. M. (2019). Using multisource data and the V-I-S model in assessing the urban expansion of Riyadh city, Saudi Arabia. Eur. J. Remote Sens. 52, 557–571. doi: 10.1080/22797254.2019.1691469
Akbari, E., Darvishi Boloorani, A., Neysani Samany, N., Hamzeh, S., Soufizadeh, S., and Pignatti, S. (2020). Crop mapping using random forest and particle swarm optimization based on multi-temporal Sentinel-2. Remote Sens 12:1449. doi: 10.3390/rs12091449
Alarifi, S. S., El-Sorogy, A. S., Al-Kahtany, K., and Alotaibi, M. (2022). Contamination and environmental risk assessment of potentially toxic elements in soils of palm farms in Northwest Riyadh, Saudi Arabia. Sustainability 14:15402. doi: 10.3390/su142215402
Al-Boghdady, A. A., and Hassanein, K. M. A. (2019). Chemical analysis and environmental impact of heavy metals in soil of Wadi Jazan area, southwest of Saudi Arabia. Appl. Ecol. Environ. Res. 17:7067–7084. doi: 10.15666/aeer/1703_70677084
Al-Dosary, N. M. N. (2022). Evaluation of soil characteristics for agricultural machinery management and cropping requirements in Al Aflaj oasis, Saudi Arabia. Sustainability 14:7991. doi: 10.3390/su14137991
Alghamdi, A., and Cummings, A. R. (2019). Assessing Riyadh’s urban change utilizing high-resolution imagery. Land 8:193. doi: 10.3390/land8120193
Alharbi, T., and El-Sorogy, A. S. (2021). Spatial distribution and risk assessment of heavy metals pollution in soils of marine origin in Central Saudi Arabia. Mar. Pollut. Bull. 170:112605. doi: 10.1016/j.marpolbul.2021.112605
Alharbi, T., El-Sorogy, A. S., and Al-Kahtany, K. (2024). Contamination and health risk assessment of potentially toxic elements in agricultural soil of the Al-Ahsa oasis, Saudi Arabia using health indices and GIS. Arab. J. Chem. 17:105592. doi: 10.1016/j.arabjc.2023.105592
Alharbi, O. M., Khattab, R. A., and Ali, I. (2018a). Health and environmental effects of persistent organic pollutants. J. Mol. Liq. 263, 442–453. doi: 10.1016/j.molliq.2018.05.029
Alharbi, O. M., Khattab, R. A., Ali, I., Binnaser, Y. S., and Aqeel, A. (2018b). Evaluation of the heavy metals threat to the Yanbu shoreline, Red Sea, Saudi Arabia. Mar. Freshw. Res. 69, 1557–1568. doi: 10.1071/MF18079
Ali, I., Alothman, Z. A., and Alwarthan, A. (2017). Supra molecular mechanism of the removal of 17-β-estradiol endocrine disturbing pollutant from water on functionalized iron nano particles. J. Mol. Liq. 241, 123–129. doi: 10.1016/j.molliq.2018.04.021
Ali, I., Wani, W. A., Saleem, K., and Hseih, M. F. (2013). Design and synthesis of thalidomide based dithiocarbamate cu (II), Ni (II) and Ru (III) complexes as anticancer agents. Polyhedron 56, 134–143. doi: 10.1016/j.poly.2013.03.056
Alloway, B. J. (2012). Heavy metals in soils: Trace metals and metalloids in soils and their bioavailability, Dordrecht, Springer Science & Business Media. 22:11–50.
AlQurashi, A. F., and Kumar, L. (2017). An assessment of the impact of urbanization and land use changes in the fast-growing cities of Saudi Arabia. Geocarto Int. 34, 78–97. doi: 10.1080/10106049.2017.1367423
Alsabhan, A. H., Perveen, K., and Alwadi, A. S. (2022). Heavy metal content and microbial population in the soil of Riyadh region, Saudi Arabia. J. King Saud Uni. Sci. 34:101671. doi: 10.1016/j.jksus.2021.101671
Alsharhan, A. S., and Rizk, Z. E. (2020). “Liwa quaternary sand aquifer” in Water resources and integrated Management of the United Arab Emirates (Cham: Springer International Publishing), 395–426.
Alzahrani, H., El-Sorogy, A. S., Okok, A., and Shokr, M. S. (2024). GIS-and multivariate-based approaches for assessing potential environmental hazards in some areas of southwestern Saudi Arabia. Toxics 12:569. doi: 10.3390/toxics12080569
Ashraf, A. M. (1991) The national soil survey and land classification projects. PAO/Ministry of Agriculture and Water: Riyadh, Saudi Arabia.
Benhaddya, M. L., and Hadjel, M. (2014). Spatial distribution and contamination assessment of heavy metals in surface soils of Hassi Messaoud, Algeria. Environ. Earth Sci. 71, 1473–1486. doi: 10.1007/s12665-013-2552-3
Cai, D., Fraedrich, K., Sielmann, F., Guan, Y., Guo, S., Zhang, L., et al. (2014). Climate and vegetation: an ERA-interim and GIMMS NDVI analysis. J. Clim. 27, 5111–5118. doi: 10.1175/JCLI-D-13-00674.1
Chandrasiri, G. U., Mubarak, M. N. A., Mahatantila, K., and Mahanama, K. R. R. (2019). Single laboratory validation of determination of 13 trace elements in rice by ICP-MS with an overview of challenges encountered. Am. J. Anal. Chem. 10, 367–376. doi: 10.4236/ajac.2019.109025
Chuvieco, E., Cocero, D., Riano, D., Martin, P., Martınez-Vega, J., De La Riva, J., et al. (2004). Combining NDVI and surface temperature for the estimation of live fuel moisture content in forest fire danger rating. Remote Sens. Environ. 92, 322–331. doi: 10.1016/j.rse.2004.01.019
Clemente, J. P., Fontanelli, G., Ovando, G. G., Roa, Y. L. B., Lapini, A., and Santi, E.. (2020) Google Earth Engine: application of algorithms for remote sensing of crops in Tuscany (Italy). In 2020 IEEE Latin American GRSS & ISPRS Remote Sensing Conference (LAGIRS) (pp. 195–200). IEEE.
Csomós, E., Héberger, K., and Simon-Sarkadi, L. (2002). Principal component analysis of biogenic amines and polyphenols in Hungarian wines. J. Agric. Food Chem. 50, 3768–3774. doi: 10.1021/jf011699a
Dragović, S., Mihailović, N., and Gajić, B. (2008). Heavy metals in soils: distribution, relationship with soil characteristics and radionuclides and multivariate assessment of contamination sources. Chemosphere 72, 491–495. doi: 10.1016/j.chemosphere.2008.02.063
Dutta, D., Kundu, A., Patel, N. R., Saha, S. K., and Siddiqui, A. R. (2015). Assessment of agricultural drought in Rajasthan (India) using remote sensing derived vegetation condition index (VCI) and standardized precipitation index (SPI). Egypt. J. Remote Sens. Space Sci. 18, 53–63. doi: 10.1016/j.ejrs.2015.03.006
El-Sorogy, A. S., and Al Khathlan, M. H. (2024). Assessment of potentially toxic elements and health risks of agricultural soil in Southwest Riyadh, Saudi Arabia. Open Chem. 22:20240017. doi: 10.1515/chem-2024-0017
El-Sorogy, A. S., Al-Kahtany, K., Shokr, M., Alharbi, T., and de Larriva, J. E. M. (2025). On evaluating the possible hazard of soil contamination in arid regions using statistical analysis and GIS techniques. Front. Earth Sci. 13:1605796. doi: 10.3389/feart.2025.1605796
EL-Sorogy, A. S., Almadani, S. A., and Al-Dabbagh, M. E. (2016). Microfacies and diagenesis of the reefal limestone, callovian Tuwaiq mountain limestone formation, Central Saudi Arabia. J. Afr. Earth Sci. 115, 63–70. doi: 10.1016/j.jafrearsci.2015.12.013
El-Sorogy, A., Nour, H. E., Al-Kahtany, K., Youssef, M., Alharbi, T., and Yakubu, M. A. (2025). Potential health and ecological risk assessment of selected heavy metals in Dammam coastal sediments, Arabian gulf. Reg. Stud. Mar. Sci. 89:104354. doi: 10.1016/j.rsma.2025.104354
El-Sorogy, A. S., Youssef, M., and Al-Kahtany, K. (2021). Evaluation of coastal sediments for heavy metal contamination, Yanbu area, Red Sea coast, Saudi Arabia. Mar. Pollut. Bull. 163:111966. doi: 10.1016/j.marpolbul.2020.111966
Emam, W. W., and Soliman, K. M. (2022). Geospatial analysis, source identification, contamination status, ecological and health risk assessment of heavy metals in agricultural soils from Qallin city, Egypt. Stoch. Environ. Res. Risk Assess. 36, 2437–2459. doi: 10.1007/s00477-021-02097-8
Fan, S., Wang, X., Lei, J., Ran, Q., Ren, Y., and Zhou, J. (2019). Spatial distribution and source identification of heavy metals in a typical Pb/Zn smelter in an arid area of Northwest China. Hum. Ecol. Risk. Assess. 25, 1661–1687. doi: 10.1080/10807039.2018.1539640
FAO (2022). Soil resources in arid regions 2022. Availalbe online at: www.fao.org.
Fehér, Z. Z., Magyar, T., Tóth, F. A., and Nagy, P. T. (2025). Heavy metal concentrations in Debrecen’s urban soils: implications for upcoming industrial projects. Soil Syst. 9:97. doi: 10.3390/soilsystems9030097
Gandhi, G. M., Parthiban, S., Thummalu, N., and Christy, A. (2015). Ndvi: vegetation change detection using remote sensing and gis–a case study of Vellore District. Proc. Comput. Sci. 57, 1199–1210. doi: 10.1016/j.procs.2015.07.415
Gantumur, S., Kharitonova, G. V., Stepanov, A. S., and Dubrovin, K. N. (2021). Assessment of soil contamination using remote sensing data in the Tamsag-Bulag oil field, Mongolia. IOP Conf. Series Earth Environ. Sci. 895:012013. doi: 10.1088/1755-1315/895/1/012013
Gao, B. C. (1996). NDWI—a normalized difference water index for remote sensing of vegetation liquid water from space. Remote Sens. Environ. 58, 257–266. doi: 10.1016/S0034-4257(96)00067-3
Ghafarian Malamiri, H. R., Rousta, I., Olafsson, H., Zare, H., and Zhang, H. (2018). Gap-filling of MODIS time series land surface temperature (LST) products using singular spectrum analysis (SSA). Atmos 9:334. doi: 10.3390/atmos9090334
Gitelson, A. A., Viña, A., Arkebauer, T. J., Rundquist, D. C., Keydan, G., and Leavitt, B. (2003). Remote estimation of leaf area index and green leaf biomass in maize canopies. Geophys. Res. Lett. 30. doi: 10.1029/2002GL016450
Gong, G., Mattevada, S., and O’Bryant, S. E. (2014). Comparison of the accuracy of kriging and IDW interpolations in estimating groundwater arsenic concentrations in Texas. Environ. Res. 130, 59–69. doi: 10.1016/j.envres.2013.12.005
Gotway, C. A., Ferguson, R. B., Hergert, G. W., and Peterson, T. A. (1996). Comparison of kriging and inverse-distance methods for mapping soil parameters. Soil Sci. Soc. Am. J. 60, 1237–1247. doi: 10.2136/sssaj1996.03615995006000040040x
Guan, Y., Shao, C., and Ju, M. (2014). Heavy metal contamination assessment and partition for industrial and mining gathering areas. Int. J. Environ. Res. Public Health 11, 7286–7303. doi: 10.3390/ijerph110707286
Hakanson, L. (1980). An ecological risk index for aquatic pollution control. A sedimentological approach. Water Res. 14, 975–1001. doi: 10.1016/0043-1354(80)90143-8
Hammam, A. A., Mohamed, W. S., Sayed, S. E. E., Kucher, D. E., and Mohamed, E. S. (2022). Assessment of soil contamination using gis and multi-variate analysis: a case study in El-Minia governorate, Egypt. Agronomy 12:1197. doi: 10.3390/agronomy12051197
Hendawy, E., Belal, A. A. A., Rebouh, N. Y., Shokr, M. S., Mohamed, E. S., Sheta, A. E. A. S., et al. (2024). Assessing surface water quality using risk indicators, geographic information system modeling techniques, and multi-statistical methods in arid regions to maintain the sustainability of water resources. Agronomy 14:2834. doi: 10.3390/agronomy14122834
Hendawy, E., Belal, A. A., Sheta, A. E. A. S., Mohamed, E. S., Kucher, D. E., Jalhoum, M. E., et al. (2025). Assessment of human activities on soil contamination in Egypt: implications for the MENA region. Front. Environ. Sci. 13:1493197. doi: 10.3389/fenvs.2025.1493197
Hodam, S., Sarkar, S., Marak, A. G., Bandyopadhyay, A., and Bhadra, A. (2017). Spatial interpolation of reference evapotranspiration in India: comparison of IDW and kriging methods. J. Insti. Eng. 98, 511–524. doi: 10.1007/s40030-017-0241-z
Irpino, A., and Verde, R. (2006). “A new Wasserstein based distance for the hierarchical clustering of histogram symbolic data” in Data science and classification (Berlin, Heidelberg: Springer Berlin Heidelberg), 185–192.
Isaaks, E. H., and Srivastava, R. M. (1989). An Introduction to Applied Geostatistics. 413, New York: Oxford University Press..
Jaishankar, M., Tseten, T., Anbalagan, N., Mathew, B. B., and Beeregowda, K. N. (2014). Toxicity, mechanism and health effects of some heavy metals. Interdiscip. Toxicol. 7, 60–72. doi: 10.2478/intox-2014-0009
Jalhoum, M. E., Abdellatif, M. A., Mohamed, E. S., Kucher, D. E., and Shokr, M. (2024). Multivariate analysis and GIS approaches for modeling and mapping soil quality and land suitability in arid zones. Heliyon 10:1–15. doi: 10.1016/j.heliyon.2024.e27577
Kahal, A. Y., El-Sorogy, A. S., Meroño de Larriva, J. E., and Shokr, M. S. (2025). Mapping soil contamination in arid regions: a GIS and multivariate analysis approach. Minerals 15:124. doi: 10.3390/min15020124
Khan, I., Choudhary, B. C., Izhar, S., Kumar, D., Satyanarayanan, M., Rajput, V. D., et al. (2024). Exploring geochemical distribution of potentially toxic elements (PTEs) in wetland and agricultural soils and associated health risks. Environ. Sci. Pollut. Res. 31, 17964–17980. doi: 10.1007/s11356-023-25141-2
Korzeniowska, J. (2022). Heavy metal content in the soil along the road no. 7 near chyżne. Atmos. 14:2. doi: 10.3390/atmos14010002
Kowalska, J. B., Mazurek, R., Gąsiorek, M., and Zaleski, T. (2018). Pollution indices as useful tools for the comprehensive evaluation of the degree of soil contamination–a review. Environ. Geochem. Health 40, 2395–2420. doi: 10.1007/s10653-018-0106-z
Laurent, D. (1993). Kingdom of Saudi Arabia atlas of industrial minerals. Jeddah: Saudi Arabian Directorate General of Mineral Resources.
Ma, Y., Gong, M., Zhao, H., and Li, X. (2018). Influence of low impact development construction on pollutant process of road-deposited sediments and associated heavy metals. Sci. Total Environ. 613-614, 1130–1139. doi: 10.1016/j.scitotenv.2017.09.174
Marrugo-Negrete, J., Pinedo-Hernández, J., and Díez, S. (2017). Assessment of heavy metal pollution, spatial distribution and origin in agricultural soils along the Sinú River basin, Colombia. Environ. Res. 154, 380–388. doi: 10.1016/j.envres.2017.01.021
Mohamed, E. S., Jalhoum, M. E., Belal, A. A., Hendawy, E., Azab, Y. F., Kucher, D. E., et al. (2023). A novel approach for predicting heavy metal contamination based on adaptive neuro-fuzzy inference system and GIS in an arid ecosystem. Agronomy 13:1873. doi: 10.3390/agronomy13071873
Mohamed, E. S., Jalhoum, M. E., Hendawy, E., El-Adly, A. M., Nawar, S., Rebouh, N. Y., et al. (2024). Geospatial evaluation and bio-remediation of heavy metal-contaminated soils in arid zones. Front. Environ. Sci. 12:1381409. doi: 10.3389/fenvs.2024.1381409
Nazzal, Y., Howari, F. M., Jafri, M. K., Naeem, M., and Ghrefat, H. (2016). Risk assessment through evaluation of potentially toxic metals in the surface soils of the Qassim area, Central Saudi Arabia. Ital. J. Geosci. 135, 210–216. doi: 10.3301/ijg.2015.10
Nieder, R., Benbi, D. K., and Reichl, F. X. (2018). Soil components and human health. Springer, Dordrecht. doi: 10.1007/978-94-024-1222-2
Papadoyannis, I. N., and Samanidou, V. F. (2004). Validation of HPLC instrumentation. J. Liq. Chromatogr. Relat. Technol. 27, 753–783. doi: 10.1081/JLC-120029697
Peres-Neto, P. R., Jackson, D. A., and Somers, K. M. (2005). How many principal components? Stopping rules for determining the number of non-trivial axes revisited. Comput. Stat. Data Anal. 49, 974–997. doi: 10.1016/j.csda.2004.06.015
Rahman, M. T., and Planning, R. (2016). Land use and land cover changes and urban sprawl in Riyadh, Saudi Arabia: an analysis using multi-temporal Landsat data and Shannon’s entropy index. Int. Arch. Photogramm. Remote. Sens. Spat. Inf. Sci. 41, 1017–1021. doi: 10.5194/isprs-archives-XLI-B8-1017-2016
Said, M. E. S., Ali, A. M., Borin, M., Abd-Elmabod, S. K., Aldosari, A. A., Khalil, M. M., et al. (2020). On the use of multivariate analysis and land evaluation for potential agricultural development of the northwestern coast of Egypt. Agronomy 10:1318. doi: 10.3390/agronomy10091318
Shadfan, H., Mashhady, A., Eter, A., and Hussen, A. A. (1984). Mineral composition of selected soils in Saudi Arabia. Z. Pflanzenernähr. Bodenkd. 147, 657–668. doi: 10.1002/jpln.19841470603
Shapiro, S. S., and Wilk, M. B. (1965). An analysis of variance test for normality (complete samples). Biometrika 52, 591–611. doi: 10.1093/biomet/52.3-4.591
Sheta, A. (2004). Soil quality: standards of soil quality under the conditions of Saudi Arabia. Riyadh, Saudi: Saudi Society for Agricultural Sciences, King Saud.
Shomrany, A. A. (2024). Integrating GIS and remote sensing data for detecting change in agricultural land during 1985-2024 in Qassim region, Saudi Arabia, Egypt J Environ Change 2, 51–72. doi: 10.21608/ejec.2024.381190
Sun, H., Xu, X., Gao, G., Zhang, Z., and Yin, P. (2010). A novel integrated active capping technique for the remediation of nitrobenzene-contaminated sediment. J. Hazard. Mater. 182, 184–190. doi: 10.1016/j.jhazmat.2010.06.013
Tariq, A., and Shu, H. (2020). CA-Markov chain analysis of seasonal land surface temperature and land use land cover change using optical multi-temporal satellite data of Faisalabad, Pakistan. Remote Sens 12:3402. doi: 10.3390/rs12203402
Tarpley, J. D., Schneider, S. R., and Money, R. L. (1984). Global vegetation indices from the NOAA-7 meteorological satellite. J. Appl. Meteorol. Climatol. 23, 491–494. doi: 10.1175/1520-0450(1984)023%3C0491:GVIFTN%3E2.0.CO;2
Thenkabail, P. S., and Gamage, M. S. D. N. (2004). The use of remote sensing data for drought assessment and monitoring in southwest asia. Research Report, International Water Management Institute, Colombo, Sri Lanka.
Varol, M. (2011). Assessment of heavy metal contamination in sediments of the Tigris River (Turkey) using pollution indices and multivariate statistical techniques. J. Hazard. Mater. 195, 355–364. doi: 10.1016/j.jhazmat.2011.08.051
Verburg, P. H., Schot, P. P., Dijst, M. J., and Veldkamp, A. (2004). Land use change modelling: current practice and research priorities. GeoJournal 61, 309–324. doi: 10.1007/s10708-004-4946-y
Wang, Y. M., Luo, Y., and Hua, Z. (2008). On the extent analysis method for fuzzy AHP and its applications. Eur. J. Oper. Res. 186, 735–747. doi: 10.1016/j.ejor.2007.01.050
Wang, C., Zou, X., Feng, Z., Hao, Z., and Gao, J. (2018). Distribution and transport of heavy metals in estuarine–inner shelf regions of the East China Sea. Sci. Total Environ. 644, 298–305. doi: 10.1016/j.scitotenv.2018.06.383
Wedepohl, K. H. (1994). The composition of the continental crust. Mineral. Mag. 58A, 959–960. doi: 10.1180/minmag.1994.58A.2.234
Xu, X., Zhao, Y., Zhao, X., Wang, Y., and Deng, W. (2014). Sources of heavy metal pollution in agricultural soils of a rapidly industrializing area in the Yangtze Delta of China. Ecotoxicol. Environ. Saf. 108, 161–167. doi: 10.1016/j.ecoenv.2014.07.001
Xue, H., Xu, X., Zhu, Q., Yang, G., Long, H., Li, H., et al. (2023). Object-oriented crop classification using time series sentinel images from Google earth engine. Remote Sens 15:1353. doi: 10.3390/rs15051353
Yang, Q., Li, Z., Lu, X., Duan, Q., Huang, L., and Bi, J. (2018). A review of soil heavy metal pollution from industrial and agricultural regions in China: pollution and risk assessment. Sci. Total Environ. 642, 690–700. doi: 10.1016/j.scitotenv.2018.06.068
Youssef, M., and El-Sorogy, A. S. (2015). Paleoecology of benthic foraminifera in coral reefs recorded in the Jurassic Tuwaiq Mountain formation of the Khashm Al-Qaddiyah area, Central Saudi Arabia. J. Earth Sci. 26, 224–235. doi: 10.1007/s12583-015-0529-8
Yousif, I. A., Abdel Hamid, A., Aldabaa, A. A., Hassanein, S. A., Rebouh, N. Y., Mohamed, E. S., et al. (2025). Soil quality indicator-based land productivity modelling for agricultural sustainability. PloS one 20:e0316840.
Zhao, H., Liu, P., Qiao, B., and Wu, K. (2021). The spatial distribution and prediction of soil heavy metals based on measured samples and multi-spectral images in tai Lake of China. Land 10:1227. doi: 10.3390/land10111227
Keywords: multivariate analysis, GIS, HMs, contamination indices, NDVI, food security, Saudi Arabia
Citation: El-Sorogy AS, Alharbi T, Almadani SA, Shoaib S, Rikan N, Meroño de Larriva JE and Shokr MS (2025) An integrated GIS–statistical approach to assess soil contamination in Al-Muzahmiya, Saudi Arabia: implications for food security. Front. Sustain. Food Syst. 9:1695962. doi: 10.3389/fsufs.2025.1695962
Edited by:
Mjabuliseni Ngidi, University of KwaZulu-Natal, South AfricaReviewed by:
Ahmed M. Aggag, Qassim University, Saudi ArabiaNeeru Bala, Khalsa College for Women, India
Copyright © 2025 El-Sorogy, Alharbi, Almadani, Shoaib, Rikan, Meroño de Larriva and Shokr. This is an open-access article distributed under the terms of the Creative Commons Attribution License (CC BY). The use, distribution or reproduction in other forums is permitted, provided the original author(s) and the copyright owner(s) are credited and that the original publication in this journal is cited, in accordance with accepted academic practice. No use, distribution or reproduction is permitted which does not comply with these terms.
*Correspondence: Mohamed S. Shokr, bW9oYW1lZF9zaG9rckBzZ3IudGFudGEuZWR1LmVn