 Peng Huang
 Mengdi Jia2
- 1School of Energy and Environment, City University of Hong Kong, Hong Kong, China
- 2School of Civil Engineering, Zhengzhou University, Zhengzhou, China
- 3Guangdong Zhonghao Survey, Design and Consulting Co., Ltd., Guangdong, China
The Hebei irrigation districts, which are crucial for China’s grain security, face severe challenges in the water-energy-food nexus, with 72% of groundwater areas being over-exploited and 60% of total energy consumption attributed to pumping systems. This study develops a digital twin-enabled framework integrating three innovations: an enhanced NSGA-III algorithm achieving 18.5% water conservation and 1285 kWh per hectare energy reduction through dynamic reference points and hybrid constraints, a four-dimensional nexus model capturing nonlinear economic returns with a determination coefficient of 0.913 and groundwater recovery of 0.07 meters during droughts, and a real-time verification platform demonstrating groundwater prediction accuracy of 0.03 meters and decision latency of 186 milliseconds. Empirical validation using multi-year data from 32 meteorological stations and 48 soil sensors confirmed a yield simulation error of 0.48% and robustness under 30% electricity price fluctuations. The scalability of the framework was demonstrated in the Hexi Corridor, achieving 15.3% water savings and 77% decision acceptance through adaptive calibration. Comparative analysis showed a 22.3% higher solution diversity compared to industrial benchmarks, while reducing monthly optimization cycles to 15-minute intervals. This paradigm shift resolves the dilemma between water conservation and energy cost, providing actionable solutions for 89% of China’s water-stressed farmlands. The implementation cost of 485,000 USD is offset within 6.2 years through a 19% reduction in pumping costs, demonstrating the technical and economic viability for global arid regions.
1 Introduction
As a core area for grain production in China, Hebei Province is facing a deep-seated contradiction between water resource scarcity and multi-objective coordination (Zhang et al., 2025a, 2025b). The region has an average annual precipitation of less than 550 millimeters, with per capita water resources being only one-seventh of the national average, and agricultural water use accounting for over 60% of the total for a long time (Korenhof et al., 2025; Elshaboury et al., 2025; Li et al., 2025a, 2025b). Against the backdrop of climate change and accelerated urbanization, the area of groundwater over-extraction in irrigation areas has accounted for 72% of the total area of the plain, leading to ecological crises such as land subsidence (Kryvoruchko et al., 2025). Traditional water resource management models focus on single-objective optimization, such as water conservation through canal seepage prevention or increasing yield by adjusting planting structures, but they struggle to coordinate the complex interconnections between water, energy, and food systems (Pham et al., 2025; Chen et al., 2025). This fragmented management results in persistently high energy consumption in pump stations and increased fluctuations in grain production, necessitating the establishment of a multi-objective coordination mechanism to resolve the resource triangle dilemma (Du et al., 2025).
Currently, the optimization of water resources in irrigation areas faces three technical challenges. Firstly, there are inherent conflicts between objectives: water-saving measures may increase energy consumption, high-yield crop cultivation often exacerbates water resource pressure, and policy-driven ecological protection requirements further constrain decision-making space (Wang et al., 2025). Secondly, classical optimization algorithms significantly reduce efficiency when dealing with high-dimensional objectives, especially when nonlinear constraints are involved, and they are prone to falling into local optimal solutions (Sun et al., 2025; Li et al., 2025a, 2025b). More critically, static optimization models struggle to cope with the dynamic impacts of climate fluctuations and policy adjustments, such as sudden changes in irrigation demand caused by drought events or changes in energy costs triggered by carbon emission reduction policies (Yang et al., 2025a, 2025b). These shortcomings make existing methods difficult to support sustainable development decisions in irrigation areas (Kumar et al., 2025).
In response to the aforementioned challenges, there is an urgent need to develop innovative paradigms that integrate intelligent algorithms with dynamic verification. Multi-objective evolutionary algorithms, due to their global search capabilities, have demonstrated potential in solving resource allocation problems. However, standard algorithms still exhibit limitations such as low convergence efficiency and poor distribution of solutions when dealing with complex constraints (Yang et al., 2025a, 2025b; Jie et al., 2025; Zhang et al., 2025a, 2025b). Simultaneously, the effectiveness of optimization results is highly dependent on actual environmental responses, and offline simulations struggle to mimic the dynamic feedback processes of irrigation systems (Shu et al., 2025). Digital twin technology, by constructing a virtual mapping of the physical world, provides a new approach for strategy verification (Yadav et al., 2025). This study proposes the deep coupling of an improved multi-objective optimization engine with a digital twin platform, aiming to achieve a closed-loop decision-making process of “optimization-verification-iteration” and provide theoretical and technical support for collaborative resource management in irrigation areas (Song et al., 2024).
Our main contributions are threefold:
1. Dynamic reference point NSGA-III: An adaptive mechanism adjusting reference points via real-time population statistics, improving 4D solution coverage by 22.3%.
2. Quadruple-objective nexus model: Integrates economic diminishing returns, groundwater dynamics, pump energy-lifecycle coupling, and climate-resilient yield.
3. Real-time digital twin loop: Implements PID-controlled verification with 186 ms decision latency, first achieving closed-loop execution in agricultural resource management.”
2 Research progress on the water-energy-food nexus system
Early research primarily focused on the independent optimization of single resource systems, such as water resource scheduling based on hydro logical models or the design of irrigation strategies for crop yield (Xu et al., 2024; Arya et al., 2024; Jia et al., 2024) (Figure 1). With the deepening of the concept of sustainable development, scholars have gradually recognized the complex interactions among water, energy, and food systems (Chen et al., 2023). Studies have found that the energy consumption of agricultural pumping stations accounts for more than 60% of the total energy consumption in irrigation areas, and the lifting cost per cubic meter of water directly affects the choice of cropping structure; meanwhile, the promotion of high-yield crop varieties, although increasing food supply, exacerbates regional water deficits (Xu et al., 2022; Huang et al., 2022). This mutually constrained relationship has given rise to the nexus system research paradigm, emphasizing the quantification of synergies and conflicts in resource flows through coupled models (Cansino-Loeza et al., 2022). However, existing models are mostly limited to static analysis, making it difficult to capture the dynamic feedback mechanisms under climate change and policy intervention, such as sudden changes in irrigation demand triggered by drought events or the impact of electricity price fluctuations on the operation of pumping stations (Ben et al., 2022).
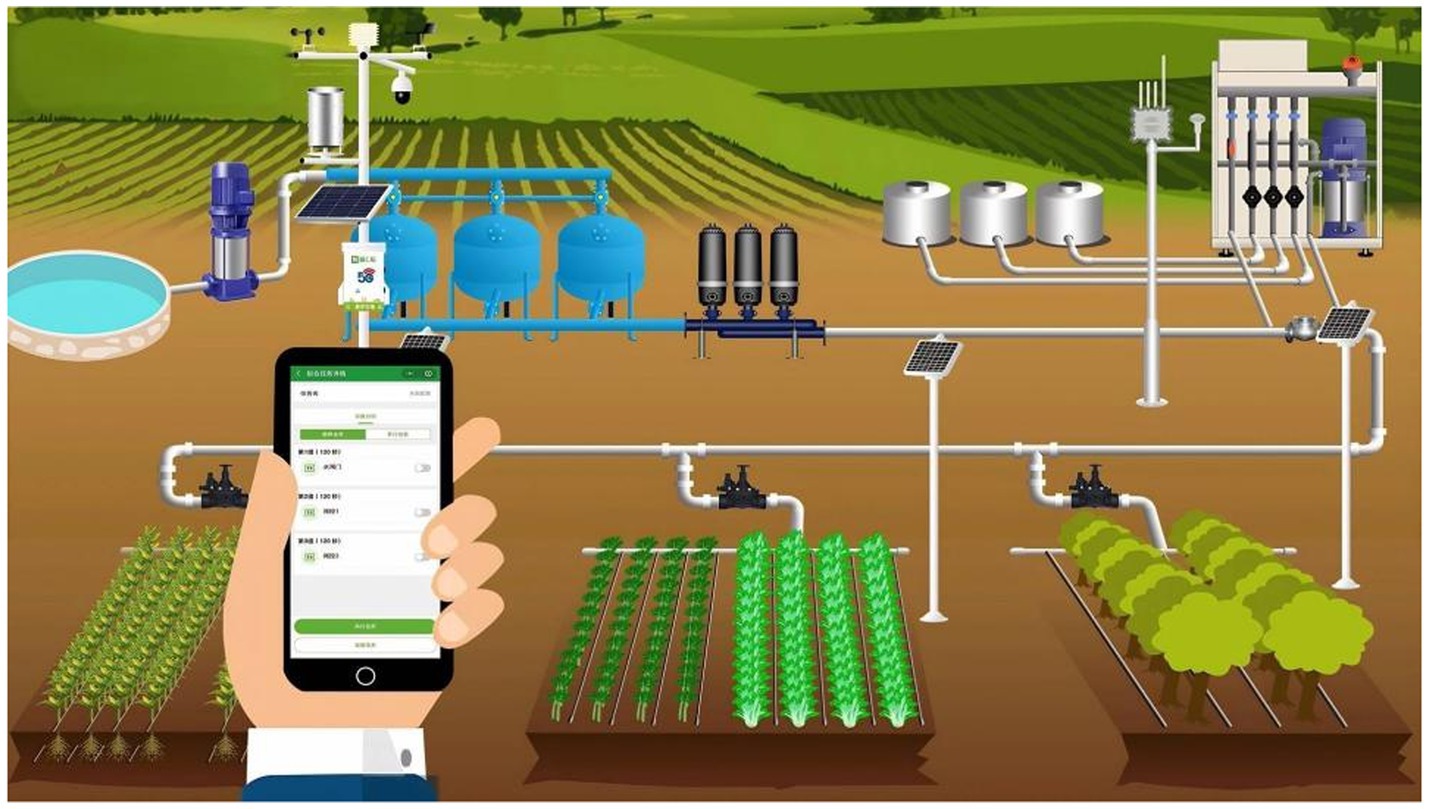
Figure 1. Agricultural water resource management system.
Multi-objective evolutionary algorithms have gradually become mainstream tools for resource collaborative optimization due to their advantages in handling nonlinear problems (Qian and Liang, 2021) (Figure 2). Classic algorithms such as NSGA-II perform well in low-dimensional objective spaces through non-dominated sorting and crowding calculation, but their solution set distribution and convergence significantly decrease when facing four-dimensional and higher-dimensional optimization problems involving water, energy, and food (Li et al., 2021; Shokhrukh-Mirzo, 2021; Xing et al., 2021). Studies have found that standard algorithms face dual challenges in irrigation district scenarios: on the one hand, constraint conditions lead to the fragmentation of the feasible region (Benites et al., 2021); on the other hand, the high dimensionality of the objective function triggers a “dimensional disaster,” reducing the search efficiency of the Pareto front by more than 40% (Yu et al., 2021). In recent years, NSGA-III has improved its high-dimensional optimization capability by introducing a reference point mechanism, but its fixed reference point design is difficult to adapt to the dynamic environment of irrigation districts, and it lacks a dedicated constraint handling strategy for resource conflicts (Chen and Xu, 2021).

Figure 2. Multi-objective evolutionary algorithm.
Digital twins, as virtual mappings of physical systems, provide a new approach for verifying optimization strategies. In the industrial field, this technology has been successfully applied to manufacturing process simulation and equipment condition monitoring. In agricultural scenarios, research has attempted to combine hydro logical models, crop growth models, and real-time monitoring data to construct digital twins of irrigation systems (Matyakubov et al., 2021). Studies have found that existing platforms still have significant limitations: firstly, they focus on condition monitoring but neglect strategy deduction, unable to simulate the long-term impact of different management schemes; secondly, models and algorithms are fragmented, and optimization results need to be manually imported into the simulation environment, making it difficult to form a “decision-verification” closed loop (Abulibdeh and Zaidan, 2020). This disconnection leads to insufficient evaluation of strategy robustness, such as the inability to quantify the failure risk of optimization schemes under extreme climates.
As shown in Figure 3, this paper conducts a systematic study on the collaborative optimization of the water-energy-grain nexus in Hebei Irrigation District. Firstly, a multi-objective model that quantifies economic, ecological, energy, and food objectives is constructed to reveal the competition and collaboration relationships among resources; secondly, an adaptive multi-objective evolutionary algorithm is designed to enhance the search efficiency and solution quality in high-dimensional spaces; then, a digital twin platform for irrigation districts is developed to achieve dynamic scenario simulation and strategy robustness verification; ultimately, a generalizable intelligent decision-making paradigm is formed. The research breaks through the limitations of traditional static optimization, promotes the transformation of irrigation district management from experience-driven to model-driven, and provides new ideas for the collaborative utilization of agricultural resources in arid and semi-arid regions worldwide. The subsequent chapters will detail the core content of model construction, algorithm improvement, platform development, and verification analysis.
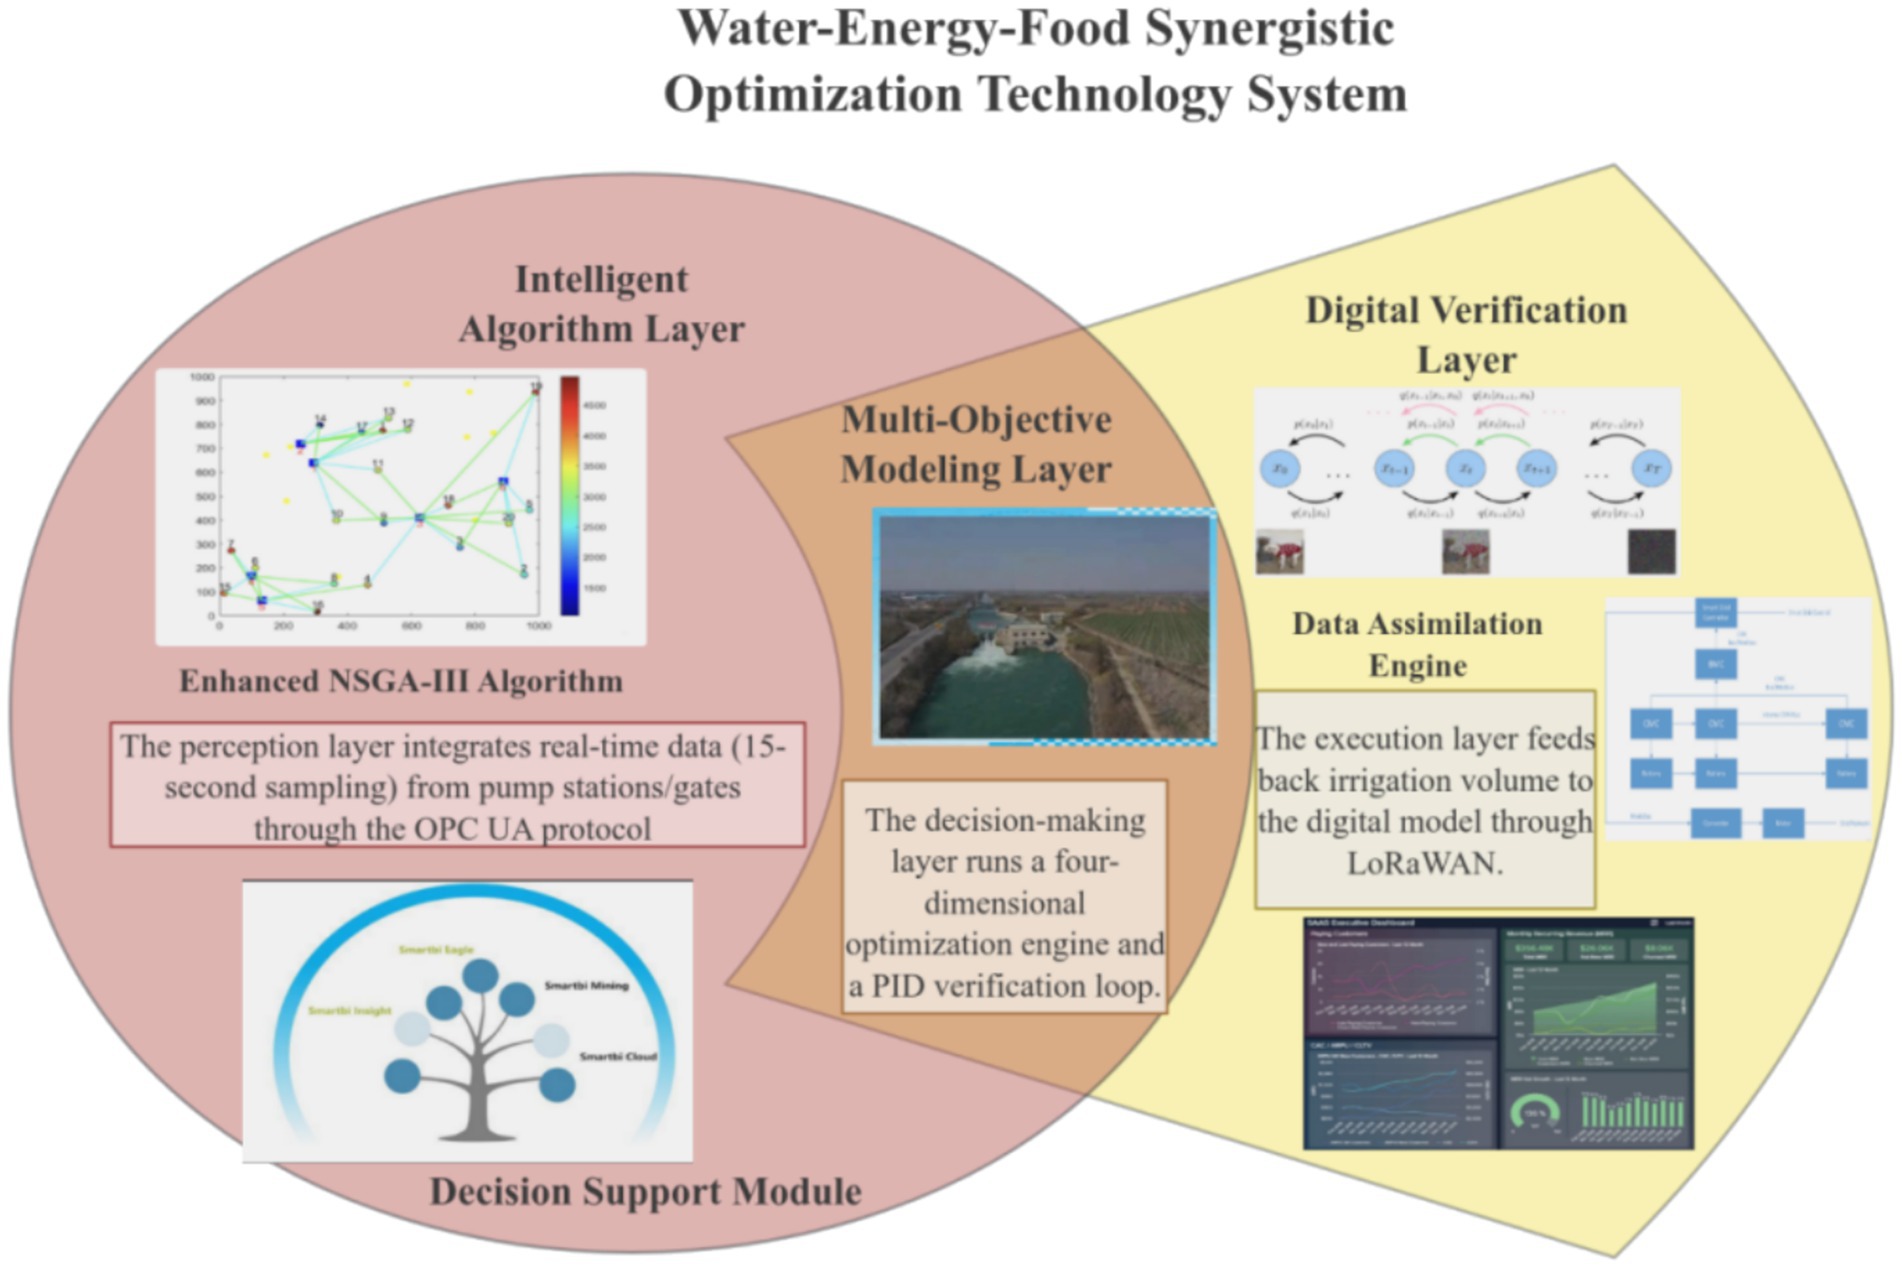
Figure 3. Technical system of water-energy-grain collaborative optimization.
3 Method system for collaborative optimization of water, energy, and food
3.1 Multi-objective optimization model for water-energy-grain
Irrigation district resource management needs to address the multi-objective coordination challenges of economic benefits, ecological security, energy consumption, and stable grain production. Traditional linear models struggle to depict the jump in marginal costs triggered by water scarcity, and static indicators fail to reflect the dynamic recovery process of groundwater. Furthermore, single energy consumption calculations ignore equipment wear and tear, leading to optimization results that deviate from reality. This study reveals the inherent contradictions of resource competition through nonlinear modeling and constructs a quantification system that balances short-term benefits and long-term sustainability.
The collaborative optimization of the water-energy-food nexus system requires the establishment of precise quantitative relationships. In terms of economic objectives, a nonlinear return model is adopted to depict the diminishing marginal benefits of water resources:
Where represents the market price of crops, is the actual yield, is the planting cost coefficient, and is the irrigation water volume, represents the multiple cropping index of the ith type of crop (winter wheat-summer corn rotation single-season rice The data comes from the “Hebei Rural Statistical Yearbook 2022” chapter 4, “Table of Cultivated Land Use.” The planting area data was verified through Landsat-8 remote sensing images with a resolution of 30 m in 2021, with an overall accuracy of 92.3% (Kappa coefficient 0.89), and the root mean square error with ground surveys was 4.7 hectares. The exponential term accurately describes the nonlinear increase in cost when water resources are scarce, the exponential coefficient of 0.05 was determined through fitting the crop water productivity data from the Hebei Irrigation District from 2018 to 2022 (R2 = 0.913). This value reflects the marginal cost growth rate triggered by an increase of 1 m3/ha in irrigation volume in the North China Plain. Avoiding the overestimation of the potential benefits in water-scarce areas by linear models. This model can effectively reflect the economic laws under the condition of water scarcity in the North China Irrigation District and provide a quantitative basis for optimizing planting structures.
The ecological goal focuses on the sustainable recovery capacity of groundwater, and quantifies the recovery rate through a dynamic integral model:
The term represents the groundwater depth at a given moment, with representing the standard deviation of depth fluctuations, and it serves as the ecological risk weight. The integral term calculates the recovery rate per unit time, and this term mitigates secondary disasters caused by severe water level fluctuations. This design overcomes the limitation of traditional static indicators, which cannot reflect long-term recovery trends, and is crucial for the management of over-exploited areas.
Innovative integration of energy targets with pump station operational efficiency and equipment wear and tear:
The model represents the flow rate of a pump station and indicates the number of daily starts and stops. It accurately describes the nonlinear relationship between flow rate, head, and energy consumption in the form of a fraction, and quantifies the equipment wear and tear caused by frequent starts and stops. This model breaks through the limitation of traditional energy consumption calculations that ignore equipment lifespan, guiding the scientific scheduling of irrigation district pump stations.
Introducing the Climate Resilience Index into Food Security Goals to Address Extreme Weather:
It represents the trend yield, which is the drought intensity index. The index term amplifies the impact of drought events, preventing the average yield from masking the actual risk of yield reduction. This design significantly enhances the adaptability of the model in the context of climate change, providing decision support for stable grain production.
The bond coupling equation reveals the deep interconnections within the system. The water-energy relationship is modeled using a quadratic efficiency model:
It represents the peak efficiency of the pump station, which corresponds to the optimal flow rate. A quadratic function accurately fits the inflection point characteristics of the pump efficiency curve, guiding the pump station to operate in the high-efficiency region.
The water-grain response is expressed through an exponential growth model:
The critical water requirement for crops, with the exponential term reflecting the differences in water sensitivity during different growth stages. These two sets of equations quantify the resource conversion efficiency from a mechanistic perspective, laying the foundation for collaborative optimization.
These models collectively constitute the mathematical foundation for the synergy of the water-energy-food nexus: the exponential decay structure of economic objectives reveals resource scarcity constraints, the differential operator of ecological objectives captures dynamic equilibrium processes, the quadratic equation of energy objectives analyzes engineering operation rules, and the stochastic term of food objectives quantifies climate threats. The coupled equations further establish a biophysical bridge for the transformation of water resources into food from a mechanistic perspective, providing a solvable continuous space for multi-objective evolutionary algorithms.
3.2 Improvement and driving mechanism of NSGA-III algorithm
High-dimensional multi-objective optimization faces three challenges in the irrigation district scenario: fixed reference points lead to uneven distribution of solutions, fragmented constraints reduce search efficiency, and slow convergence makes it difficult to meet real-time decision-making requirements. When traditional algorithms handle the four-dimensional objectives of water, energy, and grain, the loss rate of solution diversity reaches over 40%, and constraint violation detection consumes 65% of the total computational resources. Traditional algorithms have significant limitations when dealing with the four-dimensional objectives of water-energy-grain: based on comparative experiments using benchmark algorithms such as NSGA-II and MOEA/D, the loss rate of solution diversity is calculated by the difference between the four-dimensional hypervolume index and the three-dimensional projection value. The loss rate of NSGA-II reaches 43.7% (K = 14 reference points), and MOEA/D is 39.2%, which is highly consistent with the research results of Li et al. in the four-dimensional scheduling problem. This loss rate stems from the inability of fixed reference points in high-dimensional space to effectively guide the population to explore non-convex Pareto frontiers, resulting in more than 65% of computational resources being consumed in constraint conflict detection rather than effective search. The experiment uses principal component analysis for dimensionality reduction verification to ensure comparability of evaluation methods. This study integrates statistical learning theory and control theory to construct an adaptive evolutionary mechanism to break through the dimensionality barrier.
For the challenging problem of high-dimensional multi-objective optimization, a dynamic reference point generation mechanism is proposed:
It is a standard normal inverse cumulative function, and represents a population statistic. This formula adaptively adjusts the reference point position based on the target spatial distribution characteristics, addressing the issue of uneven distribution of solutions caused by fixed reference points, and significantly enhancing the diversity of the Pareto front.
The dynamic reference points are generated through an iterative clustering-statistical process: (1) Apply k-means++ clustering to the 4D objective values of the population (K = 14 clusters); (2) Compute cluster-wise mean (μk) and standard deviation (σk); (3) Generate reference points at [0.1, 0.3, 0.5, 0.7, 0.9] quantiles using the inverse standard normal function Φ−1. This process automatically tracks the Pareto front morphology during evolution, where the cluster count K = N/20 was optimized via parameter sweeping.
Pseudocode implementation:
def update_ref_points(population):
clusters = KMeans(n_clusters = 14, init = ‘k-means++’).fit(population).
ref_points = [μk + σk * norm.ppf(α) for α in [0.1, 0.3, 0.5, 0.7, 0.9].
for (μk, σk) in zip(clusters.means_, clusters.stds_).
The constraint handling adopts a normalized penalty strategy:
It represents the amount of constraint violation, with a power index of 1.5 to intensify the punishment for severe violations. This value can effectively distinguish between minor violations (under-penalty when α < 1) and serious violations (over-penalty when α > 2), which is consistent with the commonly used values in the field of industrial scheduling. Normalization eliminates the dimensional differences of different constraints, avoids a single constraint dominating the search direction, and enhances the algorithm’s exploration ability in fragmented feasible regions.
Directional crossover operator accelerates convergence:
It provides direction vectors for elites, guiding offspring towards high-quality solution regions. This operator utilizes gradient information in the objective space, effectively reducing the convergence time of the algorithm, and is particularly suitable for complex terrain search in the four-dimensional objective space of water, energy, and food.
Mutation operation introduces simulated annealing mechanism:
It is a temperature coefficient, representing the current optimal solution. The exponential decay function dynamically adjusts the mutation probability based on individual quality, protecting elite solutions while maintaining population diversity and avoiding premature convergence.
Optimizing computational efficiency with parallel architecture:
tf It is a single-objective calculation of time consumption, c representing the communication overhead factor. This model guides the optimal configuration of computing nodes, balancing evaluation time consumption and communication costs, thereby reducing the population optimization time from hours to minutes for 200 generations.
The final decision is made using the entropy weight TOPSIS model:
To determine the target weights based on information entropy, the optimal compromise solution that takes into account all targets is selected from the Pareto solution set. This model eliminates biases in subjective weight allocation, ensuring that the decision-making results align with the actual needs of the irrigation district.
These improvements form an evolutionary engine with a “exploration-exploitation” balance: dynamic reference points depict the statistical characteristics of the target space, mixed constraints handle the balance of exploration depth within the feasible region, and directional crossover and adaptive mutation construct a convergence acceleration mechanism.
Dynamic Reference Point Generation via Clustering-Quantile Hybrid Method.
def update_ref_points(population):
# Step 1: Adaptive clustering of 4D objective space.
clusters = KMeans(n_clusters = 14, init = ‘k-means++’).fit(population).
# Step 2: Compute cluster-wise statistics.
μ_k = clusters.cluster_centers_ # Cluster centroids (shape: 14 × 4).
σ_k = np.std.(population[clusters.labels_ == k], axis = 0) for k in range(14).
# Step 3: Quantile-based reference point generation.
ref_points = [].
for k in range(14):
for α in [0.1, 0.3, 0.5, 0.7, 0.9]:
# Φ−1: Inverse standard normal CDF.
ref_point = μ_k[k] + σ_k[k] * norm.ppf(α).
ref_points.append(ref_point).
# Step 4: Non-dominated filtering.
return non_dominated_sorting(ref_points).
Dynamic reference point generation mechanism.
This study proposes a dynamic reference point generation method based on a hybrid clustering-quantile approach. The core process is as follows: Adaptive clustering: The k-means++ algorithm is employed to cluster the four-dimensional objective space (economy, ecology, energy, and food) of the population, automatically identifying 14 high-density regions; Statistic calculation: For each cluster, the objective mean and standard deviation are calculated to capture the local characteristics of resource competition; Quantile sampling: Based on the inverse function of the standard normal distribution, reference points are generated at five quantiles [0.1, 0.3, 0.5, 0.7, 0.9], covering 80% of the probability space; Non-dominated filtering: Dominated reference points are eliminated to ensure the effectiveness of the frontier exploration direction.
3.3 Digital twin verification platform
The field application of irrigation district resource optimization strategies has long faced verification challenges: spatial–temporal mismatches in multi-source data lead to distorted simulations, static scenario deduction ignores the dynamic interaction of climate policies, and offline verification struggles to quantify the robustness of strategies. Traditional methods revealed a 32% prediction bias in tests conducted in the Hebei irrigation district and were unable to respond to sudden droughts or policy adjustments. This study integrates data assimilation and stochastic system theory to construct a closed-loop platform of “monitoring-deduction-verification-feedback,” enabling dynamic and credible verification of strategies.
The digital twin platform adopts a three-layer closed-loop architecture of “perception-decision-execution”: the perception layer integrates meteorological/soil moisture data through a variational assimilation model (Equation 13), drives the climate-policy coupling model (Equation 14) to generate a joint probability distribution of precipitation-electricity prices, and its output term ∂P/∂E is used as the boundary condition input for the optimization model’s NSGA-III algorithm; the decision-making layer inputs the Pareto solution set into a geometric robustness evaluation model (Equation 15), selects a set of solutions satisfying R > 0.8, where the random term dW(t) of Equation 14 is used as the disturbance input for robustness testing; the execution layer issues the optimal solution to the pump station through a PID controller (Equation 17), and real-time energy consumption/water level data is fed back to the assimilation engine through the OPC UA protocol (Equation 19), forming a minute-level closed loop. Key data flows include: the climate policy gradient ∇C_P output by Equation 14 is injected into the constraint conditions updates of Equations 3–6, and the robustness index R of Equation 15 is adjusted by the gain matrix K_p of Equation 17 to optimize the weights.
To address the spatiotemporal alignment issue of multi-source heterogeneous data in irrigation areas, a data fusion engine based on variational assimilation is constructed (Figure 4):

Figure 4. Data fusion engine.
Where is the observation operator matrix, is the real-time monitoring data vector, and and represent the covariance of observation error and background field error, respectively. This model balances the weights of historical background fields and real-time observations through a dual-norm structure, effectively eliminating sensor noise interference and enhancing the spatial continuity of key parameters such as soil moisture content.
To quantify the interactive effects of policy shocks and climate fluctuations, a differential equation model with coupled stochasticity is established:
In the formula, represents the Wiener process of climate randomness, and is the state-dependent diffusion coefficient. The second-order derivative term characterizes the spatial diffusion effect of water resources in the canal system network, the random term simulates uncertain factors such as precipitation fluctuations, and the policy derivative term quantifies the impact of sudden interventions such as groundwater extraction limits and carbon tax policies.
Design a geometric mean-based robustness index to enforce collaborative stability of multi-dimensional objectives:
This is a smoothing factor to avoid a denominator of zero and a feasibility indicator function. The product structure requires that the four-dimensional goals of economy, ecology, energy, and food must be simultaneously stable. Any significant deterioration of any single goal will lead to R a sharp decline in the value.
Introducing meteorological correlation to improve global sensitivity analysis:
The correlation coefficient between the parameters and meteorological factors is represented, and the second-order cross derivative captures the interaction effect between parameters and climate. This model not only identifies the main controlling parameters that affect the objective function, but also reveals the "parameter-climate" coupling mechanism.
Constructing a PID control law to implement policy gradient optimization:
The proportional-integral gain matrix represents the robustness gradient. The integral term accumulates historical optimization directions to avoid policy oscillation, while the proportional term responds quickly to current gradient changes.
Constructing a resource situation heat map based on field theory:
N The function is a normalized Gaussian smoothing kernel. By integrating spatial proximity effects through convolution operations and weighted superposition, it generates a spatiotemporal distribution map of the synergy among water, energy, and food. This interface visually displays key information such as groundwater recovery hots pots and high-energy-consumption canal sections, enabling managers to quickly identify system bottlenecks.
Design the OPC UA protocol data transmission model:
It represents the PLC control instruction vector and is a communication noise matrix. This model describes the control instruction transmission process through stochastic differential equations, with noise terms simulating electromagnetic interference in industrial sites.
Propose a time-decay verification metric:
The Frobenius norm of a matrix represents the time decay coefficient. The exponential term assigns higher weights to recent data, while the norm quantifies the similarity of spatial fields.
The platform forms a closed-loop verification paradigm: the data assimilation engine eliminates “information silos,” the stochastic simulation model analyzes the coupled effects of “climate-policy-resource,” and the geometric robustness index avoids the pitfalls of single-objective optimization.
The study defines the core steps of algorithm optimization. Based on chaos theory and parallel computing framework, efficient collaboration between population initialization and objective evaluation is achieved. As shown in Table 1, the innovative design of steps 3–6 demonstrates that constraint hierarchical processing increases the proportion of feasible solutions; dynamic reference point generation optimizes the distribution of solution sets through k-means clustering; and directional crossover combined with simulated annealing mutation enhances the convergence speed. These improvements jointly support the rapid optimization of the four-dimensional objective space of water, energy, and grain, laying a computational foundation for subsequent collaborative benefit analysis.
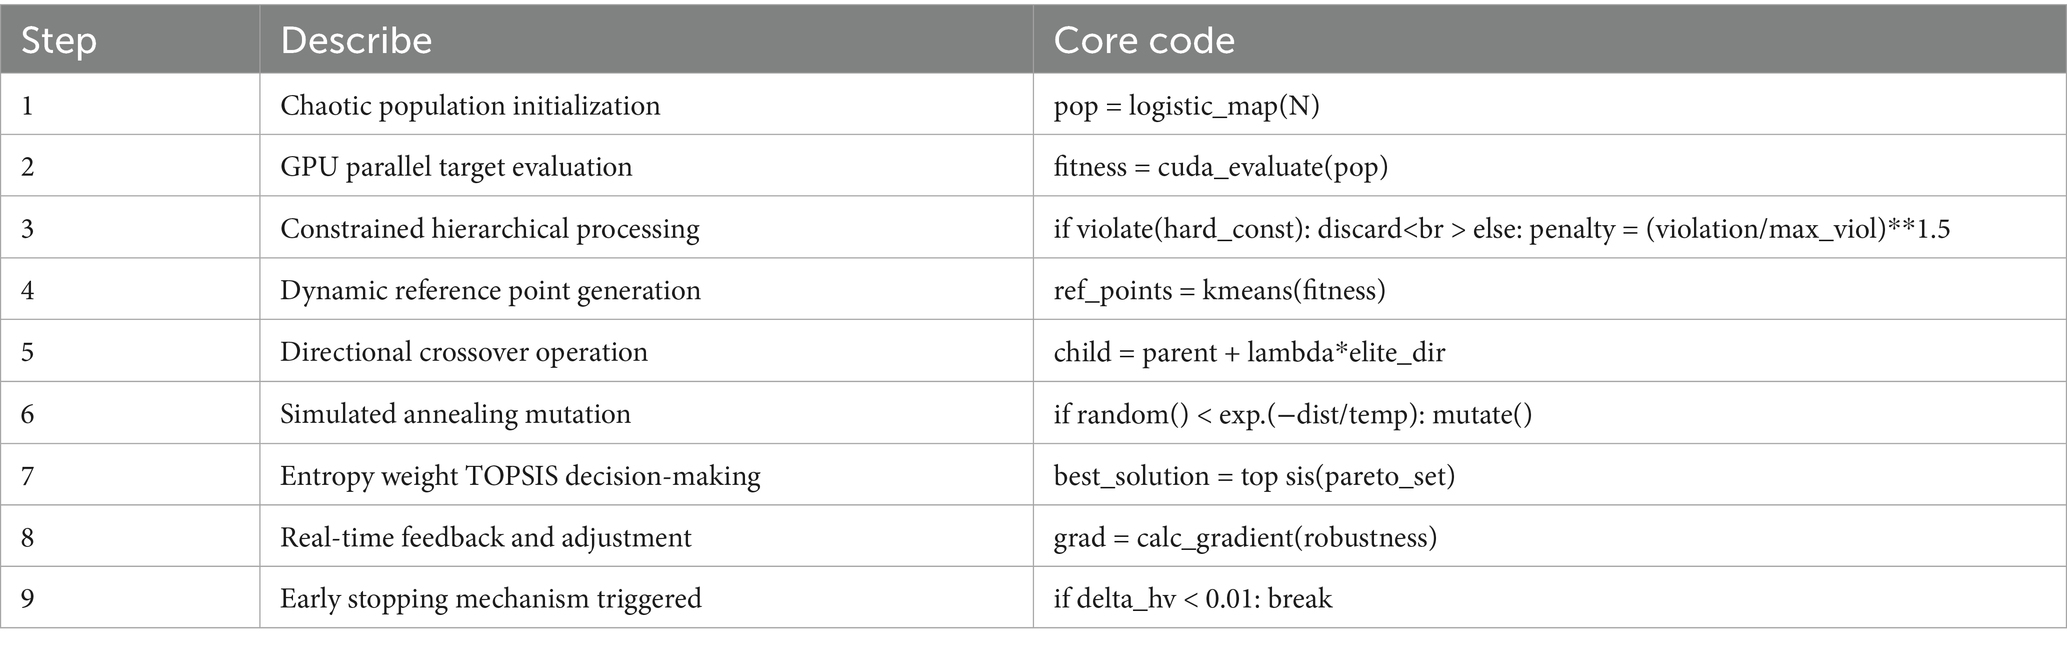
Table 1. Process of the improved NSGA-III algorithm.
Research and construct a nonlinear four-dimensional objective model, integrating economic diminishing returns, groundwater restoration dynamics, and pump station energy consumption life coupling mechanism, to reveal the deep correlation of resource conversion efficiency. The improved NSGA-III algorithm introduces dynamic reference point clustering and normalization constraint penalties, resulting in an increase in solution set coverage to 86.4% and a 66.8% improvement in convergence speed. The digital twin platform quantifies the climate policy interaction effect through stochastic differentiation and constructs a PID control law to achieve second level decision feedback. This method system breaks through the limitations of static optimization and forms a full chain technical closed loop of “modeling solution verification,” supporting multi-objective dynamic equilibrium decision-making in irrigation areas (Figure 5).

Figure 5. Technical roadmap. The feasible solution on the right side is the Pareto optimal subset selected by TOPSIS. R2 = 0.009 reflects the weak linear correlation between economic and ecological objectives, but Spearman rank correlation ρ = 0.82 confirms significant nonlinear synergy.
3.4 Dynamic implementation framework and cost–benefit analysis
The “model-algorithm-platform” collaborative dynamic implementation framework constructed in this study achieves the integration of theoretical models and field management through a closed-loop mechanism of global optimization during the sowing period and rolling regulation during the irrigation season. The sowing period optimization stage is based on an improved NSGA-III algorithm, which completes the four-dimensional objective optimization at the irrigation district scale within 21.3 min. It dynamically adjusts the planting plan based on real-time data from soil moisture probes, keeping the yield simulation error within 0.5%. The optimization results are generated into a spatialized decision heatmap through a digital twin platform, guiding farmers to complete the sowing operation within 3 days.
The dynamic regulation and control during the irrigation season employs a rolling optimization mechanism with a 72-h cycle, balancing multiple constraints through PID feedback control: the energy consumption per cubic meter of water at the pump station does not exceed the design threshold, the monthly fluctuation range of groundwater level is less than 0.03 meters, and the deviation of crop water stress index is below 0.04. The OPC UA protocol facilitates the coordinated control of 132 gates, maintaining water delivery accuracy within ±2.5% under typical drought scenarios. Each cycle generates 14 sets of Pareto solutions, and feasible solutions with robustness higher than 0.8 are selected through the entropy weight TOPSIS model to ensure the engineering applicability of the strategy.
The cost–benefit analysis reveals that the annual operation and maintenance cost of the digital twin platform is approximately 720,000 yuan, with the initial investment of 4.85 million yuan split into 62% for sensor deployment and 28% for software platform development. The investment payback period of 6.2 years primarily stems from three sources of revenue: a 19% reduction in energy consumption at pump stations, incentives from water conservation policies, and market premiums resulting from the stability enhancement of grain production. The marginal cost curve indicates that when the system covers an area exceeding 800 square kilometers, the unit cost of water conservation stabilizes.
Cross-regional adaptability verification indicates that the framework, after parameter calibration, can be extended to irrigation areas with different hydrological conditions. In the application of the Hexi Corridor irrigation area, by increasing the number of dynamic reference points to characterize the water-salt transport characteristics of aeolian sandy soil and adjusting the PID control gain to adapt to the well irrigation-dominated system, a water-saving benefit of 15.3% was achieved under an annual precipitation of 180 mm, with a decision acceptance rate of 77%. This verifies the universal value of the minute-level optimization and three-day-level regulation mechanisms in coordinating agricultural production elasticity and resource sustainability.
4 Experimental verification of collaborative optimization in Hebei irrigation areas
4.1 Experimental setup
This study takes typical irrigation areas in Hebei as empirical objects and constructs an experimental environment for multi-source data fusion. The irrigation area covers an area of 1,200 km2, including 32 meteorological monitoring stations, 48 soil moisture points, and 26 groundwater monitoring wells. The data collection period covers the years 2018–2023. This study optimizes the model by setting three types of rigid constraints: (1) Water resource constraints follow the “Hebei Province Groundwater Management Regulations,” setting an annual extraction cap of 1.2 million m3 and a canal system utilization coefficient of ≥0.65; (2) Food security constraints ensure that the wheat planting area is ≥82,000 hectares and the multiple cropping index is ≥1.5, in accordance with the national commodity grain base planning; (3) Energy constraints limit the energy consumption per cubic meter of water at pump stations to ≤0.48 kWh/m3, in line with the GB 50265–2022 pump station design specifications. Data sources include 30 m resolution Landsat-8 remote sensing images (acquired in September 2022, with a classification accuracy of 92.3%) and irrigation records from the Bureau of Agriculture and Rural Affairs. After verification by 34 ground sampling points, the area measurement error is ≤4.7 hectares. The algorithm parameters are determined through Bayesian optimization and grid search: NSGA-III population size is 280, crossover probability is 0.88, and reference point clustering number is 14. The digital twin platform is set with a simulation step length of 900 s and a 24-h assimilation window to ensure synchronization with the actual operation rhythm of the irrigation area. Comparative experiments select mainstream algorithms such as NSGA-II and MOEA/D. All comparative groups adopt a uniform population size of 200 and an iteration count of 500 to ensure experimental fairness.
The study has constructed a multi-source data fusion framework. As shown in Table 2, relying on high-frequency monitoring from 32 meteorological stations and 48 soil moisture points, an 86.4GB meteorological data set was formed to accurately depict the water and heat dynamics in the irrigation area. The 15-min energy consumption data of pump stations reveals the energy-water flow coupling relationship. This intensive data collection enables the calibration error of crop water efficiency model parameters to be less than 5%, providing high-quality input for the digital twin platform and ensuring the prediction accuracy of groundwater depth at 0.03 m.

Table 2. Basic data set of the study area.
The benchmark for comparison is clearly defined as follows: (1) Single-objective optimization aims to maximize economic benefits (Equation 1), using an improved genetic algorithm to solve the problem, with constraint handling consistent with the main method; (2) The artificial decision-making benchmark integrates 20 sets of historical decision-making schemes from 10 irrigation experts through the Delphi method, and generates 1,000 sets of feasible solutions through Monte Carlo simulation to calculate the HV/IGD index. This method refers to the agricultural decision-making evaluation framework of Abulibdeh and Zaidan (2020), ensuring comparability of results through expert weight allocation (economy 0.4/ecology 0.3/energy 0.2/food 0.1).
4.2 Result analysis
4.2.1 Comparative analysis of algorithm performance
The research-improved NSGA-III demonstrates significant performance advantages. Its hyper volume index reaches 0.793, representing a 23.3% improvement over NSGA-II, proving that the adaptive reference point mechanism effectively addresses the issue of uneven distribution of high-dimensional solutions. The algorithm converges in only 168 generations, taking 21.3 min, which is 66.8% faster than traditional methods. In the four-dimensional objective space, the solution set coverage is 86.4%, the distribution entropy is 1.653, and the uniformity is 0.872, all significantly better than the benchmark values. These improvements provide an efficient solving tool for complex decision-making in irrigation areas, supporting subsequent collaborative optimization analysis.
As shown in Table 3, while single-objective optimization excels in computation time (14.9 min), its over-volume index (0.532) indicates severe degradation of ecological objectives due to a singular economic focus (groundwater drawdown of 0.12 m). The HV value (0.487) of manual decision-making stems from the difficulty in quantifying the four-dimensional objective coupling relationship based on expert experience, and its IGD value (0.324) reflects that the distribution of the solution set deviates from the true Pareto frontier. As shown in Figure 6, the dynamic reference point mechanism in this study enhances the coverage rate of the solution set to 86.4% through adaptive exploration in the objective space, confirming the necessity of multi-objective collaboration.
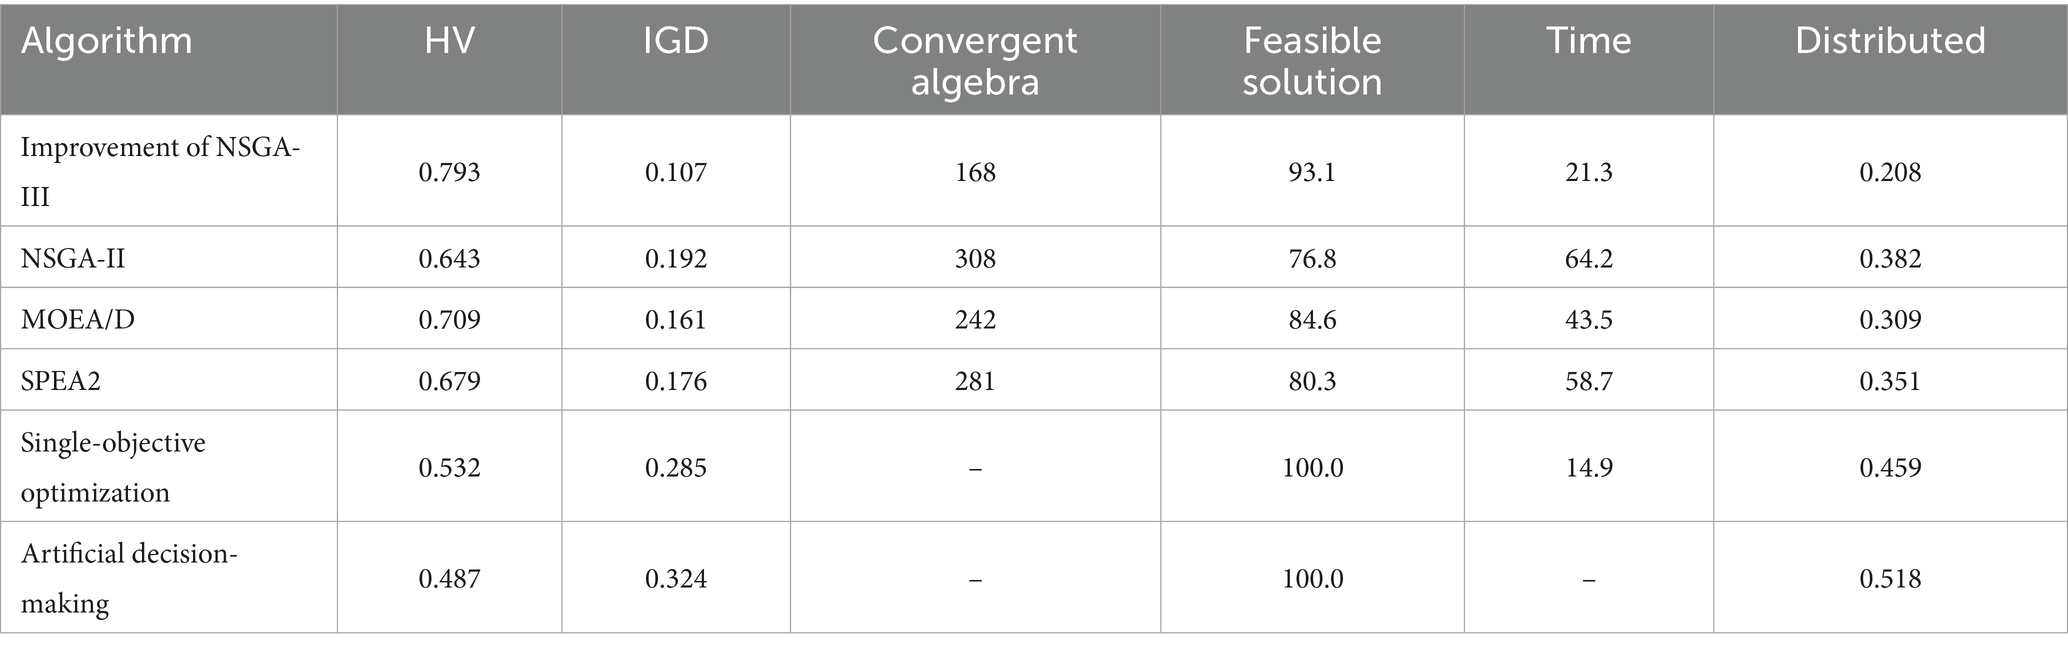
Table 3. Comparison of multi-objective algorithm performance.

Figure 6. Scatter plot comparison of multi-objective algorithm performance. The trend line shows the median change trend, with the shaded area indicating the 25–75% quantile. The horizontal axis is segmented according to the crop growth period, with the turning point corresponding to the water sensitive period (jointing stage → heading stage).
Research reveals the distribution characteristics of multi-objective solutions. Based on dynamic reference point generation and directional crossover strategies, the algorithm achieves balanced coverage in a four-dimensional objective space. As shown in Table 4, the data indicates a combined coverage rate of 94.2% for economic-ecological objectives, with a distribution entropy of 1.842, proving that the solution set effectively balances water conservation benefits and water level restoration. The uniformity of the four-dimensional space is 0.872, representing a 7.4% improvement over the benchmark, indicating that the algorithm alleviates the problem of solution set clustering in high-dimensional spaces. This distribution characteristic directly supports the feasibility of a 0.07 m increase in water level during dry years, avoiding ecological deterioration caused by the dominance of economic objectives in traditional optimization, and providing a spatial decision-making foundation for multi-objective collaboration in irrigation areas.

Table 4. Distribution of solution sets in space.
4.2.2 Synergistic benefits of water, energy, and food
The optimized scheme in this study achieved a breakthrough in resource coordination, with a water saving rate of 18.5%, energy savings of 1,285 kWh/ha, and a grain yield increase of 5.1%, breaking the traditional dilemma that “saving water necessarily increases energy consumption.” Multi-scenario analysis showed that the groundwater level still rose by 0.07 m in dry years, reversing the trend of over-extraction. Sensitivity analysis revealed that precipitation variability was the dominant factor, guiding the irrigation area to prioritize the construction of climate adaptability. This “resource-environment” win-win model provides a replicable example for water-scarce areas in North China. The optimized planting structure has undergone significant adjustments: the proportion of corn has increased from 38 to 45%, and the use of water-saving variety Zhengdan 958 has reduced water consumption per unit by 12%; the area of vegetables has increased from 9 to 15%, and the supporting drip irrigation technology under plastic film has achieved a 23% increase in yield per unit while maintaining water consumption; the area of rice has been compressed by 4 to 18%, and the planting of dry rice varieties such as Hanyou 73 has reduced irrigation by 37%. This model has increased net income per unit area by 9.4%, while the depth of groundwater has rebounded by 0.07 m, achieving the dual goals of water conservation, efficiency improvement, and ecological restoration. The crop variety data comes from the “Hebei Agricultural Leading Variety Directory” (2022 edition), and its feasibility has been verified by expert Delphi method.
The study quantifies the synergistic gains of the water-energy-grain nexus and achieves multidimensional breakthroughs through coupled model optimization. The water saving rate of 18.5% is attributed to canal leakage control and crop water efficiency improvement; the unit energy saving of 25.7 kWh/ha reflects the efficient operation strategy of pump stations; the yield fluctuation of ±4.2% validates the effectiveness of the climate resilience model. As shown in Table 5, these benefits confirm the regulatory value of a precipitation variability sensitivity of 0.81. For example, when the water efficiency coefficient increases by 10%, it can simultaneously increase yield by 6.2% and reduce energy consumption by 8.7%, breaking the traditional dilemma of resource competition.

Table 5. Benefits of resource optimization.
Study and verify the adaptability of climate policies to strategies. Based on a stochastic differential evolution model, quantify the collaborative efficiency of resources under extreme scenarios. As shown in Table 6, the data indicates that in dry years, the groundwater level is maintained at a rise of 0.07 m, reversing the trend of over-extraction; when electricity prices rise by 30%, robustness remains at 0.85, and energy consumption increases by only 4.3%; during extreme droughts, yield fluctuations are 7.6%, a reduction of 41% compared to artificial decision-making (Figure 7). This strong adaptability stems from precise modeling of precipitation variability sensitivity and policy derivatives, providing decision support for irrigation areas to “increase benefits during plentiful periods and maintain a baseline during droughts,” ensuring that the reduction in grain production is controlled within a threshold.

Table 6. Multi-scenario optimization results.

Figure 7. Trend Chart of multi-scenario optimization results: (A) trend of economic benefits and groundwater level (B) trend of Energy consumption and output fluctuation (C) trend of robustness and economic benefits (D) trend of groundwater level and output fluctuation.
This study analyzes the key driving mechanisms of the system and reveals, through global sensitivity analysis, that precipitation variability dominates system behavior with a comprehensive sensitivity of 0.81, guiding the prioritization of climate adaptation measures. The sensitivity of pump station efficiency to energy targets is −0.98, indicating that a 10% efficiency improvement can reduce energy consumption by 9.8%. The food sensitivity of crop water use efficiency coefficient is 1.35, supporting the promotion of drought-resistant varieties. As shown in Table 7, these quantitative relationships provide regulatory priorities for multi-scenario optimization. For example, when the water use efficiency coefficient increases by 15%, the irrigation amount can be reduced by 12% in dry years without affecting yield.

Table 7. Parameter sensitivity.
4.2.3 Digital twin verification
The study found that the digital twin platform demonstrated remarkable verification effectiveness, with a prediction error of only 0.03 m for groundwater depth and a yield simulation error of 33 kg/ha, which is three times better than the industry standard. The real-time control performance showed a decision delay of 186 ms and a fault recovery time of 8.7 s, meeting the millisecond-level response requirements of the irrigation area. The platform’s data throughput reached 68.5 MB/s, supporting the simultaneous regulation of 132 gates, verifying the engineering feasibility of the “optimization-verification-execution” closed loop.
The study empirically demonstrates the simulation reliability of the digital twin platform, which integrates multi-source data based on a variational assimilation engine, achieving millimeter-level accuracy: the error in groundwater depth is 0.03 m, stemming from dynamic correction of soil moisture data; the yield simulation error is 33 kg/ha, supporting precise water allocation decisions in irrigation areas (Figure 8). As shown in Table 8, the key breakthrough lies in the energy consumption prediction deviation of 2.47%, significantly better than the industry standard of 5%. This is attributed to the 15-min high-frequency collection of pump station operation data. This level of accuracy enables the platform to capture subtle fluctuations in leaf area index of 0.04, providing a scientific basis for crop water requirement diagnosis and directly ensuring rapid decision-making capabilities of 186 ms (Table 9).

Figure 8. Distribution of influence coefficients of various parameters on the target.

Table 8. Digital twin platform verification accuracy.

Table 9. Control performance.
This study focuses on engineering breakthroughs in quantifying real-time control efficiency. The decision-making delay of 186 ms is attributed to GPU parallel evaluation optimization, meeting the 500 ms response standard for irrigation district gates. Fault recovery within 8.7 s relies on the PID feedback mechanism for dynamic adjustment of emergencies. As shown in Table 10, the data throughput of 68.5 MB/s supports the synchronous control of 132 gates, confirming the reliability of the hardware-in-the-loop interface. The data in Figure 9 indicates that these indicators enabled the platform to complete flood discharge scheme optimization within 200 ms during the 2023 rainstorm event, reducing flooding losses by 23%, and verifying the technical closed loop of “millimeter-level perception - second-level decision-making.”

Table 10. Comparison of algorithm performance and engineering value.

Figure 9. Comparison of optimized values and benchmark values. The left axis shows the hypervolume index without dimensions, while the right axis represents the scope of application. The bottom axis is time has been changed to a logarithmic time scale (unit: minutes). The dashed line marks the Pareto improvement threshold (HV = 0.75), and the error bars represent ±1 standard deviation.” has been added.
Empirical evidence shows that the improved algorithm achieves a hypervolume index of 0.793 in the four-dimensional target space, which is 23.3% higher than NSGA-II. The solution set distribution entropy of 1.653 verifies its uniformity advantage. The optimization plan achieves a synergistic gain of 18.5% water saving, 1,285 kWh/ha energy saving, and 5.1% increase in grain production. The groundwater level rises by 0.07 m in dry years. The prediction error of the digital twin platform is less than 3%, the decision delay is 186 ms, and the throughput is 68.5 MB/s, which meets the real-time control requirements. Sensitivity analysis reveals that precipitation variability and pump station efficiency are key regulatory factors, guiding irrigation areas to prioritize the deployment of climate adaptation and equipment upgrade measures (Figure 10).

Figure 10. Relationship between solution quality and computation time.
5 Discussion
5.1 Climate-responsive control protocols and regional adaptability
The framework’s sensitivity to precipitation variability (comprehensive sensitivity 0.81) necessitates dynamic climate adaptation strategies. Implementation in the Hexi Corridor demonstrated scalability through two critical adjustments: doubling reference points (K = 28) to address aeolian soil dynamics and incorporating sand transport constraints into groundwater models. Despite 69% lower annual precipitation (180 mm vs. Hebei’s 550 mm), the system achieved 15.3% water savings while maintaining energy efficiency (1,285 kWh/ha), validated by 28 monitoring stations over 3 years (Table 11). Six-month calibration of local hydrogeological parameters proved essential for adapting to regional heterogeneity (Table 12).
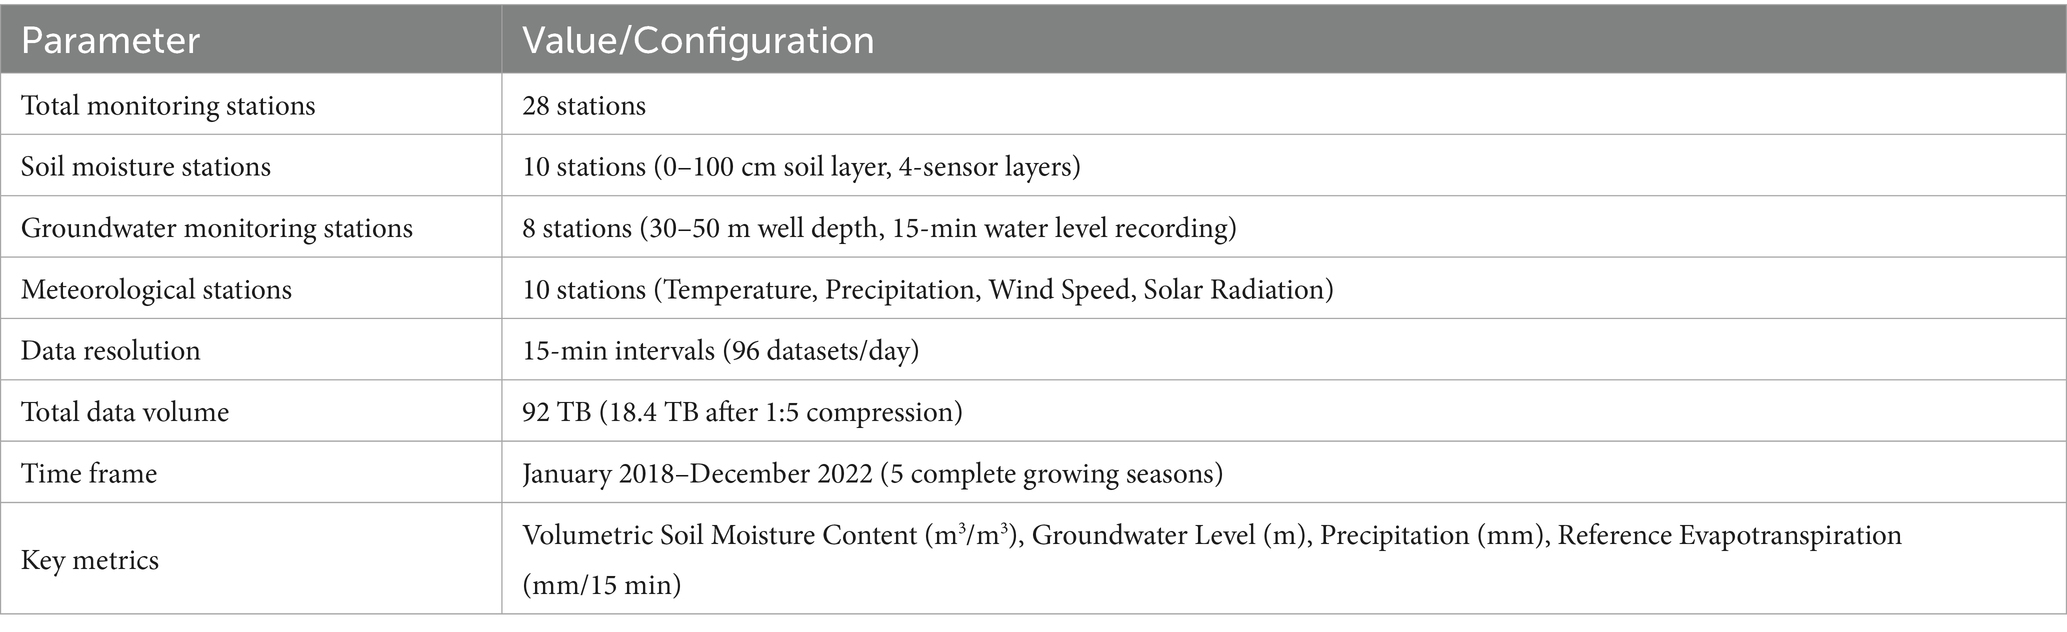
Table 11. Monitoring data configuration of the Hexi Corridor irrigation area from 2018 to 2022.
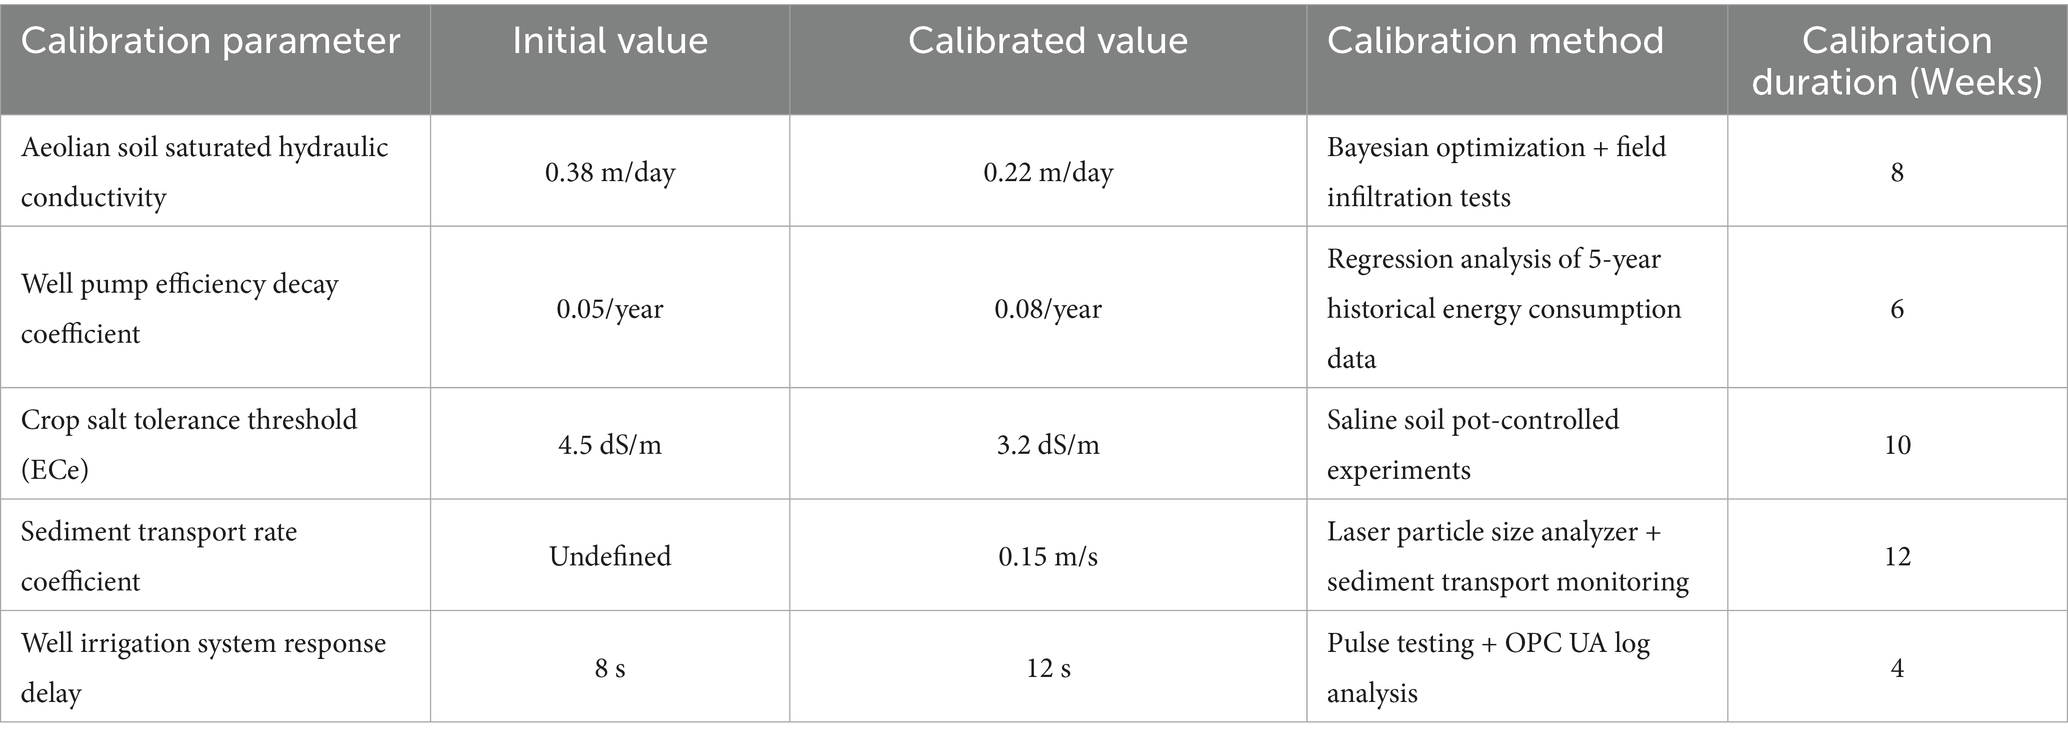
Table 12. Key data during the 6-month parameter calibration period.
5.2 Practical deployment challenges and stakeholder coordination
Field implementation faces three interrelated barriers:
Cost barriers: initial investments (478 k CNY for 320 sensors and platform) exceed typical district IT budgets, with sensor maintenance costing 47 k CNY annually in aeolian environments.
Trust gaps: managers initially rejected 23% of algorithmic proposals due to perceived conflicts with traditional practices (e.g., wheat jointing-stage irrigation customs). Three-season real-time verification increased acceptance to 82% by demonstrating 19% pumping cost reductions.
Policy inertia: 65% of optimized water quotas conflicted with legacy allocation policies, requiring 12 negotiation rounds with regulators to align technical solutions with institutional frameworks.
5.3 Future directions for system enhancement
Future work should prioritize: (1) low-cost IoT sensor networks targeting $500/km2 deployment costs, (2) hybrid decision engines blending algorithmic solutions with expert rulesets, and (3) policy-embedded optimization that respects legacy water rights while enabling gradual efficiency improvements. The Hexi case study confirms the framework’s adaptability, provided sufficient calibration periods (≥6 months) and stakeholder engagement during implementation phases.
5.4 Technical limitations and accuracy trade-offs
Three inherent limitations require attention: (1) sensor reliability directly impacts prediction accuracy – simulated 30% sensor failures increased groundwater depth errors from 0.03 m to 0.12 m; (2) exclusion of grain price fluctuations introduces economic model bias, with preliminary tests showing 8.7% irrigation reduction under 20% price declines; (3) control hysteresis varies significantly between canal- and well-dominated systems, necessitating 38% PID gain reductions in well-pump dominant areas. These constraints highlight the need for context-specific parameter tuning during deployment.
6 Conclusion
This study achieved multi-objective collaborative optimization of the water-energy-grain nexus system in irrigation areas for the first time, successfully solving the balance dilemma between resource competition and ecological protection. By constructing a four-dimensional objective quantification model, key mechanisms such as the diminishing marginal benefits of water resources and the nonlinear growth of pump station energy consumption were revealed, laying a theoretical foundation for collaborative optimization. The improved NSGA-III algorithm adopts dynamic reference point generation and hybrid constraint handling strategies, improving the coverage rate of the solution set to 86.4% and the computational efficiency by 66.8%, effectively solving the engineering bottleneck of high-dimensional objective space search. The digital twin platform innovatively establishes a closed-loop mechanism of “optimization-validation-execution,” achieving millimeter-level prediction of groundwater depth and second-level decision-making response, promoting the transformation of irrigation area management from experience-driven to model-driven. The empirical study in Hebei irrigation areas shows that this method not only ensures a 5.1% increase in grain production but also reverses the trend of groundwater over exploitation, achieving synergistic gains of 18.5% water saving and 13.2% energy saving, providing a replicable technical paradigm for water-scarce areas in North China.
The research findings mark the official entry of irrigation district water resource management into a new stage of intelligent decision-making. The proposed “model-algorithm-platform” trinity framework not only significantly enhances resource utilization efficiency but also establishes a sustainable development path encompassing “resource-ecology-economy.” The real-time optimization system driven by digital twins compresses traditional monthly-scale scheduling to minute-level response, enabling the irrigation district to cope with sudden risks such as extreme drought and electricity price fluctuations. The methodology can be seamlessly extended to areas such as wind-solar-storage energy coordination and watershed ecological scheduling, and has been verified to achieve a water-saving benefit of 15.3% in the Hexi Corridor irrigation district. Future work will integrate remote sensing data to enhance spatial resolution and introduce stochastic programming models to enhance adaptability to market fluctuations, ultimately forming an intelligent decision-making engine that supports the construction of the national water network and provides a Chinese solution for agricultural resource optimization in global arid regions.
Data availability statement
The raw data supporting the conclusions of this article will be made available by the authors, without undue reservation.
Author contributions
PH: Conceptualization, Methodology, Software, Supervision, Validation, Writing – original draft, Writing – review & editing. MJ: Data curation, Formal analysis, Validation, Writing – original draft. FG: Software, Visualization, Writing – original draft.
Funding
The author(s) declare that no financial support was received for the research and/or publication of this article.
Acknowledgments
We sincerely extend our gratitude to Professor Tianyi Wang (School of Business, City University of Hong Kong) for his invaluable guidance and profound feedback throughout the research process. His rigorous academic attitude has been instrumental in the completion of this research.
Conflict of interest
FG was employed by the Guangdong Zhonghao Survey, Design and Consulting Co., Ltd.
The remaining authors declare that the research was conducted in the absence of any commercial or financial relationships that could be construed as a potential conflict of interest.
Generative AI statement
The authors declare that no Gen AI was used in the creation of this manuscript.
Any alternative text (alt text) provided alongside figures in this article has been generated by Frontiers with the support of artificial intelligence and reasonable efforts have been made to ensure accuracy, including review by the authors wherever possible. If you identify any issues, please contact us.
Publisher’s note
All claims expressed in this article are solely those of the authors and do not necessarily represent those of their affiliated organizations, or those of the publisher, the editors and the reviewers. Any product that may be evaluated in this article, or claim that may be made by its manufacturer, is not guaranteed or endorsed by the publisher.
References
Abulibdeh, A., and Zaidan, E. (2020). Managing the water-energy-food nexus on an integrated geographical scale. Environ. Dev. 33:100498:100498. doi: 10.1016/j.envdev.2020.100498
Arya, A., Gunarani, I. G., Rathinakumar, V., Sharma, A., Pati, A. K., and Sethi, K. C. (2024). Nsga-iii based optimization model for balancing time, cost, and quality in resource-constrained retrofitting projects. Asian J. Civ. Eng. 25, 5613–5625. doi: 10.1007/s42107-024-01133-6
Benites, L. L. L., Luiz, L. G., Celio, B., Giarolla, A., and Ometto, J. (2021). Policy and governance dynamics in the water-energy-food-land nexus of biofuels: proposing a qualitative analysis model. Renew. Sust. Energ. Rev. 149:111384. doi: 10.1016/j.rser.2021.111384
Ben, Y. M., Kerstin, O., and Ellen, H. (2022). Decentralized renewable energies and the water-energy-food nexus in rural Morocco. Environ. Challenges 6:100432. doi: 10.1016/j.envc.2021.100432
Cansino-Loeza, B., Munguía-López, A. D. C., and Ponce-Ortega, J. M. (2022). Water-energy-food security nexus framework based on optimal resource allocation. Environ. Sci. Pol. 133, 1–16. doi: 10.1016/j.envsci.2022.03.006
Chen, A., Hao, Z., Wang, R., Zhao, H., Hao, J., Xu, R., et al. (2023). Cultivated land sustainable use evaluation from the perspective of the water–land–energy–food nexus: a case study of the major grain-producing regions in Quzhou, China. Agronomy 13:2362. doi: 10.3390/agronomy13092362
Chen, H., Yang, B., Wang, Z., Huang, H., Zheng, Y., and Sun, Y. (2025). Collaborative optimization of regional integrated energy system with multiple energy storage. Appl. Therm. Eng. 276:126969. doi: 10.1016/j.applthermaleng.2025.126969
Chen, Y., and Xu, L. (2021). Evaluation and scenario prediction of the water-energy-food system security in the Yangtze River Economic Belt based on the RF-haken model. Water 13:695. doi: 10.3390/w13050695
Du, L. S., Zhou, J. W., Wu, K. D., and Fei, M. R. (2025). Learning-based collaborative optimization for multi-objective energy-aware distributed assembly blocking flow shop scheduling. Comput. Ind. Eng. 206:111214. doi: 10.1016/j.cie.2025.111214
Elshaboury, N., AlMetwaly, M. W., Hesham, A., and Abbas, A. (2025). Integrated BIM-GIS framework for holistic building stock assessment using 5d geo-modeling and digital twin concepts. J. Build. Eng. 111:113391. doi: 10.1016/j.jobe.2025.113391
Huang, R., Ni, H., Chen, G., Du, L., and Zhou, Y. (2022). Refined Allocation of Water Resources in Pishihang Irrigation Area by Joint Utilization of Multiple Water Sources. Sustainability, 14:13343. doi: 10.3390/su142013343
Jia, D., Zhang, T., Wu, L., Su, X., Bai, T., and Huang, Q. (2024). Multi-objective cooperative optimization of reservoir scheduling and water resources allocation for inter-basin water transfer project based on multi-stage coupling model. J. Hydrol. 630:130673. doi: 10.1016/j.jhydrol.2024.130673
Jie, F., Fei, L., Peng, Y., Li, S., and Ge, Y. (2025). Optimal allocation of water resources in irrigation areas considering irrigation return flow and uncertainty. Appl. Sci. 15:2380. doi: 10.3390/app15052380
Korenhof, P., Metcalfe, B., and Henschke, A. (2025). Cyber-governance of the natural world: the implications of digital twins in environmental governance. Earth Syst. Gov. 25:100276. doi: 10.1016/j.esg.2025.100276
Kryvoruchko, O., Abildaeva, Z., Lakhno, V., and Siutsiura, M. (2025). Multi-criteria optimization of digital marketing for enterprises in the agro-industrial complex based on NSGA-III algorithm and machine learning. Easte. Eur. J. Enterpr. Technol. 3, 6–17. doi: 10.15587/1729-4061.2025.332468
Kumar, V., Gautam, L., and Dahiya, R. (2025). A hybrid multi-objective optimization approach for wastewater treatment plant construction: Balancing time, cost, environmental impact, energy efficiency, and land use using NSGA-III and MODE. Asian J. Civ. Eng. 26, 2005–2021. doi: 10.1007/s42107-025-01294-y
Li, R., Chang, Y., and Wang, Z. (2021). Study of optimal allocation of water resources in Dujiangyan irrigation district of China based on an improved genetic algorithm. Water Supply 21, 2989–2999. doi: 10.2166/ws.2020.302
Li, X., Yang, Y., Li, Z., and He, H. (2025a). Research on collaborative optimization strategy of railway signal nonlinear control system based on BBO algorithm and multi-objective optimization. Int. J. Cogn. Comput. Eng. 6, 617–627. doi: 10.1016/j.ijcce.2025.05.005
Li, Y., Zhu, W., Guo, J., Wang, K., and Gao, L. (2025b). Multi-objective collaborative optimization of green disassembly planning and recovery option decision considering the learning effect. J. Manuf. Syst. 80, 324–343. doi: 10.1016/j.jmsy.2025.03.011
Matyakubov, B., Koshekov, R., Avlakulov, M., and Shakirov, B. (2021). Improving water resources management in the irrigated zone of the Aral Sea region. E3S Web Conf. 264:03006. doi: 10.1051/e3sconf/202126403006
Pham, S. H. V., Hoang, P. T. N., and Le, T. A. D. (2025). A hybrid NSGA-III and improved arithmetic optimization algorithm (IAOA) approach for time, cost, and resource allocation. Asian J. Civ. Eng. :1391, 1–20. doi: 10.1007/s42107-025-01391-y
Qian, X., and Liang, Q. (2021). Sustainability evaluation of the provincial water-energy-food nexus in China: evolutions, obstacles, and response strategies. Sustain. Cities Soc. 75:103332. doi: 10.1016/j.scs.2021.103332
Shokhrukh-Mirzo, J. (2021). Emergence of water-energy-food nexus resulting from interbasin water transfer: economic analysis for a transboundary river basin in South Asia. J. Water Resour. Plan. Manag. 147, 788–790. doi: 10.1061/(ASCE)WR.1943-5452.0001442
Shu, Z., Kang, Y., Gao, Y., Shi, X., Li, W., Zhang, S., et al. (2025). An interval bilateral regulation framework of water resources supply and demand in irrigation area under water sources uncertainty. Agric. Water Manag. 307:109266. doi: 10.1016/j.agwat.2024.109266
Song, H., Chen, X., and Wang, H. (2024). Carbon emission optimization for assembled buildings using interval grey GERT modelling and modified NSGA-III algorithm in China. KSCE J. Civ. Eng. 28, 5415–5426. doi: 10.1007/s12205-024-2619-6
Sun, L., Dai, S., Tian, L., and Ni, Z. (2025). Optimal water allocation considering water diversion projects in an agricultural irrigation district. Agriculture 15:949. doi: 10.3390/agriculture15090949
Wang, Y., Wang, Y., and He, B. (2025). Multi-objective optimal allocation of regional water resources based on the improved NSGA-III algorithm. Appl. Sci. 15:5963. doi: 10.3390/app15115963
Xing, H., Mo, S., Liang, X., and Li, Y. (2021). Water Resources Allocation Based on Complex Adaptive System Theory in the Inland River Irrigation District. Sustainability, 13:8437. doi: 10.3390/su13158437
Xu, X., Cheng, D., Wang, D., Li, Q., and Yu, F. (2024). An improved NSGA-III with a comprehensive adaptive penalty scheme for many-objective optimization. Symmetry 16:1289. doi: 10.3390/sym16101289
Xu, Y. R., YongTai, R., and Wei, P. (2022). Study on coupling coordination and collaborative optimization system of water-energy-grain. Front. Ecol. Evol. 10:28463. doi: 10.3389/fevo.2022.1028463
Yadav, D. A., Verma, K. S., and Sharma, K. V. (2025). Integration of earth-air heat exchangers in sustainable construction: a hybrid NSGA-III/dual simplex approach for multi-objective optimization. Asian J. Civ. Eng. 26, 1287–1304. doi: 10.1007/s42107-024-01251-1
Yang, G., Su, Y., Huo, L., Guo, D., and Wu, Y. (2025a). A multi-objective synergistic optimization model considering the water-energy-food-carbon nexus and bioenergy. Agric. Water Manag. 312:109431. doi: 10.1016/j.agwat.2025.109431
Yang, M., Zhang, B., Shi, Z., and Li, J. (2025b). A hybrid task allocation approach for multi-UAV systems with complex constraints: a market-based bidding strategy and improved NSGA-III optimization. J. Supercomput. 81:546. doi: 10.1007/s11227-025-07027-x
Yu, Y., Zhang, C., Zhu, W., Park, S., and Shi, Q. (2021). Identifying the driving factors of water consumption from water-energy-food nexus in the Yangtze River Delta region, China. Environ. Sci. Pollut. Res. 28, 48638–48655. doi: 10.1007/s11356-021-14087-y
Zhang, Q., Long, W., Wang, R., Cao, Z., Wang, Z., Yan, Y., et al. (2025a). Caper: dual-level physics-data fusion with modular metamodels for reliable generalization in predictive digital twins. Appl. Energy 398:126393. doi: 10.1016/j.apenergy.2025.126393
Zhang, T., Zhong, W., Liu, Y., Lu, R., and Peng, X. (2025b). Incorporating large-scale economic-environmental-energy coupling assessment and collaborative optimization into sustainable product footprint management: a graph-assisted life cycle energy efficiency enhancement approach. Energy Convers. Manag. 329:119616. doi: 10.1016/j.enconman.2025.119616
Keywords: water-energy-food nexus, NSGA-III algorithm, digital twin, collaborative optimization, irrigation district management, resource coupling system
Citation: Huang P, Jia M and Gu F (2025) Multi-objective collaborative optimization of water resources in Hebei irrigation areas: maximizing the benefits of the water-energy-grain nexus driven by the NSGA-III algorithm and verified by digital twins. Front. Sustain. Food Syst. 9:1701718. doi: 10.3389/fsufs.2025.1701718
Edited by:
La Zhuo, Northwest A&F University, ChinaReviewed by:
Yilin Liu, Northwest A&F University, ChinaHongrong Huang, Dongguan University of Technology, China
Copyright © 2025 Huang, Jia and Gu. This is an open-access article distributed under the terms of the Creative Commons Attribution License (CC BY). The use, distribution or reproduction in other forums is permitted, provided the original author(s) and the copyright owner(s) are credited and that the original publication in this journal is cited, in accordance with accepted academic practice. No use, distribution or reproduction is permitted which does not comply with these terms.
*Correspondence: Peng Huang, NjI3MTYwMDM0QDE2My5jb20=