 Shimaa K. Ganzour
 Tharwat K. Ghabour
 Abdelrazek Elnashar
- 1RS & GIS Unit, Soils, Water and Environment Research Institute (SWERI), Agricultural Research Center (ARC), Giza, Egypt
- 2Soils and Water Use Department, National Research Centre, Giza, Egypt
- 3Section of Soil Science, Faculty of Organic Agricultural Sciences, University of Kassel, Witzenhausen, Germany
- 4Department of Natural Resources, Faculty of African Postgraduate Studies, Cairo University, Giza, Egypt
This study develops a framework for sustainable agriculture in an arid Egyptian region, enhancing food security through advanced assessments of crop suitability. By integrating freely accessible Google Earth Engine (GEE) data with field observations and laboratory analyses, the framework employs GEE, Microsoft Excel, and ArcGIS for geospatial analysis and visualization. In resource-scarce environments impacted by climate change, selecting crops with high suitability and minimal Crop Water Requirements (CWR) and Crop Fertilizer Requirements (CFR) is vital for sustainable practices. Hence, this study proposes the Suitability-Resources Quality Index (SRQI), a decision-support metric designed to optimize crop selection. Results indicated that the SRQI index-guided optimized selection of the top two highly suitable crops reduced CWR by 14–34% and CFR by 34–88% across various crop types and seasons. The unoptimized crop suitability analysis suggested that sunflower and cotton are optimal summer crops, while alfalfa and faba bean are prioritized for winter cropping. For year-round vegetable production, cabbage, watermelon, and pepper are top choices. For fruit trees, deciduous options such as apple and fig, alongside evergreen banana and olive trees, are suggested. However, the SRQI endorses sunflower and soybean for summer cropping systems, while prioritizing faba bean and sugar beet for winter. Across seasons, watermelon, cabbage, and pea are the top vegetable choices, and for fruit trees, deciduous grape and fig, alongside evergreen olive and date palm, are recommended. This integrated monitoring and assessment framework prioritizes crops with lower CWR and CFR, supporting water- and land-related Sustainable Development Goals (SDGs) and promoting resilient agricultural systems in arid environments to mitigate climate change.
1 Introduction
Integrated agricultural land management is vital for sustainable agriculture, as it enhances productivity while optimizing resource use in the face of climate change, which increasingly impacts water availability and soil health (Deng et al., 2024; Khattak et al., 2025). Additionally, precision and smart agriculture offer transformative potential to improve cultivation practices across diverse farm scales (Mandal et al., 2024; Awais et al., 2025). In Egypt, agricultural landscapes vary significantly, with small-scale, fragmented land ownership dominating traditional “old lands” in the Nile Delta and Valley, while larger farms characterize reclaimed lands in desert areas (Abdelkader et al., 2022; Elsharkawy et al., 2022). These contrasting land structures present unique challenges and opportunities for adopting advanced agricultural technologies tailored to Egypt’s diverse farming systems.
Land evaluation is vital for sustainable agriculture, guiding informed land-use decisions. It predicts land potential based on its characteristics, enabling efficient resource management. This process assesses land suitability for agriculture and identifies limitations. It includes two main components: land capability, which evaluates potential uses, and crop suitability, which identifies crops best suited to specific conditions (FAO, 1981; Rossiter, 1996). Several land evaluation methods have been utilized in previous studies (e.g., Eliasson, 2007; Vasu et al., 2018). For instance, the study of Rossiter (1990) proposed the Automated Land Evaluation System (ALES) as a microcomputer framework for land evaluation assessments, De la Rosa et al. (1992) provided the Microcomputer-based Mediterranean Land Evaluation Information System (MicroLEIS), and Ismail et al. (2005a) used the Agricultural Land Evaluation System for arid and semi-arid regions (ALES-Arid). ALESarid-GIS is the enhanced iteration of ALES-Arid, specifically designed to perform land evaluation within a Geographic Information System (GIS) environment (Abd El-Kawy et al., 2010). ALESarid-GIS has been utilized in numerous prior studies due to its user-friendliness and reasonable data needs (e.g., Abd El-Kawy et al., 2019; Mahmoud et al., 2020; Elnashar et al., 2021). To the best of our knowledge, crop suitability analysis remains suboptimal due to insufficient integration of key agricultural resources, such as Crop Water Requirements (CWR) and Crop Fertilizer Requirements (CFR; Eliasson, 2007; Vasu et al., 2018; Akpoti et al., 2019). This limitation hampers the ability to identify the most suitable crops with respect to resource efficiency in a given region.
Water, like soil, is a finite and vital agricultural resource. Understanding each crop’s specific water needs is essential for effective irrigation and water management. To achieve holistic land management that integrates soil, crop, and water requirements, it is recommended to assess CWR after evaluating land suitability for crops (Elnashar et al., 2021; Selmy et al., 2024). In this context, EvapoTranspiration (ET) refers to the total water loss from the soil surface and plants through evaporation and transpiration (ASCE, 2025), while CWR indicates the total amount of water needed by a crop to grow optimally throughout its growing season (FAO, 1998). It reflects the amount of water that crops utilize during their growth, influenced by specific conditions of the soil, the crop itself, and the prevailing climate. Actual ET (ETa) refers to the actual amount of ET under specific conditions of soil moisture, crop type, and environmental factors (ASCE, 2025). Several methods have been used to estimate ETa, including changes in soil water, lysimeters, Bowen ratio energy balance, eddy covariance, scintillometers, sap flow, remote sensing energy balance, and remote sensing vegetation indices (Allen et al., 2011). More recently, machine learning techniques have emerged as powerful tools for ETa estimation, offering improved accuracy and adaptability (Yamaç et al., 2024; Reta, 2025). On the other hand, reference ET (ETref) represents the ET from a standardized vegetated surface, typically a well-watered short-grass surface (ETo), under specific climatic conditions (Pereira et al., 2015). Traditionally, for over 30 years, ETa has been estimated by multiplying ETref by crop coefficients (Kc). Therefore, ETa is often referred to as crop ET (ETc), representing the specific water use of a particular crop under varying conditions (Fernández, 2023). This method provides a practical approach to assessing the water requirements of different crops throughout their growth stages. The American Society of Civil Engineers (ASCE) provided the most updated version of Penman-Monteith (ASCE-PM; ASCE-EWRI, 2005); hence, ASCE-PM is utilized in this study to estimate ETo for CWR calculations.
Conventional fertilizer application methods frequently result in over- or under-fertilization, leading to significant economic losses and environmental pollution (Harikumaran and Vijayalakshmi, 2025). In contrast, precision fertilizer application enhances crop productivity by utilizing advanced technologies for accurate, site-specific nutrient delivery, thereby minimizing waste and reducing environmental impact (Cai et al., 2025). This approach ensures crops receive optimal nutrient balances, promoting growth, improving yields, and enhancing quality while preserving soil fertility and supporting beneficial microorganisms (Kushwah et al., 2024). Cutting-edge tools, including soil sampling, GIS, and sensor-based systems, enable tailored applications that account for field variability (Lanki and Onwu, 2024; Ravikumar et al., 2024). Advanced sensor technologies further refine site-specific fertilizer applications, maximizing efficiency and reducing environmental harm (Paccioretti et al., 2025; Weber et al., 2025). Hence, soil fertility assessment is critical for formulating sustainable agricultural management strategies (Bostani et al., 2025). This involves evaluating key soil nutrient levels and determining CFR tailored to specific crops in a designated study area, ensuring optimal productivity and environmental sustainability. In this regard, soil-available nitrogen (N), phosphorus (P), and potassium (K) are critical input parameters in land evaluation models for assessing land capability and land suitability for crops (Juhos et al., 2019; Bostani et al., 2025). As far as we know, previous studies have not integrated crop suitability, CWR, and CFR into a unified framework for optimizing crop selection (Eliasson, 2007; Vasu et al., 2018; Akpoti et al., 2019).
Previous integrated approaches to resource-efficient agriculture include climate-smart agriculture (Billah et al., 2025), organic farming (Gamage et al., 2023), biodynamic agriculture (Santoni et al., 2022), sustainable intensification (Lyu et al., 2021) and regenerative agriculture (Sher et al., 2024), and novel practices as integrated farming system (Akter et al., 2025; Thakur et al., 2025), precision agriculture (Raj et al., 2025), integrated nutrient management (Wu and Ma, 2015) and integrated pest management (Deguine et al., 2021). The adoption of these methods has been demonstrated to enhance agricultural sustainability by optimizing resource use, improving soil health, reducing environmental impacts, and increasing resilience to climate variability, thereby ensuring long-term productivity and ecological balance (Muhie, 2022). Hence, smart agriculture methods, which integrate land, water, and nutrient management, are pivotal for minimizing environmental impacts, reducing resource waste, and enhancing soil health and crop yields amid escalating climatic and economic challenges (Frimpong et al., 2023; Kumar et al., 2024). While previous studies have explored land suitability for crops and CWR independently (e.g., Elnashar et al., 2021; Selmy et al., 2024), they often fail to holistically address the interconnected dynamics of land suitability for crops, CWR, and CFR. For instance, in Egypt’s El-Dabaa area, barley, wheat, and sorghum are rated suitable for ~88% of the land. Yet, their seasonal water demands are 387.7 mm, 497.0 mm, and 560.2 mm, respectively, which exceed the local rainfall with 0 mm in summer and 28 mm in winter (Selmy et al., 2024). Moreover, according to Egypt’s agronomic guidelines (MALR, 2024), the recommended nitrogen application rates for barley, wheat, and sorghum on clay soils are 107, 202, and 714 kg N ha−1, respectively. Hence, similar land suitability with substantially different water and fertilizer needs hinders our ability to select suitable crops, considering their crop CWR and CFR in the studied area. Therefore, integrating CWR and CFR into land suitability assessments represents a new approach to address this gap, enabling a more comprehensive framework for identifying crops that maximize resource use efficiency under site-specific conditions.
The Soil Quality Index (SQI) integrates multiple partial indicators, including the Soil Physical Quality Index (SPQI), Soil Chemical Quality Index (SCQI), and Soil Biological Quality Index (SBQI). These combined metrics provide a comprehensive framework for assessing soil health and functionality. For example, SQI can be applied to evaluate overall soil quality (Shokr et al., 2021), assess the sustainability of land management practices (Damiba et al., 2024), analyze the impacts of soil degradation (Kahsay et al., 2025), and evaluate the suitability of smallholder agricultural land uses (Gelaw et al., 2015). By synthesizing physical, chemical, and biological properties, SQI serves as a tool for informing land management decisions and promoting sustainable agricultural practices (Abshiba et al., 2025). To the best of our knowledge, no prior studies have utilized the SQI in its current form to optimize land suitability for crops. Hence, this study presents the Suitability-Resources Quality Index (SRQI), an adaptation of the SQI framework (El Baroudy et al., 2020; Shokr et al., 2021), tailored to optimize crop selection and resource efficiency. The SRQI integrates three equally weighted, normalized indicators–land suitability for crops, CWR, and CFR–to deliver a data-driven framework for optimizing crop selection and resource management in a given study area (Section 2.5.5). Accordingly, this research pioneers the integration of advanced tools such as ALESarid-GIS for crop suitability analysis, ASCE-PM for CWR calculations, and ArcGIS for mapping CFR. This integrative methodology offers a framework for optimizing resource allocation and enhancing sustainability.
Land evaluation, encompassing land capability and suitability assessments, CWR, and CFR, can contribute to several United Nations Sustainable Development Goals (SDGs) by promoting sustainable agricultural practices (Keesstra et al., 2018; Lal et al., 2021). For example, it can support SDG 1 (No Poverty) by enabling small-scale farmers to increase income through suitable crop choices that need less CWR and CFR. This is because closing the gap between actual and potential yields allows farmers to grow enough to feed their families and sell surplus, ensuring food security and reducing poverty (Gassner et al., 2019). Similarly, it may align with SDG 2 (Zero Hunger) by optimizing crop selection and resource use as a sustainable agriculture strategy for achieving zero hunger (Hiywotu, 2025). Assessing land capability and suitability can facilitate SDG 12 (Responsible Consumption and Production) through efficient resource allocation tailored to specific crops and local conditions. This fosters sustainable development by optimizing resource use, reducing waste, and promoting environmentally responsible practices throughout agricultural supply chains (Firoiu et al., 2025). The integration of CWR can support SDG 6 (Clean Water and Sanitation) by enabling precise irrigation planning to conserve water resources by choosing the most suitable crops with lower CWR (Arora and Mishra, 2022). Additionally, incorporating CFR can aid SDG 15 (Life on Land) by preventing soil degradation and reducing environmental pollution through targeted applications by choosing the most suitable crops with lower CFR (Arora and Mishra, 2024). Thus, integrating land evaluation with CWR and CFR offers a framework for sustainable land management that can enhance agricultural productivity while addressing global sustainability challenges.
For the above-mentioned reasons, this study integrates land capability, crop suitability, CWR, and CFR to boost agricultural productivity and sustainability. By merging soil fertility data with crop-specific water and nutrient needs, tailored crop-water-fertilization strategies were developed to reduce environmental impacts like water loss and nutrient leaching. This approach meets rising agricultural demands, promotes sustainable land management, and enhances soil health. Findings aim to support resilient agricultural systems adaptable to climate change and food security challenges. The study has five objectives: (1) map soil physicochemical properties, (2) map land capability and crop suitability, (3) calculate CWR to optimize water use, (4) map CFR to optimize fertilizer use, and (5) assess crops with low CWR and CFR for optimized crop suitability using SRQI.
2 Materials and methods
2.1 Study area
The study area encompasses Abu El-Matamir district in Beheira governorate, Egypt (Figure 1a). It spans longitudes 29° 56′06″ to 30° 11′07″E and latitudes 31° 03′24″ to 30° 32′58” N, covering approximately 130,867 hectares (311,463 feddans). Elevations range from −46 m to 74 m above sea level, with the lowest values in the northern and northeastern parts and the highest in the southwestern parts (Farr et al., 2007). Land use (Figure 1b) is 10% urban and 90% agricultural (Karra et al., 2021). Long-term ERA5-Land meteorology (Muñoz-Sabater et al., 2021) reveals a seasonal climate (Figure 1c), in which precipitation peaks at >14 mm in January, February, and November (wet season) but falls to ≤2 mm from June to August (dry period); air temperatures reach 25–27 °C in July and August, dropping to 8–10 °C in January and February. The inverse precipitation-temperature pattern, characteristic of Mediterranean climates, underscores the study area’s significance for investigating agriculture and water resource management (Tramblay et al., 2020). This climatic context, combined with the challenges of water scarcity and fragmented small-scale farming, emphasizes the need for tailored, integrated land and water management strategies to enhance agricultural resilience and sustainability in arid regions globally. Physiographic units include Nile silt, stabilized dunes, and undifferentiated quaternary deposits (Figure 1d).

Figure 1. General location map of the study area within Egypt (a), long-term mode land use from 2017 to 2023 (b), long-term mean monthly precipitation (Pr; mm) and air temperature (Ta; °C) from 2019 to 2024 using ERA5-Land meteorology (c), and physiographic units including the spatial distribution of soil profiles (d).
According to the global aridity index dataset (Zomer et al., 2022), global land is categorized into hyper-arid (6%), arid (23%), semi-arid (19%), dry sub-humid (10%), and humid (42%) regions. In Egypt, approximately 90% of the land is classified as hyper-arid, with the remaining 10% characterized as arid. In contrast, the study area exhibits a different distribution, with hyper-arid conditions covering only 5% of the region and arid conditions prevailing across 95%. These arid and hyper-arid conditions underscore the challenges of water scarcity (Azadi et al., 2025) and soil limitations (Naorem et al., 2023), particularly for small-scale, fragmented farms prevalent in Egypt’s old lands (Elsharkawy et al., 2022). Hence, this study’s integrated approach to land evaluation, crop water requirements, and fertilizer optimization offers a scalable model for sustainable agriculture in arid regions worldwide, addressing the global challenges of food security and resource management in similar agroecological contexts. By tailoring solutions to fragmented land systems, it provides insights applicable to other arid and semi-arid regions facing comparable constraints.
2.2 Field work
The study integrated Sentinel-2 imagery with a Digital Elevation Model (DEM) and a geological map (Meshref et al., 2008; Zawadzka et al., 2015) to delineate the physiographic units map (Figure 1d). Fieldwork involved augering holes between soil profile locations to verify and refine mapping unit boundaries. Eighteen soil profiles were dug following winter harvest across distinct physiographic units and georeferenced using GPS; then soil samples were collected and analyzed to characterize soil variability across the study area. It should be noted that, based on the field survey and physiographic classification of the study area, soil profiles were systematically distributed across distinct physiographic units (Figure 1d). Eight soil profiles were associated with the Nile silt unit, and seven were linked to the undifferentiated quaternary deposits. Both units exhibit high heterogeneity, reflecting diverse soil characteristics. In contrast, three soil profiles were identified within the stabilized dunes unit, which displays lower heterogeneity and is predominantly characterized by sandy soils.
2.3 Laboratory analyses
Fifty-seven soil samples were analyzed by following USDA methods (Soil Survey Staff, 2022). The samples were air-dried, gently ground, and sieved through a 2 mm mesh for laboratory analyses. Measured properties included particle size distribution (%), hydraulic conductivity (Ks; cm h−1), available water (AW; %), bulk density (BD; g cm−3), calcium carbonate (CaCO3; %), gypsum (CaSO4; %), pH (1 soil:2.5 water; unitless), electrical conductivity (ECe; dS m−1), soluble cations (Ca2+, Mg2+, Na+, K+; mmolc L−1) and anions (HCO3−, Cl−, SO42−; mmolc L−1), exchangeable sodium percentage (ESP; unitless), organic matter (OM; %), cation exchange capacity (CEC; cmolc kg−1 soil), and available macronutrients (NPK; mg kg−1). Available nitrogen (N) was determined using the micro-Kjeldahl method (Page et al., 1982), available phosphorus (P) was extracted with 0.5 M sodium bicarbonate solution at pH 8.5 (Olsen et al., 1954), and available potassium (K) was extracted using a 1 N ammonium acetate solution at pH 7 (Page et al., 1982). Additionally, 10 irrigation water samples were analyzed for quality parameters (Supplementary Table S1), including pH, electrical conductivity, soluble cations and anions, sodium absorption ratio (SAR), and boron content (USDA, 2009).
2.4 Data sources
The different data used in this study are freely available in the Earth Engine Data Catalog and the Copernicus Data Space Ecosystem (Supplementary Table S2) and are described in the following subsections.
2.4.1 ERA5-land meteorology
ERA5-Land (hereafter ERA5) is a reanalysis dataset that combining model data and global observations at ~11,132 m spatial resolution, covering 1950 to the present with hourly and daily outputs (Muñoz-Sabater et al., 2021). ERA5 was accessed from the Google Earth Engine (GEE) environment (Gorelick et al., 2017) and was selected for its proven reliability in estimating ETref (e.g., Ippolito et al., 2024; Elnashar et al., 2025).
2.4.2 Auxiliary data
Global Environmental Systems Research Institute (ESRI) Land Use and Land Cover (LULC) is derived from Sentinel-2 imagery (10 m resolution) for the years from 2017 to 2023 (Karra et al., 2021). LULC was accessed via the “awesome-gee-community-catalog” in the GEE environment (Roy et al., 2023), and a 2017–2023 mode composite was generated to map urban and non-urban areas in the study region (Figure 1b). Four Sentinel-2 images (grid tiles: T36RTU, T35RQQ, T35RQP, and T36RTV), acquired April 20, 2023, were sourced from the Copernicus Data Space Ecosystem Browser (ESA, 2023). The Shuttle Radar Topography Mission (SRTM) dataset (Farr et al., 2007), offering 30 m resolution, provides a comprehensive Digital Elevation Model (DEM). SRTM was retrieved via GEE assets (Gorelick et al., 2017). Sentinel-2 images, DEM, and a geological map were integrated to produce the physiographic map of the study area (Figure 1d).
2.5 Methods
The methodology adopted in this study is shown in Figure 2. It involves a structured sequence of interconnected steps, commencing with the delineation of the study area and the creation of a physiographic units map. Subsequent phases include the sampling of soil profiles and irrigation water, laboratory analyses of their physical and chemical properties, and the assembly of a comprehensive geodatabase that amalgamates multifaceted data sources such as Sentinel-2 images, SRTM elevation model, ERA5 meteorology, and tabular references (e.g., crop coefficient (Kc) tables and NPK fertilizer guidelines). Data processing and analysis are performed via specialized software and platforms, including ArcGIS (ESRI, 2021), ALESarid-GIS (Abd El-Kawy et al., 2010), GEE (Gorelick et al., 2017), Ref-ET (ASCE-EWRI, 2005), and Microsoft Excel (Microsoft Corporation, 2024). This approach ultimately yields recommendations using the SRQI for optimal crop selection, emphasizing crops with low water and fertilizer demands to foster sustainability and integrated management of these resources. In-depth explanations of each stage are provided in the subsequent subsections.
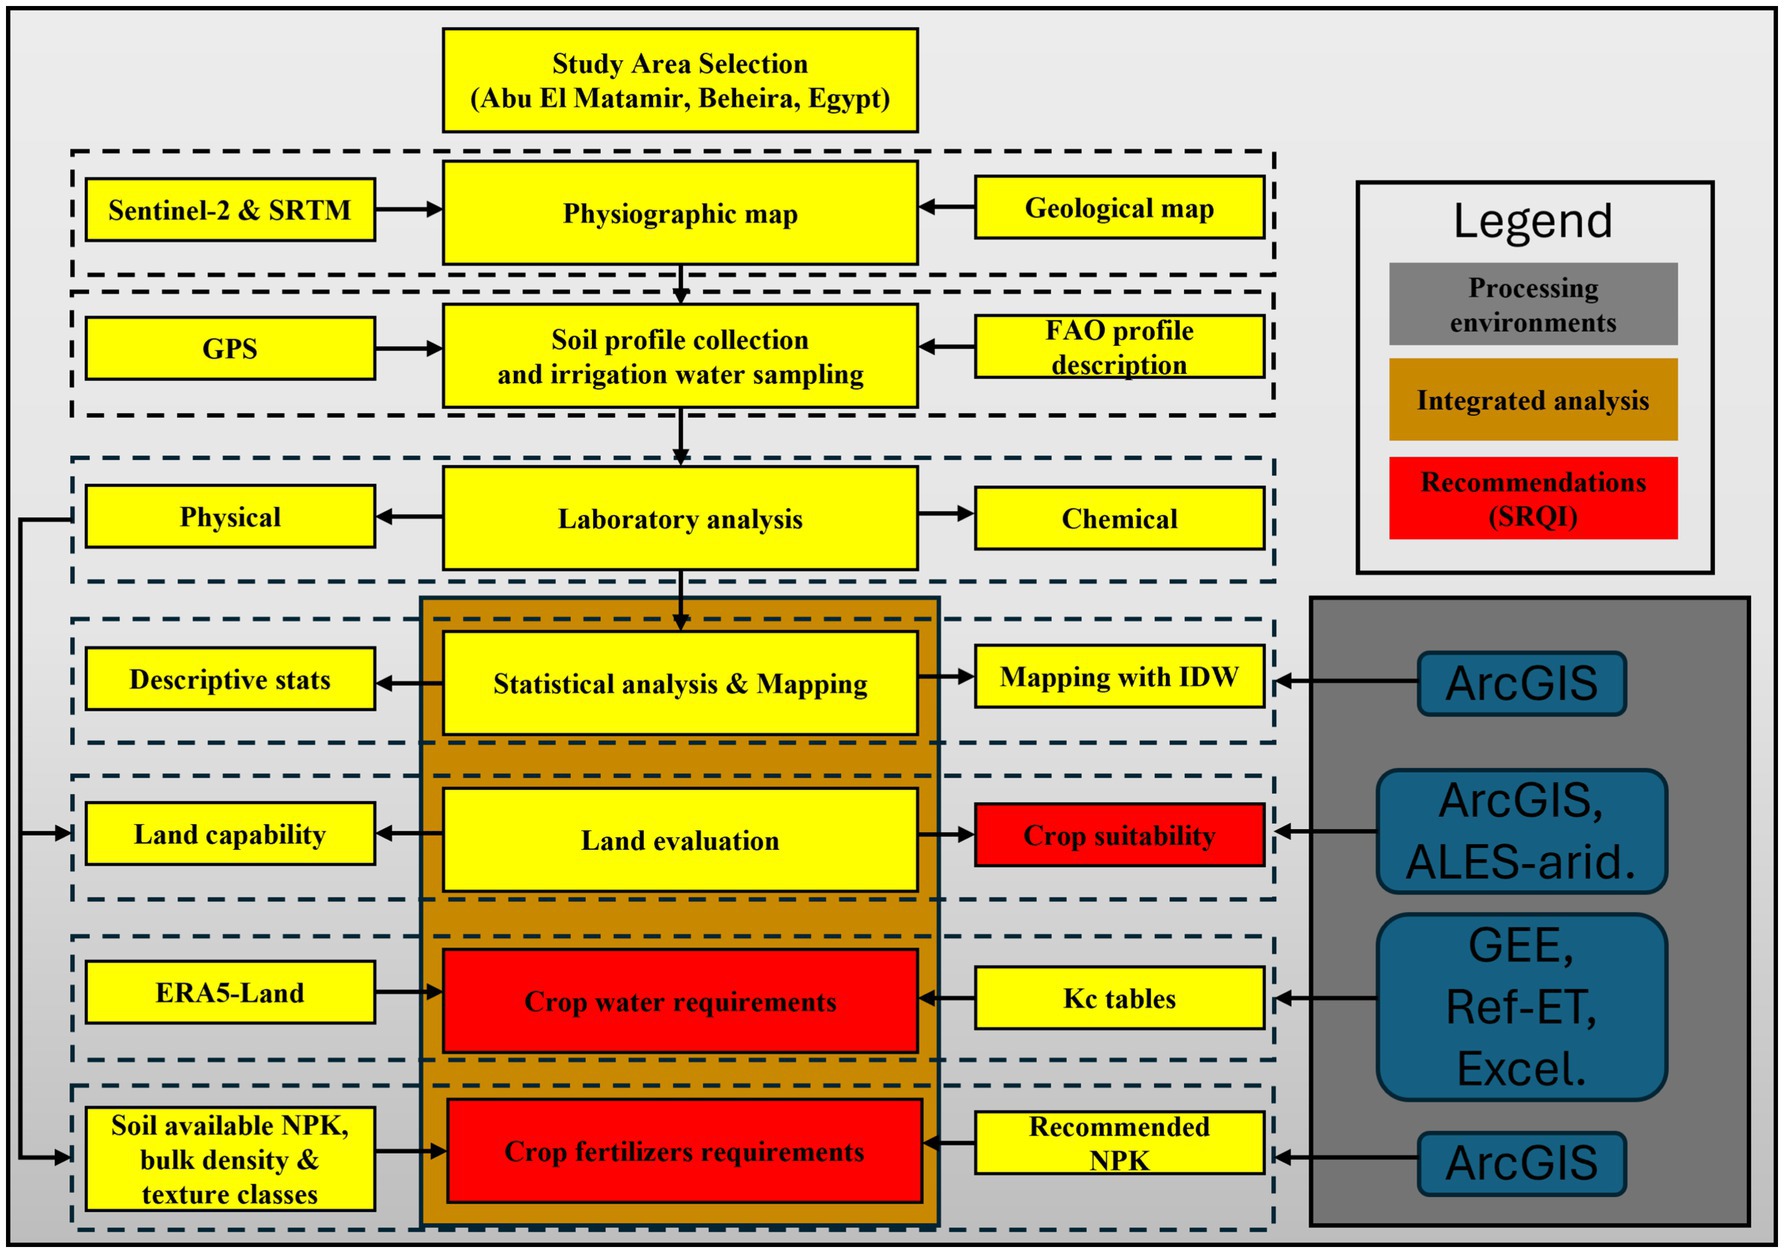
Figure 2. Flowchart of the employed methodology.
2.5.1 Soil thematic maps
Digital thematic maps of soil physicochemical properties (Section 2.3) were generated through advanced geostatistical techniques, utilizing Inverse Distance Weighting (IDW) interpolation in ArcGIS (Yuan et al., 2021; Raheem et al., 2023). IDW was applied to create weighted average soil profile spatial distribution maps for most properties, except for texture, bulk density, and macronutrients, where interpolation was limited to the surface soil layer. These maps were developed in alignment with international classification standards, ensuring consistency and comparability with global soil mapping frameworks (Minasny and McBratney, 2010; Dai et al., 2019).
2.5.2 Land evaluation
The Agricultural Land Evaluation System for arid and semi-arid regions (ALES-Arid), integrated with ArcGIS as ALESarid-GIS, is Windows-based software designed to assess agricultural land suitability (Ismail et al., 2005b; Abd El-Kawy et al., 2010). It evaluates land capability and suitability for 28 crops (field crops, vegetable crops, and fruit trees) and predicts wheat and maize yields based on site-specific environmental factors. ALESarid-GIS derives land capability and suitability indices, classes, and limitations through: (1) retrieve and temporarily store structured input from the relational database; (2) compute weighted average values (AV) for each soil property per soil profile as in Equation 1; (3) match AVs against model-coded ratings to assign capability indices 0–100; (< 50 indicates limitation) for each parameter; (4) calculate three major indices (physicochemical, fertility, and irrigation) using geometric means as in Equations 2, 3; (5) derive the final land capability index from the three major indices similarly, then assign classes per predefined categories (Supplementary Table S3); (6) compute crop suitability indices by matching soil parameters against internal crop requirements and assign classes per categories (Supplementary Table S4).
where is the soil property value relating to the soil layer , is the soil layer thickness, is the number of layers within the soil profile, is the total soil profile depth (cm), is the major index, are the inner estimated indices, and is the number of the inner indices used for the major index calculation.
2.5.3 Crop water requirements
The ERA5 dataset was utilized to estimate ETo in accordance with ASCE-EWRI (2005) and Elnashar et al. (2025), as specified in Equation 4. Seasonal ETc was calculated based on Allen et al. (1998), as outlined in Equation 5. Subsequently, seasonal CWR was determined by following Allen et al. (1998), as detailed in Equation 6.
where ETo24 is the daily reference ET (mm d−1), Rn is the net radiation at the crop surface (MJ m−2 d−1), G is the soil heat flux density at the soil surface (MJ m−2 d−1), Ta is the mean air temperature at 1.5–2.5 m height (°C), u2 is the mean wind speed at 2 m height (m s−1), es is the saturation vapor pressure at 1.5–2.5 m height (Kpa), ea is the actual vapor pressure at 1.5–2.5 m height (kPa), Δ is the slope of the saturation vapor pressure–temperature curve (kPa °C−1), γ is the psychometric constant (kPa °C−1), Cn is the numerator constant that changes with reference type and calculation time step, Cd is the denominator constant that changes with reference type and calculation time; 0.408 is a coefficient (m2 mm MJ−1), is the cumulative crop ET (mm) from day i through day n, is the crop coefficient (unitless) for day i, CWR is the seasonal crop water requirements (m3 ha−1), 10 is the conversion factor to hectare, and is the irrigation system efficiency (%). Section S2 details modifications for using the ERA5 dataset in the current framework. It is worth noting that CWR values were calculated based on three specific irrigation methods: surface irrigation, sprinkler irrigation, and drip irrigation. Surface irrigation is predominantly used for heavy soils (such as clay soils), whereas modern irrigation methods, such as sprinkler and drip irrigation, are typically applied to lighter soils (such as sandy soils). To account for climatic variability and ensure standardization, CWR values were derived using long-term mean climate data spanning 2019 to 2024. This approach mitigates the influence of short-term weather fluctuations, providing a consistent baseline for CWR across different agroecological zones. It should be noted that Kc values for each crop and its respective growth stages were adopted from FAO (1998). Given the arid climate of the study area (Section 2.1), effective rainfall was not considered in the CWR calculations following Selmy et al. (2024), due to the region’s reliance on irrigation.
2.5.4 Crop fertilizer requirements
CFR for nitrogen (N), phosphorus (P), and potassium (K) in the study area was estimated using a GIS-based approach in ArcGIS. This involved integrating two key datasets: (1) spatial maps of available soil nutrient concentrations (N, P, and K; mg kg−1) derived from soil sampling (Supplementary Figures S10–S12), and (2) crop-specific fertilizer recommendation rates (kg ha−1 of commercial fertilizer) sourced from Egypt’s national agronomic guidelines (MALR, 2024). To ensure consistency, soil nutrient concentrations were converted from mg kg−1 to kg ha−1 using surface soil bulk density (Supplementary Figure S5). Additionally, commercial fertilizer recommendations were converted to their elemental forms (N, P, and K; kg ha−1) using conversion factors provided in Supplementary Table S5, aligning with the form of available soil nutrients. The CFR was then calculated by subtracting the available soil nutrient content from the recommended fertilizer rates, following the methodology outlined by Ganzour et al. (2020). Because the national guidelines provide distinct fertilizer recommendations for clay and sandy soils, this study generated separate CFR estimates for each soil type to account for their differing nutrient retention and availability.
2.5.5 Suitability-resources quality index
This study proposes the Suitability-Resources Quality Index (SRQI), a composite index designed to aggregate multiple quality indicators into a single metric using the geometric mean mathematical approach. The geometric mean ensures that each indicator contributes proportionally to the SRQI, mitigating the impact of extreme values while providing an interpretable measure of resource quality for agricultural suitability assessment. Hence, the SRQI is calculated as the geometric mean of the normalized indicator values of the five key indicators, balancing their contributions to provide a unified measure of overall quality (El Baroudy et al., 2020; Shokr et al., 2021) as detailed in Equation 7.
where SRQI is the Suitability-Resources Quality Index, representing the overall quality of agricultural resources, Sn is the normalized value of the crop suitability index, derived from the sum of suitability classes S1 and S2, CWRn is the normalized value of mean seasonal crop water requirements (m3 ha−1) based on data from 2019 to 2024 for surface irrigation, Nn is the normalized value of crop nitrogen fertilizer requirement (kg N ha−1), Pn is the normalized value of crop phosphorus fertilizer requirement (kg P ha−1), Kn is the normalized value of crop potassium fertilizer requirement (kg K ha−1). The normalization of each variable (Sₙ, CWRₙ, Nₙ, Pₙ, Kₙ) is a critical step in calculating the SRQI, ensuring that all variables are scaled to a standardized range (e.g., from 0 to 1) across specific crop type-season combinations, including field-summer, field-winter, vegetable-summer, vegetable-winter, fruit-deciduous, and fruit-evergreen as detailed in Equation 8. This process enables each indicator to contribute equitably to the SRQI, facilitating a balanced and comparable assessment of resource quality tailored to the unique requirements of each crop type and season.
where Vn is the normalized value of the variable (e.g., Sₙ, CWRₙ, Nₙ, Pₙ, Kₙ), V is the original (raw) value of the variable (e.g., S, CWR, N, P, K), Vmin is the minimum value of the variable within the same crop type and season (e.g., Smin, CWRmin, Nmin, Pmin, Kmin), and Vmax is the maximum value of the variable within the same crop type and season (e.g., Smax, CWRmax, Nmax, Pmax, Kmax). It is important to note that, for certain variables such as Sn, a higher normalized value (Vn) indicates better performance–i.e., the maximum Vn represents the most favorable condition, while the minimum represents the least favorable. However, for other variables such as CWRₙ, Nₙ, Pₙ, Kₙ, lower original values are preferred. Therefore, their normalized values are adjusted using the transformation (Vn = 1 - Vn) to ensure that, in all cases, higher Vn values consistently represent better performance.
It should be noted that the SRQI formula uses the geometric mean of five normalized indicators to ensure equitable contribution across diverse crop type-season combinations. The geometric mean inherently assigns equal weight to each indicator, as the exponent (1/5) balances their contributions. This approach mitigates the influence of extreme values, unlike an arithmetic mean, ensuring that no single indicator dominates the index (Mariani and Ciommi, 2022). Equal weighting is justified because each indicator–suitability, water, and nutrient requirements–plays a crucial role in assessing agricultural resource quality. There is no prior evidence to suggest that one indicator should be prioritized over the others for the crops under study. This approach is particularly recommended when researchers are uncertain about the current and future preferences and needs of stakeholders (Reith et al., 2022). SRQI’s novelty lies in its integration of multiple resource quality dimensions into a single, interpretable metric tailored to diverse crop-season contexts. Unlike previous indices that focus on singular aspects (e.g., crop suitability and/or water use; El Baroudy et al., 2020; Elnashar et al., 2021; Selmy et al., 2024), the SRQI holistically combines suitability and resource requirements, using the geometric mean to provide a balanced measure. This enables precise and comparable assessments across different agricultural systems, enhancing decision-making for land use and resource management. It is worth noting that the SRQI approach can be adaptable to diverse climatic conditions and soil types through its reliance on suitability analysis, CWR, and CFR tailored to a specific study area. By updating the input data–such as region-specific S1 + S2 suitability metrics, CWR, and CFR of each crop–the SRQI can be calculated to reflect the conditions of the study area.
3 Results
3.1 Study area soils
Table 1 presents a summary of the minimum, maximum, mean, standard deviation, and coefficient of variation for the physicochemical properties of soil across 18 profiles in the study area. Spatial distribution maps of these soil properties are shown in Supplementary Figures S1–S12. Note that the percentage (%) of each spatial distribution class (Supplementary Figures S1–S12) was calculated relative to the total area of agricultural land (Figure 1b). The soil physicochemical properties across the study area displayed substantial spatial heterogeneity (CV > 30%), except for soil bulk density and pH.

Table 1. Summary of minimum (min), maximum (max), mean, standard deviation (StD), and coefficient of variation (CV, %) of soil physiochemical properties of the selected profiles.
Gravel content ranged from 0 to 7.2% and particle size distribution showed coarse sand (1.14–79.65%), fine sand (6.52–65.37%), silt (1.84–29.57%), and clay (4.85–67.66%). Clay content distribution, mapped in Supplementary Figure S1, was classified into five categories: slight (39.4% of the agricultural area), high (27.3%), moderate (27.2%), low (5.6%), and very high (0.5%). Soil textures for CFR mapping (Supplementary Figure S2) were grouped into two groups: heavy soils, which include clay, sandy clay, and sandy clay loam soils, covering 55% of the agricultural area, and light soils, which include sandy, loamy sand, and sandy loam, occupying 45%. Ks (cm h−1) varied from 0.11 to 20.34, with spatial distribution (Supplementary Figure S3) categorized as moderately rapid (41.8%), slightly rapid (24.7%), moderately slow (19.1%), rapid (10.9%), and slow (3.4%). AW (%) ranged from 4.26 to 25.17, with spatial classes (Supplementary Figure S4) of moderate (41.0%), high (39.2%), very high (15.9%), and low (3.9%). BD (g cm−3) spanned from 1.12 to 1.72, distributed as moderate (62.5%), high (36.5%), and low (1%) in Supplementary Figure S5. CaCO₃ (%) ranged from 1.46 to 35.04, with spatial classes (Supplementary Figure S6) of moderate (67.9%), slight (21.7%), high (7%), and low (3.6%). Soil pH (unitless) ranged from 7.66 to 8.52, with spatial distribution (Supplementary Figure S7) of alkaline (96.6%) and moderately alkaline (3.4%). ECe (dS m−1) ranged from 0.82 to 7.03, with spatial classes (Supplementary Figure S8) of non-saline (76.2%) and slightly saline (20.1%). Soluble cation concentrations (mmolc L−1) followed the order Na+ > Ca2+ > Mg2+ > K+, with total profile means of 12.00 (Na+), 6.93 (Ca2+), 4.65 (Mg2+), and 1.12 (K+), while soluble anion concentrations (mmolc L−1) followed the order Cl− > SO₄2− > HCO₃−, with total profile means of 11.68 (Cl−), 11.43 (SO₄2−), and 1.58 (HCO₃−). ESP (unitless) ranged from 2.45 to 10.23. OM ranged from 0.03 to 1.19%. Due to the maximum ESP and OM being below 15 and 4%, respectively, no spatial distribution maps were generated for these soil properties. CEC (cmolc kg−1 soil) ranged from 3.32 to 35.69, with spatial distribution (Supplementary Figure S9) of low (43.3%), moderate (38.6%), and very low (18.1%). Available N (mg kg−1) ranged from 15.64 to 96.17, with spatial classes (Supplementary Figure S10) of low (43.2%), medium (55.2%), and high (1.6%). Available P (mg kg−1) ranged from 2.18 to 9.05, with spatial classes (Supplementary Figure S11) of medium (89.9%) and low (10.1%). Available K (mg kg−1) ranged from 146.38 to 601.39, with spatial classes (Supplementary Figure S12) of medium (81.3%), high (17.0%), and low (0.2%).
3.2 Land evaluation
3.2.1 Land capability
The spatial distribution of land capability classes in the study area, illustrated in Figure 3, categorizes the land into two main classes based on Supplementary Table S3: C2 (good, comprising 29% of the agricultural area) and C3 (fair, comprising 71%).

Figure 3. Spatial distribution map of land capability classes.
3.2.2 Land suitability for crops
The suitability of the selected 28 crops across the study area was assessed based on the properties of 18 soil profiles and classified into six categories based on Supplementary Table S4. The percentage distribution of each suitability class for each crop is presented in Figure 4, and its spatial distribution maps are presented in Supplementary Figures S13–S40. It is important to highlight that the percentages in Figure 4 are derived by dividing the number of soil profiles in each crop suitability class by the total number of soil profiles (18). In contrast, the percentages in Supplementary Figures S13–S40 represent the proportion of each crop suitability class relative to the total agricultural area, excluding the urban area (Figure 1b).
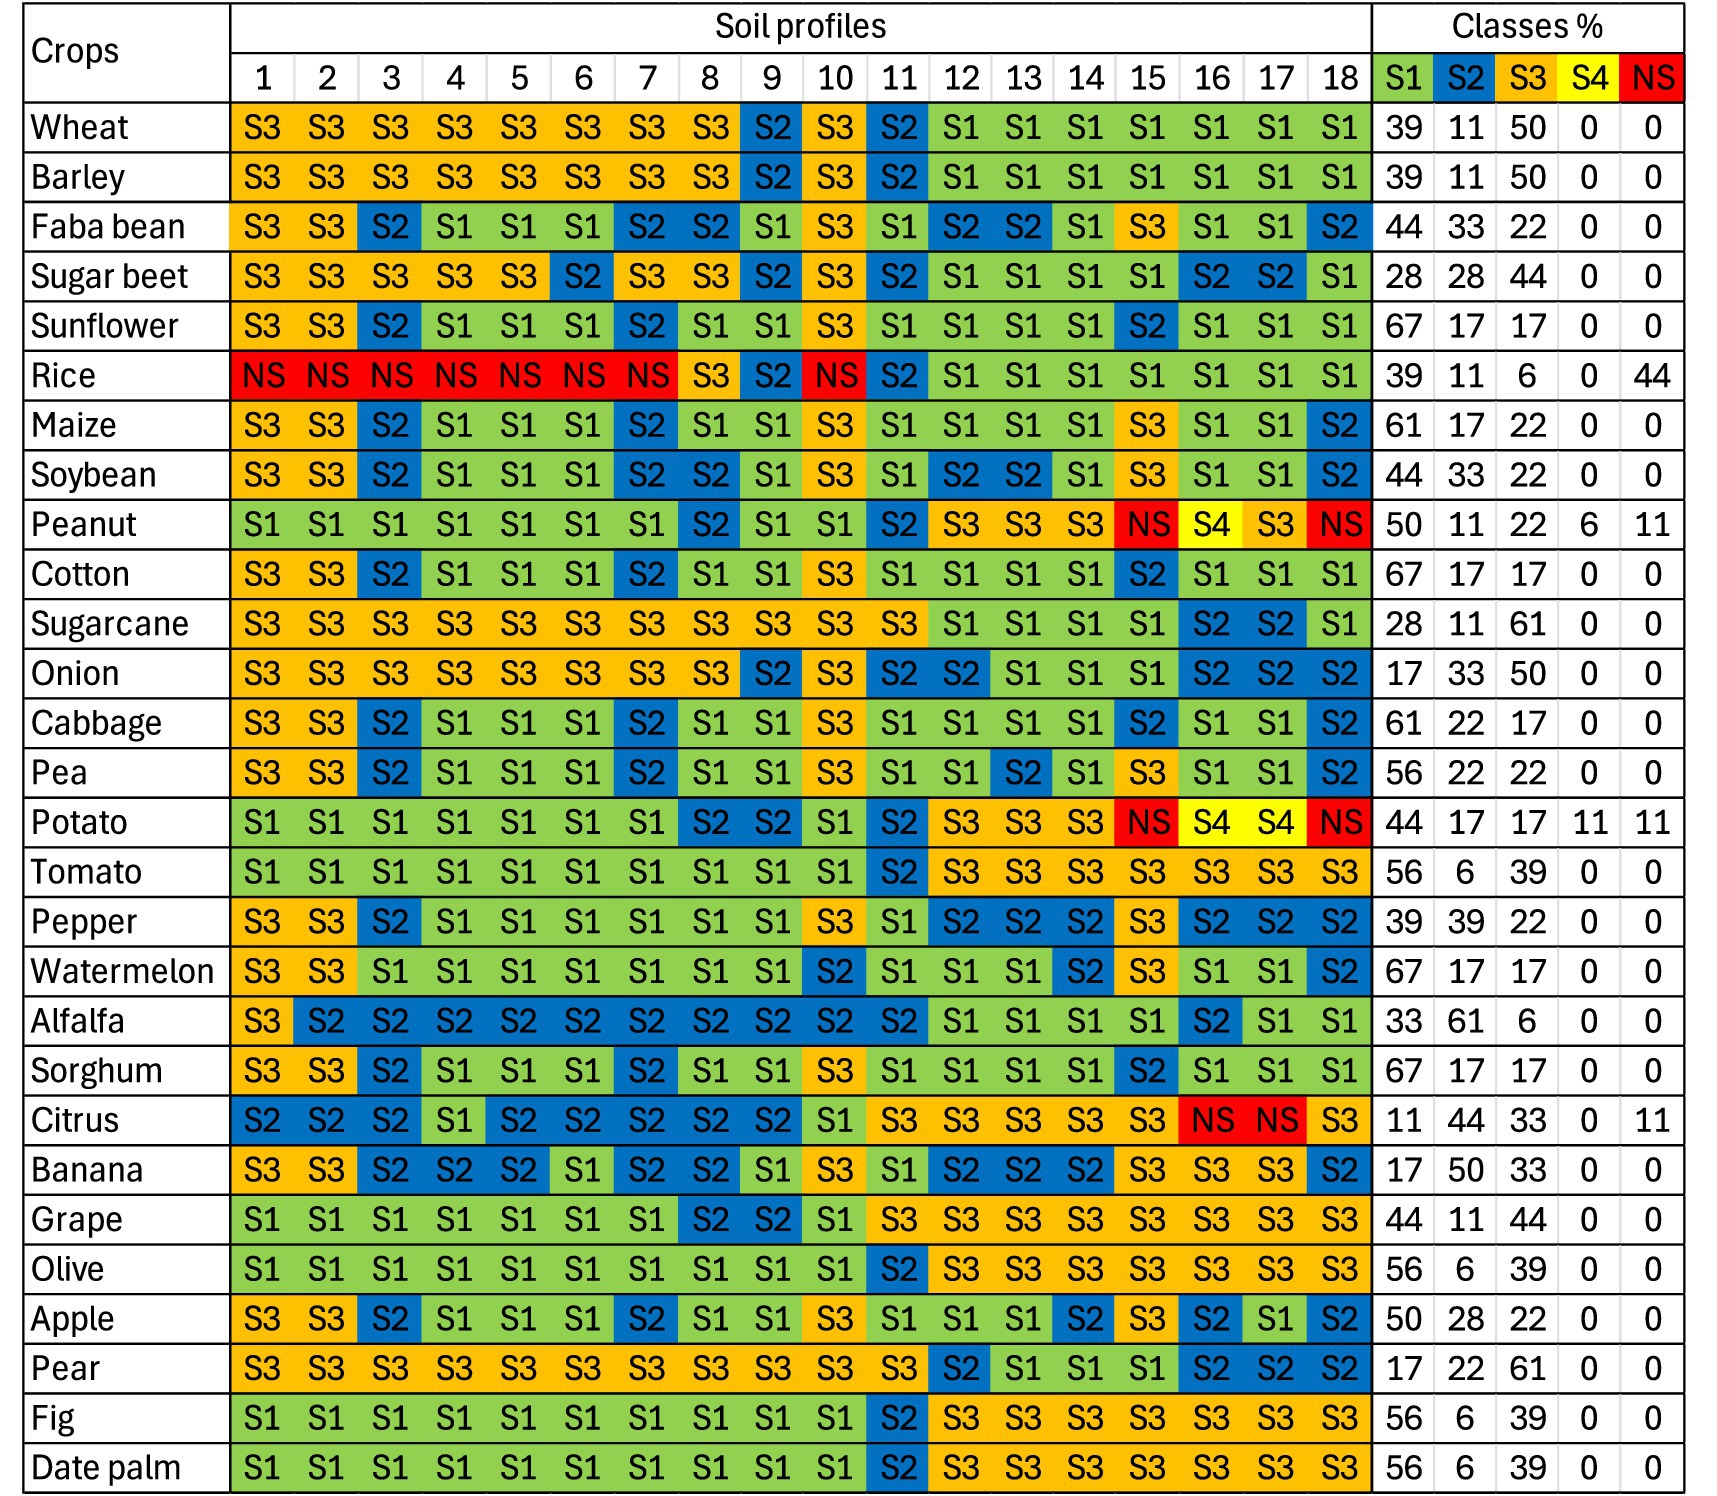
Figure 4. Crop suitability classes of the 28 crops in the study area. S1 (green; highly suitable), S2 (blue; suitable), S3 (orange; moderately suitable), S4 (yellow; marginally suitable), and NS (red; unsuitable). Class percentage (%) shows the proportion of soil profiles per crop suitability class, calculated by dividing each class count by the total number of soil profiles (18). The spatial distribution maps of each crop suitability classification are presented in the Supplementary Figures S13–S40.
Overall, most crops were demonstrated highly suitable to suitable (S1 and S2) across the majority of soil profiles, with rice, peanut, potato, and citrus showing some profiles as unsuitable (NS). It should be noted that crop suitability in the study area is primarily constrained by high hydraulic conductivity (Ks), followed by soil texture (Tex) and, in certain profiles, elevated salinity (ECe). Ks occurred as a limiting factor 299 times (57%) across crop-profile combinations, followed by Tex (210 times; 40%) and ECe (16 times; 3%).
Wheat and barley showed similar suitability classes. Spatial distribution maps (Supplementary Figures S13, S14) illustrate these classes across the study area. S1 class represents 23.1% for wheat and 21.6% for barley, while S2 class occupies 38.9 and 36.8% of agricultural land, respectively. However, for wheat, S3 class covers 38.0% of agricultural land, and for barley, it spans 41.7%. Faba bean and soybean share identical suitability classes distribution. Spatial distribution maps (Supplementary Figures S15, S20) illustrate these classes across the study area. For both crops, the S2 class covers 53.6% of agricultural land, S1 spans 40.0%, and S3 accounts for 6.4%. Sunflower, cotton, watermelon, and sorghum share similar suitability patterns. Spatial distribution maps (Supplementary Figures S17, S22, S30, S32) show their suitability classes across the study area. The S1 class covers 57.6% for sunflower, 61.7% for cotton, 66.1% for watermelon, and 60.5% for sorghum. The S2 class spans 37.5% (sunflower), 34.5% (cotton), 32.9% (watermelon), and 35.6% (sorghum). The S3 class accounts for 4.9% (sunflower), 3.8% (cotton), 1.1% (watermelon), and 3.8% (sorghum). Sugar beet exhibited equal proportions of S1 and S2, with a predominance of S3, while rice proved the least suitable crop, dominated by NS and a substantial S1, but with minimal S2 and S3. Spatial distribution maps illustrate sugar beet suitability classes (Supplementary Figure S16) and rice suitability classes (Supplementary Figure S18) across the study area. For sugar beet, S3 covers 43.4% of agricultural land, S2 spans 42.6%, and S1 accounts for 14.0%. For rice, the NS class (NS1 and NS2 combined) covers 42.7%, S1 spans 18.1%, S2 covers 12.6%, S3 accounts for 11.6%, and S4 spans 15.1%. Maize showed a strong predominance of S1, followed by S3, with a smaller share of S2. Peanut had a balanced S1 and notable S3, with minor S2, S4, and NS portions. Sugarcane mirrored maize in S1 but was dominated by S3, with a small S2 share. Onion leaned heavily toward S3, with a moderate S2 and a smaller S1. Cabbage had a high S1, followed by S2 and a smaller S3. Pea displayed a strong S1, with equal S2 and S3 shares. Potato was led by S1, with equal S2 and S3 shares, and small S4 and NS portions. Spatial distribution maps illustrate suitability classes across the study area for maize (Supplementary Figure S19), peanut (Supplementary Figure S21), sugarcane (Supplementary Figure S23), onion (Supplementary Figure S24), cabbage (Supplementary Figure S25), pea (Supplementary Figure S26), and potato (Supplementary Figure S27). For maize, S1 covers 52.9%, S2 spans 42.1%, and S3 accounts for 5.0%. For peanut, S1 covers 47.0%, S2 spans 28.4%, S3 accounts for 18.6%, S4 spans 3.1%, and NS (NS1 and NS2 combined) totals 2.9%. For sugarcane, S3 covers 53.7%, S2 spans 31.5%, and S1 accounts for 14.8%. For onion, S3 covers 52.6%, S2 spans 43.9%, and S1 accounts for 3.6%. For cabbage, S1 covers 55.7%, S2 spans 39.6%, and S3 accounts for 4.7%. For pea, S2 covers 47.6%, S1 spans 46.2%, and S3 accounts for 6.2%. For potato, S1 covers 45.0%, S2 spans 29.5%, S3 accounts for 19.3%, S4 spans 3.3%, and NS (NS1 and NS2 combined) totals 2.9%. Tomato, olive, fig, and date palm exhibited similar suitability patterns. Spatial distribution maps (Supplementary Figures S28, S36, S39, S40) show their suitability classes across the study area. The S1 class covers 54.2% for tomato, 50.7% for olive, 50.7% for fig, and 50.7% for date palm. The S2 class spans 38.4% (tomato), 40.8% (olive), 40.8% (fig), and 41.8% (date palm). The S3 class accounts for 7.4% (tomato), 8.6% (olive), 8.6% (fig), and 7.5% (date palm). Pepper displayed equal shares of S1 and S2, with a smaller S3 portion. Alfalfa was dominated by S2, followed by S1, with minimal S3. Citrus had a strong S2 presence, followed by S3, with smaller S1 and NS shares. Banana leaned heavily toward S2, with moderate S3 and smaller S1. Grape showed balanced S1 and S3, with a minor S2 share. Apple was led by S1, followed by S2, with a smaller S3. Pear was predominantly S3, with smaller S2 and S1 portions. Spatial distribution maps illustrate suitability classes across the study area: pepper (Supplementary Figure S29), alfalfa (Supplementary Figure S31), citrus (Supplementary Figure S33), banana (Supplementary Figure S34), grape (Supplementary Figure S35), apple (Supplementary Figure S37), and pear (Supplementary Figure S38). For pepper, S2 covers 63.7%, S1 spans 31.5%, and S3 accounts for 4.8%. For alfalfa, S2 covers 82.4%, S1 spans 15.7%, and S3 accounts for 1.9%. For citrus, S2 covers 67.1%, S3 spans 26.4%, S4 accounts for 3.7%, S1 spans 0.6%, and NS (NS1 and NS2 combined) totals 2.2%. For banana, S2 covers 81.8%, S3 accounts for 13.3%, and S1 spans 5.0%. For grape, S2 covers 47.5%, S1 spans 31.0%, and S3 accounts for 21.6%. For apple, S2 covers 52.2%, S1 spans 41.4%, and S3 accounts for 6.4%. For pear, S3 covers 56.0%, S2 spans 36.5%, and S1 accounts for 7.5%.
3.3 Crop water requirements
From 2019 to 2024, the average seasonal ETc and CWR for 28 crops, including three sugar beet cycles and dual-season cycles for pepper, cabbage, tomato, and potato, were evaluated across three irrigation systems (Table 2). The coefficient of variation (CV) of water requirements from 2024 to 2029 was less than 4%. Sprinkler irrigation reduces CWR by ~20.4% compared to surface irrigation, with a consistent 20% reduction for 33 of 34 crops, except for rice (33.33% reduction). Drip irrigation achieves a ~ 29.8% CWR reduction, ranging from 29.41 to 29.42% for 33 crops, with rice at 41.17%. Note that sprinkler and drip irrigation systems are unsuitable for crops like rice, though results are included for comparison. As surface irrigation dominates the study area, the results focus on this system to reflect its prevalence.
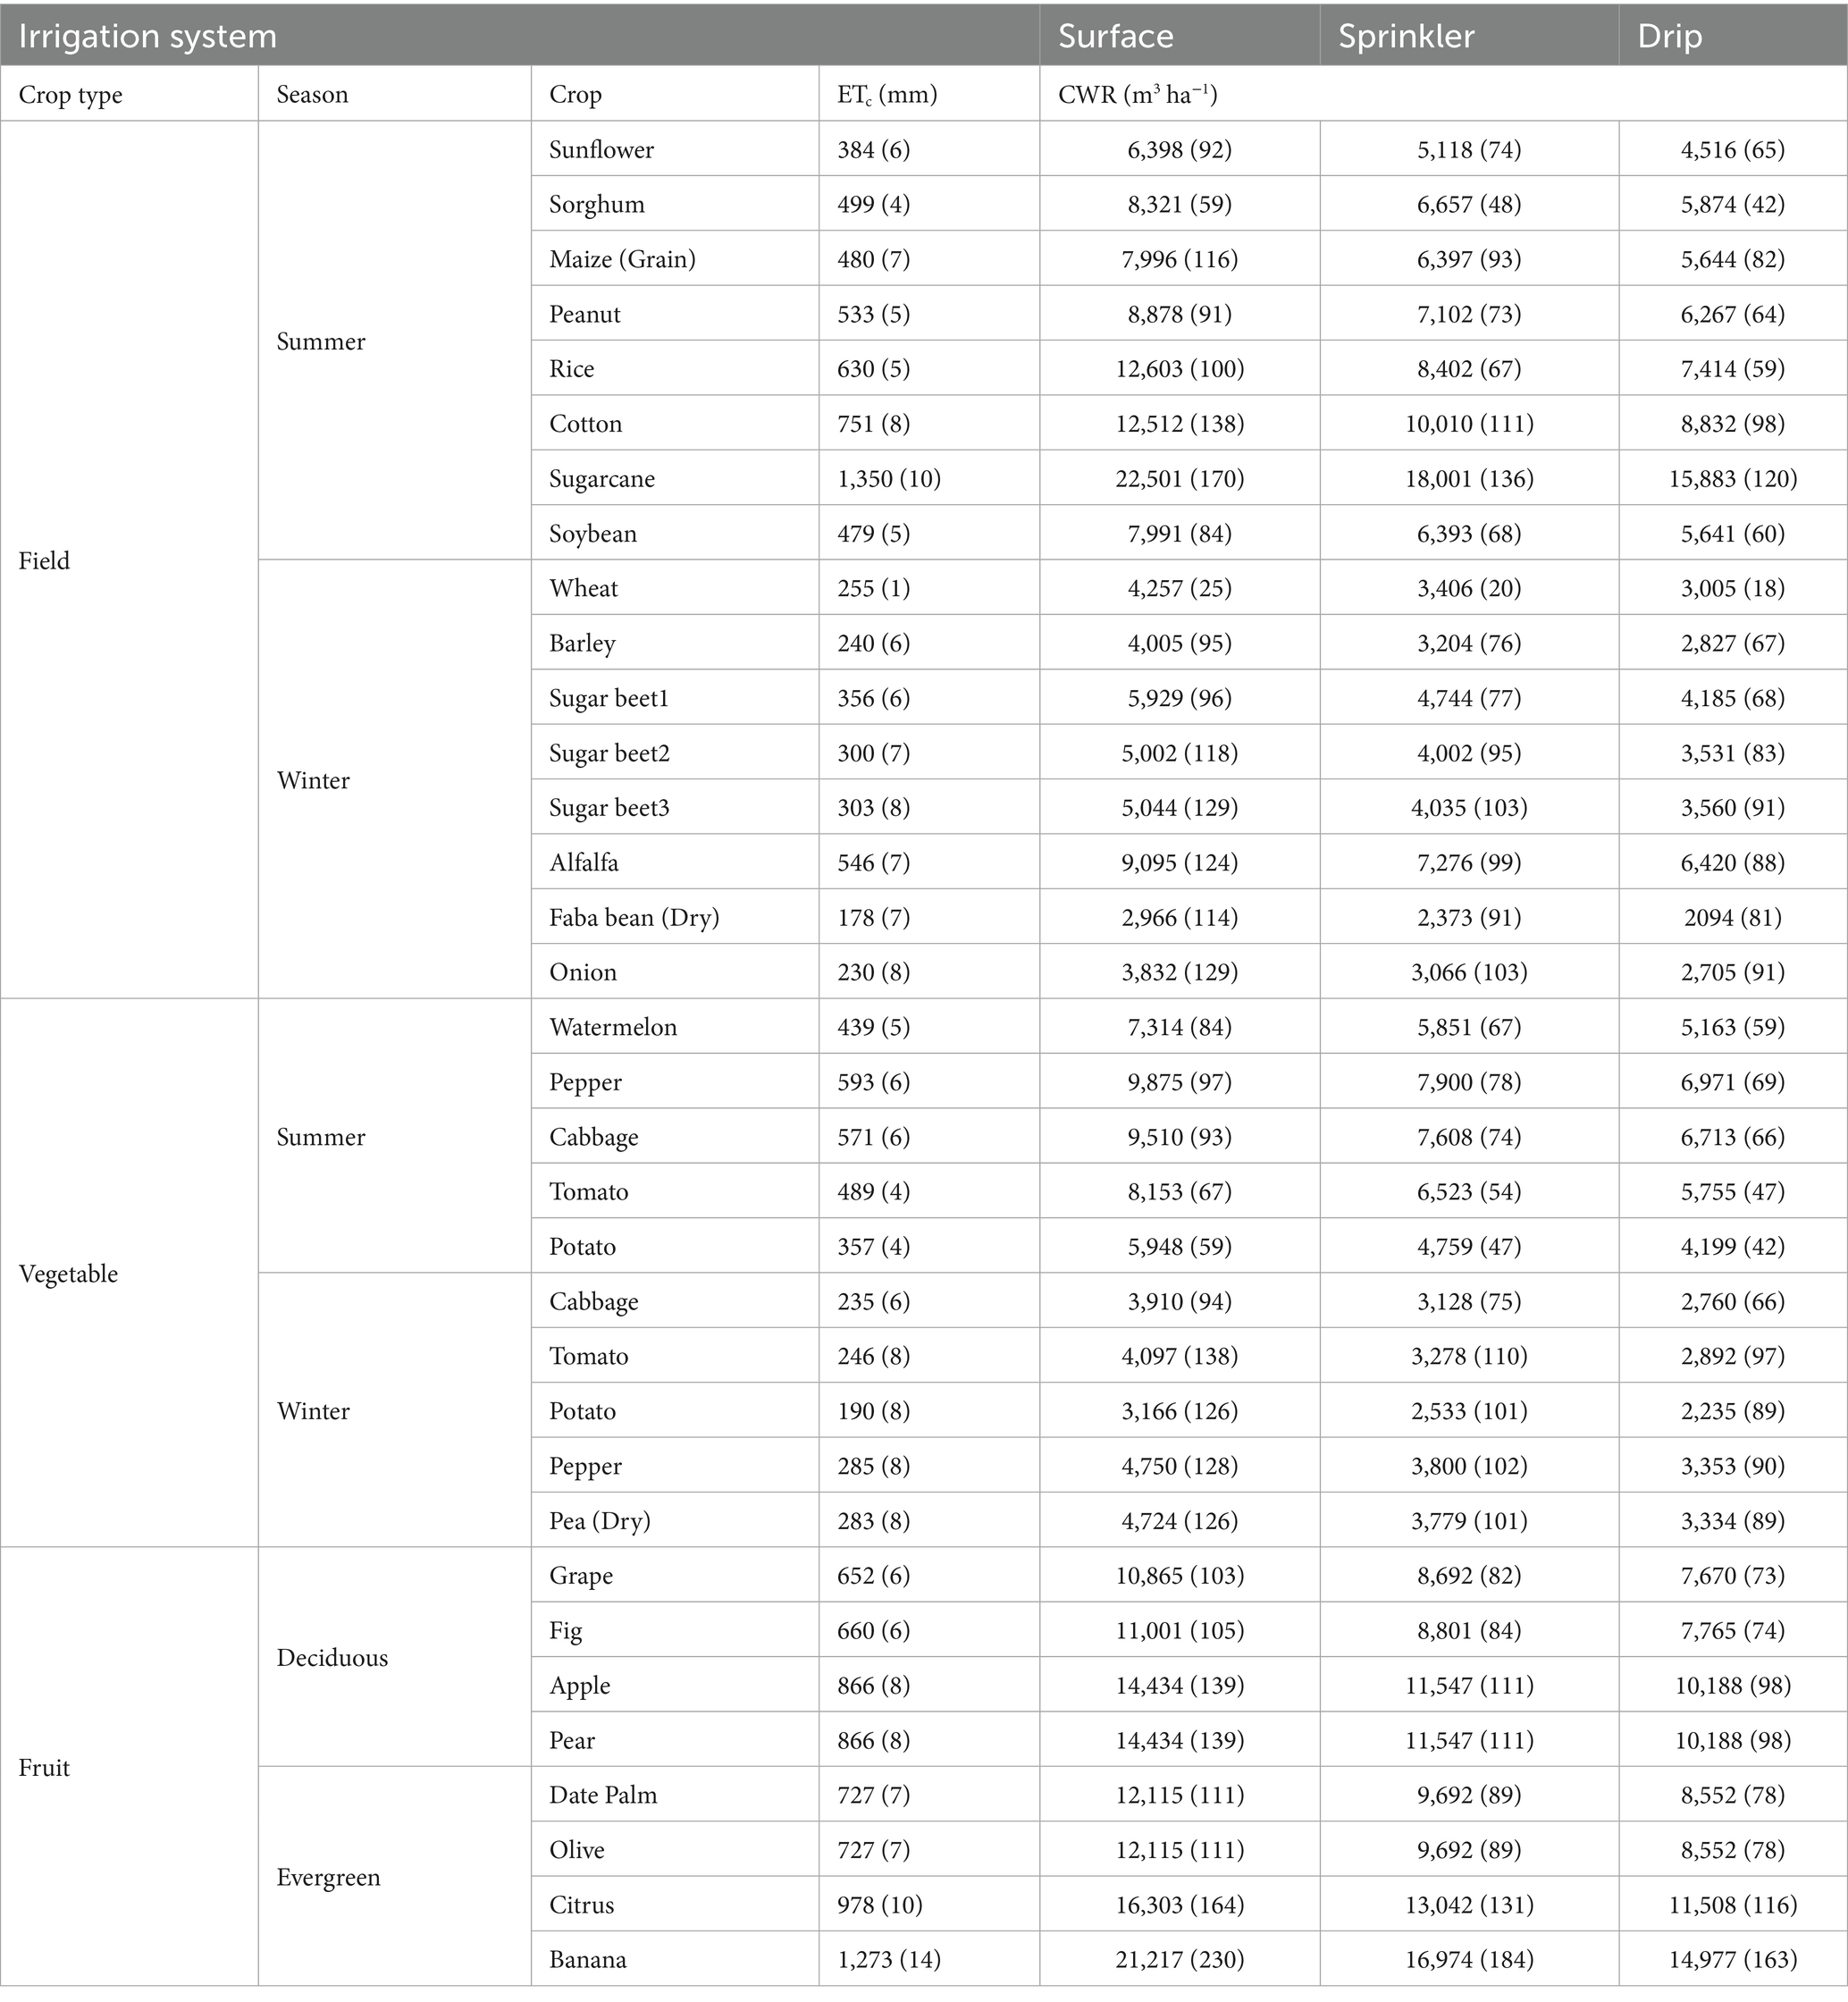
Table 2. Mean (standard deviation) seasonal crop evapotranspiration (ETc; mm) and crop water requirement (CWR; m3 ha−1) from 2019 to 2024 in the study area based on Supplementary Tables S6–S10.
Among summer field crops, sugarcane demanded the highest CWR at 22,501 m3 ha−1, driven by its intensive water needs. Rice followed with a substantial CWR of 12,603 m3 ha−1, attributed to its unique flooding requirements. Cotton also showed a significant CWR of 12,512 m3 ha−1. Other summer crops, including sunflower, soybean, maize (grain), sorghum, and peanut, exhibited CWR values ranging from 6,398 m3 ha−1 for sunflower to 8,878 m3 ha−1 for peanut, reflecting their diverse water demands under surface irrigation. Winter field crops under surface irrigation exhibited lower CWR compared with their summer counterparts, reflecting their reduced evaporative demand. Alfalfa recorded the highest CWR among winter crops at 9,095 m3 ha−1, likely due to its extended growing season with multiple cuts. Sugar beet, evaluated across three stages (sugar beet1, sugar beet2, sugar beet3), showed CWR values ranging from 5,002 m3 ha−1 to 5,929 m3 ha−1, varying by growth stage. Other winter crops, including faba bean (dry), onion, barley, and wheat, had CWR values spanning from 2,966 m3 ha−1 for faba bean to 4,257 m3 ha−1 for wheat, highlighting their relatively modest water needs under surface irrigation. Among summer vegetable crops, pepper exhibited the highest CWR at 9,875 m3 ha−1, closely followed by cabbage at 9,510 m3 ha−1, reflecting their substantial water demands. Tomato and watermelon recorded CWR values of 8,153 m3 ha−1 and 7,314 m3 ha−1, respectively, while potato showed the lowest CWR at 5,948 m3 ha−1. On the other hand, for winter vegetable crops, pepper exhibited the highest CWR at 4,750 m3 ha−1, closely followed by dry pea at 4,724 m3 ha−1, reflecting their relatively high water demands. Tomato and cabbage recorded CWR values of 4,097 m3 ha−1 and 3,910 m3 ha−1, respectively, while potato showed the lowest CWR at 3,166 m3 ha−1. Among deciduous fruit trees, apple and pear exhibited the highest CWR at 14,434 m3 ha−1 each, reflecting their substantial water needs. Fig followed closely with a CWR of 11,001 m3 ha−1, while grape recorded the lowest CWR at 10,865 m3 ha−1. For evergreen fruit trees, banana exhibited the highest CWR at 21,217 m3 ha−1, reflecting its substantial water needs for continuous growth. Citrus followed with a CWR of 16,303 m3 ha−1, while date palm and olive recorded identical CWR values of 12,115 m3 ha−1, the lowest among the group.
3.4 Crop fertilizer requirements
Tables 3–5 provide both the recommended NPK fertilizer rates and the actual required NPK ranges (accounting for residual soil NPK before planting) for optimal crop growth on clay and sandy soils, with rationalization of fertilizer consumption. These data highlight the variability in NPK needs driven by soil type, crop physiology, and seasonal differences.

Table 3. Recommended and required crop nitrogen fertilizer (kg N ha−1) for clay and sandy soils in the study area.
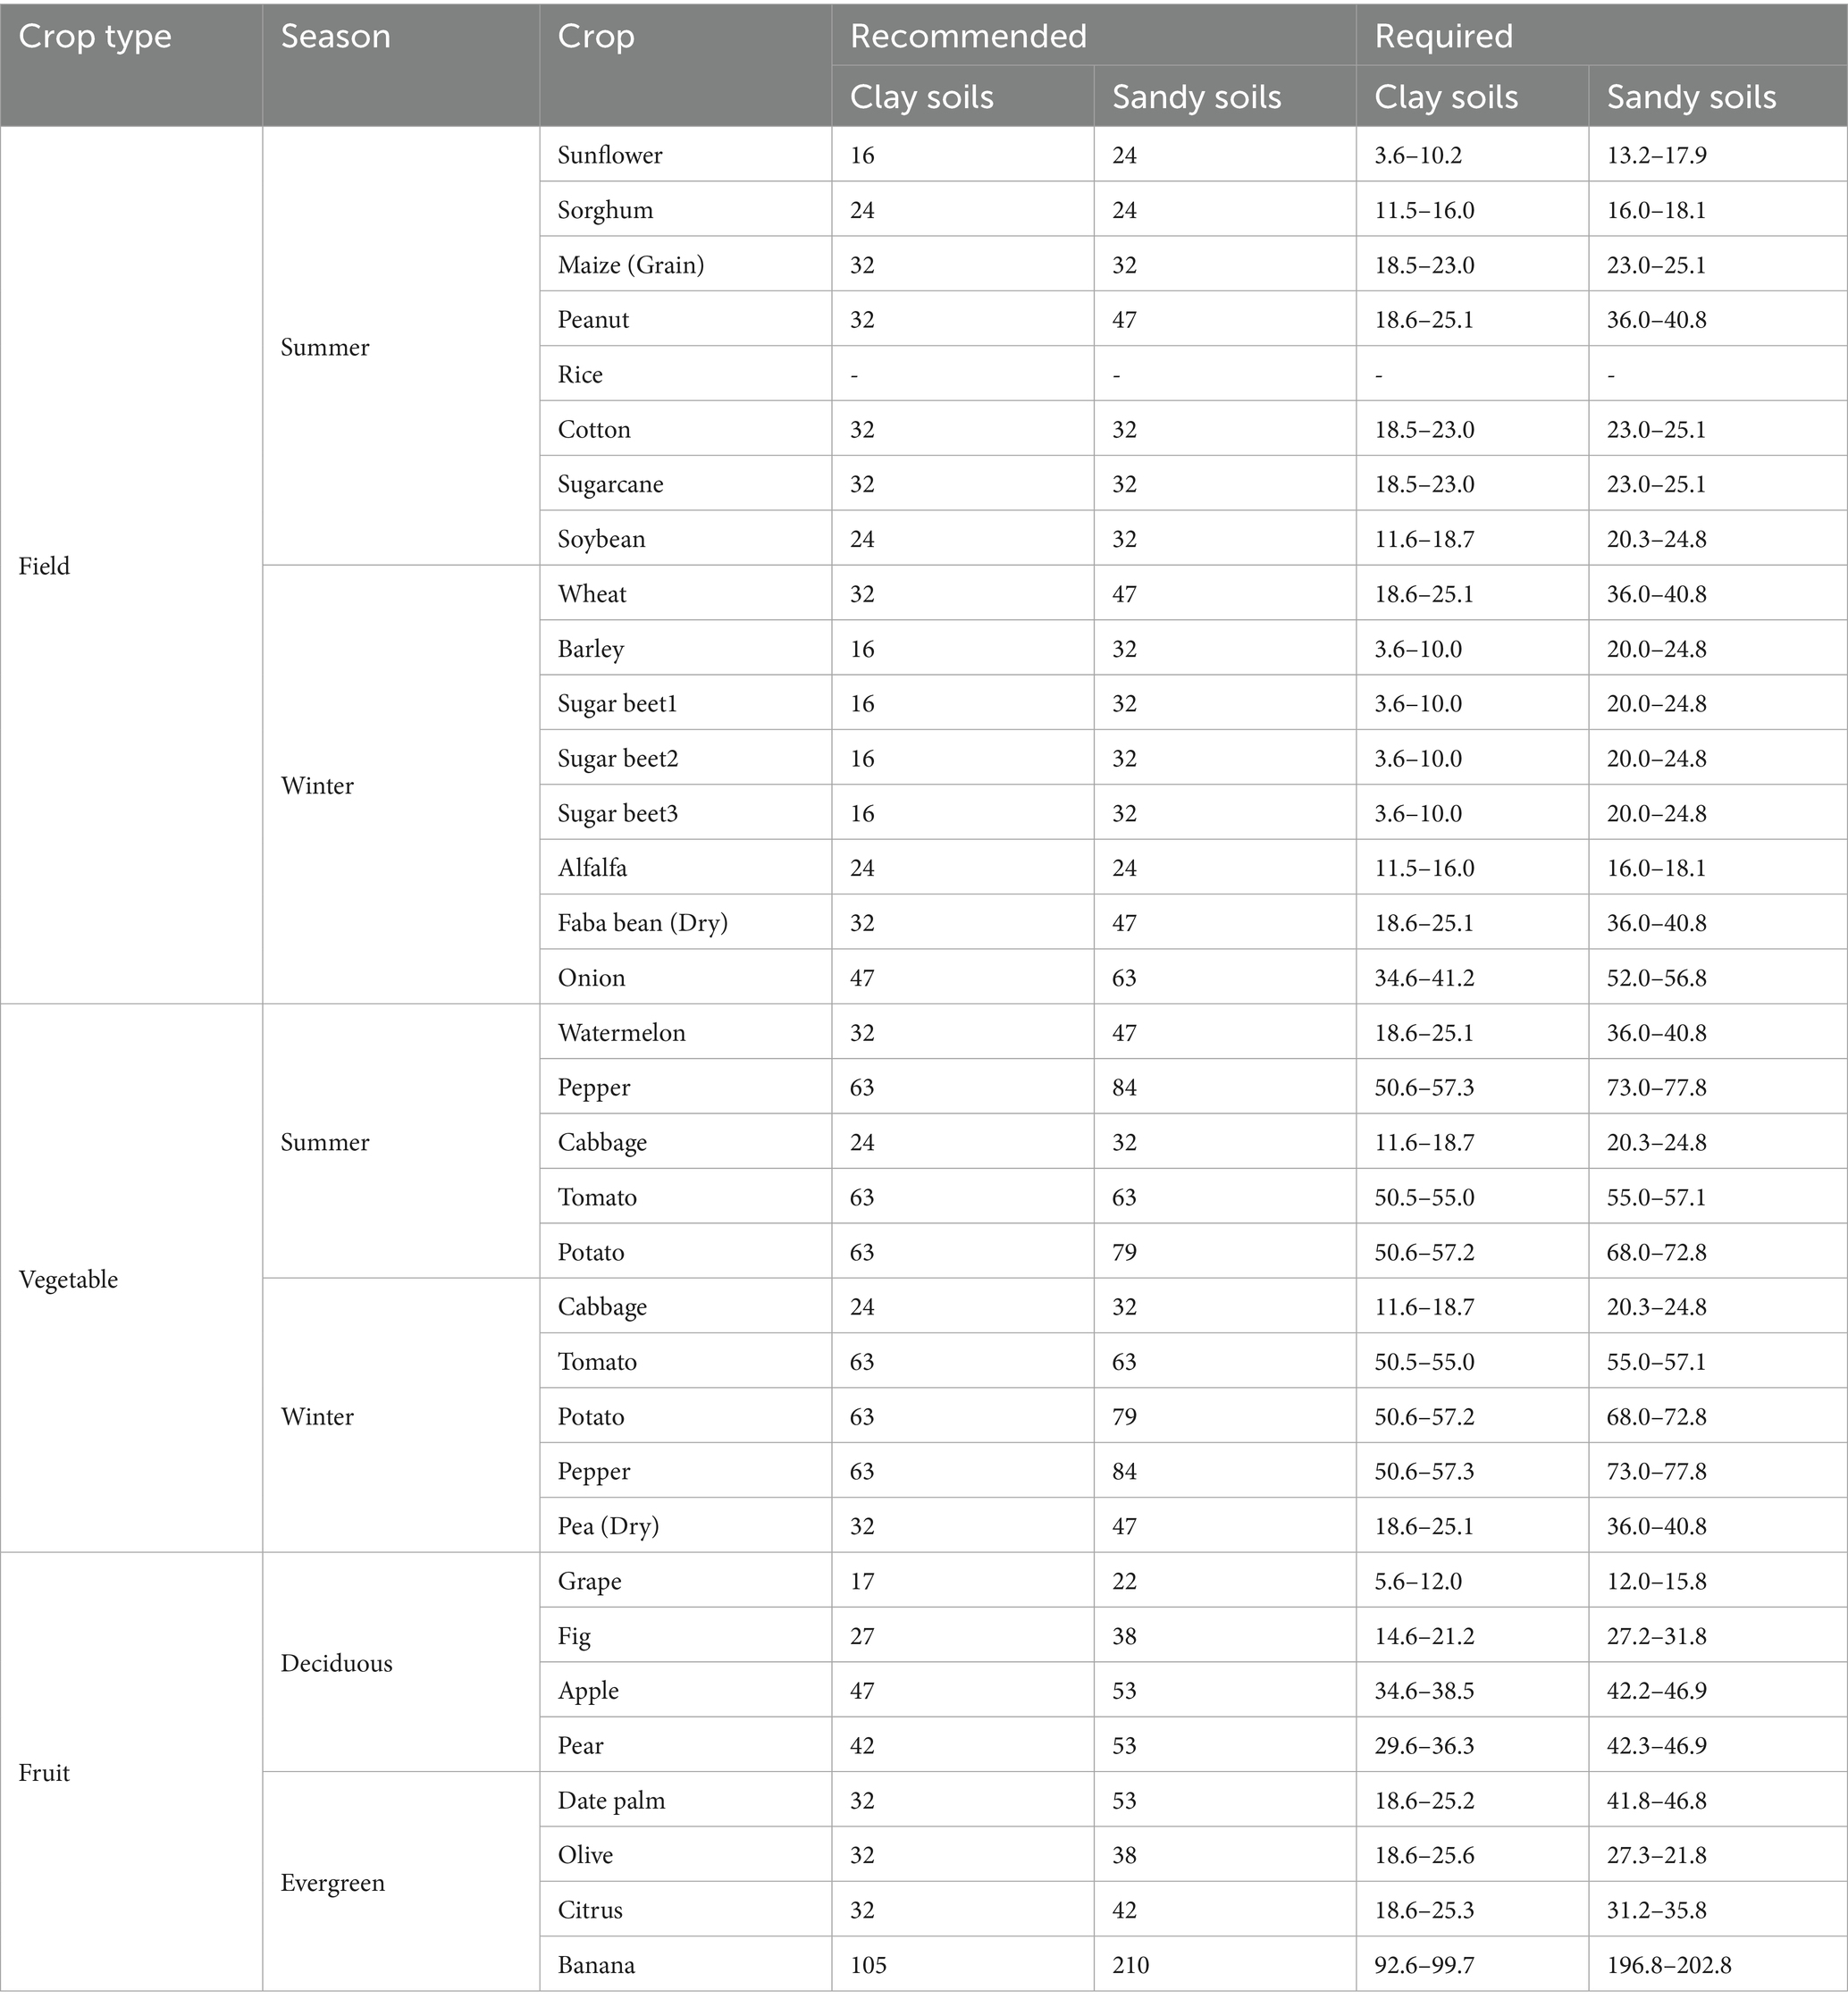
Table 4. Recommended and required crop phosphorus fertilizer (kg P ha−1) for clay and sandy soils in the study area.

Table 5. Recommended and required crop potassium fertilizer (kg K ha−1) for clay and sandy soils in the study area.
Table 3 presents recommended and required nitrogen (N) fertilizer rates (kg N ha−1) for clay and sandy soils, with spatial distribution maps in Supplementary Figures S41–S67. Nitrogen fertilizer savings for various crops on clay and sandy soils demonstrate significant reductions in required nitrogen (N) compared to recommended rates, driven by soil N availability and crop-specific needs. For summer field crops, sunflower achieved the highest savings, with 31–100% on clay and 31–60% on sandy soils, while sorghum saved 5–17% across both soil types. Cotton and sugarcane saw reductions of 31–79% and 11–29% on clay, and 14–28% and 7–13% on sandy soils, respectively. Winter field crops like wheat and barley saved 12–60% and 22–100% on clay, with lower savings on sandy soils (12–23% for wheat, 22–42% for barley). Vegetables exhibited savings of 6–30% for pepper, 12–64% for cabbage, 13–28% for tomato, and 2–38% for potato, with higher savings on clay soils. Among fruit trees, deciduous crops like grape, fig, and pear saved 47–100%, 24–63%, and 25–64% on clay, respectively, while evergreen trees like banana required only 2–10% of the recommended N, with citrus and date palm saving up to 25% more on clay than sandy soils. These savings highlight the potential for optimized N applications, particularly on clay soils, which consistently showed higher savings due to better N retention.
Table 4 details recommended and required phosphorus (P) fertilizer rates (kg P ha−1) for clay and sandy soils, with spatial distribution maps in Supplementary Figures S68–S85. Optimizing phosphorus fertilizer application based on soil type and crop requirements can lead to significant savings. For summer field crops, savings ranged from 13–52% on clay soils and 10–37% on sandy soils, with soybeans achieving the highest savings (22–52% on clay, 23–37% on sand) due to efficient mycorrhizal P uptake. Winter field crops such as barley and sugar beet showed substantial savings of 23–78% across both soil types, while onions saved 12–26% on clay and 10–17% on sand. Vegetable crops, such as tomatoes, exhibited savings of 9–20%, with higher P demands on sandy soils. Deciduous fruit trees such as grapes and figs saved 16–67%, while apples and pears saved 12–26%. Evergreen fruit trees, notably bananas, had lower savings (5–12% on clay, 3–6% on sand) due to high P requirements, with citrus, olive, and date palm saving up to 30% on clay soils. These savings highlight the potential for tailored P applications to reduce costs and environmental impact while maintaining crop productivity.
Table 5 outlines recommended and required potassium (K) fertilizer rates (kg K ha−1) for clay and sandy soils, with spatial distribution maps in Supplementary Figures S86–S88. Optimized potassium fertilizer application enables substantial savings across various crops and soil types due to sufficient residual soil K. Most summer and winter field crops, including sunflower, sorghum, maize, peanut, cotton, sugarcane, soybean, wheat, barley, sugar beet, alfalfa, faba bean, and onion, required no additional K fertilizer, achieving 100% savings of recommended rates (48–285 kg K ha−1) due to adequate soil K availability. Vegetable crops such as watermelon, cabbage, and potato also exhibited 100% savings, with recommended K rates of 79–190 kg K ha−1, except for pepper and tomato on sandy soils, which required 0–52 and 0–82 kg K ha−1, respectively, yielding savings of 79–100%. Pea maintained low K needs (95 kg K ha−1) with 100% savings due to efficient K utilization. Deciduous fruit trees (grape, fig, apple, pear) and most evergreen fruit trees (citrus, olive, date palm) showed adequate K levels, saving 100% of recommended rates (79–296 kg K ha−1). Banana, however, required significant K inputs (537–813 kg K ha−1 on clay, 1,400–1,662 kg K ha−1 on sand), resulting in savings of 16–55% compared to recommended rates (1185–1975 kg K ha−1), reflecting its high K demand. These savings underscore the potential for reduced K fertilization, minimizing costs and environmental impact while leveraging existing soil K reserves.
4 Discussion
4.1 Study area soil
Soil analyses in the study area revealed diverse compositions critical for agricultural management. The observed spatial heterogeneity in soil physicochemical properties, except for soil bulk density and pH, suggests significant variability in soil characteristics across the study area, which may influence ecological processes and management strategies. Soils vary in texture: sandy soils dominate the south due to desert parent material, clayey soils prevail in the northern Nile River region (the Nile Delta) from riverine sedimentation, and medium-textured soils occur in transitional zones (El-Ramady et al., 2019). Clay-rich deeper layers enhance water retention, with the highest available water capacity (Song et al., 2021). Hydraulic conductivity supports drainage, with moderately rapid rates linked to sandy textures (Wang et al., 2023). Finer-textured soils with higher clay content show lower hydraulic conductivity and better water retention due to lower bulk density, while sandy soils exhibit the opposite. Soil pH is predominantly alkaline, with moderate calcium carbonate content in deeper layers limiting nutrient availability, typical for calcareous soils in Egypt (Elbasiouny et al., 2020; EL-Madah et al., 2025). Salinity and sodicity risks are low, with non-saline conditions and exchangeable sodium percentage (ESP) below 15%, fostering favorable crop growth conditions (Kotb et al., 2000; Abdelaal et al., 2021). Low salt content in riverine parent material and high-quality irrigation water contribute to these conditions (Hagage et al., 2024). Soil fertility is limited by low organic matter (OM) and moderate cation exchange capacity (CEC), necessitating organic amendments (Zhang et al., 2023; Culas et al., 2025). Macronutrients (N, P, K) are moderately available, especially in clay-rich northern areas, due to adsorption on clay particles (Abdelaty et al., 2023). Calcium carbonate, primarily from weathered parent material, affects only 7% of the area significantly, which does not adversely impact cultivated crops (Wassif and Wassif, 2021). Prolonged cultivation and standard-rate fertilizer use lead to nutrient accumulation, increasing costs and environmental risks. Precision fertilizer mapping is recommended to optimize nutrient use and promote sustainability. Management should focus on organic and bio-fertilization to enhance nitrogen fixation and solubilize phosphorus and potassium, in addition to precise irrigation to improve fertility and water retention (Srivastava et al., 2024; Cao et al., 2025).
4.2 Land evaluation
4.2.1 Land capability
The study area is classified into two land capability classes, C2 and C3. The C3 class is limited by texture (Tex), available water (Aw), hydraulic conductivity (Ks), cation exchange capacity (CEC), organic matter (OM), nitrogen (N), and phosphorus (P), which vary across different regions, with some areas exhibiting all these factors and others only a subset. The C2 class is limited by hydraulic conductivity (Ks), organic matter (OM), nitrogen (N), and phosphorus (P), with regional variations. To address these limitations, region-specific strategies are crucial. For example, applying organic amendments such as compost or cover crops can enhance soil organic matter, nitrogen, phosphorus, structure, and water retention (Luo et al., 2018). In areas with low hydraulic conductivity, implement drainage systems or conservation tillage to mitigate waterlogging (Brunel-Saldias et al., 2018). Additionally, adopting crop rotation and agroforestry improves soil health and promote sustainable productivity (Iheshiulo et al., 2023).
4.2.2 Land suitability for crops
Suitability analysis for crops indicates a highly favorable agricultural landscape, with most crops rated as highly suitable (S1), suitable (S2), and moderately suitable (S3). The spatial distribution underscores the prevalence of highly suitable and suitable zones, reflecting significant agricultural potential. Rice exhibits significant unsuitability (NS) across much of the study area due to its requirement for flooded conditions, which are incompatible with the region’s slightly rapid to rapid soils. The limiting factors for rice suitability include soil texture (Tex) for the NS class, both Tex and hydraulic conductivity (Ks) for the S3 class, and Ks for the S2 class. Similarly, citrus, peanuts, and potatoes also show localized unsuitability (NS) in certain areas due to calcium carbonate for citrus and Tex for peanuts and potatoes. These findings align with previous studies conducted near the study area (AbdelRahman et al., 2022; Abuzaid et al., 2025). These findings suggest that while the study area is broadly conducive to diverse crop production, certain crops, such as wheat, barley, alfalfa, faba bean, maize, sunflower, cotton, watermelon, and sorghum, are particularly well-suited and could serve as focal points for agricultural planning. For less adaptable crops such as rice, peanut, potato, and citrus, targeted soil management practices–including the addition of organic amendments to enhance soil structure (Pan et al., 2025), incorporation of water-retention materials (Frioni et al., 2025), adoption of modern irrigation systems (Rodrigues et al., 2013), incorporating agricultural sulfur in calcium carbonate-affected areas to combat salinity (Abd El-Aziz et al., 2025), prioritizing salt leaching (Shaddad et al., 2019), and cultivating salt-tolerant crop varieties (Elsawy et al., 2018) can significantly improve soil suitability and crop performance. Such strategies align with recommendations for optimizing agricultural output in Egyptian arid regions (Darwish and Kawy, 2014; El Behairy et al., 2022), ensuring that the land’s potential is fully realized while addressing the specific needs of more sensitive crops.
4.3 Crop water requirements
The analysis of CWR for the selected crops under surface irrigation from 2019 to 2024 reveals a broad spectrum of water demands influenced by crop physiology, seasonal evaporative demand, and growth patterns. The low coefficient of variation in CWR from 2024 to 2029 indicates a high degree of stability and predictability in water demand across the study period, which could facilitate consistent planning and resource allocation. Among the studied crops, wheat, barley, maize, and alfalfa, which are critical for food security and livestock feed, stand out due to their significant agricultural importance. These crops, alongside others such as sugarcane, banana, and rice, exhibit notably high water demands, driven by their vigorous growth, continuous evapotranspiration, or, in the case of rice, unique flooding requirements. In contrast, winter crops such as faba bean and potato demonstrate substantially lower water needs, reflecting the reduced evaporative demand in cooler seasons. Wheat and barley, as staple winter field crops, are vital for ensuring food security in Egypt’s agricultural landscape (Barnes, 2025). Their water requirements, while moderate compared to summer crops, are critical to sustaining high yields in the face of the region’s arid conditions (Elkot et al., 2024; Elsayed et al., 2025). These crops benefit from soils with adequate nutrient levels, which support their growth with relatively low water inputs compared to high-demand crops such as sugarcane (Ashour et al., 2025). Alfalfa, another key winter crop, plays a crucial role in livestock feed production due to its extended growing season and multiple harvests. Its water demand, though higher than that of wheat and barley (Ibrahim et al., 2025), remains significant due to its prolonged growth cycle, making efficient water management essential for its cultivation. Sugarcane, banana, and rice, primarily summer crops, require substantial water to support their intensive growth and high evapotranspiration rates. Rice, in particular, is challenged by the study area’s slightly rapid to rapid soils, which are less suited to its flooding needs, resulting in lower suitability for cultivation (Elsadek et al., 2025). Conversely, winter crops such as faba bean and potato thrive with minimal water requirements (Hegab et al., 2014; Fayed et al., 2018; Abdel-Hameed et al., 2022; Badr et al., 2022), aligning with their high suitability for cultivation in areas with favorable soil conditions, such as moderate nutrient availability and moderate water retention. Summer crops such as sunflower, cotton, and sorghum also show moderate water needs (Ouda et al., 2015; Salem, 2015; Badawi et al., 2016; Ali et al., 2024) and benefit from soils with adequate water-holding capacity, contributing to their high suitability for cultivation. The adoption of sprinkler and drip irrigation systems offers significant potential for water savings compared to the predominant surface irrigation method (Darouich et al., 2014; Muharomah et al., 2025). Modern irrigation systems reduce water use by a considerable margin, while drip irrigation proves even more efficient, optimizing water application across most crop types except for rice (Rodrigues et al., 2013; Guo and Li, 2024). This is particularly critical for high-water-demand crops, where efficient irrigation can enhance productivity while addressing Egypt’s water scarcity challenges (Elsayed et al., 2025). These findings are consistent with studies on soils under arid conditions in Egypt (Soliman, 2020; Elnashar et al., 2021; Gabr, 2022a; Gabr, 2022b), which emphasize the importance of efficient irrigation and soil amendments to balance high water demands with soil limitations.
4.4 Crop fertilizer requirements
The analysis of CFR for the studied crops across clay and sandy soils in Egypt’s arid agricultural context reveals significant variability in NPK needs, driven by soil type, crop physiology, and residual soil nutrients, with implications for sustainable nutrient management under fragmented land ownership and small-scale crop cultivation (Ganzour et al., 2020; Elsharkawy et al., 2022). Wheat, barley, and alfalfa, key crops in the region, demonstrate distinct nutrient demands, with soil testing revealing opportunities for substantial fertilizer savings to optimize resource use in this water-scarce environment. The CFR for nitrogen is high compared to phosphorus and potassium due to the rapid loss of nitrogen from the soils of Egypt (Elrys et al., 2019), either through leaching or volatilization caused by high temperatures (Wang et al., 2021; Drame et al., 2023). Additionally, the nitrogen requirements in sandy soils are significantly higher than in clayey soils due to greater leaching rates and their low organic matter content (Vinten et al., 1994; Tahir and Marschner, 2017). Nitrogen demands were notably high for banana, sorghum, and vegetables such as pepper, reflecting their intensive growth and high consumptive water requirements (Dorel et al., 2008; Sowiński and Głąb, 2018; Elrys et al., 2019; Gouda et al., 2021). Wheat and barley require moderate to high N (Walsh et al., 2022; Rogers et al., 2025), with sandy soils needing more (e.g., wheat: high range, barley: moderate range) than with clay soils (wheat: moderate range, barley: low to adequate), due to lower N retention in sandy soils (Herzog and Konrad, 1992; Chivenge et al., 2011; Abo-Steet, 2019). Alfalfa, a legume, showed lower N needs, particularly on clay soils (moderate range), benefiting from biological N fixation, similar to faba bean and soybean, which required minimal N (Hegazi and Fayez, 2001; Wang et al., 2025). This aligns with their high suitability ratings, supporting efficient N management. Most of the study area suffers from phosphorus availability due to the fixation of phosphorus caused by calcium carbonate, coupled with high soil pH (Geng et al., 2022). Consequently, most areas require moderate additions of phosphate fertilizers. Despite the annual application of large quantities of phosphate fertilizers, phosphorus is easily fixed in the soil due to calcium carbonate, high soil pH, and soil fine particles, and consequently remains unavailable for plant uptake. Therefore, this study recommends the use of biofertilization, including phosphorus-solubilizing bioagents, besides the application of the actual mineral phosphate requirements (Cheng et al., 2023). Phosphorus needs were elevated for banana and vegetable crops such as pepper (Pan et al., 2011; Cândido et al., 2025), with sandy soils requiring more P (e.g., peanut: high range vs. moderate on clay) due to lower adsorption capacity driven by low OM, CEC, calcium carbonate fixation, and high soil pH, rendering P less available (El-Egami et al., 2017; Alhaj Hamoud et al., 2024). Wheat, barley, and alfalfa showed moderate P requirements (Reineke and Steffens, 2022; Yan et al., 2024), with sandy soils demanding higher inputs (wheat and barley: high range; alfalfa: low to moderate) than with clay soils (wheat and barley: moderate; alfalfa: low). Alfalfa’s efficient P utilization on clay soils suggests residual P availability, reducing fertilizer needs (Zhang et al., 2024). Potassium requirements were minimal for most crops, including wheat, barley, and alfalfa, which showed adequate K levels across both soil types due to sufficient residual K in the study area’s soils, particularly in clay soils where K is absorbed and exchanged. Traditional practices of adding K fertilizers without accounting for soil reserves have led to accumulation, especially in clayey soils (Simonsson et al., 2007; Ahmed et al., 2020). Exceptions include banana, pepper, and tomato, which required significant K, with banana showing the highest demand (high range in both soils) due to its intensive growth and fruit production (Fratoni et al., 2017; Bayındır and Küçükyumuk, 2025). Also, most crops showed no need for potassium fertilization due to their sufficient availability in the studied soil. However, the current study recommends applying stimulatory doses. Significant NPK savings, particularly for wheat (high N savings on clay), barley (very high N savings), and alfalfa (moderate N and P savings), underscore the importance of pre-season soil testing to tailor NPK fertilization (Ganzour et al., 2020; Schut and Giller, 2020). For example, reducing nitrogen fertilizer use while simultaneously applying organic fertilizer can optimize crop yield, water productivity, and nitrogen metabolism (Zhang et al., 2025). These findings align with research on the soils of Egypt under arid conditions, emphasizing tailored fertilization and organic amendments to address low OM and high pH, besides interest in bio-fertilization as a solvent for nutrients in sustainable crop production (El-Egami et al., 2017; Cao et al., 2025).
4.5 Suitable crops with lower CWR and CFR
In the context of sustainable agricultural planning, identifying crops that combine high suitability with minimal resource demands is essential for optimizing productivity while conserving water and reducing fertilizer inputs, particularly in regions facing water scarcity and soil nutrient management challenges (Pisante et al., 2012; Taheri et al., 2024). The SRQI provides a metric to evaluate resource efficiency, with higher SRQI values indicating better suitability and lower resource demands (Figure 5). For summer field crops, sunflower stands out as the top recommendation, driven by its high suitability and relatively low CWR combined with minimal CFR, making it an excellent choice for optimizing productivity while conserving resources. Soybean follows closely, presenting a viable alternative with good suitability and moderate resource needs, while maize (grain) and cotton, along with sorghum and peanut, are less competitive. Sugarcane, however, is the least recommended due to its high CWR and substantial CFR, which could intensify soil nutrient depletion and water stress. For winter field crops, faba bean (dry) emerges as the top choice, leveraging high suitability, low CWR, and efficient CFR, making it ideal for nitrogen-fixing benefits and reduced irrigation needs. Sugar beet offers a solid alternative option with a consistent resource profile, followed by barley and wheat, with alfalfa trailing behind. However, onion should be avoided in resource-constrained plans due to its high CFR despite a lower CWR. For summer vegetable crops, watermelon is the top performer due to its high suitability and minimal CFR, as it relies primarily on organic fertilizer, though its higher CWR compared to potato necessitates careful water management. Cabbage follows as a secondary choice, offering a balanced profile, while potato and tomato are less competitive; nutrient-intensive pepper is the least favorable due to its high input demands. Among winter vegetable crops, cabbage again excels, featuring low CWR and moderate CFR, establishing it as a versatile, resource-efficient option across seasons for consistent yields with minimal inputs. Pea provides a nitrogen-enriching alternative, while potato and tomato lag behind; pepper, again, continues to reflect summer trends of inefficiency due to high resource needs. Among deciduous fruit trees, grape stands out as the premier recommendation, boasting acceptable suitability and notably low CWR and CFR, thereby fostering long-term orchard sustainability. Fig follows as a reliable secondary option, while apple offers a moderate alternative; however, pear is considered suboptimal due to its lower suitability and higher resource demands. Evergreen fruit trees, olive and date palm, lead, highlighting moderate suitability paired with outstanding resource efficiency–marked by minimal CFR and CWR–making them ideal for arid climates. Citrus provides a strong mid-tier choice, whereas banana is strongly discouraged due to its extraordinarily high CWR and CFR, which pose significant risks of straining soil and water resources.

Figure 5. Suitability-resources quality index (SRQI) of the 28 crops in the study area.
Table 6 provides percentage changes in CWR, CFR, and SRQI for the top two highly suitable crops in unoptimized and optimized scenarios across crop type-season categories, reinforcing the effectiveness of the optimization process in enhancing resource efficiency and crop suitability. For field crops, summer optimization (shifting from sunflower and cotton to sunflower and soybean) achieves a 24% CWR reduction, 35% CFR reduction, and 18% SRQI increase, while winter field crops (from alfalfa and faba bean to faba bean and sugar beet) show a more pronounced 34% CWR reduction, 45% CFR reduction, and 36% SRQI increase, highlighting significant resource savings and suitability improvements. Summer vegetable crops (cabbage and watermelon in both scenarios) exhibited no changes in CWR, CFR, or SRQI, indicating an already optimal selection. Winter vegetable crops (from cabbage and pepper to cabbage and pea) maintained CWR (0% reduction) but achieved a substantial 66% CFR reduction and 38% SRQI increase, reflecting a focus on nutrient efficiency. For deciduous fruit trees (from apple and fig to grape and fig), there is a 14% CWR reduction, 34% CFR reduction, and a remarkable 159% SRQI increase, while evergreen fruit trees (from banana and olive to olive and date palm) achieve a 27% CWR reduction, 88% CFR reduction, and 94% SRQI increase, underscoring the elimination of high-input crops such as banana. These results illustrate that optimization via SRQI provides a framework for agricultural planning in resource-constrained settings. Although socioeconomic status was not explicitly examined in the SRQI analysis, factors such as income levels (derived from yield price expectations) and education (which may influence knowledge and adoption of specific crops) likely play a significant role in shaping farmers’ crop selection decisions (Miriti and Lambarraa-Lehnhardt, 2025; Vilakazi et al., 2025). These variables could indirectly drive the observed patterns and outcomes in this study, indicating that integrating socioeconomic factors into future research could yield a more nuanced and comprehensive understanding of the economic and social dynamics underlying crop choice behavior. Crop suitability analysis evaluates soil and climate to identify highly suitable crops that maximize yield potential. SRQI refines this by integrating CWR and CFR, prioritizing crops, and balancing acceptable yields with minimal resource use. However, this involves trade-offs between efficiency and yield. For instance, soybean, ranked second among optimized summer field crops (S1 + S2 = 78), drops to fourth in unoptimized suitability behind sunflower, cotton, and sorghum (S1 + S2 = 83), reflecting a 6.02% reduction in suitability. Similarly, substituting banana with olive or date palm substantially lowers both CWR and CFR, yet decreases overall suitability by 8.95%. Hence, SRQI-driven optimization boosts sustainability in resource-scarce settings, but it may reduce the yield by decreasing the crop suitability index. However, this yield trade-off may be offset by substantial reductions in input costs, including irrigation water and fertilization (CWR and CFR). Therefore, integrating an economic viability index into SRQI, factoring in yield-price expectations and market dynamics, would enhance crop selection, balancing water efficiency, fertilizer use, and yield for sustainable, economically viable agriculture.

Table 6. Percentage changes in CWR, CFR, and SRQI for unoptimized and optimized top two highly suitable crops in the study area.
4.6 Implications, uncertainties, and limitations
The SRQI framework provides a tool for advancing sustainable agriculture in Egypt’s arid regions by integrating crop suitability, CWR, and CFR for better crop selection. Policy measures could include targeted subsidies for SRQI-recommended crops to encourage adoption, alongside the development of regional SRQI databases to support data-driven decision-making. Technologies such as drip irrigation, precision soil testing, organic amendments, and biofertilization can significantly improve resource efficiency, addressing challenges such as low soil organic matter and nutrient deficiencies, thereby bolstering agricultural resilience in arid environments. However, the framework’s effectiveness is tempered by uncertainties. Spatial variability in soil profiles introduces challenges, as the current dataset may not fully capture the heterogeneity of the study area. Similarly, CWR derived from ERA5 reanalysis data may not adequately reflect localized microclimates. These uncertainties underscore the need for more granular data to enhance the SRQI’s predictive accuracy. Key limitations of the current framework include its exclusion of rice from fertilizer mapping due to the crop’s limited suitability in arid conditions. The framework also omits socioeconomic factors, such as farmer decision-making processes, market access, and economic incentives. Additionally, the absence of sesame–a regionally significant crop–from the ALES-arid suitability framework limits the model’s applicability to the study area. To address these gaps, future research should prioritize expanded soil sampling efforts to better characterize soil variability (Radočaj et al., 2021; Safaee et al., 2024). Incorporating localized climate data would improve CWR estimates (Ippolito et al., 2024; Bodjrènou et al., 2025). Integrating socioeconomic dimensions, including farmer behavior and market dynamics (Nde et al., 2024; Hao et al., 2025), is critical for better implementation. Furthermore, accounting for climate change impacts on CWR would enhance the SRQI framework’s long-term relevance (Gabr, 2023; Roushdi, 2024). By addressing these uncertainties and limitations, the SRQI can evolve into a more comprehensive tool for sustainable agricultural development in Egypt’s arid regions and similar study areas.
5 Conclusion
This study provides a framework for sustainable agricultural management in an arid region of Egypt by mapping physicochemical soil properties, land capability, crop suitability, CWR, and CFR for a diverse set of crops. The analysis revealed a varied soil landscape with heavy and light textures, moderate water retention, and adequate drainage, but challenges, such as low organic matter content and high pH, necessitate targeted interventions. For sustainable agriculture in resource-scarce regions, selecting crops with high suitability and low CWR and CFR is critical. The SRQI framework recommended sunflower and soybean for summer cropping systems due to their favorable soil suitability and moderate resource requirements. In the winter season, faba bean and sugar beet are ideal choices, benefiting from low CWR and CFR, with faba bean contributing to sustainability through nitrogen fixation and both crops leveraging reduced evaporative water loss. For vegetable crops, watermelon, cabbage, and pea are optimal across seasons, balancing high suitability and efficient resource use, with pea further enhancing sustainability via nitrogen fixation. Among fruit trees, deciduous grape and fig, alongside evergreen olive and date palm, are recommended for their moderate CWR and CFR, with drip irrigation significantly improving water use efficiency and supporting long-term orchard viability. However, the study has notable limitations that must be acknowledged. The geographical scope is confined to a specific arid region in Egypt. Additionally, the resource requirement calculations rely on simplified assumptions, such as ERA5 meteorology data. Socioeconomic factors, such as farmer decision-making and market access, were not considered, and key regional crop, such as sesame, was excluded from the ALES-arid suitability framework. To address these methodological gaps, expanded soil sampling is needed to better capture soil heterogeneity. Integrating localized climate data would improve the accuracy of CWR estimates. Incorporating socioeconomic factors would enhance the framework’s practical relevance for farmers and policymakers. These targeted research directions will build on the current study to foster resilient and sustainable agricultural systems in arid regions.
Data availability statement
The original contributions presented in the study are included in the article/Supplementary material, further inquiries can be directed to the corresponding author.
Author contributions
SG: Conceptualization, Data curation, Formal analysis, Investigation, Methodology, Project administration, Resources, Software, Validation, Visualization, Writing – review & editing. TG: Supervision, Writing – review & editing. AE: Conceptualization, Data curation, Formal analysis, Funding acquisition, Investigation, Methodology, Resources, Software, Validation, Visualization, Writing – original draft, Writing – review & editing.
Funding
The author(s) declare that financial support was received for the research and/or publication of this article. The open-access publication fee was funded by the University of Kassel, Germany, through its Open Access Publication Fund.
Acknowledgments
We express our heartfelt gratitude to the staff of Google Earth Engine and Google Colaboratory for their invaluable support with data access and processing environments. We also extend our sincere appreciation to the Soils, Water, and Environment Research Institute (SWERI), Agricultural Research Center (ARC), Giza 12619, Egypt, for their logistical support, software, and laboratory analyses. We gratefully acknowledge the University of Kassel, Kassel 34109, Germany, for subsidizing the open access publication fee for this work via its open access publication fund.
Conflict of interest
The authors declare that the research was conducted in the absence of any commercial or financial relationships that could be construed as a potential conflict of interest.
The reviewer AMSK declared a shared affiliation with the author SG to the handling editor.
Generative AI statement
The author(s) declare that no Gen AI was used in the creation of this manuscript.
Any alternative text (alt text) provided alongside figures in this article has been generated by Frontiers with the support of artificial intelligence and reasonable efforts have been made to ensure accuracy, including review by the authors wherever possible. If you identify any issues, please contact us.
Publisher’s note
All claims expressed in this article are solely those of the authors and do not necessarily represent those of their affiliated organizations, or those of the publisher, the editors and the reviewers. Any product that may be evaluated in this article, or claim that may be made by its manufacturer, is not guaranteed or endorsed by the publisher.
Supplementary material
The Supplementary material for this article can be found online at: https://www.frontiersin.org/articles/10.3389/fsufs.2025.1703891/full#supplementary-material
References
Abd El-Aziz, M. A., Abd Elghany, S. H., Elbagory, M., El-Gamal, B. A., AbdEl-Khalek, A. A., AbdEl-Azeem, S. M., et al. (2025). Enhancing soil health and crop performance under saline-sodic calcareous soil: A comparative study of Nano-sulfur and mineral sulfur combined with compost application. Agronomy 15. doi: 10.3390/agronomy15030510
Abd El-Kawy, O. R., Flous, G. M., Abdel-Kader, F. H., and Suliman, A. S. (2019). Land suitability analysis for crop cultivation in a newly developed area in Wadi Al-Natrun, Egypt. Alexandria Sci. Exch. J. 40, 683–693. doi: 10.21608/asejaiqjsae.2019.67870
Abd El-Kawy, O. R., Ismail, H. A., Rod, J. K., and Suliman, A. S. (2010). A developed GIS-based land evaluation model for agricultural land suitability assessments in arid and semi-arid regions. Res. J. Agric. Biol. Sci. 6, 589–599.
Abdelaal, S. M. S., Moussa, K. F., Ibrahim, A. H., Mohamed, E. S., Kucher, D. E., Savin, I., et al. (2021). Mapping spatial management zones of salt-affected soils in arid region: a case study in the east of the Nile Delta, Egypt. Agronomy 11. doi: 10.3390/agronomy11122510
Abdelaty, E. F., Abd-El-Hady, A. M., and Shehata, E. A. (2023). Soil fertility evaluation and fertilizer requirements of nitrogen, phosphorus and potassium for wheat production (Sharq El-Owainat – Western South Egypt). Alexandria Sci. Exch. J. 44, 419–431. doi: 10.21608/asejaiqjsae.2023.315235
Abdel-Hameed, A. M., Abuarab, M. E., Al-Ansari, N., Mehawed, H. S., Kassem, M. A., He, H., et al. (2022). Winter potato water footprint response to climate change in Egypt. Atmos. 13. doi: 10.3390/atmos13071052
Abdelkader, M., Sliuzas, R., Boerboom, L., and Zevenbergen, J. (2022). The unintended consequences of Egypt's institutional land regime on unplanned settlement growth in the Nile Valley. Land Use Policy 113:105887. doi: 10.1016/j.landusepol.2021.105887
AbdelRahman, M. A. E., Saleh, A. M., and Arafat, S. M. (2022). Assessment of land suitability using a soil-indicator-based approach in a geomatics environment. Sci. Rep. 12:18113. doi: 10.1038/s41598-022-22727-7,
Abo-Steet, S. Y. M. (2019). Improvement of sandy soil characteristics and its productivity of wheat crop using organic and mineral-N fertilization. Menoufia J. Soil Sci. 4, 37–56. doi: 10.21608/mjss.2019.174204
Abshiba, K., Sharma, V. K., Kumar, P., Syam, S., Barnwal, P. P., and Kumar, S. (2025). A comprehensive review of soil quality indicators under diverse land uses in rainfed areas. Discover Soil 2:91. doi: 10.1007/s44378-025-00109-5
Abuzaid, A. S., Abbas, H. H., Mostafa, M. A., El Ghonamy, Y. K., Rebouh, N. Y., and Shokr, M. S. (2025). A comprehensive crop suitability assessment under modern irrigation system in arid croplands. PLoS One 20:e0326183. doi: 10.1371/journal.pone.0326183,
Ahmed, A., Aftab, S., Hussain, S., Nazir Cheema, H., Liu, W., Yang, F., et al. (2020). Nutrient accumulation and distribution assessment in response to potassium application under maize–soybean intercropping system. Agronomy 10. doi: 10.3390/agronomy10050725
Akpoti, K., Kabo-bah, A. T., and Zwart, S. J. (2019). Review - agricultural land suitability analysis: state-of-the-art and outlooks for integration of climate change analysis. Agric. Syst. 173, 172–208. doi: 10.1016/j.agsy.2019.02.013
Akter, S., Ahmed, J. U., Begum, I. A., Sarkar, M. A. R., Fatema, K., Mahmud, A., et al. (2025). Integrated farming system-a means of improving farmers’ well-being in the wetland ecosystem of Bangladesh. Farming System 3:100127. doi: 10.1016/j.farsys.2024.100127
Alhaj Hamoud, Y., Shaghaleh, H., Zhang, K., Okla, M. K., Alaraidh, I. A., Sheteiwy, M. S., et al. (2024). Increasing soil clay content increases soil phosphorus availability and improves the growth, physiology, and phosphorus uptake of rice under alternative wetting and mild drying irrigation. Environ. Technol. Innov. 35:103691. doi: 10.1016/j.eti.2024.103691
Ali, A. A., Lamlom, S. F., Elmahdy, A. M., Abd Elghany, S. H., Usman, M., Alamri, A., et al. (2024). Boosting resilience and yields in water-stressed sunflower through coordinated irrigation scheduling and silica gel applications. Heliyon 10:e38129. doi: 10.1016/j.heliyon.2024.e38129,
Allen, R. G., Pereira, L. S., Howell, T. A., and Jensen, M. E. (2011). Evapotranspiration information reporting: I. Factors governing measurement accuracy. Agric. Water Manag. 98, 899–920. doi: 10.1016/j.agwat.2010.12.015
Allen, R., Pereira, L. S., Raes, D., and Smith, M. (1998). Crop evapotranspiration: Guidelines for computing crop water requirements. (Eds.) Richard, G. A., Luis, S. P., Dirk, R., and Martin, S. Rome, Italy: Food and Agriculture Organization.
Arora, N. K., and Mishra, I. (2022). Sustainable development goal 6: global water security. Environ. Sustain. 5, 271–275. doi: 10.1007/s42398-022-00246-5
Arora, N. K., and Mishra, I. (2024). Life on land: progress, outcomes and future directions to achieve the targets of SDG 15. Environ. Sustain. 7, 369–375. doi: 10.1007/s42398-024-00330-y
ASCE (2025). Evapotranspiration terminology and definitions. J. Irrig. Drain. Eng. 151:06025003. doi: 10.1061/JIDEDH.IRENG-10491
ASCE-EWRI (2005). “The ASCE standardized reference evapotranspiration equation” in ASCE-EWRI standardization of reference evapotranspiration task committee report. (Eds.) Richard, G. A., Ivan, A. W., Ronald, L. E., Terry, A. H., Daniel, I., Marvin, E. J., et al. Virginia, USA.
Ashour, M. A., Ali, Y. M., Hasan, A. E., and Abu-Zaid, T. S. (2025). A field study on replacing traditional flood irrigation of sugarcane crop in upper Egypt with drip irrigation technique. Appl Water Sci 15:192. doi: 10.1007/s13201-025-02554-7
Awais, M., Wang, X., Hussain, S., Aziz, F., and Mahmood, M. Q. (2025). Advancing precision agriculture through digital twins and smart farming technologies: a review. Agri 7. doi: 10.3390/agriengineering7050137
Azadi, Y., Yaghoubi, J., Gholizadeh, H., Gholamrezai, S., and Rahimi-Feyzabad, F. (2025). Social barriers to water scarcity adaptation: a grounded theory exploration in arid and semi-arid regions. Agric. Water Manag. 309:109338. doi: 10.1016/j.agwat.2025.109338
Badawi, M. I., Abdelkhalek, A. A. A., Abd El-Latif, K. M., Ali, S. A., and Abdou, S. M. M. (2016). Evaluating water productivity of sunflower crop under different locations in Egypt. Menoufia J. Soil Sci. 1, 147–162. doi: 10.21608/mjss.2016.176635
Badr, M. A., El-Tohamy, W. A., Salman, S. R., and Gruda, N. (2022). Yield and water use relationships of potato under different timing and severity of water stress. Agric. Water Manag. 271:107793. doi: 10.1016/j.agwat.2022.107793
Barnes, J. (2025). The future of staple foods: the case of bread in Egypt. Geogr. Rev. 115, 81–98. doi: 10.1080/00167428.2023.2280656
Bayındır, Ü., and Küçükyumuk, Z. (2025). The effects of potassium on plant nutrient concentration, plant development, and Rhizoctonia rot (Rhizoctonia solani) in pepper. Horticulturae 11:516. doi: 10.3390/horticulturae11050516
Billah, M. M., Rahman, M. M., Mahimairaja, S., Lal, A., Srinivasulu, A., and Naidu, R. (2025). Constraints and prospects of adoption of climate smart agriculture interventions: implication for farm sustainability. Climate Smart Agriculture 2:100066. doi: 10.1016/j.csag.2025.100066
Bodjrènou, R., Sintondji, L. O., N'Tcha, Y. M. P., Germain, D., Azonwade, F. E., Sohindji, F., et al. (2025). Assessment of hydrologic data estimates from ERA5 reanalyses in Benin, West Africa. Geosci. Data J. 12:e288. doi: 10.1002/gdj3.288
Bostani, A., Mohebbi Tafreshi, A., and Bijeh Keshavarzi, M. H. (2025). Assessment of soil fertility and nutrient distribution for enhanced soil health and field management through an innovative approach. Agrosyst. Geosci. Environ. 8:e70088. doi: 10.1002/agg2.70088
Brunel-Saldias, N., Seguel, O., Ovalle, C., Acevedo, E., and Martínez, I. (2018). Tillage effects on the soil water balance and the use of water by oats and wheat in a Mediterranean climate. Soil Tillage Res. 184, 68–77. doi: 10.1016/j.still.2018.07.005
Cai, B., Shi, F., Geremew, B. A., Addis, A. K., Abate, M. C., Dessie, W., et al. (2025). Precision agriculture techniques for optimizing chemical fertilizer use and environmental sustainability: a systematic review. Front. Agron. 7. doi: 10.3389/fagro.2025.1665444
Cândido, H. T., Leonel, M., Leonel, S., Fernandes, A. M., Souza, J. M., dos Ouros, L. F., et al. (2025). A sustainable approach to phosphorus nutrition in banana plantations. Plants 14. doi: 10.3390/plants14131923
Cao, H., Yang, Y., Gao, Y., Liu, J., Ma, S., and Duan, A. (2025). Organic amendments combined with moderate nitrogen rate significantly enhance soil fertility and crop productivity. J. Agric. Food Res. 23:102211. doi: 10.1016/j.jafr.2025.102211
Cheng, Y., Narayanan, M., Shi, X., Chen, X., Li, Z., and Ma, Y. (2023). Phosphate-solubilizing bacteria: their agroecological function and optimistic application for enhancing agro-productivity. Sci. Total Environ. 901:166468. doi: 10.1016/j.scitotenv.2023.166468,
Chivenge, P., Vanlauwe, B., Gentile, R., and Six, J. (2011). Comparison of organic versus mineral resource effects on short-term aggregate carbon and nitrogen dynamics in a sandy soil versus a fine textured soil. Agric. Ecosyst. Environ. 140, 361–371. doi: 10.1016/j.agee.2010.12.004
Culas, R. J., Anwar, M. R., and Maraseni, T. N. (2025). A framework for evaluating benefits of organic fertilizer use in agriculture. J. Agric. Food Res. 19:101576. doi: 10.1016/j.jafr.2024.101576
Dai, Y., Shangguan, W., Wei, N., Xin, Q., Yuan, H., Zhang, S., et al. (2019). A review of the global soil property maps for earth system models. Soil 5, 137–158. doi: 10.5194/soil-5-137-2019
Damiba, W. A. F., Gathenya, J. M., Raude, J. M., and Home, P. G. (2024). Soil quality index (SQI) for evaluating the sustainability status of Kakia-Esamburmbur catchment under three different land use types in Narok County, Kenya. Heliyon 10:e25611. doi: 10.1016/j.heliyon.2024.e25611,
Darouich, H. M., Pedras, C. M. G., Gonçalves, J. M., and Pereira, L. S. (2014). Drip vs. surface irrigation: a comparison focussing on water saving and economic returns using multicriteria analysis applied to cotton. Biosyst. Eng. 122, 74–90. doi: 10.1016/j.biosystemseng.2014.03.010
Darwish, K. M., and Kawy, W. A. A. (2014). Land suitability decision support for assessing land use changes in areas west of Nile Delta, Egypt. Arab. J. Geosci. 7, 865–875. doi: 10.1007/s12517-012-0757-5
De la Rosa, D., Moreno, J. A., Garcia, L. V., and Almorza, J. (1992). MicroLEIS: A microcomputer-based Mediterranean land evaluation information system. Soil Use Manag. 8, 89–96.
Deguine, J.-P., Aubertot, J.-N., Flor, R. J., Lescourret, F., Wyckhuys, K. A. G., and Ratnadass, A. (2021). Integrated pest management: good intentions, hard realities. A review. Agron. Sustain. Dev. 41:38. doi: 10.1007/s13593-021-00689-w
Deng, X., Gibson, J., Song, M., Li, Z., Han, Z., Zhang, F., et al. (2024). Agricultural land-use system management: research progress and perspectives. Fundam. Res. doi: 10.1016/j.fmre.2024.10.012
Dorel, M., Achard, R., and Tixier, P. (2008). SIMBA-N: modeling nitrogen dynamics in banana populations in wet tropical climate. Application to fertilization management in the Caribbean. Eur. J. Agron. 29, 38–45. doi: 10.1016/j.eja.2008.02.004
Drame, M., Carswell, A., Roberts, W., Hood, J., Jemo, M., Heuer, S., et al. (2023). Effects of hotter, drier conditions on gaseous losses from nitrogen fertilisers. J. Environ. Manag. 345:118671. doi: 10.1016/j.jenvman.2023.118671,
El Baroudy, A. A., Ali, A. M., Mohamed, E. S., and Moghanm, F. S. (2020). Modeling land suitability for rice crop using remote sensing and soil quality indicators: the case study of the Nile Delta. Sustainability 12:9653. doi: 10.3390/su12229653
El Behairy, R. A., El Baroudy, A. A., Ibrahim, M. M., Mohamed, E. S., Kucher, D. E., and Shokr, M. S. (2022). Assessment of soil capability and crop suitability using integrated multivariate and GIS approaches toward agricultural sustainability. Land 11:1027. doi: 10.3390/land11071027
Elbasiouny, H., Elbehiry, F., El-Ramady, H., and Brevik, E. C. (2020). Phosphorus availability and potential environmental risk assessment in alkaline soils. Agriculture 10. doi: 10.3390/agriculture10050172
El-Egami, H. M., El-Tahlawy, Y. A., and El-Sayed, S. Y. S. (2017). Symbiotic nitrogen fixation under integrated organic-mineral nitrogen application on peanut in sandy soil. Egypt. J. Agric. Sci. 68, 333–344. doi: 10.21608/ejarc.2017.212765
Eliasson, A. (2007). Review of land evaluation methods for quantifying natural constraints to agriculture. Ispra (Italy): Publications Office: The Institute for Environment and Sustainability, Joint Research Centre.
Elkot, A. F., Shabana, Y., Elsayed, M. L., Saleh, S. M., Gadallah, M. A. M., Fitt, B. D. L., et al. (2024). Yield responses to total water input from irrigation and rainfall in six wheat cultivars under different climatic zones in Egypt. Agronomy 14. doi: 10.3390/agronomy14123057
EL-Madah, S. A., Ibrahim, M., and Abd El-Halim, A. E.-H. A. (2025). Amendment with a composite of bentonite based nanosulfur and humate reduces the high carbonate levels in calcareous soils. Egypt. J. Soil Sci. 65, 1033–1047. doi: 10.21608/ejss.2025.367557.2053
Elnashar, A., Abbas, M., Sobhy, H., and Shahba, M. (2021). Crop water requirements and suitability assessment in arid environments: a new approach. Agronomy 11:260. doi: 10.3390/agronomy11020260
Elnashar, A., Shojaeezadeh, S. A., and Weber, T. K. D. (2025). A multi-model approach for remote sensing-based actual evapotranspiration mapping using Google earth engine (ETMapper-GEE). J. Hydrol. 657:133062. doi: 10.1016/j.jhydrol.2025.133062
El-Ramady, H., Alshaal, T., Bakr, N., Elbana, T., Mohamed, E., and Belal, A.-A. (2019). (Eds.) Hassan, E-R., Tarek, A., Noura, B., Tamer, E., Elsayed, M., and Abdel-Aziz, B. The soils of Egypt. Gewerbestrasse, Switzerland: Springer.
Elrys, A. S., Raza, S., Abdo, A. I., Liu, Z., Chen, Z., and Zhou, J. (2019). Budgeting nitrogen flows and the food nitrogen footprint of Egypt during the past half century: challenges and opportunities. Environ. Int. 130:104895. doi: 10.1016/j.envint.2019.06.005,
Elsadek, E. A., Elshikha, D. E. M., Awad, A., Hamoud, Y. A., Elsheikha, A. M., Williams, C., et al. (2025). Projecting rice water footprint for different shared socioeconomic pathways under arid climate conditions. Irrig. Sci. 43, 955–969. doi: 10.1007/s00271-025-01019-8
Elsawy, H. I. A., Mekawy, A. M. M., Elhity, M. A., Abdel-dayem, S. M., Abdelaziz, M. N., Assaha, D. V. M., et al. (2018). Differential responses of two Egyptian barley (Hordeum vulgare L.) cultivars to salt stress. Plant Physiol. Biochem. 127, 425–435. doi: 10.1016/j.plaphy.2018.04.012,
Elsayed, M. L., Elkot, A. F., Noreldin, T., Richard, B., Qi, A., Shabana, Y. M., et al. (2025). Optimizing wheat yield and water productivity under water scarcity: a modeling approach for irrigation and cultivar selection across different agro-climatic zones of Egypt. Agric. Water Manag. 317:109668. doi: 10.1016/j.agwat.2025.109668
Elsharkawy, M. M., Nabil, M., Farg, E., and Arafat, S. M. (2022). Impacts of land-use changes and landholding fragmentation on crop water demand and drought in Wadi El-Farigh, New Delta project, Egypt. Egypt. J. Remote Sens. Space Sci. 25, 873–885. doi: 10.1016/j.ejrs.2022.08.002
ESA (2023). Copernicus Browser. Copernicus Data Space Ecosystem. Available online at: https://browser.dataspace.copernicus.eu [Accessed April 20, 2023].
FAO (1981). A framework for land evaluation. Rome, Italy: Food and Agriculture Organization of the United Nations.
FAO (1998). Crop evapotranspiration: Guidelines for computing crop water requirements irrigation and drainage paper 56. Rome, Italy: Food and Agriculture Organization (FAO).
Farr, T. G., Rosen, P. A., Caro, E., Crippen, R., Duren, R., Hensley, S., et al. (2007). The shuttle radar topography mission. Rev. Geophys. 45. doi: 10.1029/2005rg000183
Fayed, T. B., Abdrabbo, M. A., Hamada, M. M., Hashem, F. A., and Hegab, A. S. (2018). Irrigation requirements of faba-bean under two climatic locations in Egypt. Egypt. J. Agric. Res. 96, 653–664. doi: 10.21608/ejar.2018.135777
Fernández, E. (2023). Editorial note on terms for crop evapotranspiration, water use efficiency and water productivity. Agric. Water Manag. 289:108548. doi: 10.1016/j.agwat.2023.108548
Firoiu, D., Ionescu, G. H., Cismaș, C. M., Costin, M. P., Cismaș, L. M., and Ciobanu, Ș. C. (2025). Sustainable production and consumption in EU member states: achieving the 2030 sustainable development goals (SDG 12). Sustainability 17. doi: 10.3390/su17041537
Fratoni, M. M. J., Moreira, A., Moraes, L. A. C., Almeida, L. H. C., and Pereira, J. C. R. (2017). Effect of nitrogen and potassium fertilization on banana plants cultivated in the humid tropical Amazon. Commun. Soil Sci. Plant Anal. 48, 1511–1519. doi: 10.1080/00103624.2017.1373791
Frimpong, F., Asante, M. D., Peprah, C. O., Amankwaa-Yeboah, P., Danquah, E. O., Ribeiro, P. F., et al. (2023). Water-smart farming: review of strategies, technologies, and practices for sustainable agricultural water management in a changing climate in West Africa. Front. Sustain. Food Syst. 7. doi: 10.3389/fsufs.2023.1110179
Frioni, T., Bonicelli, P. G., Ripa, C., and Poni, S. (2025). Soil incorporation of superabsorbent hydrogels to counteract water scarcity: modelling tree physiological and biochemical response. Plant Physiol. Biochem. 223:109775. doi: 10.1016/j.plaphy.2025.109775,
Gabr, M. E. L. S. (2022a). Modelling net irrigation water requirements using FAO-CROPWAT 8.0 and CLIMWAT 2.0: a case study of Tina plain and east south Elkantara regions, North Sinai, Egypt. Arch. Agron. Soil Sci. 68, 1322–1337. doi: 10.1080/03650340.2021.1892650
Gabr, M. E. L. S. (2022b). Management of irrigation requirements using FAO-CROPWAT 8.0 model: a case study of Egypt. Model. Earth Syst. Environ. 8, 3127–3142. doi: 10.1007/s40808-021-01268-4
Gabr, M. E. (2023). Impact of climatic changes on future irrigation water requirement in the Middle East and North Africa's region: a case study of upper Egypt. Appl Water Sci 13:158. doi: 10.1007/s13201-023-01961-y
Gamage, A., Gangahagedara, R., Gamage, J., Jayasinghe, N., Kodikara, N., Suraweera, P., et al. (2023). Role of organic farming for achieving sustainability in agriculture. Farming System 1:100005. doi: 10.1016/j.farsys.2023.100005
Ganzour, S. K., Shendi, M. M., Abdallah, A. E. M., and Ismail, M. (2020). Usage of geographic information system for management of soil fertility, Egypt. Int. J. Adv. Remote Sens. GIS. 9, 3331–3349. doi: 10.23953/cloud.ijarsg.473
Gassner, A., Harris, D., Mausch, K., Terheggen, A., Lopes, C., Finlayson, R., et al. (2019). Poverty eradication and food security through agriculture in Africa: rethinking objectives and entry points. Outlook Agricul. 48, 309–315. doi: 10.1177/0030727019888513,
Gelaw, A. M., Singh, B. R., and Lal, R. (2015). Soil quality indices for evaluating smallholder agricultural land uses in northern Ethiopia. Sustainability 7, 2322–2337. doi: 10.3390/su7032322
Geng, Y., Pan, S., Zhang, L., Qiu, J., He, K., Gao, H., et al. (2022). Phosphorus biogeochemistry regulated by carbonates in soil. Environ. Res. 214:113894. doi: 10.1016/j.envres.2022.113894,
Gorelick, N., Hancher, M., Dixon, M., Ilyushchenko, S., Thau, D., and Moore, R. (2017). Google earth engine: planetary-scale geospatial analysis for everyone. Remote Sens. Environ. 202, 18–27. doi: 10.1016/j.rse.2017.06.031
Gouda, F. E.-Z. M., Abdel-Raman, M. A. A., and Salem, E. H. (2021). Influence of different nitrogen fertilizer sources on growth and productivity of Williams banana plants. J. Plant Prod. 12, 613–617. doi: 10.21608/jpp.2021.70766.1026
Guo, H., and Li, S. (2024). A review of drip irrigation’s effect on water, carbon fluxes, and crop growth in farmland. Water 16. doi: 10.3390/w16152206
Hagage, M., Abdulaziz, A. M., Elbeih, S. F., and Hewaidy, A. G. A. (2024). Monitoring soil salinization and waterlogging in the northeastern Nile Delta linked to shallow saline groundwater and irrigation water quality. Sci. Rep. 14:27838. doi: 10.1038/s41598-024-77954-x,
Hao, W., Cao, Y., Hu, X., Zhang, Z., Cai, M., Zhou, H., et al. (2025). Analysis of the impact of price incentives and precipitation fluctuations on maize planting area and yield. Front. Sustain. Food Syst. 9. doi: 10.3389/fsufs.2025.1587677
Harikumaran, M., and Vijayalakshmi, P. (2025). Optimizing fertilizer recommendations in precision agriculture: a novel defuzzification approach with adaptive intelligent optimization. Knowl.-Based Syst. 321:113550. doi: 10.1016/j.knosys.2025.113550
Hegab, A. S. A., Fayed, M. T. B., Hamada, M. M. A., and Abdrabbo, M. A. A. (2014). Productivity and irrigation requirements of faba-bean in North Delta of Egypt in relation to planting dates. Ann. Agric. Sci. 59, 185–193. doi: 10.1016/j.aoas.2014.11.004
Hegazi, N. A., and Fayez, M. (2001). Biological nitrogen fixation to maximize productivity of intercropped legumes and non-legumes: ten years of field experimentations in semi-arid deserts of Egypt. Arch. Agron. Soil Sci. 47, 103–131. doi: 10.1080/03650340109366202
Herzog, H., and Konrad, R. (1992). Nitrogen movement in an arable sandy soil and ways of reducing nitrogen losses - preliminary results. J. Agron. Crop Sci. 169, 135–143.
Hiywotu, A. M. (2025). Advancing sustainable agriculture for goal 2: zero hunger - a comprehensive overview of practices, policies, and technologies. Agroecol. Sustain. Food Syst. 49, 1027–1055. doi: 10.1080/21683565.2025.2451344
Ibrahim, M. A., Khalil, M. A., El-Marsafawy, S. M., and Ibrahim, K. M. A. (2025). Total water allocation for Egyptian clover and alfalfa and their water economics. J. Plant Food Sci. 3, 88–101. doi: 10.21608/jpfs.2025.362056.1026
Iheshiulo, E. M.-A., Larney, F. J., Hernandez-Ramirez, G., Liu, K., and Chau, H. W. (2023). Do diversified crop rotations influence soil physical health? A meta-analysis. Soil Tillage Res. 233:105781. doi: 10.1016/j.still.2023.105781
Ippolito, M., De Caro, D., Cannarozzo, M., Provenzano, G., and Ciraolo, G. (2024). Evaluation of daily crop reference evapotranspiration and sensitivity analysis of FAO penman-Monteith equation using ERA5-land reanalysis database in Sicily, Italy. Agric. Water Manag. 295:108732. doi: 10.1016/j.agwat.2024.108732
Ismail, H. A., Bahnassy, M. H., and Abd El-Kawy, O. R. (2005a). Integrating GIS and modeling for agricultural land suitability evaluation at East Wadi El-Natrun, Egypt. Egypt. J. Soil Sci. 45, 297–322.
Ismail, H. A., Bahnassy, M. H., and Abd El-Kawy, O. R. (2005b). Integrating GIS and modelling for agricultural land suitability evaluation at East Wadi El-Natrun, Egypt. Egypt. J. Soil Sci. 45, 297–322.
Juhos, K., Czigány, S., Madarász, B., and Ladányi, M. (2019). Interpretation of soil quality indicators for land suitability assessment – a multivariate approach for central European arable soils. Ecol. Indic. 99, 261–272. doi: 10.1016/j.ecolind.2018.11.063
Kahsay, A., Haile, M., Gebresamuel, G., and Mohammed, M. (2025). Developing soil quality indices to investigate degradation impacts of different land use types in northern Ethiopia. Heliyon 11:e41185. doi: 10.1016/j.heliyon.2024.e41185,
Karra, K., Kontgis, C., Statman-Weil, Z., Mazzariello, J. C., Mathis, M., and Brumby, S. P. (2021). Global land use / land cover with sentinel 2 and deep learning. IEEE Int. Geosci. Remote Sensing Symposium IGARSS 4704-4707. doi: 10.1109/IGARSS47720.2021.9553499
Keesstra, S., Mol, G., De Leeuw, J., Okx, J., Molenaar, C., De Cleen, M., et al. (2018). Soil-related sustainable development goals: four concepts to make land degradation neutrality and restoration work. Land 7:133. doi: 10.3390/land7040133
Khattak, W. A., Sun, J., Zaman, F., Jalal, A., Shafiq, M., Manan, S., et al. (2025). The role of agricultural land management in modulating water-carbon interplay within dryland ecological systems. Agric. Ecosyst. Environ. 378:109315. doi: 10.1016/j.agee.2024.109315
Kotb, T. H. S., Watanabe, T., Ogino, Y., and Tanji, K. K. (2000). Soil salinization in the Nile Delta and related policy issues in Egypt. Agric. Water Manag. 43, 239–261. doi: 10.1016/S0378-3774(99)00052-9
Kumar, V., Sharma, K. V., Kedam, N., Patel, A., Kate, T. R., and Rathnayake, U. (2024). A comprehensive review on smart and sustainable agriculture using IoT technologies. Smart Agricultural Technol. 8:100487. doi: 10.1016/j.atech.2024.100487
Kushwah, N., Billore, V., Sharma, O. P., Singh, D., and Chauhan, A. P. S. (2024). Integrated nutrient management for optimal plant health and crop yield. Plant Sci. Archives 8, 10–12. doi: 10.51470/PSA.2023.8.2.10
Lal, R., Bouma, J., Brevik, E., Dawson, L., Field, D. J., Glaser, B., et al. (2021). Soils and sustainable development goals of the United Nations: an International Union of Soil Sciences perspective. Geoderma Reg. 25:e00398. doi: 10.1016/j.geodrs.2021.e00398
Lanki, A. D., and Onwu, C. A. (2024). Geographic information system (GIS) application in soil fertility management: a review. J. Global Agricul. Ecol. 16, 29–40. doi: 10.56557/jogae/2024/v16i28592
Luo, G., Li, L., Friman, V.-P., Guo, J., Guo, S., Shen, Q., et al. (2018). Organic amendments increase crop yields by improving microbe-mediated soil functioning of agroecosystems: a meta-analysis. Soil Biol. Biochem. 124, 105–115. doi: 10.1016/j.soilbio.2018.06.002
Lyu, X., Peng, W., Yu, W., Xin, Z., Niu, S., and Qu, Y. (2021). Sustainable intensification to coordinate agricultural efficiency and environmental protection: a systematic review based on metrological visualization. J. Land Use Sci. 16, 313–338. doi: 10.1080/1747423X.2021.1922524
Mahmoud, H., Binmiskeen, A., and Saad Moghanm, F. (2020). Land evaluation for crop production in the banger El-Sokkar region of Egypt using a geographic information system and ALES-arid model. Egypt. J. Soil Sci. 60, 129–143. doi: 10.21608/ejss.2020.19523.1325
MALR (2024). Fertilizer requirements for field crops, horticultural, fiber, and sugar crops. Fertilizer regulations amendment committee (FRAC). Giza, Egypt: Soils, Water and Environment Research Institute (SWERI), Agricultural Research Center (ARC), Ministry of Agriculture and Land Reclamation (MALR).
Mandal, S., Yadav, A., Panme, F. A., and Devi, K. M. (2024). Adaption of smart applications in agriculture to enhance production. Smart Agricultural Technol. 7:100431. doi: 10.1016/j.atech.2024.100431
Mariani, F., and Ciommi, M. (2022). Aggregating composite indicators through the geometric mean: a penalization approach. Computation 10. doi: 10.3390/computation10040064
Meshref, H. A., Ghabour, T. K., Ghali, F. A., Wahba, M. M., and Shahin, S. A. S. (2008). Soil mapping with the aid of remote sensing techniques and GIS. J. Soil Sci. Agricultural Eng. 33, 6191–6201. doi: 10.21608/jssae.2008.200218
Microsoft Corporation (2024). Excel (Microsoft 365 subscription). Washington, USA: Microsoft Corporation.
Minasny, B., and McBratney, A. B. (2010). “Methodologies for global soil mapping” in Digital soil mapping: Bridging research, environmental application, and operation. eds. J. L. Boettinger, D. W. Howell, A. C. Moore, A. E. Hartemink, and S. Kienast-Brown (Dordrecht: Springer Netherlands), 429–436.
Miriti, P. K., and Lambarraa-Lehnhardt, F. (2025). Understanding farmer preferences and trade-offs for adopting sustainable crop production: a systematic review. Discov. Sustain. 6:760. doi: 10.1007/s43621-025-01591-1
Muharomah, R., Setiawan, B. I., Sands, G. R., Juliana, I. C., and Gunawan, T. A. (2025). A review on enhancing water productivities adaptive to the climate change. J. Water Clim. Chang. 16, 860–887. doi: 10.2166/wcc.2025.240
Muhie, S. H. (2022). Novel approaches and practices to sustainable agriculture. J. Agric. Food Res. 10:100446. doi: 10.1016/j.jafr.2022.100446
Muñoz-Sabater, J., Dutra, E., Agustí-Panareda, A., Albergel, C., Arduini, G., Balsamo, G., et al. (2021). ERA5-land: a state-of-the-art global reanalysis dataset for land applications. Earth Syst. Sci. Data 13, 4349–4383. doi: 10.5194/essd-13-4349-2021
Naorem, A., Jayaraman, S., Dang, Y. P., Dalal, R. C., Sinha, N. K., Rao, C. S., et al. (2023). Soil constraints in an arid environment—challenges, prospects, and implications. Agronomy 13. doi: 10.3390/agronomy13010220
Nde, R. K., Fendji, J. L. E. K., Yenke, B. O., and Schöning, J. (2024). Crop selection: a survey on factors and techniques. Smart Agricultural Technol. 9:100602. doi: 10.1016/j.atech.2024.100602
Olsen, S. R., Cole, C. V., and Watanable, F. S. (1954). Estimation of available phosphorus in soils by extraction with sodium bicarbonate. Department of Agriculture: U.S.
Ouda, S., Ewis, M., and Badawi, M. (2015). Water requirements for clover and cotton under climate change conditions. J. Soil Sci. Agricultural Eng. 6, 375–383. doi: 10.21608/jssae.2015.42172
Paccioretti, P., Puntel, L., Córdoba, M., Mieno, T., Ferguson, R., Luck, J., et al. (2025). Site-specific drivers of sensor-based nitrogen management in on-farm corn and wheat experiments. Front. Agron. 7. doi: 10.3389/fagro.2025.1651522
Page, A. L., Miller, R. H., and Keeney, D. R. (1982). Methods of soil analysis. Part 2. Chemical and Microbiological Properties. Madison, Wisconsin, USA: Amer. Soc. of Agronomy.
Pan, N., Shen, H., Wu, D. M., Deng, L. S., Tu, P. F., Gan, H. H., et al. (2011). Mechanism of improved phosphate uptake efficiency in banana seedlings on acidic soils using fertigation. Agric. Water Manag. 98, 632–638. doi: 10.1016/j.agwat.2010.11.003
Pan, Y., Wang, D., Tan, T., An, J., Jin, X., Zou, H., et al. (2025). Effect of organic amendments on soil organic carbon fractions, water retention, and mechanical properties in a Chinese Alfisol. Soil Tillage Res. 254:106723. doi: 10.1016/j.still.2025.106723
Pereira, L. S., Allen, R. G., Smith, M., and Raes, D. (2015). Crop evapotranspiration estimation with FAO56: past and future. Agric. Water Manag. 147, 4–20. doi: 10.1016/j.agwat.2014.07.031
Pisante, M., Stagnari, F., and Grant, C. A. (2012). Agricultural innovations for sustainable crop production intensification. Ital. J. Agron. 7:e40. doi: 10.4081/ija.2012.e40
Radočaj, D., Jug, I., Vukadinović, V., Jurišić, M., and Gašparović, M. (2021). The effect of soil sampling density and spatial autocorrelation on interpolation accuracy of chemical soil properties in arable cropland. Agronomy 11. doi: 10.3390/agronomy11122430
Raheem, A. M., Naser, I. J., Ibrahim, M. O., and Omar, N. Q. (2023). Inverse distance weighted (IDW) and kriging approaches integrated with linear single and multi-regression models to assess particular physico-consolidation soil properties for Kirkuk city. Model. Earth Syst. Environ. 9, 3999–4021. doi: 10.1007/s40808-023-01730-5
Raj, P., Sharma, S., Kapri, A., Susmita,, and Gulaiya, S. (2025). Precision agriculture: a strategic approach to resource efficiency and sustainable farming. J. Sci. Res. Rep. 31, 382–391. doi: 10.9734/jsrr/2025/v31i83381
Ravikumar, S., Vellingiri, G., Sellaperumal, P., Pandian, K., Sivasankar, A., and Sangchul, H. (2024). Real-time nitrogen monitoring and management to augment N use efficiency and ecosystem sustainability–a review. J. Hazardous Materials Advan. 16:100466. doi: 10.1016/j.hazadv.2024.100466
Reineke, T., and Steffens, D. (2022). Phosphorus requirement of barley and wheat for seed and food quality. Plant Soil Environ. 68, 459–465. doi: 10.17221/138/2022-PSE
Reith, E., Gosling, E., Knoke, T., and Paul, C. (2022). Exploring trade-offs in agro-ecological landscapes: using a multi-objective land-use allocation model to support agroforestry research. Basic Appl. Ecol. 64, 103–119. doi: 10.1016/j.baae.2022.08.002
Reta, B. G. (2025). Evaluating the accuracy of machine learning models in predicting soil moisture, actual evapotranspiration, and biomass: developing normalized difference vegetation index-adjusted crop coefficient regression model for watermelon. J. Agric. Food Res. 24:102334. doi: 10.1016/j.jafr.2025.102334
Rodrigues, G. C., Paredes, P., Gonçalves, J. M., Alves, I., and Pereira, L. S. (2013). Comparing sprinkler and drip irrigation systems for full and deficit irrigated maize using multicriteria analysis and simulation modelling: ranking for water saving vs. farm economic returns. Agric. Water Manag. 126, 85–96. doi: 10.1016/j.agwat.2013.05.005
Rogers, C. W., Spackman, J. A., Tarkalson, D. D., Hu, G., Marshall, J. M., Adeyemi, O. E., et al. (2025). Irrigated spring hull-less food barley response to nitrogen fertilization. Soil Sci. Soc. Am. J. 89:e70029. doi: 10.1002/saj2.70029
Rossiter, D. G. (1990). ALES: a framework for land evaluation using a microcomputer. Soil Use Manag. 6, 7–20.
Roushdi, M. (2024). Investigation the implications of climate change on crop water requirements in Western Nile Delta, Egypt. Water Sci. 38, 77–91. doi: 10.1080/23570008.2023.2301639
Roy, S., Swetnam, T., Trochim, E., Schwehr, K., and Pasquarella, V. (2023) "Awesome-gee-community-datasets: community catalog ". Nevada, USA.
Safaee, S., Libohova, Z., Kladivko, E. J., Brown, A., Winzeler, E., Read, Q., et al. (2024). Influence of sample size, model selection, and land use on prediction accuracy of soil properties. Geoderma Reg. 36:e00766. doi: 10.1016/j.geodrs.2024.e00766
Salem, E. M. (2015). Response of grain sorghum (sorghum bicolor, l. Monech) to irrigation, nitrogen and plant density under new valley conditions, Egypt. Egypt. J. Desert Res. 65, 11–30. doi: 10.21608/ejdr.2015.5775
Santoni, M., Ferretti, L., Migliorini, P., Vazzana, C., and Pacini, G. C. (2022). A review of scientific research on biodynamic agriculture. Org. Agric. 12, 373–396. doi: 10.1007/s13165-022-00394-2
Schut, A. G. T., and Giller, K. E. (2020). Soil-based, field-specific fertilizer recommendations are a pipe-dream. Geoderma 380:114680. doi: 10.1016/j.geoderma.2020.114680
Selmy, S. A. H., Jimenez-Ballesta, R., Kucher, D. E., Sayed, A. S. A., García-Navarro, F. J., Yang, Y., et al. (2024). Land suitability assessment and crop water requirements for twenty selected crops in an arid land environment. Agronomy 14. doi: 10.3390/agronomy14112601
Shaddad, S. M., Buttafuoco, G., Elrys, A., and Castrignanò, A. (2019). Site-specific management of salt affected soils: A case study from Egypt. Sci. Total Environ. 688, 153–161. doi: 10.1016/j.scitotenv.2019.06.214,
Sher, A., Li, H., ullah, A., Hamid, Y., Nasir, B., and Zhang, J. (2024). Importance of regenerative agriculture: climate, soil health, biodiversity and its socioecological impact. Discov. Sustain. 5:462. doi: 10.1007/s43621-024-00662-z
Shokr, M. S., Abdellatif, M. A., El Baroudy, A. A., Elnashar, A., Ali, E. F., Belal, A. A., et al. (2021). Development of a spatial model for soil quality assessment under arid and semi-arid conditions. Sustainability 13:2893. doi: 10.3390/su13052893
Simonsson, M., Andersson, S., Andrist-Rangel, Y., Hillier, S., Mattsson, L., and Öborn, I. (2007). Potassium release and fixation as a function of fertilizer application rate and soil parent material. Geoderma 140, 188–198. doi: 10.1016/j.geoderma.2007.04.002
Soil Survey Staff (2022). Keys to soil taxonomy. 13th Edn. Washington, DC, USA: United States Department of Agriculture.
Soliman, M. M. (2020). Land and water resources assessment for sustainable agricultural development in El-Kharga oases by using remote sensing and geographic information system. Menoufia J. Soil Sci. 5, 55–83. doi: 10.21608/mjss.2020.170380
Song, X., Chen, C., Arthur, E., Tuller, M., Zhou, H., and Ren, T. (2021). Effects of increasing water activity on the relationship between water vapor sorption and clay content. Soil Sci. Soc. Am. J. 85, 520–525. doi: 10.1002/saj2.20236
Sowiński, J., and Głąb, L. (2018). The effect of nitrogen fertilization management on yield and nitrate contents in sorghum biomass and bagasse. Field Crop Res. 227, 132–143. doi: 10.1016/j.fcr.2018.08.006
Srivastava, R. K., Purohit, S., Alam, E., and Islam, M. K. (2024). Advancements in soil management: optimizing crop production through interdisciplinary approaches. J. Agric. Food Res. 18:101528. doi: 10.1016/j.jafr.2024.101528
Taheri, N., Pishvaee, M. S., Jahani, H., and Zakeri, D. (2024). Towards sustainable resource allocation in agriculture: a systematic review on cropping pattern optimization approaches. Appl. Soft Comput. 167:112360. doi: 10.1016/j.asoc.2024.112360
Tahir, S., and Marschner, P. (2017). Clay addition to sandy soil reduces nutrient leaching-effect of clay concentration and ped size. Commun. Soil Sci. Plant Anal. 48, 1813–1821. doi: 10.1080/00103624.2017.1395454
Thakur, N. P., Kachroo, D., Kumar, P., Gupta, A. K., Ravishankar, N., Khajuria, V., et al. (2025). Sustainable integrated farming system model for enhancing profitability, resource efficiency, and soil health for smallholders in the Indian Mediterranean ecosystem of the North-Western Himalayan region. Front. Sustain. Food Syst. 9. doi: 10.3389/fsufs.2025.1655465
Tramblay, Y., Llasat, M. C., Randin, C., and Coppola, E. (2020). Climate change impacts on water resources in the Mediterranean. Reg. Environ. Chang. 20:83. doi: 10.1007/s10113-020-01665-y
USDA (2009). Soil survey Field and laboratory methods manual. Lincoln, Nebraska, USA: U.S. Department of Agriculture, National Soil Survey Center, Natural Resources Conservation Service.
Vasu, D., Srivastava, R., Patil, N. G., Tiwary, P., Chandran, P., and Kumar Singh, S. (2018). A comparative assessment of land suitability evaluation methods for agricultural land use planning at village level. Land Use Policy 79, 146–163. doi: 10.1016/j.landusepol.2018.08.007
Vilakazi, B., Odindo, A. O., Phophi, M. M., and Mafongoya, P. L. (2025). Socioeconomic factors influencing crop diversification among smallholder farmers in Bergville, South Africa. Agriculture 15:914. doi: 10.3390/agriculture15090914
Vinten, A. J. A., Vivian, B. J., Wright, F., and Howard, R. S. (1994). A comparative study of nitrate leaching from soils of differing textures under similar climatic and cropping conditions. J. Hydrol. 159, 197–213.
Walsh, O. S., Marshall, J., Nambi, E., Shafian, S., Jayawardena, D., Jackson, C., et al. (2022). Spring wheat yield and grain quality response to nitrogen rate. Agron. J. 114, 2562–2572. doi: 10.1002/agj2.21101
Wang, Y., Ma, R., and Zhu, G. (2023). Representation of the influence of soil structure on hydraulic conductivity prediction. J. Hydrol. 619:129330. doi: 10.1016/j.jhydrol.2023.129330
Wang, L., Xin, J., Nai, H., and Zheng, X. (2021). Effects of different fertilizer applications on nitrogen leaching losses and the response in soil microbial community structure. Environ. Technol. Innov. 23:101608. doi: 10.1016/j.eti.2021.101608
Wang, Y., Zhang, J., He, C., Meng, P., Wang, J., Gao, J., et al. (2025). Effects of intercropping and mowing frequency on biological nitrogen fixation capacity, nutritive value, and yield in alfalfa (Medicago sativa L. cv. Vernal). Plants 14:240. doi: 10.3390/plants14020240,
Wassif, M. M., and Wassif, O. M. (2021). “Types and distribution of calcareous soil in Egypt” in Management and development of agricultural and natural resources in Egypt's desert. eds. A. A. Elkhouly and A. Negm (Cham: Springer International Publishing), 51–88.
Weber, R., Munz, J., Braun, J., and Frank, M. (2025). Site-specific N-application in small-scale arable farming in Germany—evaluation of trade-offs and synergies of ecological and economic parameters based on a case study. Discov. Sustain. 6:472. doi: 10.1007/s43621-025-01180-2
Wu, W., and Ma, B. (2015). Integrated nutrient management (INM) for sustaining crop productivity and reducing environmental impact: A review. Sci. Total Environ. 512-513, 415–427. doi: 10.1016/j.scitotenv.2014.12.101,
Yamaç, S. S., Kurtuluş, B., Memon, A. M., Alomair, G., and Todorovic, M. (2024). Are supervised learning methods suitable for estimating crop water consumption under optimal and deficit irrigation? Agronomy 14. doi: 10.3390/agronomy14030532
Yan, X., Chen, X., Tou, C., Luo, Z., Ma, C., Huang, W., et al. (2024). Exploring phosphorus fertiliser management in wheat production. Eur. J. Agron. 153:127063. doi: 10.1016/j.eja.2023.127063
Yuan, Y., Li, B., Yu, W., and Gao, X. (2021). Estimation and mapping of soil organic matter content at a national scale based on grid soil samples, a soil map and DEM data. Ecol. Inform. 66:101487. doi: 10.1016/j.ecoinf.2021.101487
Zawadzka, J., Mayr, T., Bellamy, P., and Corstanje, R. (2015). Comparing physiographic maps with different categorisations. Geomorphology 231, 94–100. doi: 10.1016/j.geomorph.2014.12.006
Zhang, F., Chen, M., Xing, Y., Han, J., and Wang, X. (2025). Reduction of nitrogen fertilizer and simultaneously application of organic fertilizer optimizes yield, water productivity and nitrogen metabolism of spring maize by improving soil properties in the loess plateau of China. J. Agric. Food Res. 19:101634. doi: 10.1016/j.jafr.2025.101634
Zhang, T., Wan, W., Sun, Z., and Li, H. (2024). Phosphorus uptake and rhizosphere properties of alfalfa in response to phosphorus fertilizer types in sandy soil and saline-alkali soil. Front. Plant Sci. 15. doi: 10.3389/fpls.2024.1377626,
Zhang, S., Zhu, Q., de Vries, W., Ros, G. H., Chen, X., Muneer, M. A., et al. (2023). Effects of soil amendments on soil acidity and crop yields in acidic soils: a world-wide meta-analysis. J. Environ. Manag. 345:118531. doi: 10.1016/j.jenvman.2023.118531,
Keywords: land evaluation, food security, crop water requirements, crop fertilizer requirements, GIS, sustainable cropping systems, resource-use efficiency, Egypt
Citation: Ganzour Sk, Ghabour TK and Elnashar A (2025) Integrating geospatial analysis and the suitability-resources quality index to optimize crop suitability for sustainable agriculture. Front. Sustain. Food Syst. 9:1703891. doi: 10.3389/fsufs.2025.1703891
Edited by:
Mohamed Shokr, Tanta University, EgyptReviewed by:
Faisal Mumtaz, Aerospace Information Research Institute (CAS), ChinaAhmed M. S. Kheir, Agricultural Research Center, Egypt
Shoukat Ali Shah, Wuhan University, China
Copyright © 2025 Ganzour, Ghabour and Elnashar. This is an open-access article distributed under the terms of the Creative Commons Attribution License (CC BY). The use, distribution or reproduction in other forums is permitted, provided the original author(s) and the copyright owner(s) are credited and that the original publication in this journal is cited, in accordance with accepted academic practice. No use, distribution or reproduction is permitted which does not comply with these terms.
*Correspondence: Abdelrazek Elnashar, YWJkZWxyYXplay5lbG5hc2hhckB1bmkta2Fzc2VsLmRl