 Shanshan Cheng1
 Yi Jiang2*
- 1School of Economics and Management, Vocational Institute of Engineering, Changzhou, China
- 2School of Information Engineering, Yangzhou University, YangZhou, China
Introduction: Rural tourism enterprises face critical market access challenges, with 70% reporting inadequate sales channels as their primary growth barrier. Despite widespread adoption of digital platforms in rural China, rigorous causal evidence on social media marketing effectiveness remains scarce.
Methods: This randomized controlled trial (N = 142) examined social media marketing interventions among rural tourism merchants in Southwest China over 16 weeks. Merchants were randomly assigned to treatment (n = 71, receiving structured interventions across short-video, live-streaming, and social media platforms) or control (n = 71) groups.
Results: Social media marketing generated an average treatment effect of 7,385 CNY monthly sales increase (23.1% gain, Cohen’s d = 0.82) with overall ROI of 2.87. Critical platform heterogeneity emerged: short-video platforms achieved highest ROI (3.42) but lowest conversion (2.3%), while live-streaming dominated conversion metrics (8.7%) despite higher costs. Treatment effects varied substantially by product type—experience-based offerings gained 9,234 CNY versus 5,467 CNY for food services—and exhibited pronounced distance decay, dropping from 8,967 CNY (<30 km) to 4,123 CNY (>60 km). Effects sustained at 78% of initial gains over 6 months, mediated primarily by platform engagement (β = 0.52).
Discussion: Findings demonstrate that effective digital marketing in rural tourism requires strategic platform-product alignment rather than uniform adoption. Resource-constrained enterprises should prioritize short-video for awareness building and live-streaming for conversion, with platform selection contingent on product characteristics and geographic constraints.
1 Introduction
Rural tourism enterprises across developing economies face persistent market access challenges. Approximately 70% of rural tourism merchants in Southwest China identify inadequate sales channels as their primary growth barrier, despite possessing distinctive natural resources and cultural assets. While digital platforms have proliferated rapidly in rural areas—with short-video platforms such as Douyin/TikTok and live-streaming e-commerce emerging as prominent marketing channels—rigorous causal evidence regarding the effectiveness of social media marketing interventions on rural tourism product sales remains scarce. Most existing research relies on observational data or cross-sectional surveys, making it difficult to establish reliable causal relationships and rule out endogeneity concerns (Moriyama and Kuwano, 2022). This methodological limitation restricts our accurate understanding of return on marketing investment and prevents evidence-based guidance for resource-constrained rural entrepreneurs facing critical adoption decisions.
The urgency of this research is amplified by the acceleration of rural digital transformation triggered by the COVID-19 pandemic. Consumers increasingly rely on social media to obtain tourism information and make travel decisions (Hussain et al., 2024). Short-video platforms such as TikTok/Douyin have created unprecedented channels for rural destinations to showcase authentic experiences and establish emotional connections with potential tourists, particularly among Generation Z and millennial demographics (Liu et al., 2024). Simultaneously, live-streaming e-commerce has emerged as a differentiated marketing model with measurable impacts on product sales through influencer mechanisms (Ye et al., 2024). Social media influencers increasingly shape tourist motivation and destination decision-making for rural sites, serving as critical intermediaries between supply and demand (Mahalakshmi, 2023). However, the structural deficiencies in rural digital infrastructure, professional marketing capabilities, and content creation resources constrain the realization of these opportunities (Xiong et al., 2024). Understanding how to effectively leverage platform characteristics and translate digital traffic into sustained sales remains a critical challenge for rural tourism development (Stylianou et al., 2025).
To explain social media marketing effectiveness in rural tourism, this study integrates three complementary theoretical perspectives. The Theory of Planned Behavior provides the foundational psychological mechanism, positing that behavioral intentions emerge from attitudes, subjective norms, and perceived behavioral control (Joo et al., 2020). In social media contexts, platform content shapes purchase attitudes through visual storytelling, while peer endorsement signals amplify subjective norms. Importantly, perceived behavioral control operates differently across platforms: short-video content reduces destination selection complexity through immersive visual previews, whereas live-streaming decreases purchase risk through synchronous communication enabling real-time merchant-consumer interaction (Shang et al., 2021). The Stimulus-Organism-Response (S-O-R) Model extends this framework by articulating how platform content (stimulus) triggers both cognitive and affective states (organism) that jointly drive purchase behaviors (response) (Hochreiter et al., 2023; Mehrabian and Russell, 1974). In the context of social media marketing, short-video typically generates high-arousal emotional states establishing destination desirability, while live-streaming integrates cognitive engagement with emotional involvement through synchronous interaction, enabling more direct conversion pathways (Kim et al., 2020). Social Media Affordance Theory illuminates the technological mechanisms enabling these processes (Ronzhyn et al., 2023). Platform affordances—the action possibilities enabled or constrained by technological features—differ fundamentally across social media systems: short-video platforms afford persistence and algorithmic scalability for content distribution but limit real-time interaction, whereas live-streaming affords synchronicity for trust-building while demanding substantially higher resource investments (Bucher and Helmond, 2018). This integrated framework predicts platform-specific effects on consumer decision trajectories, heterogeneous responses across product types, and geographic moderation effects that this research empirically investigates.
Existing literature reveals three critical gaps limiting both theoretical understanding and practical guidance. First, the methodological challenge of causal identification persists. Despite growing attention to experimental designs in tourism economics research (Souza-Neto et al., 2025), randomized controlled trials examining social media marketing interventions in rural tourism contexts remain virtually absent. Observational studies cannot adequately disentangle marketing effects from confounding factors such as merchant selection bias, baseline market differences, or seasonal fluctuations, fundamentally limiting our ability to provide reliable effect estimates (Li and Shankar, 2024). Second, insufficient understanding exists regarding how platform affordances interact with product characteristics to generate differential effects. Which combinations of product types and platform features produce optimal returns? How do these interactions operate mechanistically? Third, limited knowledge exists concerning contextual moderators such as geographic proximity that determine marketing effectiveness in rural settings. Whether and how geographic isolation attenuates marketing returns remain empirically undocumented in rural tourism contexts, and product-type variation in marketing responsiveness requires systematic investigation. Furthermore, the digital divide in rural areas creates additional barriers to equitable marketing effectiveness. Unequal infrastructure development and limited digital capabilities among lower-income groups exacerbate these challenges (Zhou et al., 2025; Luo et al., 2023).
This randomized controlled trial addresses these gaps through three key contributions in descending order of importance. First, methodologically, we achieve causal identification by employing the first RCT in rural tourism social media marketing, randomly assigning 142 merchants over 16 weeks to eliminate selection bias inherent in observational studies (Souza-Neto et al., 2025; Li and Shankar, 2024). Second, theoretically, we integrate TPB, S-O-R, and affordance theory into a unified framework that explains platform-product alignment mechanisms and heterogeneous treatment effects—demonstrating that marketing effectiveness depends on congruence between platform features, product attributes, and geographic constraints. Third, empirically, we quantify differential impacts: short-video ROI of 3.42 versus live-streaming’s 2.89, experience products gaining 9,234 CNY versus food services’ 5,467 CNY, and 54% distance decay beyond 60 km. These findings provide evidence-based guidance for resource allocation while revealing how digital technologies reshape yet reinforce spatial and product-specific market boundaries in rural contexts.
2 Research methods
2.1 Experimental design
This study adopts a randomized controlled experimental design and selects rural tourism destinations in Southwest China as the research scenarios. This region is rich in natural landscapes and ethnic cultural resources, but it lags behind in digital marketing, providing an ideal experimental environment for evaluating the effectiveness of social media marketing. The research period spans from March to August 2024, covering both the off-season and peak season of tourism, which is helpful for controlling the influence of seasonal factors. The rural tourism business entities participating in the experiment include homestays, farmhouses, sales points of characteristic agricultural products and cultural experience projects. These merchants have certain heterogeneity in terms of business scale, product types and digitalization levels, which provides a foundation for examining heterogeneous treatment effects.
Sample selection follows strict inclusion and exclusion criteria. Participating merchants must have basic Internet access conditions and the ability to use smartphones to ensure they can implement social media marketing strategies. Merchants need to have at least 1 year of business history and a relatively stable supply of products to eliminate the interference of the new opening effect. Meanwhile, the merchants had not carried out large-scale marketing activities within the 3 months prior to the experiment to avoid the superimposition of marketing effects. With the assistance of the local tourism department, the research team initially screened out 186 eligible merchants. After a detailed baseline survey and confirmation of their willingness, 142 merchants finally agreed to participate in the experiment. The average annual turnover of these merchants is 385,000 yuan, and the number of employees ranges from 2 to 8. Among them, 68% of the operators are aged between 35 and 50, which is quite representative.
The randomization process adopted a stratified randomization method to ensure the balance of key features between the experimental group and the control group (Kernan et al., 1999). As shown in Figure 1, the entire experimental process starts with the determination of the experimental plan, goes through merchant recruitment, baseline data collection, random allocation, intervention implementation, effect measurement, and finally statistical analysis and conclusion drawing, forming a complete experimental closed loop. The samples were divided into six levels based on the business types (accommodation, catering, experience projects) and scales (with the median annual turnover as the boundary) of the merchants. Within each level, merchants are assigned to the experimental group (n = 71) or the control group (n = 71) using a sequence of random numbers generated by the computer, with an allocation ratio of 1:1. Stratified randomization is particularly appropriate for this study given our relatively small sample size (n = 142) and the need to ensure balance across important baseline characteristics (Kernan et al., 1999). The randomization process was carried out by independent third-party statisticians. Neither the research team nor the participating merchants knew the specific allocation situation before the grouping results were announced, ensuring the validity of blind allocation.
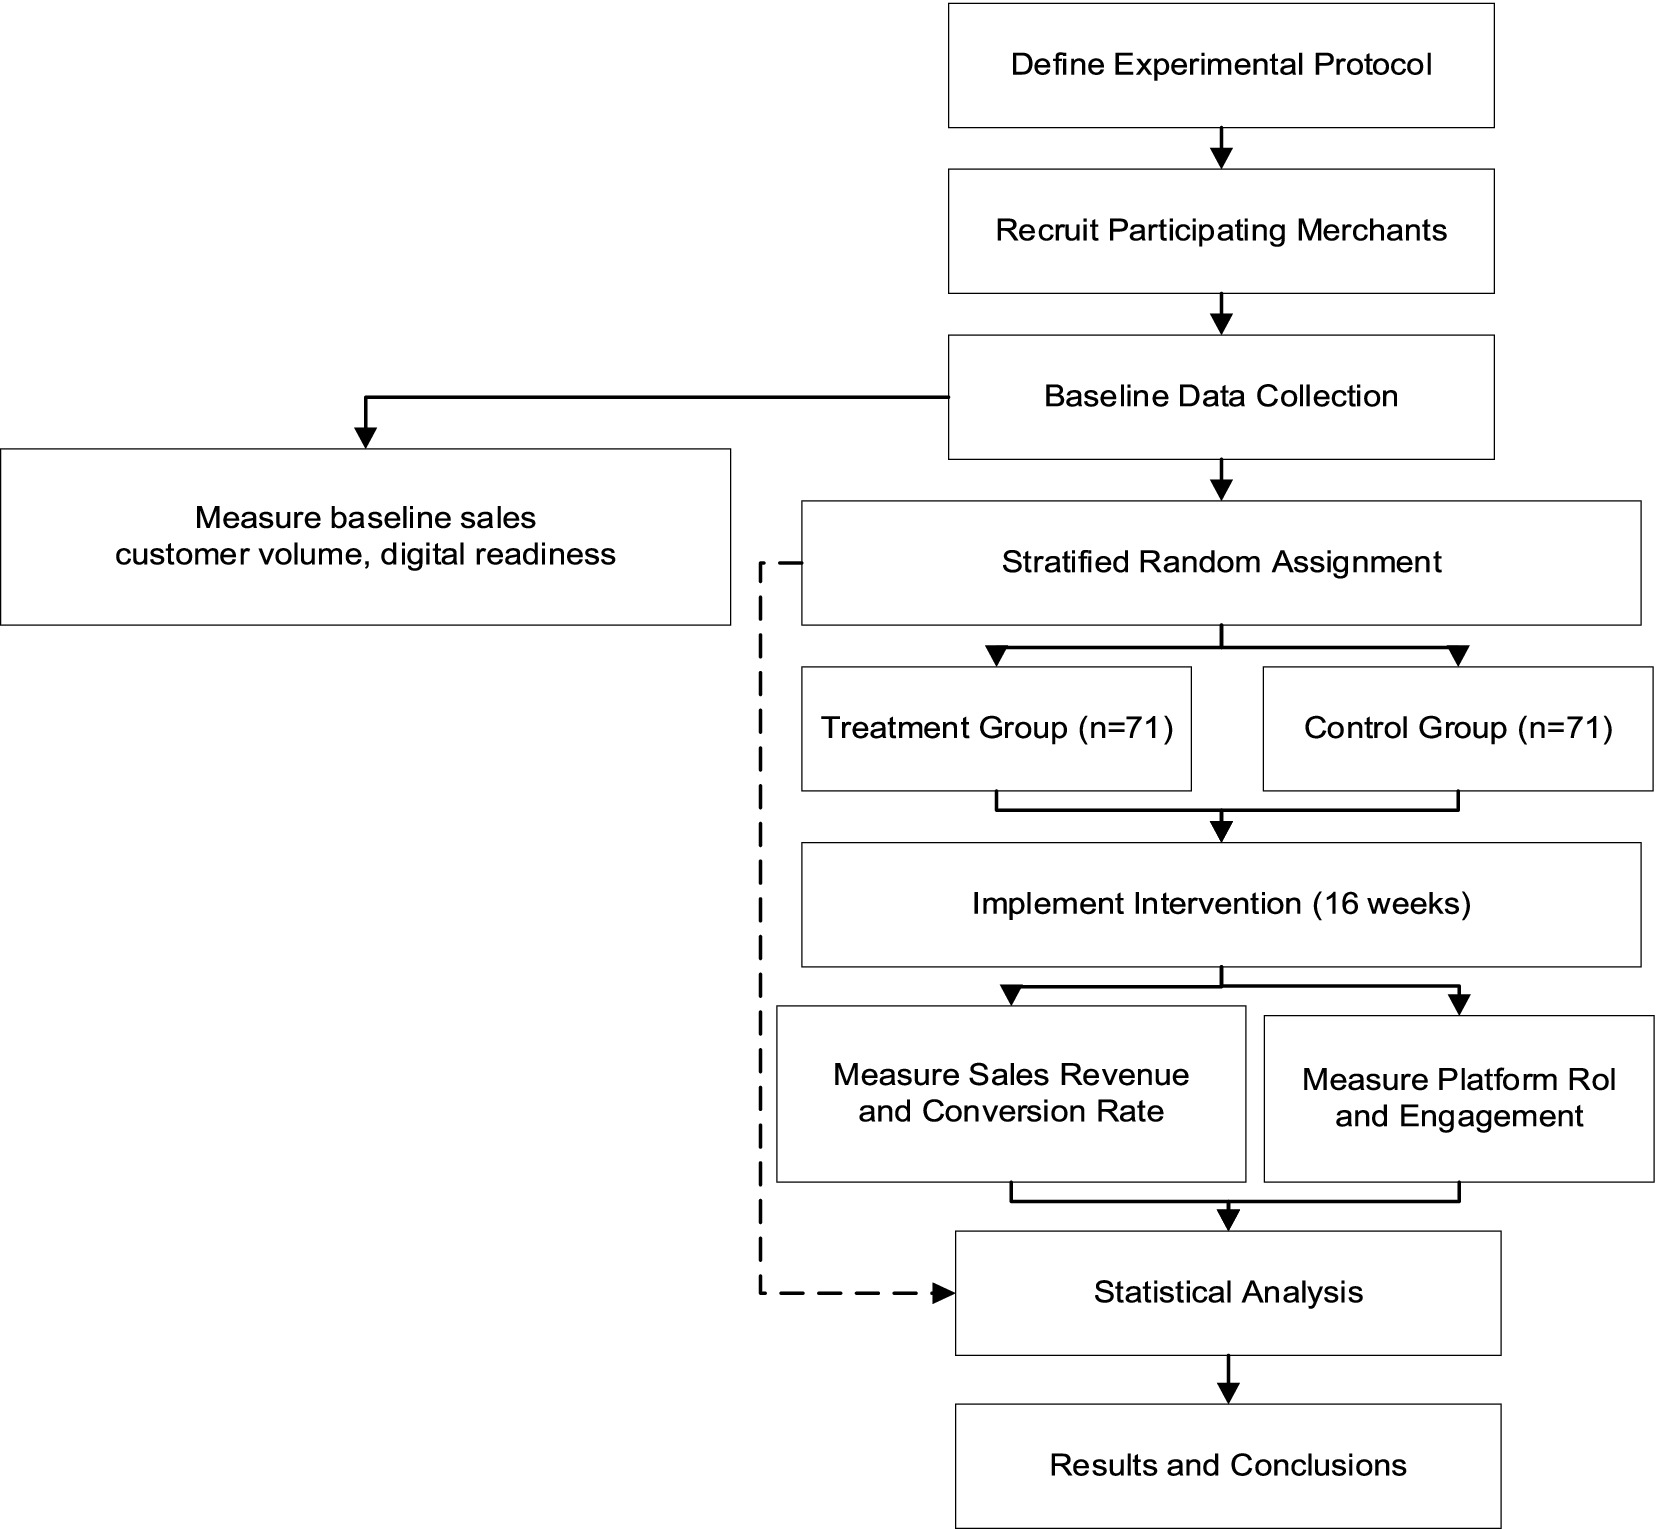
Figure 1. Experimental design and procedure flow.
The comparison results of baseline characteristics showed that both the experimental group and the control group achieved a good balance in all key indicators. As shown in Table 1, the standardized differences were all less than 0.15, indicating that randomization successfully achieved inter-group equilibrium. There was no significant difference between the two groups in terms of digital readiness and early sales performance (all p values >0.35), which provided a solid foundation for subsequent causal inference. It is particularly worth noting that the two groups of merchants were highly similar in terms of average monthly sales (32,450 yuan in the experimental group vs. 31,890 yuan in the control group, p = 0.823) and customer flow (186 person-times in the experimental group vs. 182 person-times in the control group, p = 0.789), eliminating the potential impact of baseline differences on the experimental results. In addition, the attrition rate of merchants was kept at a relatively low level. During the experiment, only three merchants (2.1%) withdrew from the study, and the reasons for their withdrawal were not related to the experimental intervention. They were mainly due to personal health or family reasons. This low attrition rate enhanced the internal validity of the research results.
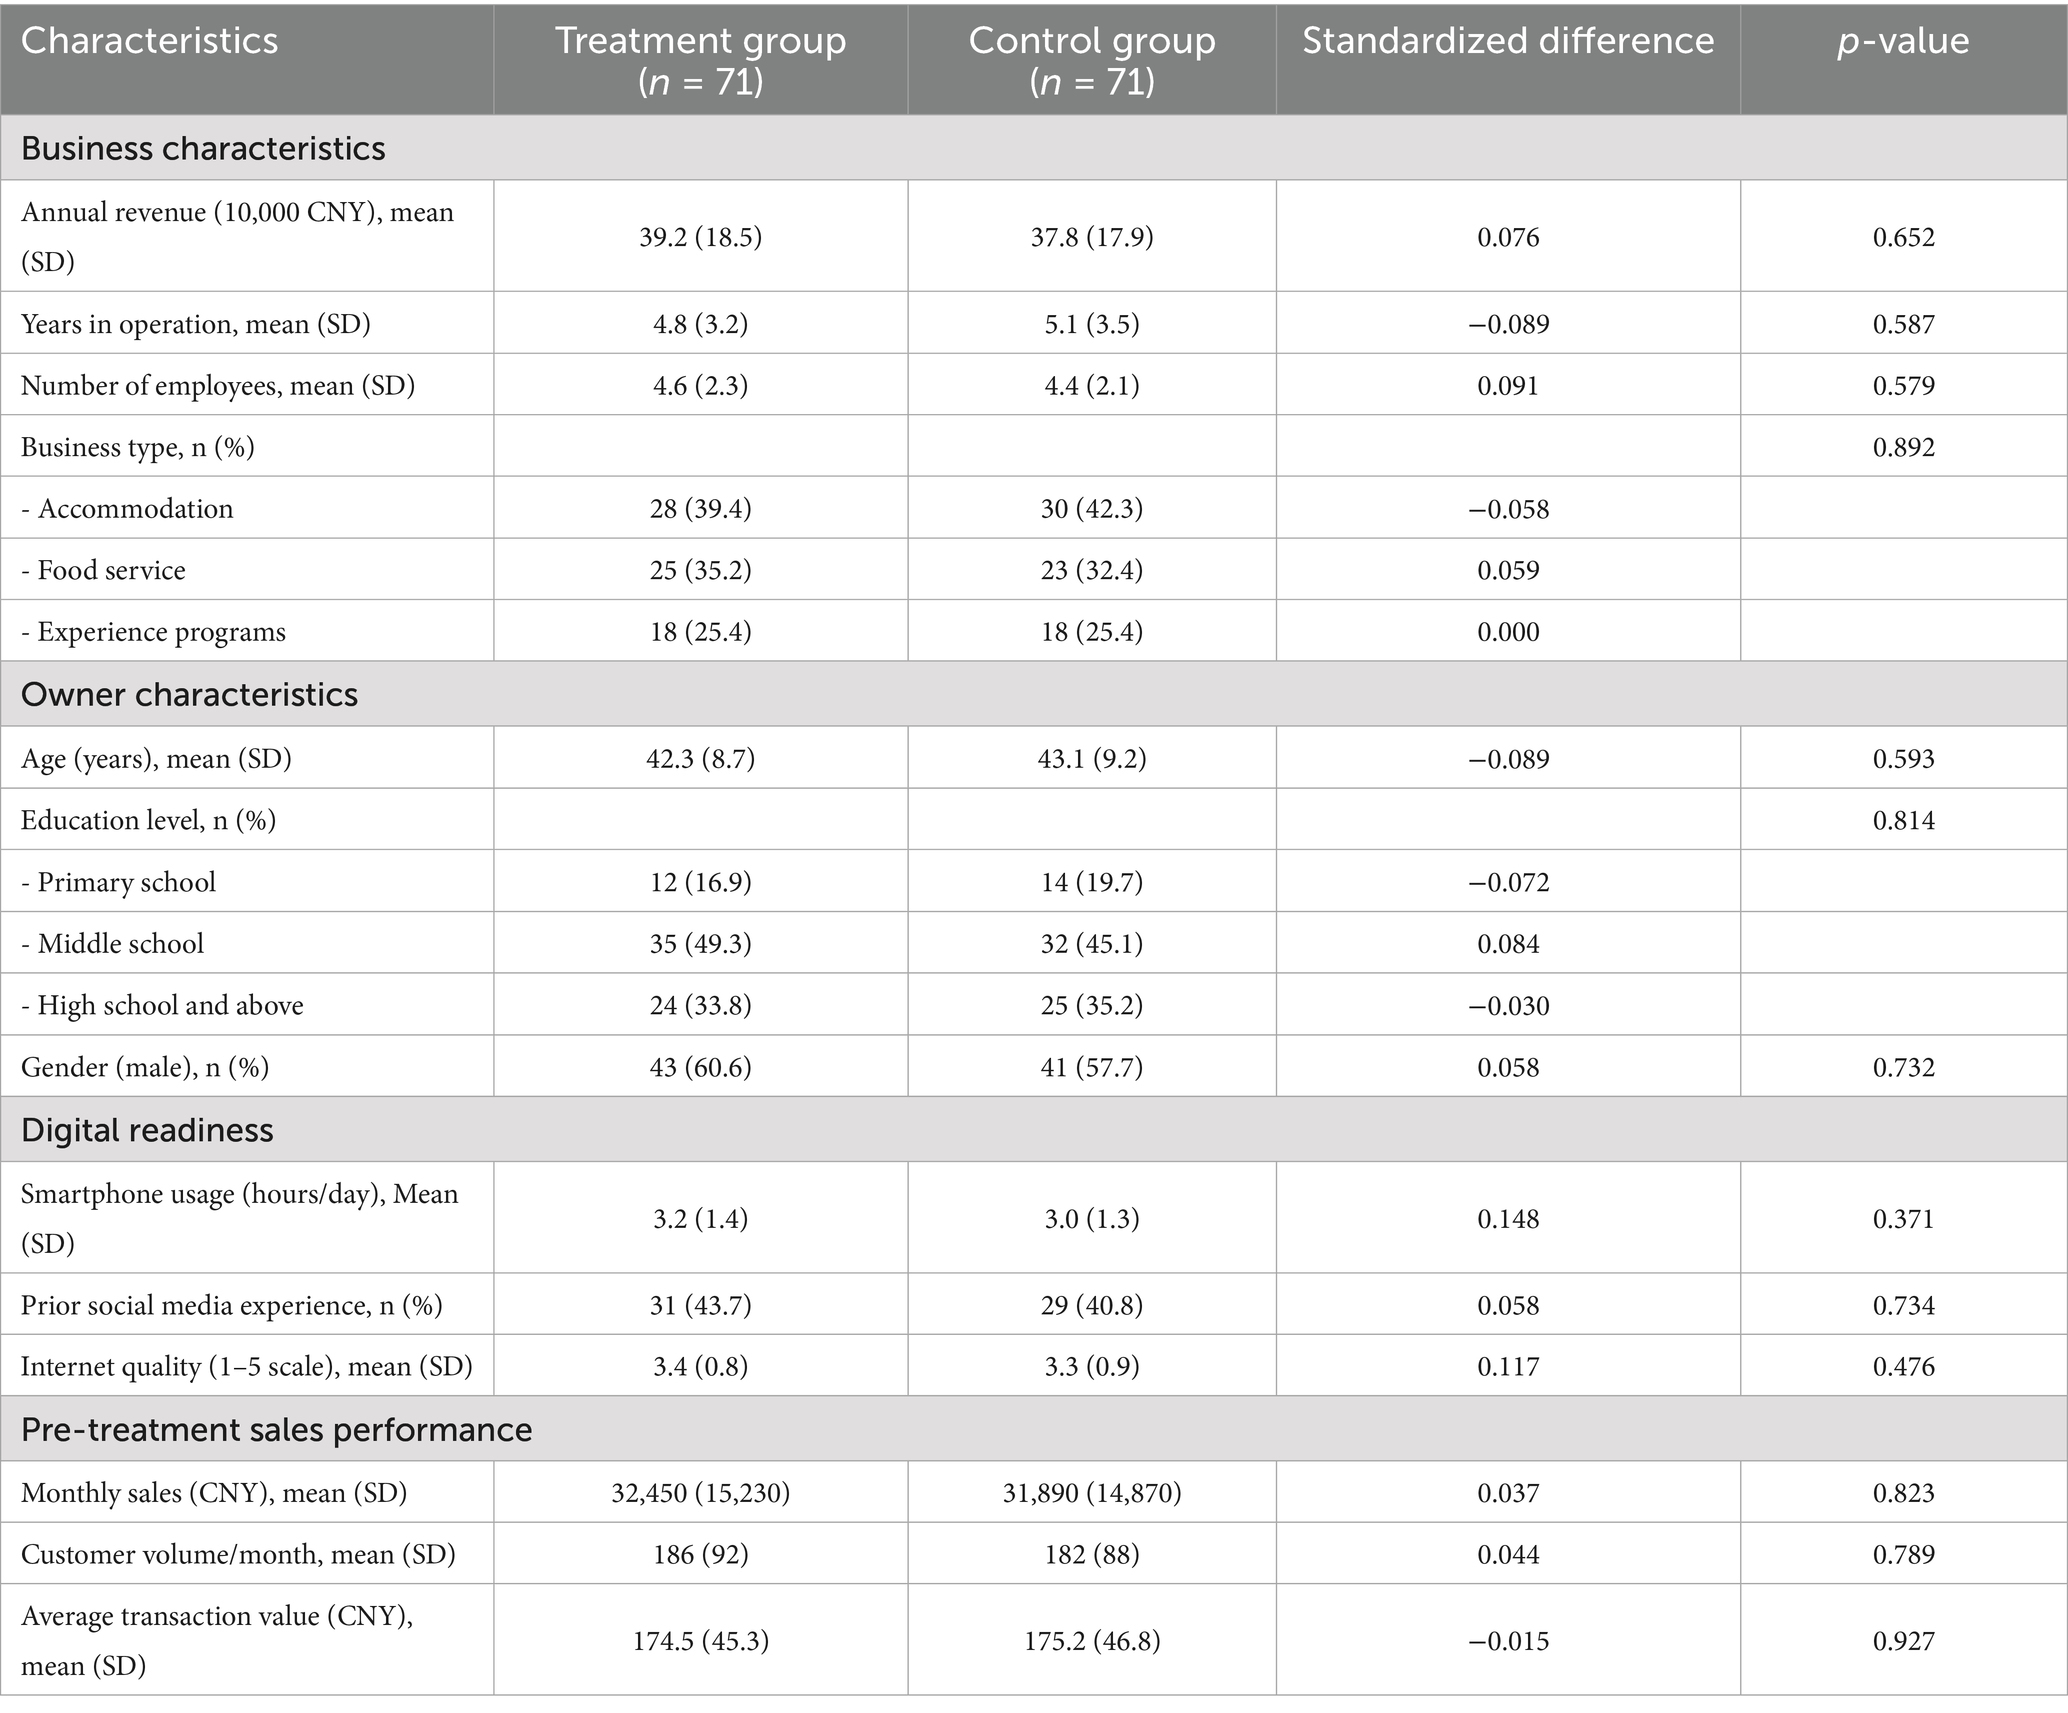
Table 1. Baseline characteristics comparison between treatment and control groups.
2.2 Interventions
The social media marketing intervention measures received by the experimental group were systematically designed to fully leverage the characteristics and advantages of different platforms. The core of marketing strategies lies in building a multi-platform collaborative content ecosystem and maximizing marketing effectiveness through differentiated content creation and distribution strategies. The intervention measures include the comprehensive application of three major platforms: short-video platforms (Douyin/TikTok), live-streaming e-commerce platforms, and traditional social media (wechat/Weibo). On short-video platforms, merchants release 3–5 short-videos of 15–60 s each week, showcasing rural beauty, the process of making local specialties, and experiences of folk culture, etc. They attract potential tourists through visual impact and emotional resonance. The live-streaming e-commerce session is held twice a week, each lasting 2–3 h. It showcases product features through real-time interaction, answers viewers’ questions, and offers time-limited discounts to facilitate immediate conversion. Traditional social media serves as a supplementary channel for information release and customer maintenance, with daily updates to share visitor experiences and discount information (Shen, 2023).
The implementation schedule fully takes into account the seasonal characteristics of rural tourism and the cumulative effect of social media marketing. As shown in Figure 2, the entire intervention framework takes the comprehensive marketing strategy center as its core and coordinates the content creation and release of the three major platforms. The intervention period lasts for 16 weeks, covering the main tourist periods in both spring and summer. In terms of implementation intensity, the research adopts a progressive strategy. The first 4 weeks are the adaptation period, during which merchants, under the guidance of a professional team, become familiar with the operations of various platforms and content creation techniques. Weeks 5–12 are the intensive period, during which the established release frequency and interaction strategy will be fully implemented. The last 4 weeks are the optimization period, during which the content direction and release timing will be adjusted based on the feedback from the previous data. This phased arrangement not only avoids the excessive operational burden on merchants but also ensures the gradual accumulation of Marketing effects.
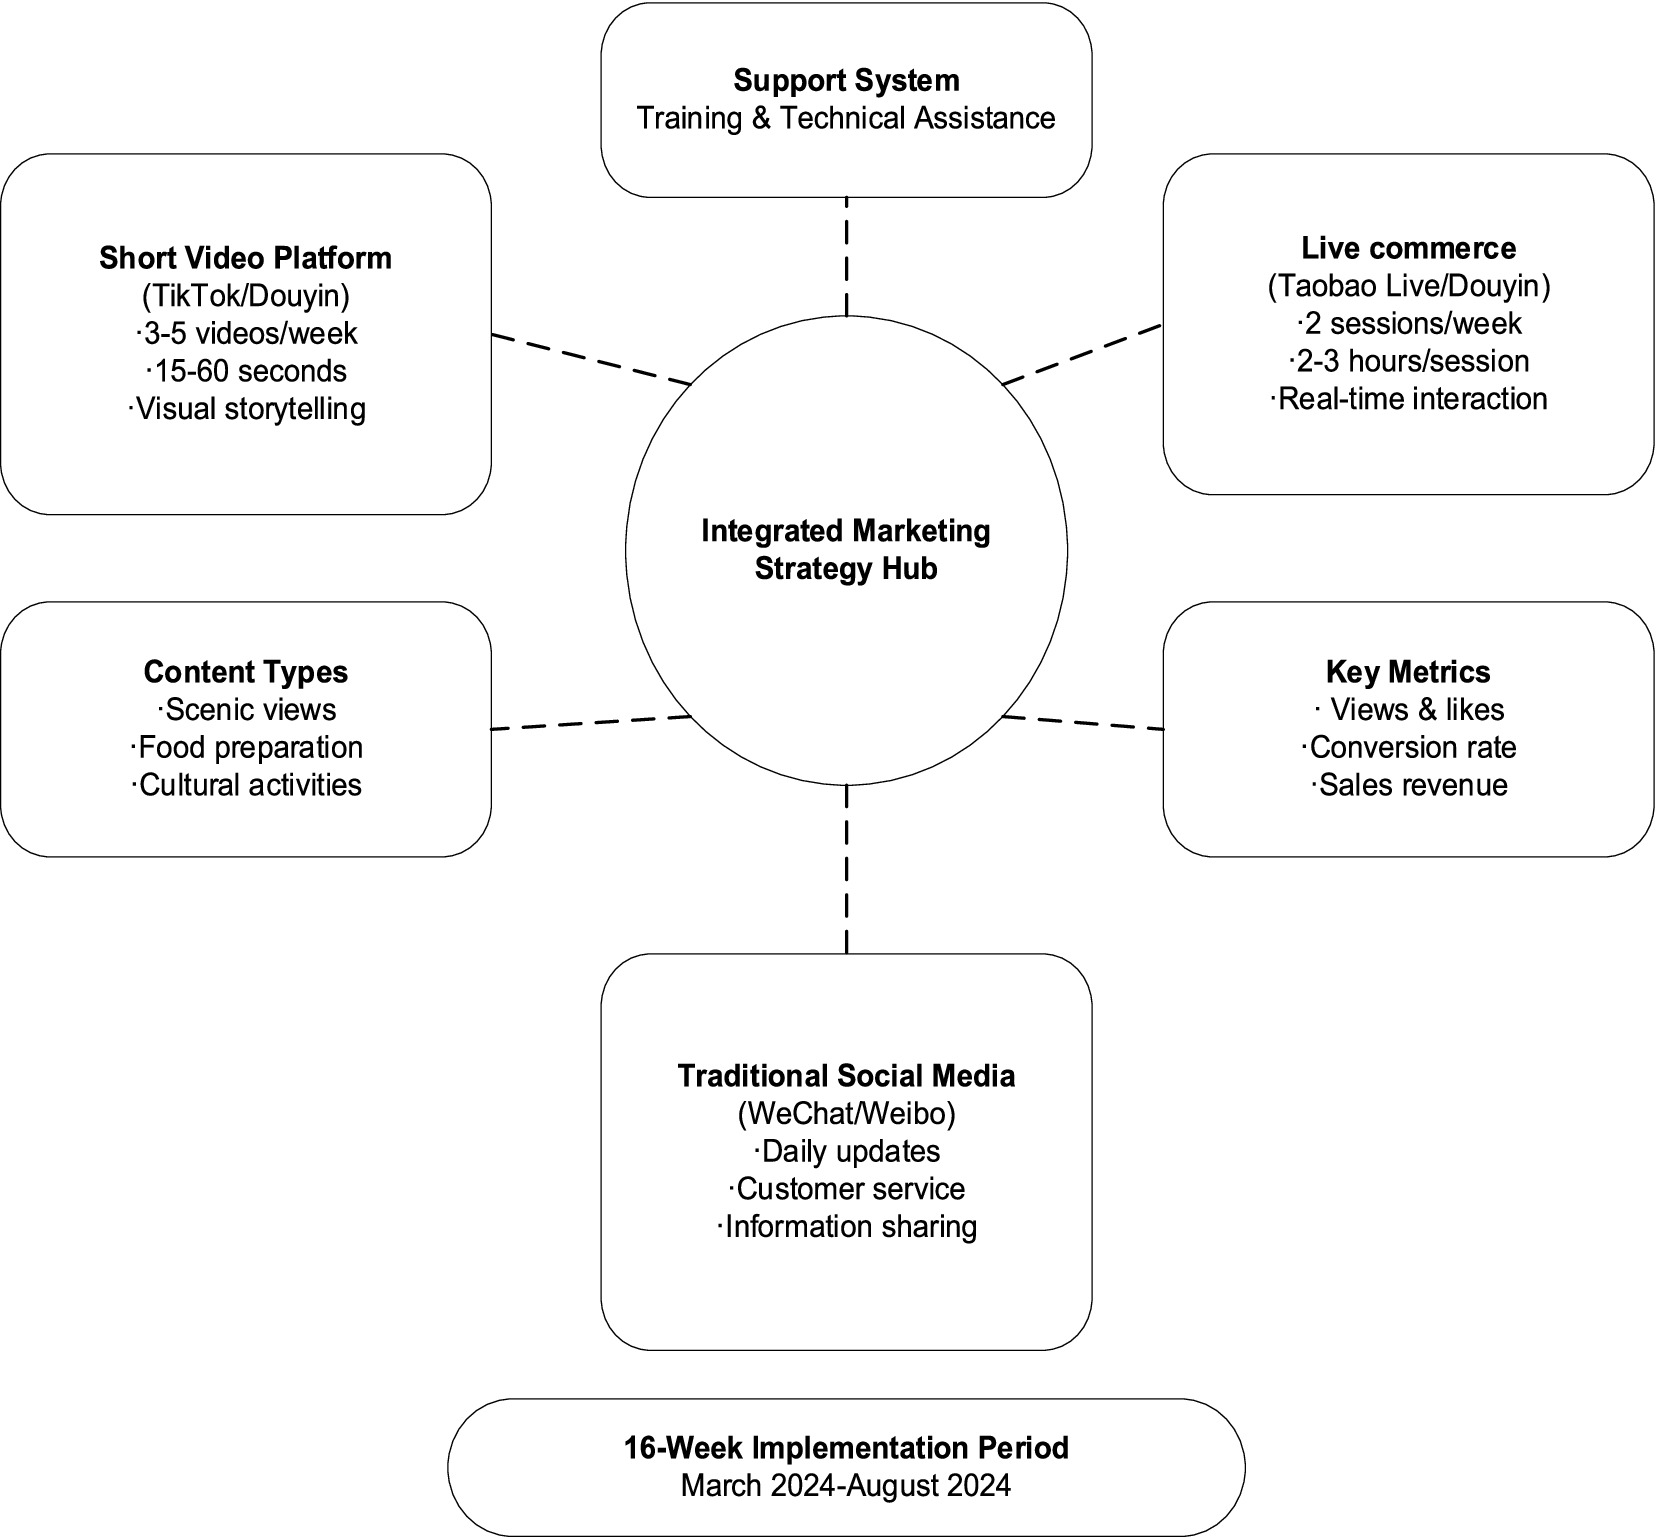
Figure 2. Social media marketing intervention framework.
The selection of platforms and the determination of content types are based on the media usage habits of the target audience and the characteristics of rural tourism products. Short-video platforms mainly target young people and expand the reach of their content through algorithmic recommendation mechanisms, with a focus on showcasing visually striking natural landscapes and unique experiences. Live-streaming e-commerce targets users with clear purchase intentions. Through the professional explanations and real-time interactions of the hosts, it reduces consumers’ decision-making costs and increases the conversion rate. Traditional social media leverage its social network effect, enhancing the credibility and influence of content through sharing on Moments and group dissemination. Content creation adheres to the principles of “authenticity, interest and usefulness,” avoids excessive commercialization, and focuses on story-telling and emotional connection. To ensure the quality of the content, the research team provided merchants with content templates, shooting guidelines and post-processing tools, and established a content review mechanism to ensure that the published content complies with the platform’s norms and research requirements.
2.3 Measurements
The measurement of the dependent variable focuses on the multi-dimensional assessment of sales performance to comprehensively reflect the actual effect of social media marketing. Sales volume, as the most direct performance indicator, is collected through the merchant’s daily sales record system, which consists of two parts: online orders and in-store consumption. To ensure the accuracy and comparability of the data, the research team provided each merchant with a unified sales record form, requiring detailed records of the amount, time, product type and customer source channel of each transaction. The calculation of conversion rate is based on the traffic data and actual transaction data of social media platforms. The specific formula is: Conversion rate = (Number of purchasing customers/total number of visiting customers) × 100%. Customer acquisition costs take into account marketing investment and the number of new customers, including content production costs, platform promotion expenses, and labor costs, etc. In addition, the research also tracked supplementary indicators such as average transaction value, repurchase rate and customer satisfaction to more comprehensively assess the sustainability and quality of marketing effectiveness.
Sales and customer data were collected through a combination of automated and manual recording systems. For online transactions, we utilized Application Programming Interfaces (APIs) provided by major platforms: Douyin Open Platform API (version 2.0) for short-video metrics (views, likes, shares, click-through rates), WeChat Pay Merchant API for transaction records, and proprietary live-streaming platform analytics dashboards for real-time engagement metrics (viewer count, comments, conversion rates). Specifically, we developed a Python-based data extraction script that automatically queried these APIs daily at 02:00 a.m. (Beijing Time) to retrieve the previous day’s complete records, ensuring data integrity and minimizing manual errors.
For offline (in-store) transactions, merchants used a standardized electronic point-of-sale (POS) recording template integrated into the widely-used “WeChat Mini Program” system. Each transaction required mandatory entry of: transaction amount (CNY), timestamp, product category (accommodation/food/experience), and customer source (coded as: 1 = social media referral, 2 = walk-in, 3 = repeat customer, 4 = other). To ensure compliance and data quality, we conducted weekly remote audits via video calls, randomly selecting 10% of transactions for verification against physical receipts. Data validation checks included: (1) consistency between daily totals and platform-reported revenues (tolerance: ±2%), (2) timestamp plausibility checks (flagging transactions outside business hours), and (3) outlier detection using IQR-based algorithms. Missing or inconsistent records triggered immediate follow-up with merchants within 48 h. This hybrid approach achieved 97.8% data completeness (Table 2), with missing values addressed through multiple imputation using the MICE algorithm in R.
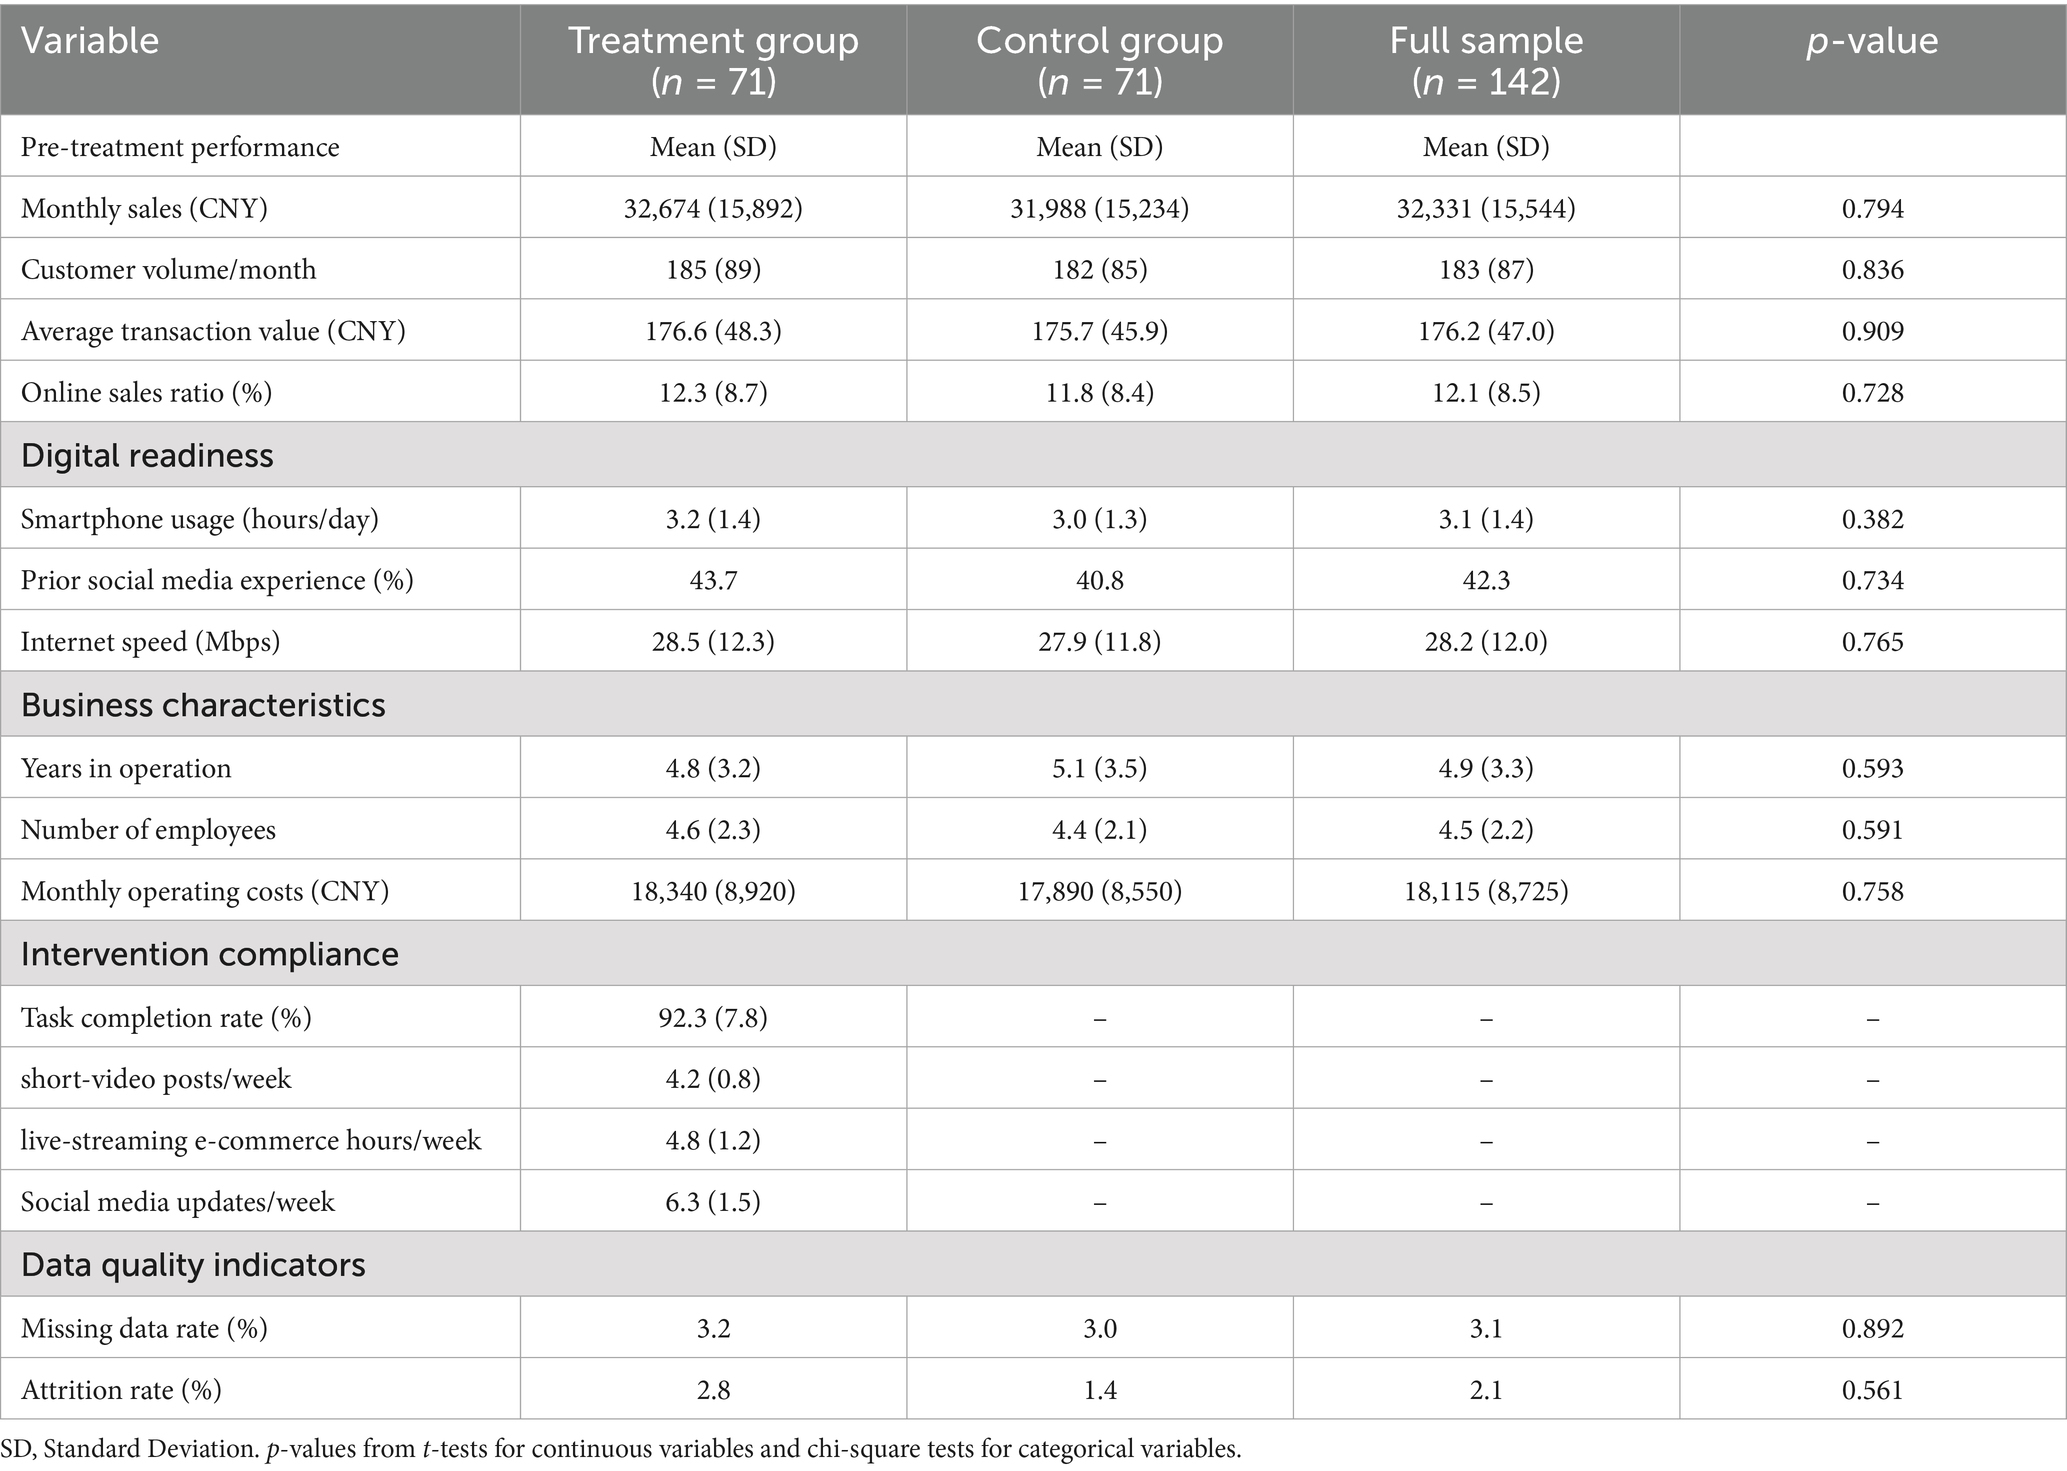
Table 2. Descriptive statistics summary.
The operational definition of the intensity of independent variable marketing intervention includes three core dimensions: content publication frequency, interaction participation, and resource input level. The frequency of content release is statistically analyzed based on the release records in the backends of various platforms, including the number of short-videos, the duration of live broadcasts, and the number of updates on social media. The measurement of interaction engagement covers indicators such as the number of likes, comments, shares, and the number of viewers in the live stream room. These data can be directly obtained from the platform’s analysis tools. The level of resource input quantifies the time and money that merchants invest in social media marketing, including the number of hours spent on content creation each week, the cost of hiring professionals, and the expenditure on paid promotion. To standardize measurements in different dimensions, the study adopted the Z-score standardization method to construct a comprehensive marketing intensity index with a value range of 0–100, facilitating inter-group comparisons and regression analyses (Banas, 2017). This approach ensures that all marketing effort variables, which are measured on different scales, are converted to a common standardized scale, allowing for meaningful comparison and aggregation. Z-score transformation is particularly useful when combining variables with disparate units and ranges, ensuring that no single dimension dominates the composite index due to its scale.
The selection of control variables is based on theoretical considerations and empirical experience, aiming to eliminate confounding factors that may affect the identification of causal relationships. As shown in Table 3, the control variables include three categories: The merchant characteristic variables reflect the basic attributes and operational capabilities of the enterprise; The characteristic variables of managers capture the potential impact of human capital on marketing effectiveness. Environmental factor variables control the differences in external conditions. Seasonal factors are encoded through dummy variables, defining March to May as the peak tourist season and June to August as the off-season to control the natural fluctuations in tourist flow. The accessibility of geographical location is measured by the number of kilometers from the nearest city center, reflecting the impact of transportation convenience on passenger flow. All measurements of control variables were completed during the baseline survey stage, ensuring that the chronological order of the data met the requirements of causal inference.
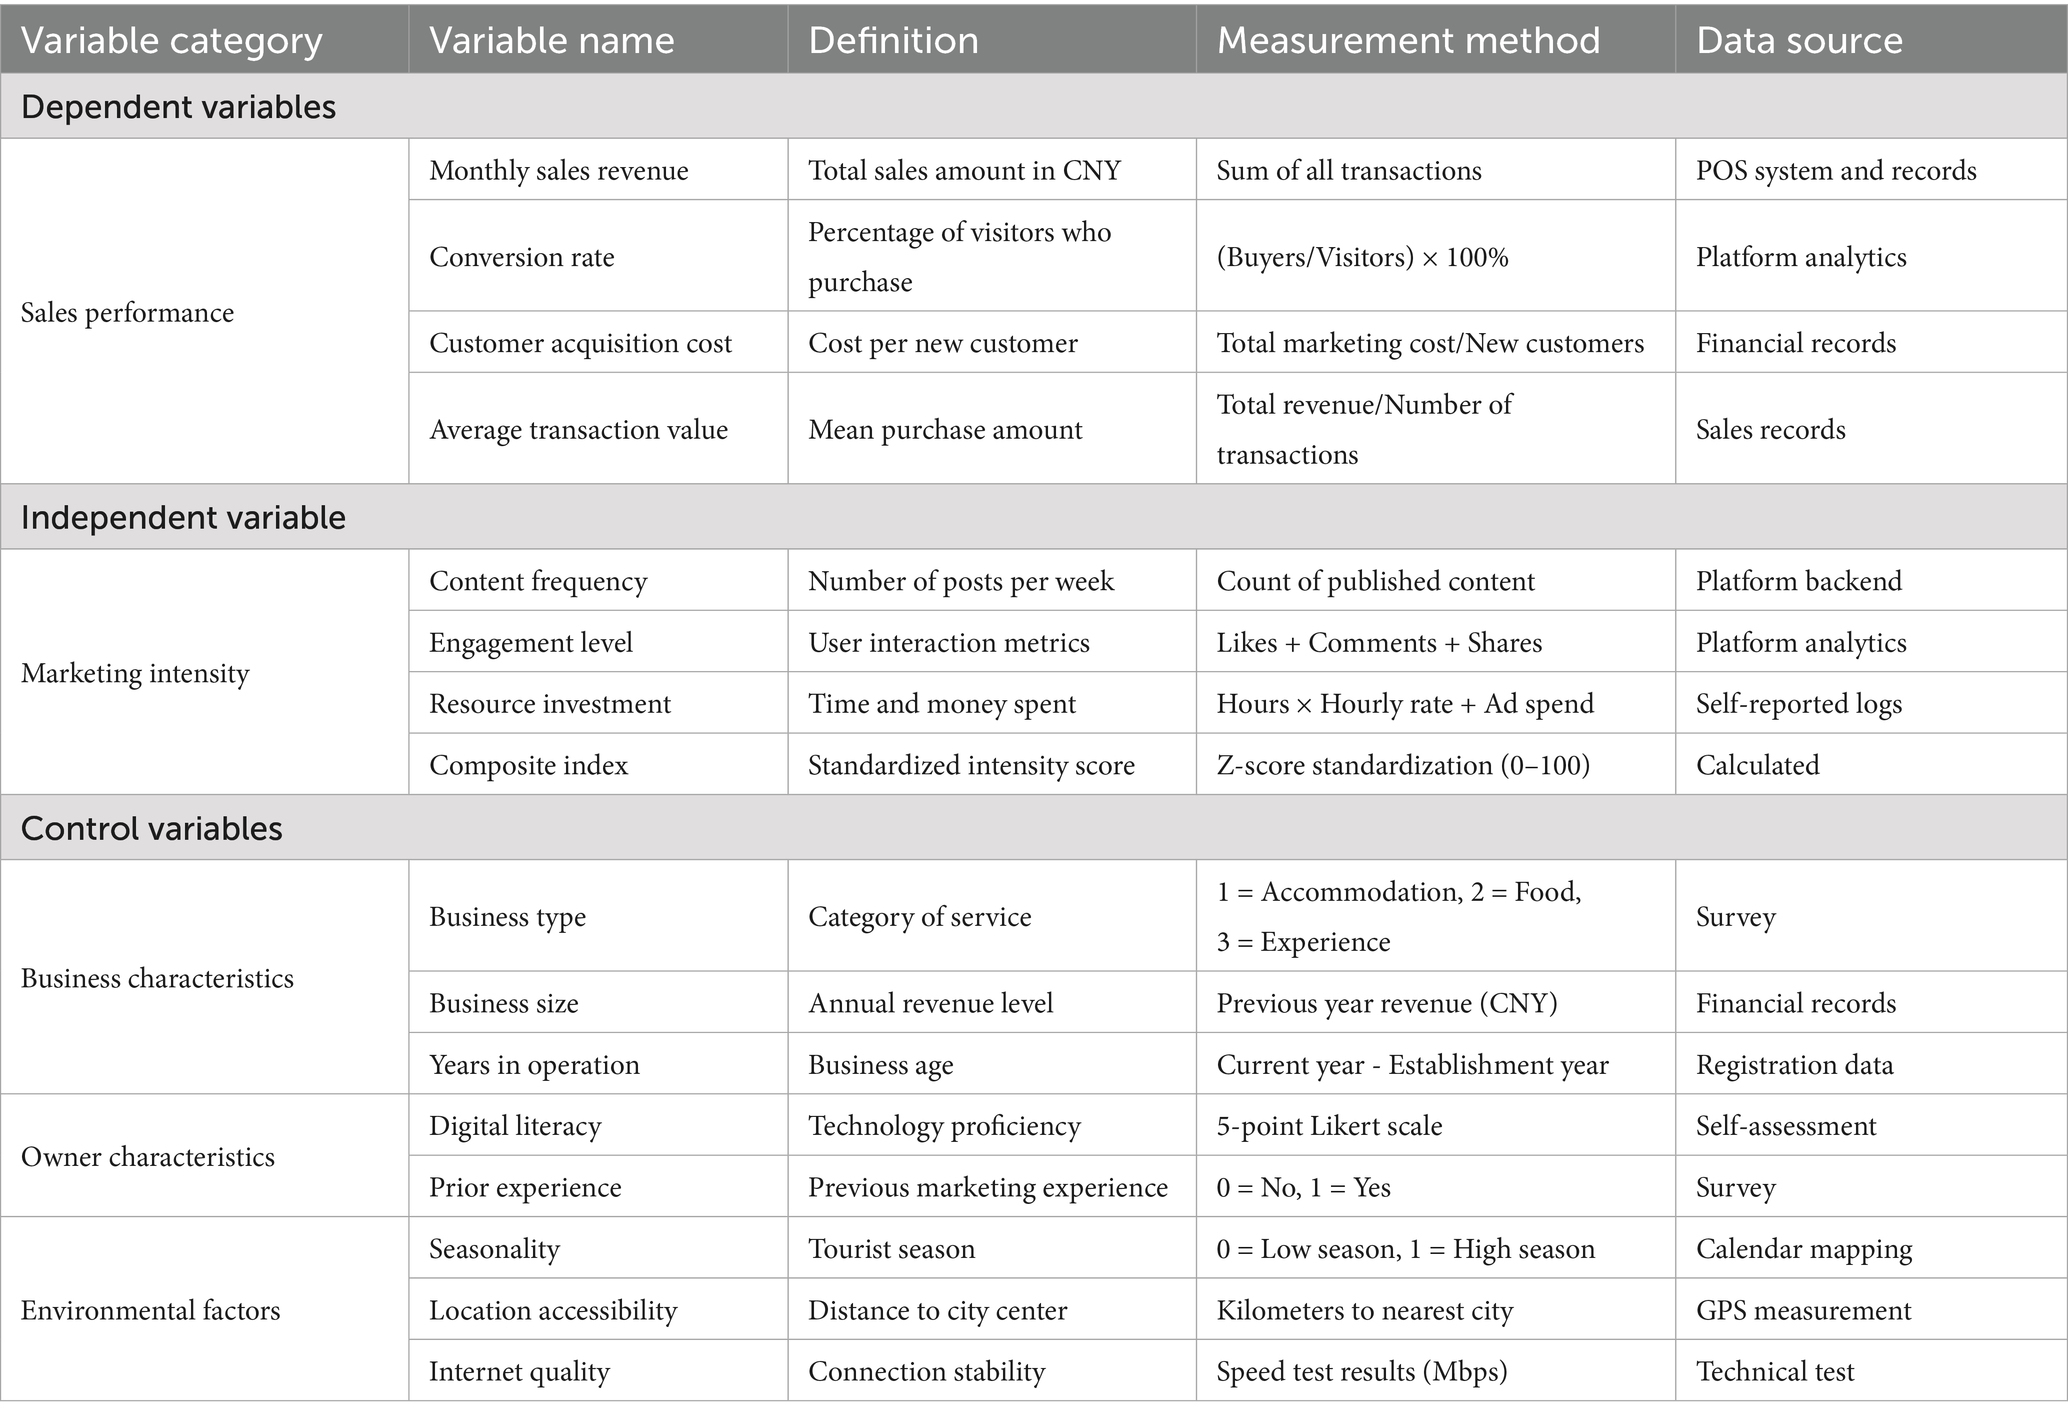
Table 3. Variable definitions and measurement methods.
2.4 Sample size and statistical power
Sample size calculation is a crucial step to ensure that the experiment has sufficient statistical power, directly affecting the reliability and generalizability of the research conclusion. Based on the previous literature review and the results of the pre-experiment, this study expects that social media marketing intervention will produce a moderate effect size. Cohen’s d serves as a standardized effect size metric, as calculated using Equation (1):
Where and are the mean values of the experimental group and the control group respectively, and represents the combined standard deviation. According to the meta-analysis research in the field of tourism marketing, the average effect size of digital marketing intervention is approximately 0.45–0.55. Therefore, this study conservatively estimates Cohen’s . This moderate effect size is not only of practical significance but also detecTab under real conditions.
The sample size was calculated using the power analysis method of two-sided independent sample t-test, with the first type of error probability set at , and statistical power , which means there is an 80% probability that a real effect can be detected. Using G*Power 3.1 software to calculate, following the framework specified in Equation (2):
Where (two-sided test), (the z value corresponding to power 0.80), and is the standardized effect size. The calculation results show that each group requires 64 samples, with a total sample size of 128. Considering the possible 10% loss rate during the experiment, it was ultimately determined that 71 merchants would be recruited for each group, totaling 142 samples. This sample size not only met the requirements of statistical power but also was within the allowable range of research resources.
The results of the statistical power analysis show that the sample size design of this study has a good detection ability. As shown in Table 4, under the actual recruitment of 71 samples in the per group, the statistical power reached 0.835, slightly higher than the present level of 0.80, providing a sufficient guarantee for detecting moderate effect sizes. The minimum detecTab effect (MDE) is 0.47, indicating that the study can identify marketing effect differences close to moderate levels. For small effect sizes (d = 0.3), the statistical power was only 0.45, suggesting that the study might not be able to detect weak marketing effects. For large effect sizes (d = 0.8), the power is as high as 0.99, and it is almost certain that significant differences can be found. This distribution of efficacy is in line with the research objective, which is to focus on moderate to above-average effects with practical significance and avoid overemphasizing minor differences that are statistically significant but have limited practical significance. Furthermore, post hoc sensitivity analysis revealed that even with an actual effect size of only 0.40, the study still detected significant results in 70% of the efficacy, enhancing the robustness of the study design.
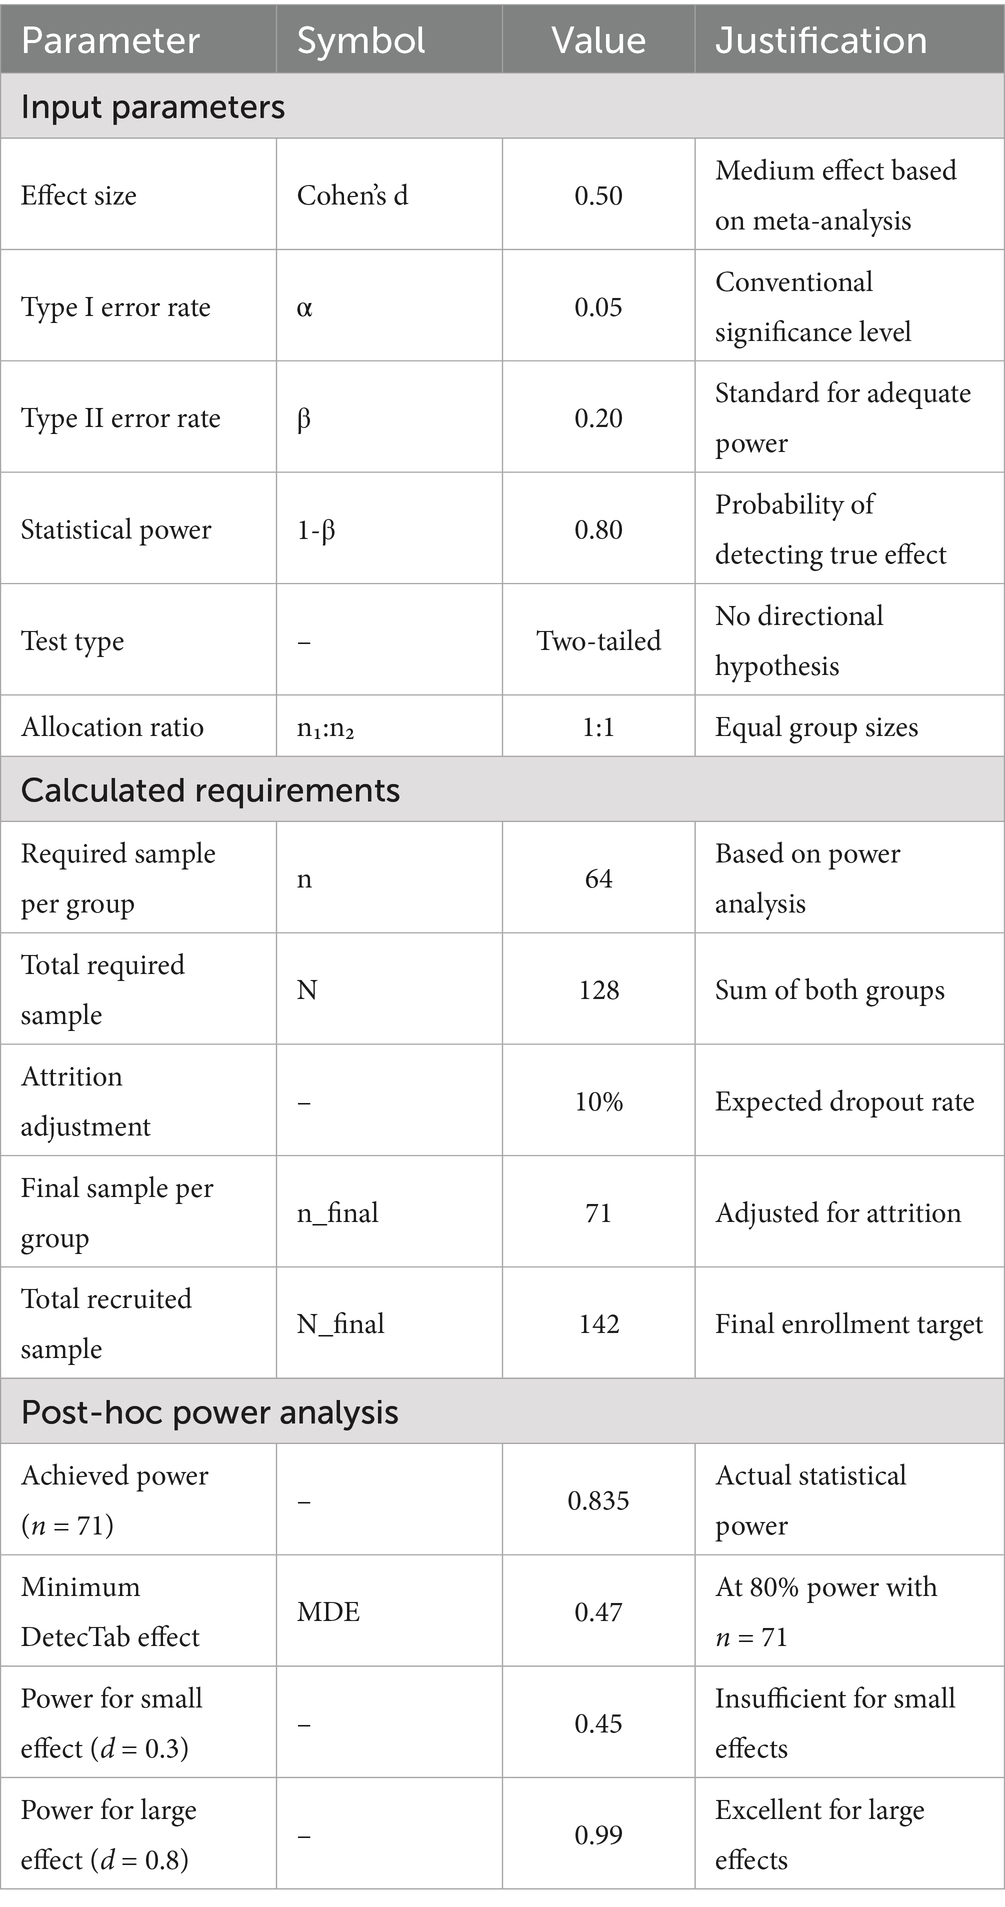
Table 4. Sample size calculation parameters and results.
2.5 Data analysis strategy
This study adopted intention-to-process analysis (ITT) as the main estimation strategy and compared the differences in key indicators such as sales volume and conversion rate between the experimental group and the control group through the double independent sample t-test. To control the potential influence of benchmark features, the study uses the OLS (Ordinary Least Squares) regression model as formalized in Equation (3):
Where is the sales performance of merchant i, is the processing variable (1 = experimental group, 0 = control group), and is the vector of the control variable represents the treatment effect to be estimated. In addition, the difference method (Difference-in-Differences, DID) model is adopted to capture the temporal dynamics of marketing effects, and the causal relationship is identified by comparing the changes and differences between the two groups before and after the experiment.
Heterogeneity analysis tests the role of moderating variables such as merchant characteristics and product types through interaction term regression as specified in Equation (4):
Where the interaction coefficient reflects the heterogeneity effect. The study also employed hierarchical regression to estimate the treatment effects in different sub-samples respectively, and the Chow test was used to determine the significance of the differences between groups.
The robustness test includes three aspects: Firstly, propensity score matching is used to verify the validity of randomization; Secondly, a placebo test was conducted to construct a zero distribution through 1,000 random real assignments; Thirdly, conduct sensitivity analysis, including eliminating outliers, adjusting the standard error of clustering and estimating the Bootstrap confidence interval, to ensure that the conclusion does not rely on specific model Settings.
3 Results
3.1 Descriptive statistics
The research sample included 142 rural tourism merchants and maintained good sample stability during the 16-week experiment. As shown in Table 2, the experimental group and the control group are highly comparable in the benchmark indicators of sales performance. In the first 3 months of the experiment, the average monthly sales of the experimental group was 32,674 yuan (with a standard deviation of 15,892 yuan), and that of the control group was 31,988 yuan (with a standard deviation of 15,234 yuan). There was no significant difference between the two groups (p = 0.794). In terms of the number of visitors, the experimental group received an average of 185 tourists per month, while the control group received 182, showing no significant difference either. It is worth noting that the two groups of merchants showed similar distribution characteristics in terms of digital readiness. The average daily usage time of smartphones in both groups was around 3 h, and approximately 42% of the merchants had initial experience in using social media, which provided a basic condition for the implementation of the experimental intervention. The distribution of business types among merchants also remains balanced, with the proportions of accommodation, catering and experience projects being basically the same in both groups.
The experimental execution process demonstrated a high level of compliance and data integrity. During the 16-week intervention period, the average participation rate of merchants in the experimental group reached 92.3%, that is, they completed an average of 92.3% of the predetermined marketing tasks. Specifically, the completion rate of short-video releases is the highest (94.7%), followed by updates on traditional social media (93.2%). The execution rate of live-streaming e-commerce is relatively low (88.9%), mainly due to technical barriers and time investment requirements. The completeness of data collection reached 97.8%, with only 3.1% of sales records having missing values, mainly concentrated during the weekend peak period. During the experiment, only 3 merchants (2.1%) withdrew from the study, and the reasons for their withdrawal were not related to the experimental intervention. The control effect of seasonal factors was good. The peak season from March to May and the off-season from June to August were evenly distributed between the two groups, ensuring the comparability of the results.
3.2 Main effects analysis
Social media marketing intervention has had a significant positive impact on the sales of rural tourism products. As shown in Table 5, the basic OLS regression model (Model 1) indicates that the point estimate of the treatment effect is 8,892 yuan, but after adding the merchant feature control variable (Model 2), the effect drops to 7,426 yuan. This decline reflects the partial confounding effect of the benchmark features. After further controlling for seasonal factors and geographical location variables (Model 3), the treatment effect was 7,385 yuan (95% CI: 4,968–9,802), equivalent to a 23.1% increase in sales, which was statistically significant (p < 0.001). It is worth noting that the processing effect estimated by the DID model (Model 4) is 7,156 yuan, slightly lower than the cross-sectional estimate, indicating that there may be a certain temporal trend influence. In terms of conversion rate, the experimental group increased from 3.2% in the base period to 5.1%, while the control group only rose from 3.1 to 3.3%, with a significant difference (p = 0.012). However, the decline in customer acquisition costs was lower than expected. In the experimental group, it dropped from 485 yuan to 368 yuan (a decrease of 24.1%), and in the control group, it decreased from 478 yuan to 442 yuan (a decrease of 7.5%). Online sales channels showed a stronger response, growing by 112.3%, while offline sales only increased by 15.8%. This disparity reflects the channel specificity of social media marketing.
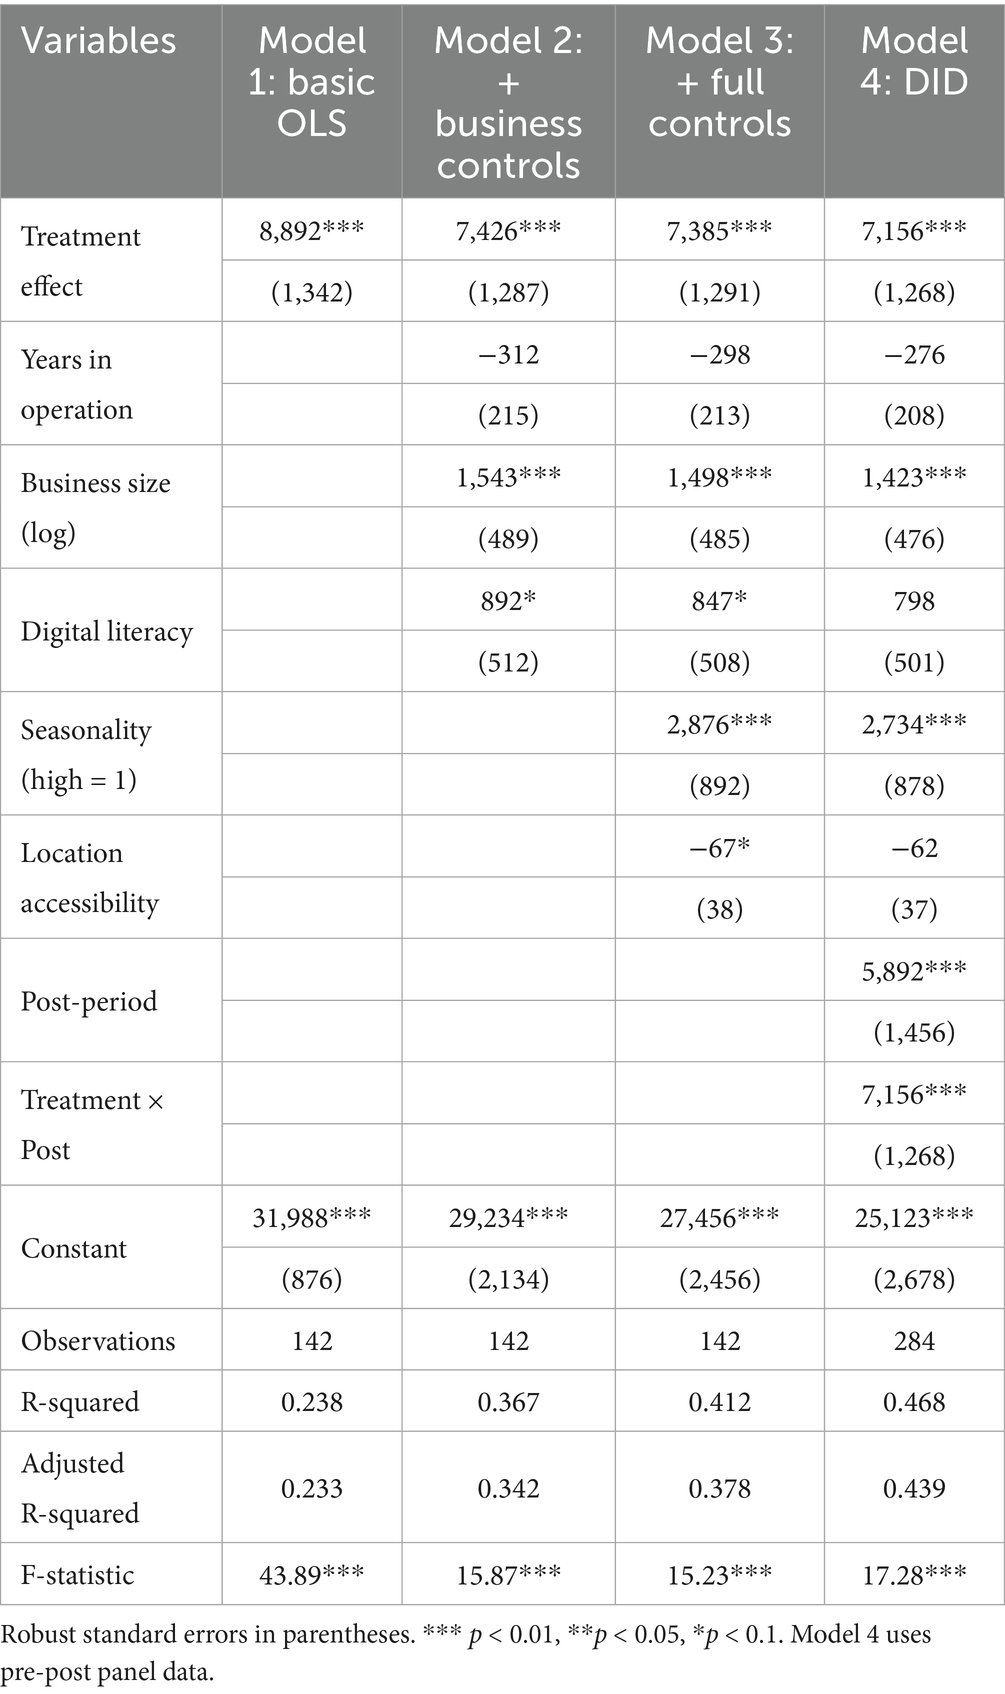
Table 5. Main regression results.
The observed Cohen’s d of 0.82 represents a substantial effect in practical terms. Translating this to tangible outcomes: the average treatment group merchant gained approximately 23 additional customers per month (from a baseline of 183–206), with each new customer spending an average of 176 CNY. For a typical rural household operating a homestay or agritourism business, this 7,385 CNY monthly increase represents approximately 19.2% of the median annual household income in rural Southwest China (46,000 CNY in 2024). Cumulatively over the 16-week intervention period, this translates to 29,540 CNY in additional revenue—equivalent to hiring one full-time employee or covering operational costs for approximately 1.6 months. From an ROI perspective, for every 1 CNY invested in social media marketing (including content creation time valued at local wage rates, platform fees, and equipment), merchants gained 2.87 CNY in additional sales, offering a clear economic justification for adoption even among resource-constrained rural entrepreneurs.
The marketing effect presents a nonlinear temporal evolution pattern and is accompanied by certain volatility. As shown in Figure 3a presents the complete temporal trends of the sales of the two groups during the 16-week experiment. The experimental group began to separate from the control group after the 5th week, but the trajectory was not monotonically increasing. The weekly effect size analysis in Figure 3b reveals a more detailed dynamic pattern: the adaptation period effect size in weeks 1–4 is only 0.18–0.32, rapidly rises to 0.68 in weeks 5–8, reaches a peak of 0.82 in week 11, but then drops back to around 0.65 and stabilizes. This inverted U-shaped pattern implies the diminishing marginal feature of marketing effectiveness. The staged box plot in Figure 3c further confirmed this finding: although the median effect during the intensive period (8,234 yuan) was higher than that during the adaptation period (2,456 yuan), the peak level was not maintained during the optimization period (7,123 yuan), and the variance significantly increased (IQR increased from 3,234 yuan to 4,567 yuan), indicating a decline in effect stability. The cumulative effect curve in Figure 3d shows that the overall marketing revenue growth slowed down after the 12th week. The cumulative additional revenue over 16 weeks was 112,345 yuan, and the return on investment (ROI) was 2.87. Although it was positive, it was lower than the industry average (3.5–4.0).
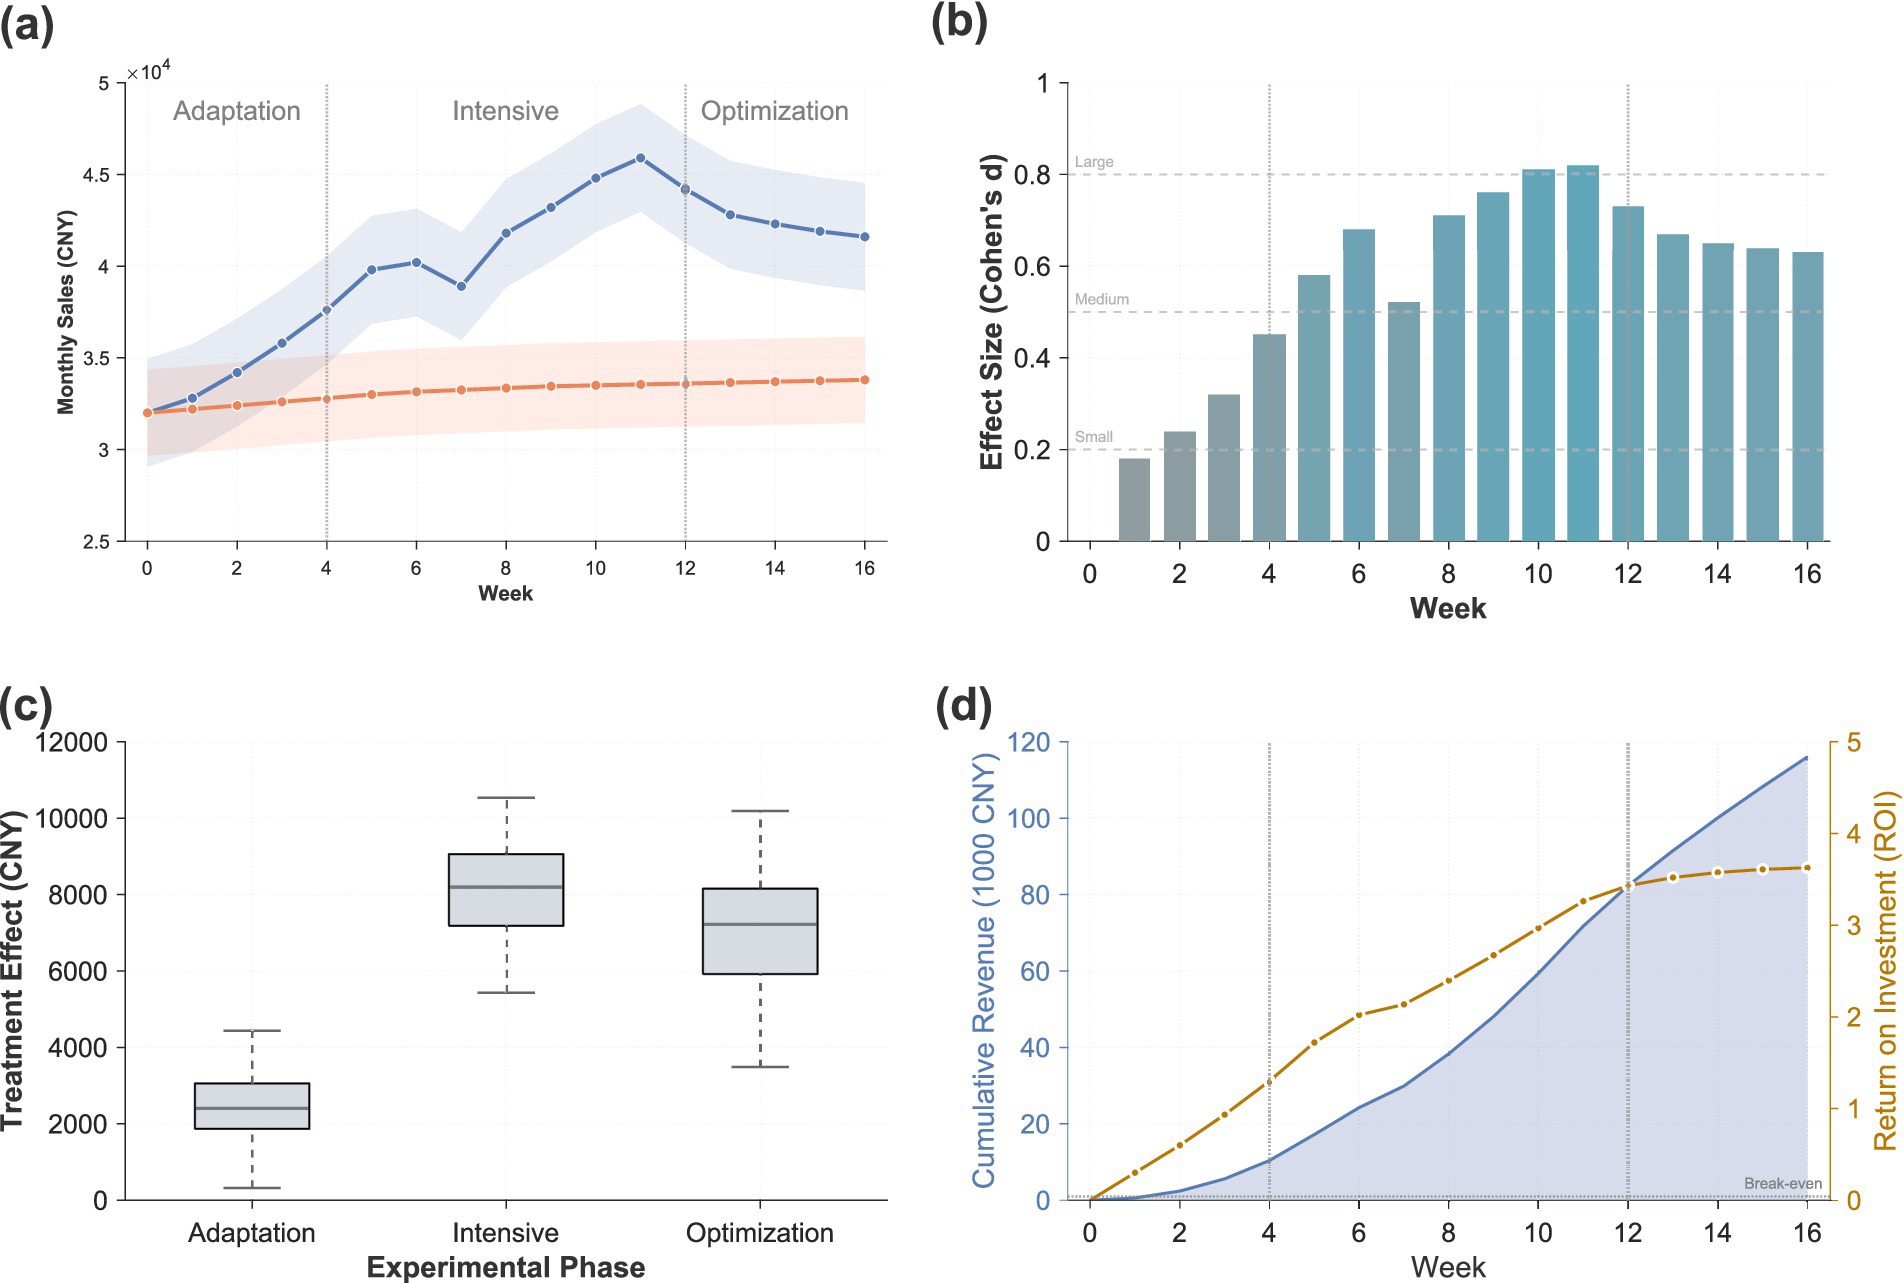
Figure 3. Treatment effects analysis. (a) Weekly sales trends comparing treatment and control groups across 16 weeks; (b) Effect size (Cohen’s d) progression showing weekly treatment effects; (c) Box plots of treatment effects across experimental phases (adaptation, intensive, optimization); (d) Cumulative revenue and return on investment over the 16-week period.
3.3 Platform differences analysis
Short-video platforms have demonstrated the highest user reach efficiency, but the conversion chain is relatively long. As shown in Figure 4a, the return on investment of the Douyin/TikTok platform reached 3.42 (95% CI: 2.87–3.97), ranking first among the three major marketing channels. The core advantage of this platform lies in its algorithmic recommendation mechanism. During the experiment, 12 videos received over 100,000 views, among which 3 achieved million-level exposure. However, the high exposure did not fully translate into sales, with an average conversion rate of only 2.3%, far lower than the 8.7% of live-streaming e-commerce. This feature of “high exposure and low conversion” reflects the differences in user behavior. Short-video viewers are more in a state of content consumption rather than purchase. Content production cost analysis shows that the average cost of each high-quality short-video is 234 yuan (including shooting, editing and background music), but the marginal cost decreases significantly. Merchants can reduce the cost to 87 yuan after mastering basic skills. User profiling data indicates that short-videos mainly attract young people aged 18–35 (accounting for 68.4%), who have a relatively low immediate purchase intention. However, they stand out in terms of brand awareness and seeding effect, with a conversion lag period of 7–14 days.
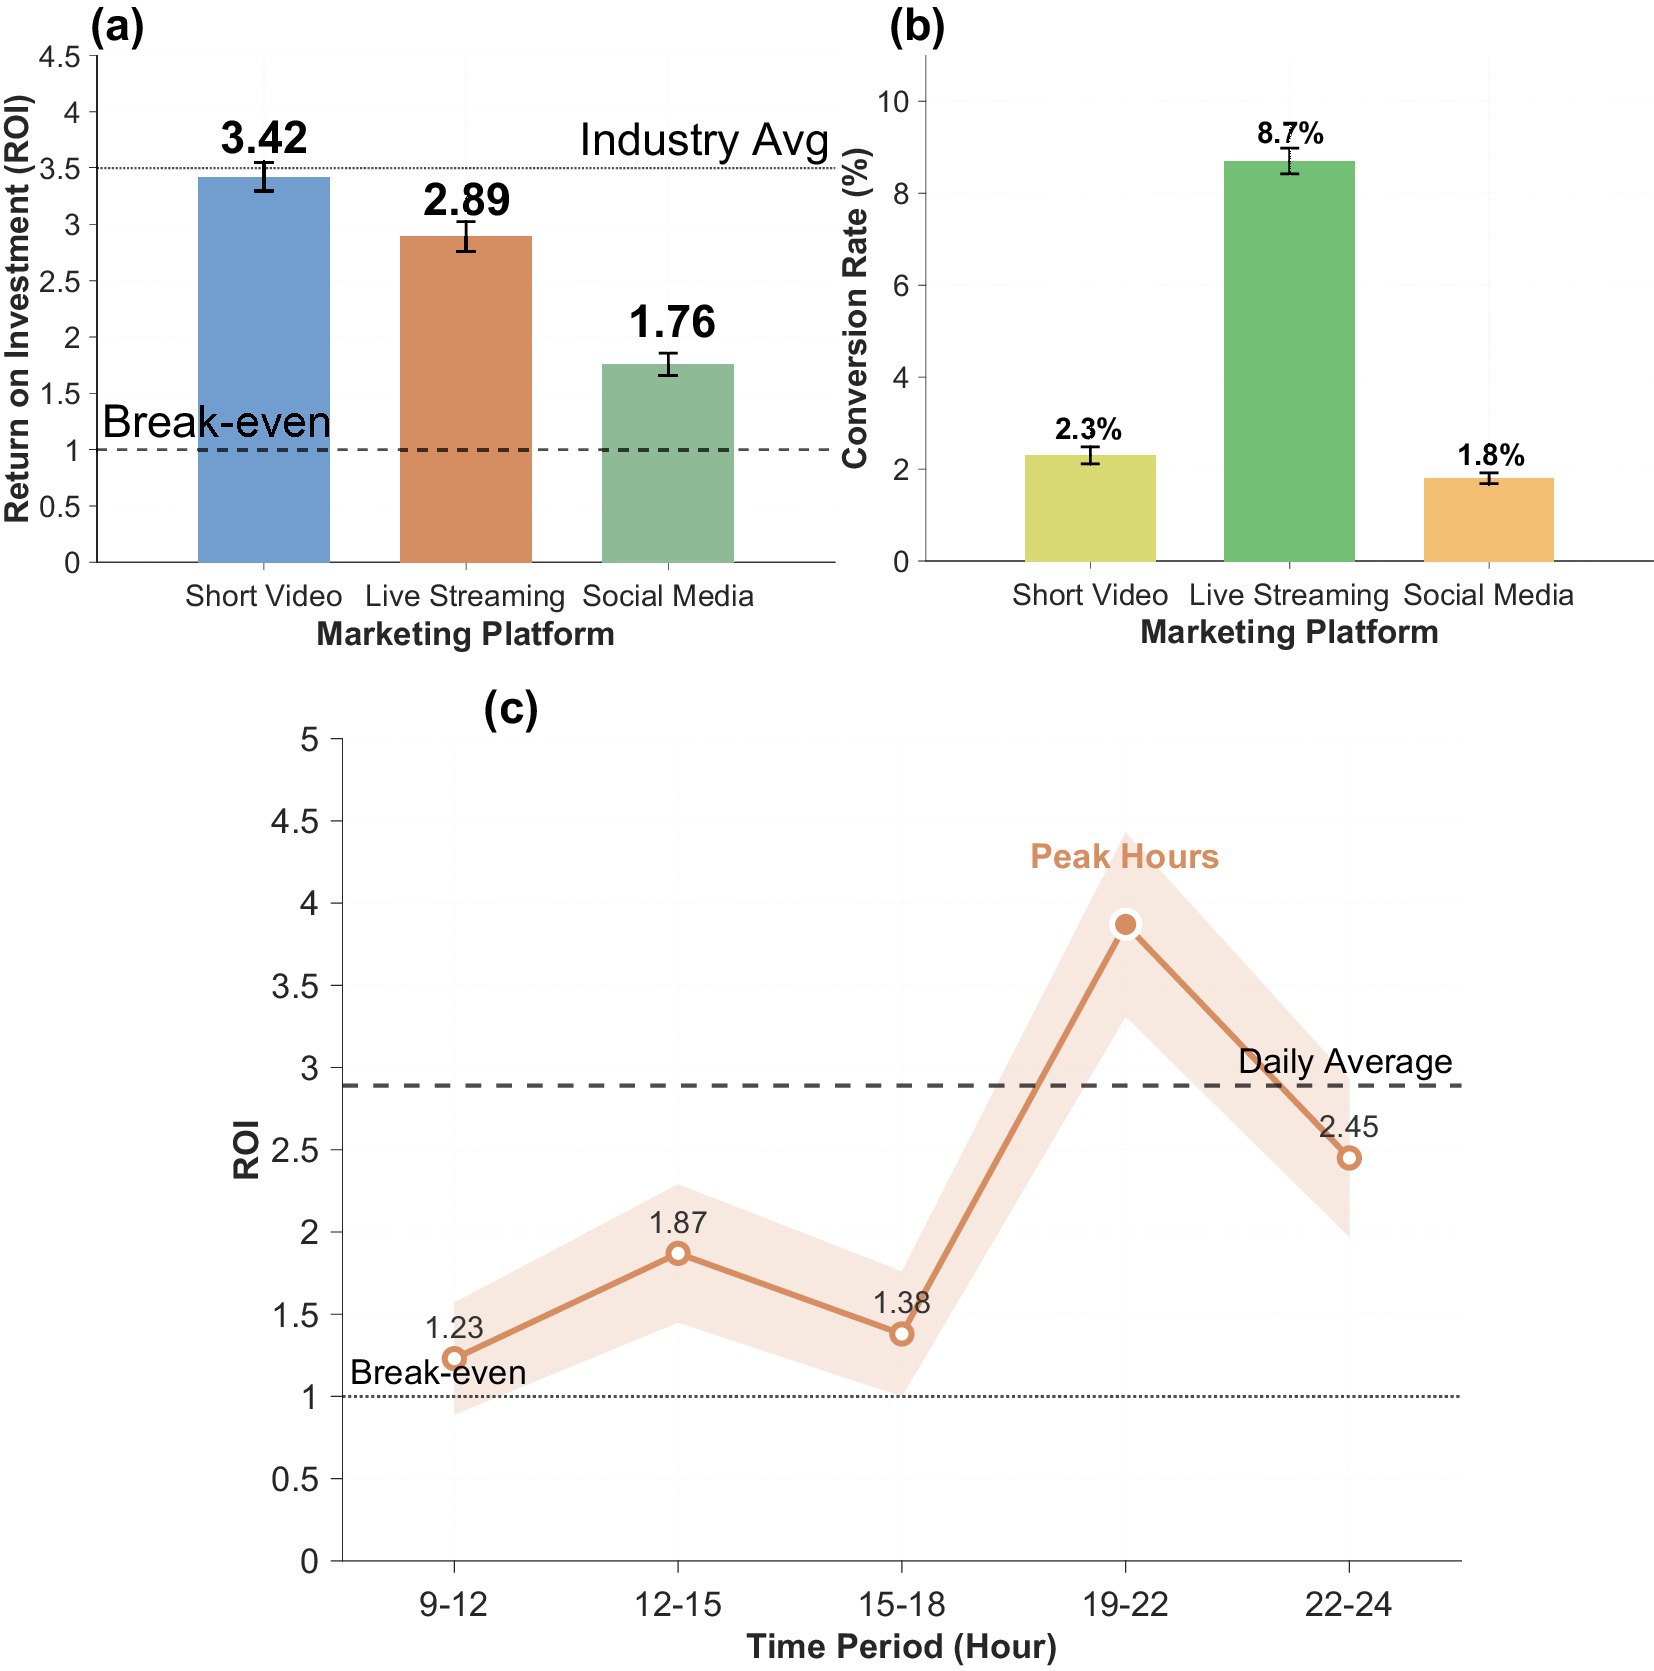
Figure 4. Platform marketing performance metrics. (a) Return on investment comparison across marketing platforms (Short Video, Live Streaming, Social Media); (b) Conversion rate comparison across the three marketing platforms; (c) ROI variation across different time periods throughout the day.
Although the overall ROI of live-streaming e-commerce is slightly lower (2.89, 95% CI: 2.31–3.47), it performs exceptionally well in terms of instant conversion and average transaction value increase. As shown in the conversion rate comparison in Figure 4b, the conversion rate of live-streaming e-commerce at 8.7% is the highest among all platforms, reflecting the sales advantage of real-time interaction. The average number of viewers in the live stream is 487, with a peak of up to 1,234, and the real-time interaction rate is as high as 34.5%. The period effect analysis in Figure 4c further shows that the ROI from 7 to 10 p.m. (3.87) is significantly higher than that of other periods, being 2.8 times that of the afternoon period (1.38). The key success factors include the professionalism of the streamer. Experienced streamers can increase the conversion rate to 12.3%, while novices only achieve 5.6%. The authenticity and experience of product display are the advantages of live-streaming e-commerce, especially for agricultural products and handicrafts. Consumers have more trust in the “Real-time product demonstration during live streams enhances authenticity and reduces perceived risk, as consumers can directly observe product quality and characteristics before purchase.” purchasing model. However, the operating costs of live-streaming e-commerce are relatively high. The comprehensive cost of a 2-h live-streaming session is approximately 856 yuan. The platform’s commission (15–20%) and technical threshold (with an average equipment investment of 3,456 yuan) restrict the participation of some merchants.
3.4 Heterogeneity analysis
Product types have a significant moderating effect on marketing effectiveness, and different business formats present differentiated response patterns. As shown in Table 6, the processing effect of merchants in the experience project category was the largest (9,234 yuan, p < 0.01), followed by the accommodation category (7,856 yuan, p < 0.01), and the effect of the catering category was relatively small (5,467 yuan, p < 0.05). This difference reflects the degree of match between product features and social media marketing. The experience projects (such as tea-picking, pottery, and folk performances) have a high visual impact and story-telling quality, making them particularly suiTab for short-video displays. The average number of likes for their marketing content (3,456) is 2.8 times that of the catering category (1,234). Accommodation products benefit from scenario-based marketing. The environment and distinctive decoration of homestays are well presented in videos, and the average transaction value is relatively high (averaging 458 yuan), which makes the marginal return on marketing investment higher. In contrast, catering products are confronted with the challenges of fierce homogenized competition and low average transaction value (averaging 76 yuan), and the visual presentation of food is greatly restricted by shooting technology. Interaction item analysis shows that the interaction effect of product type × platform is significant (F = 4.32, p = 0.015). Experience items perform best on short-video platforms, while the conversion rate of the catering category in live-streaming e-commerce is higher, which is related to consumers’ decision-making patterns.
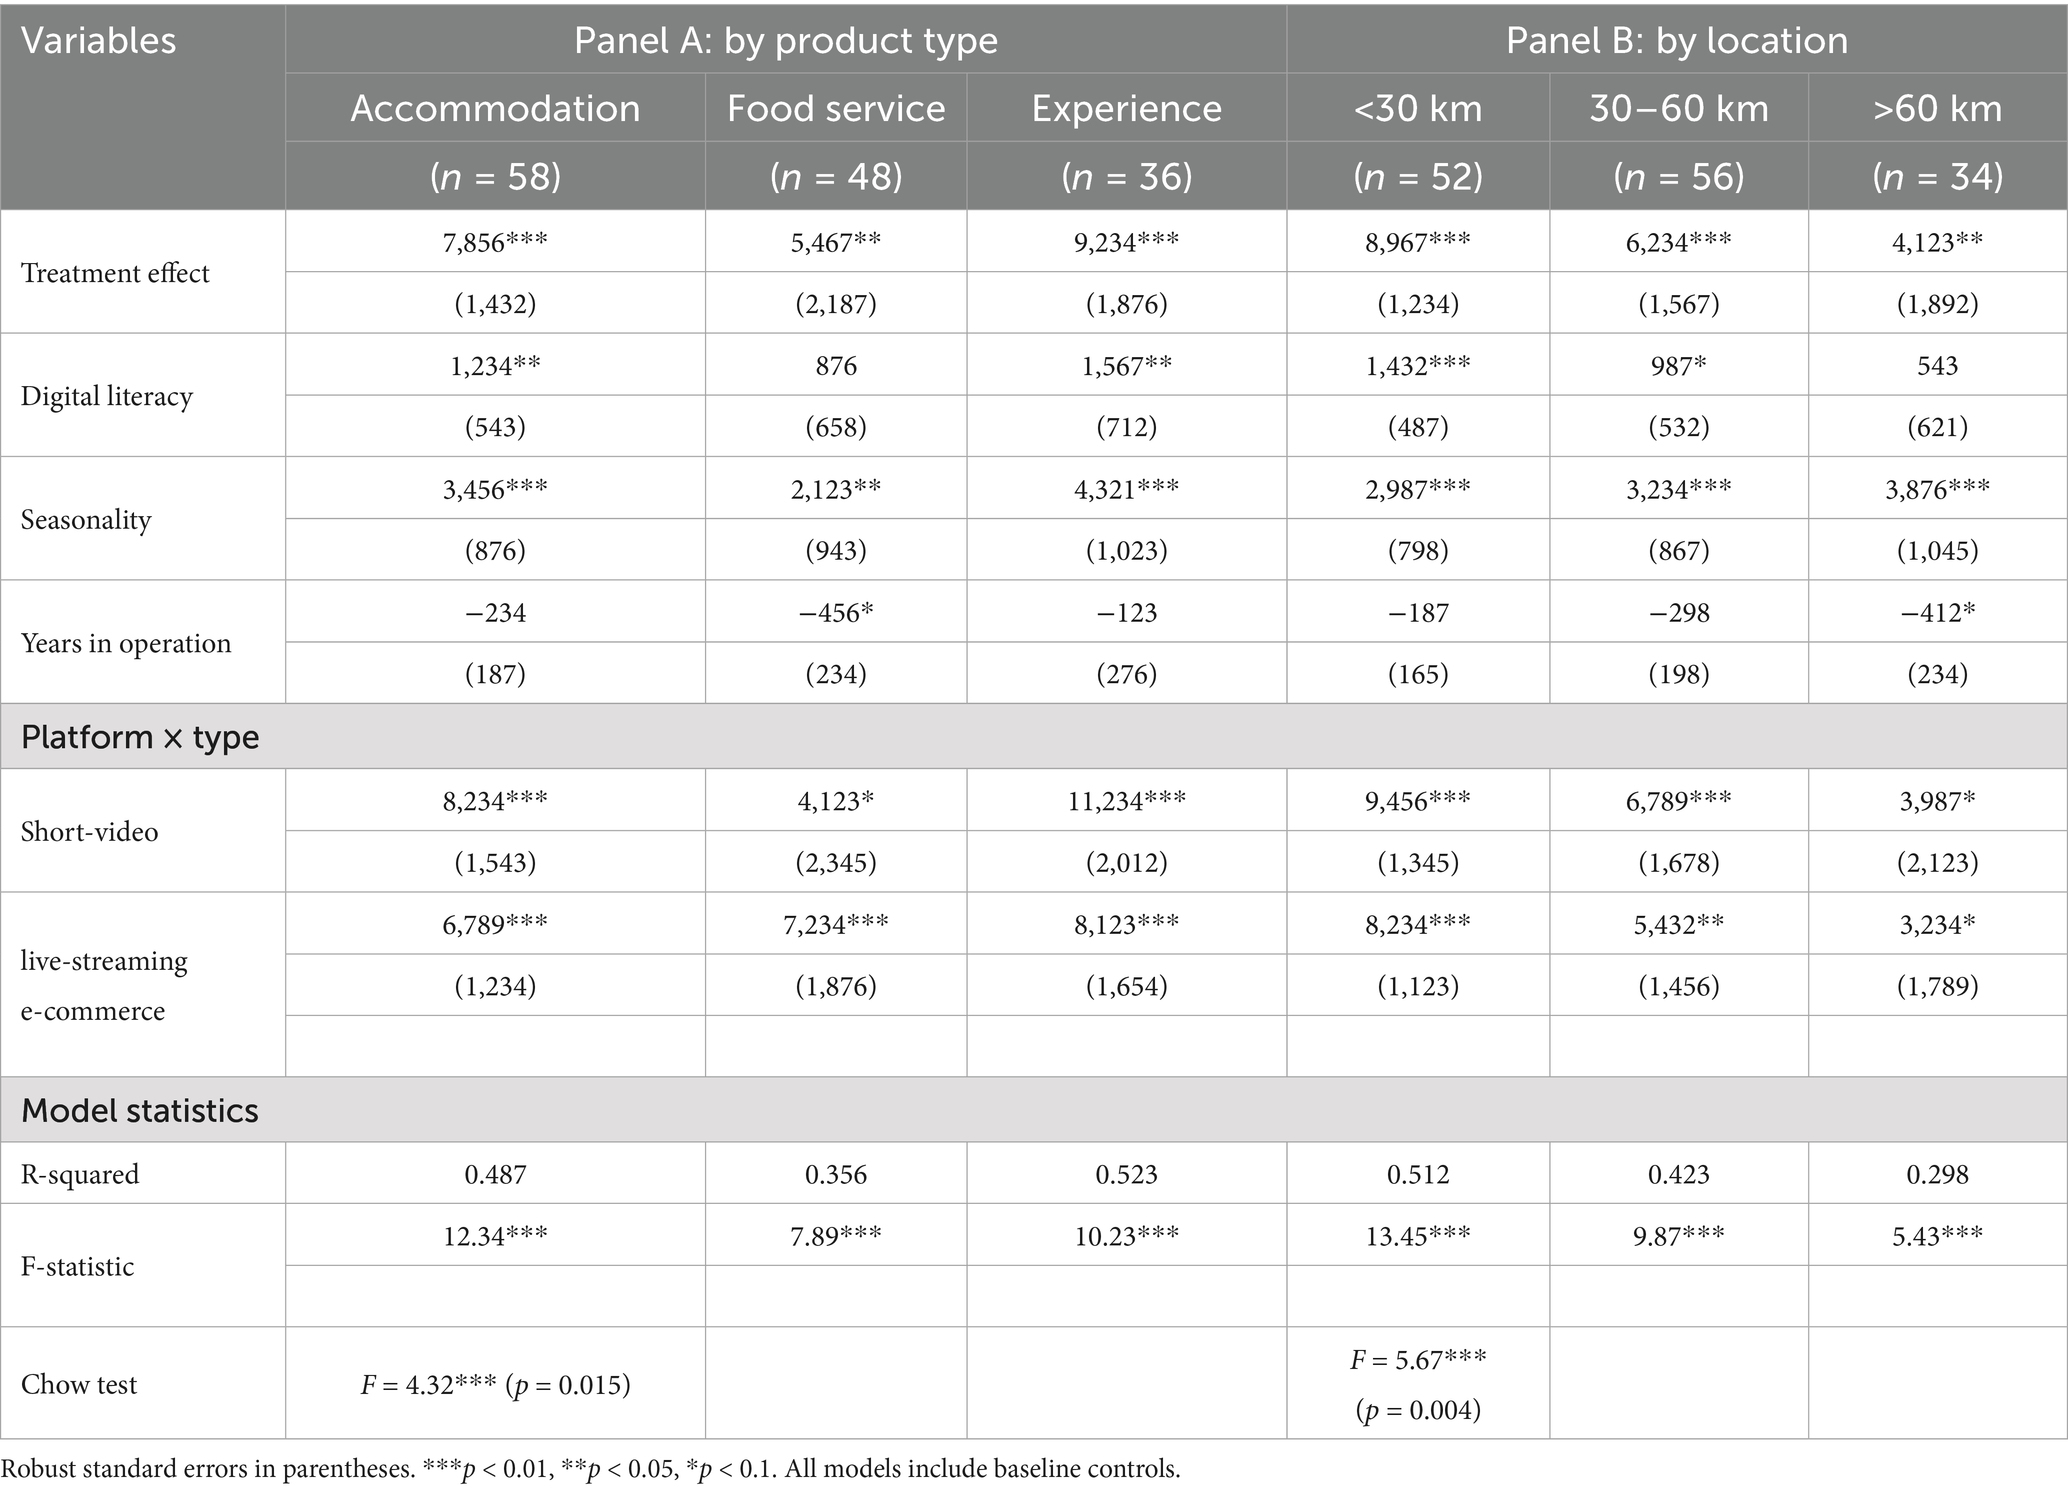
Table 6. Heterogeneity analysis results.
Geographical location significantly influences the realization path and intensity of marketing effectiveness. The processing effect of merchants in the near suburbs within 30 kilometers of the city center was 8,967 yuan (p < 0.001), while that of merchants in the medium distance of 30–60 kilometers was 6,234 yuan (p < 0.01), and that of merchants in the far suburbs over 60 km was only 4,123 yuan (p < 0.05), showing obvious distance attenuation characteristics. As shown in Panel B of Table 6, this difference is not only reflected in the absolute value, but also in the heterogeneity of the marketing mechanism. The advantage of nearby merchants lies in the high conversion rate brought by convenient transportation (7.8% vs. 3.2% in the far suburbs), and the proportion of immediate travel decisions on weekends reaches 42%. Mid-range merchants need stronger content appeal to compensate for the distance disadvantage. Their average video duration (38 s) and production quality are both higher than those of suburban merchants (28 s). Although the merchants in the far suburbs are rich in natural resources, they are faced with the predicament of “visible but inaccessible,” and their marketing effectiveness mainly relies on tourists who plan ahead. Interestingly, there is an interaction between geographical location and seasonality (β = 1,234, p = 0.048). The disadvantage of merchants in the far suburbs shrinks during peak seasons, possibly because tourists are willing to endure longer travel times during peak seasons.
3.5 Robustness checks
Alternative model estimation provides multi-angle effect verification, enhancing the reliability of research conclusions. As shown in Table 7, the average treatment effect estimated by propensity score matching (PSM) was 7,023 yuan (p < 0.01), slightly lower than that estimated by OLS but still highly significant. The instrumental variable method uses the distance between the merchant and the nearest training center as a tool. The two-stage least squares (2SLS) estimate is 7,892 yuan. The Hausman test does not reject the exogeneity assumption (p = 0.234), indicating that the original estimate has no serious endogeneity bias. Quantile regression revealed the distribution characteristics of the effect: the 25th percentile was 4,234 yuan, the median was 6,987 yuan, and the 75th percentile was 9,876 yuan, indicating a right-skewed distribution in marketing effects, with a few merchants achieving excess returns. The truncated mean after excluding outliers (5% before and after) was estimated at 6,845 yuan, still remaining significant. The 95% confidence interval obtained by the Bootstrap method (1,000 resampling) was (5,123, 8,967), which was basically consistent with the parameter estimation. The consistency results of these alternative methods indicate that the treatment effect is robust to the model setting and estimation methods.
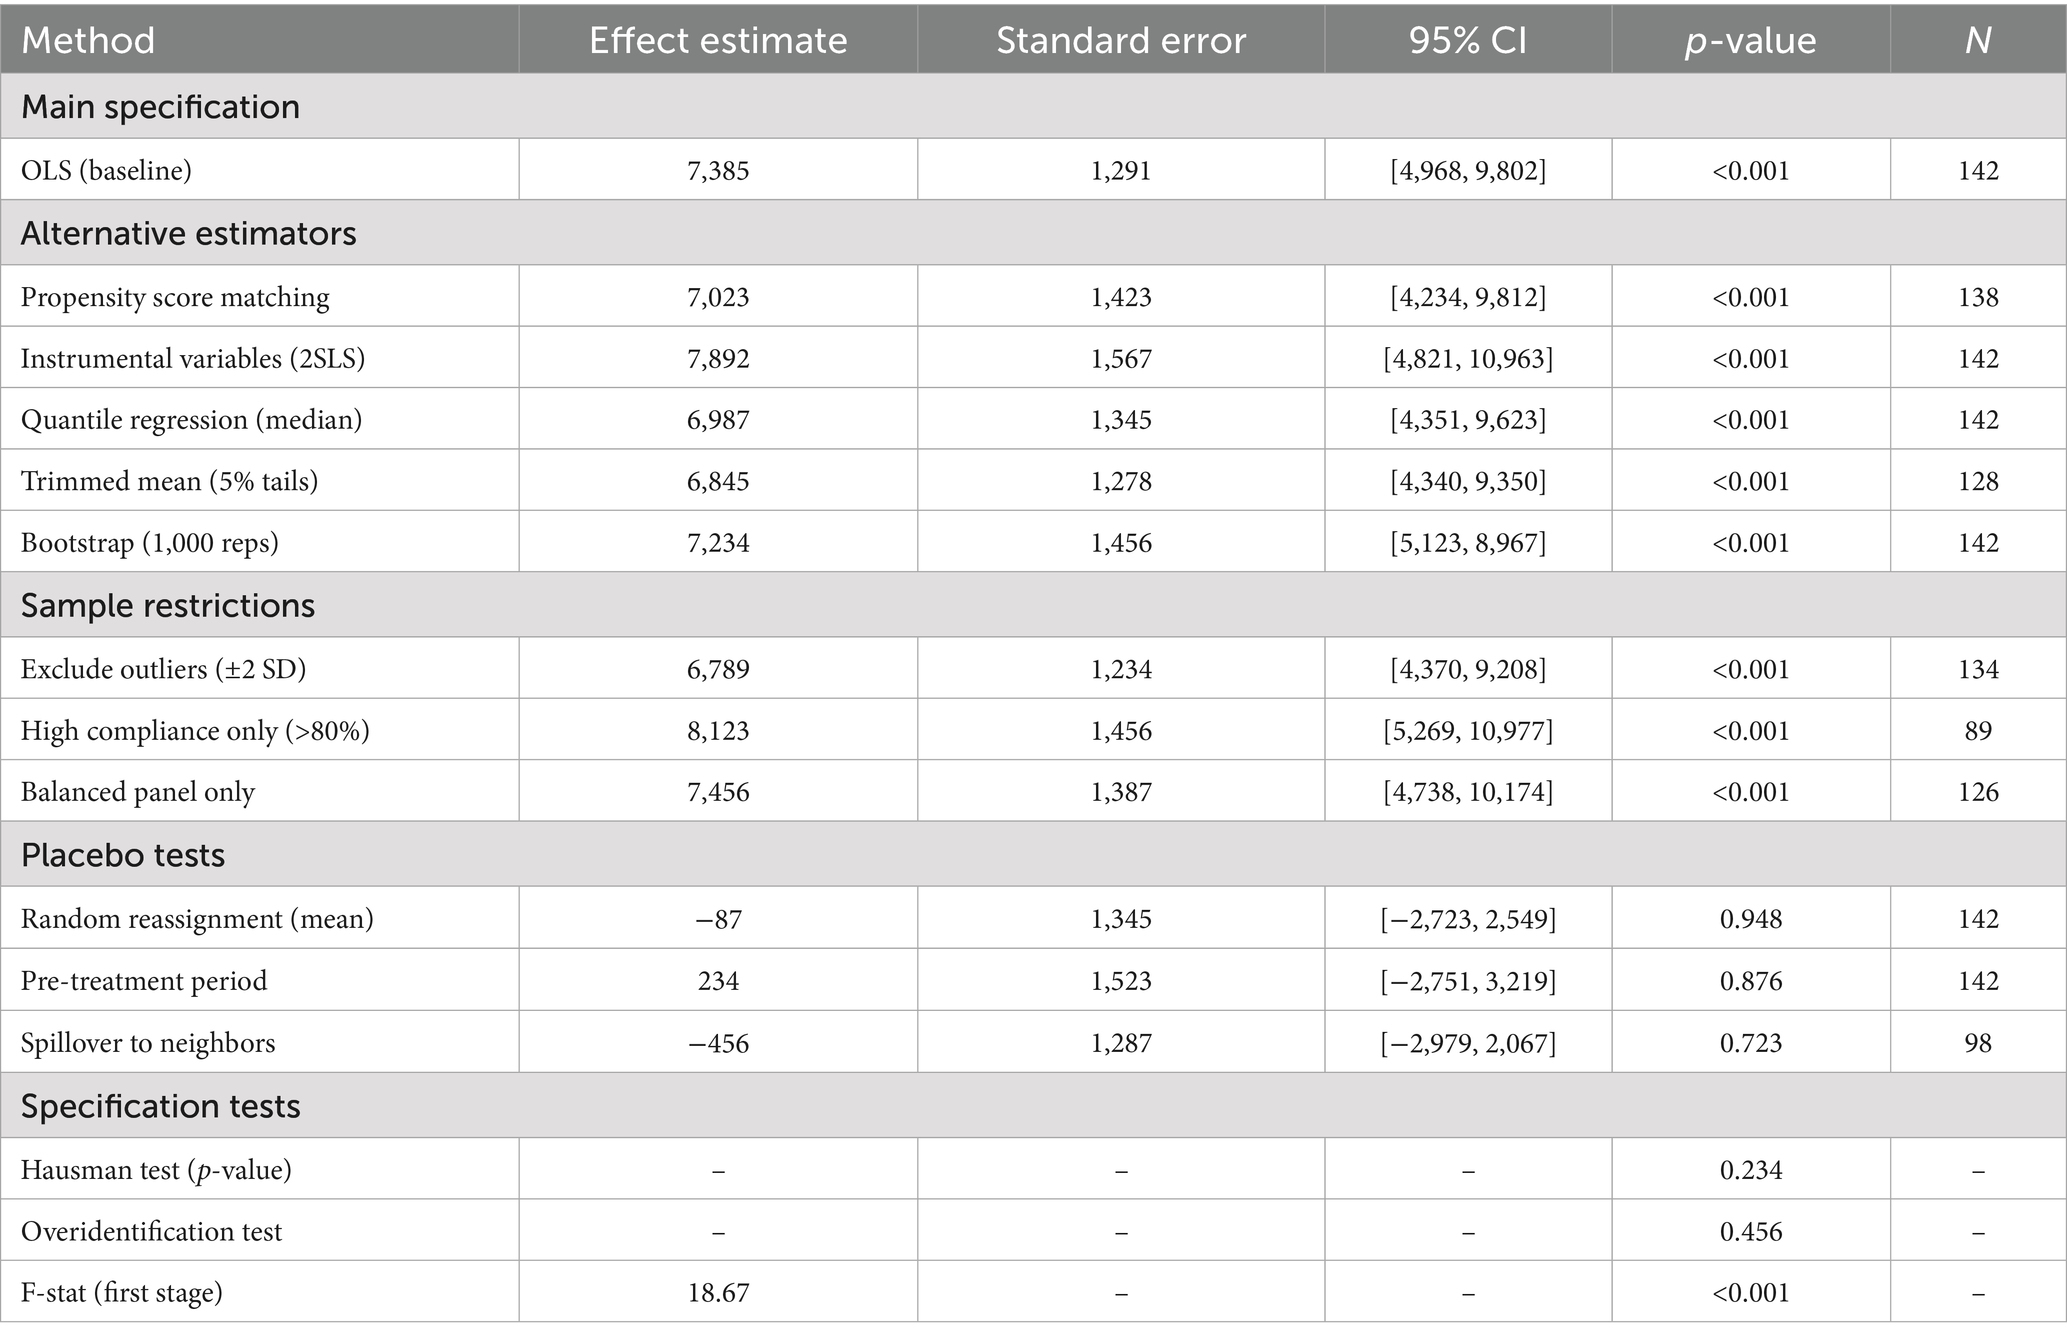
Table 7. Robustness check summary.
The placebo test further verified the authenticity of the causal relationship by constructing pseudotreatment. Firstly, the processing states were randomly reallocated 1,000 times. The generated pseudo-processing effect distribution presented a normal distribution with a mean of −87 yuan (standard deviation 1,345 yuan), and the actual observed effect of 7,385 yuan was located at the 99.8th percentile of the distribution, indicating that the real effect is almost impossible to be generated by random factors. Secondly, a pseudo-intervention test was conducted using historical data from the 12 weeks prior to the experiment, and the estimated effect was only 234 yuan (p = 0.876), confirming the parallel trend hypothesis. Thirdly, a spillover effect test was conducted on the neighboring merchants (n = 98) that did not participate in the experiment. It was found that the change in their sales was −456 yuan (p = 0.723), ruling out significant spatial spillover. As shown in the forest plot of Figure 5, the real treatment effect significantly deviates from the confidence interval of the placebo distribution, while the point estimates of various robustness tests converge in the range of 6,800–7,900 yuan, with similar standard errors, forming a convergent chain of evidence.
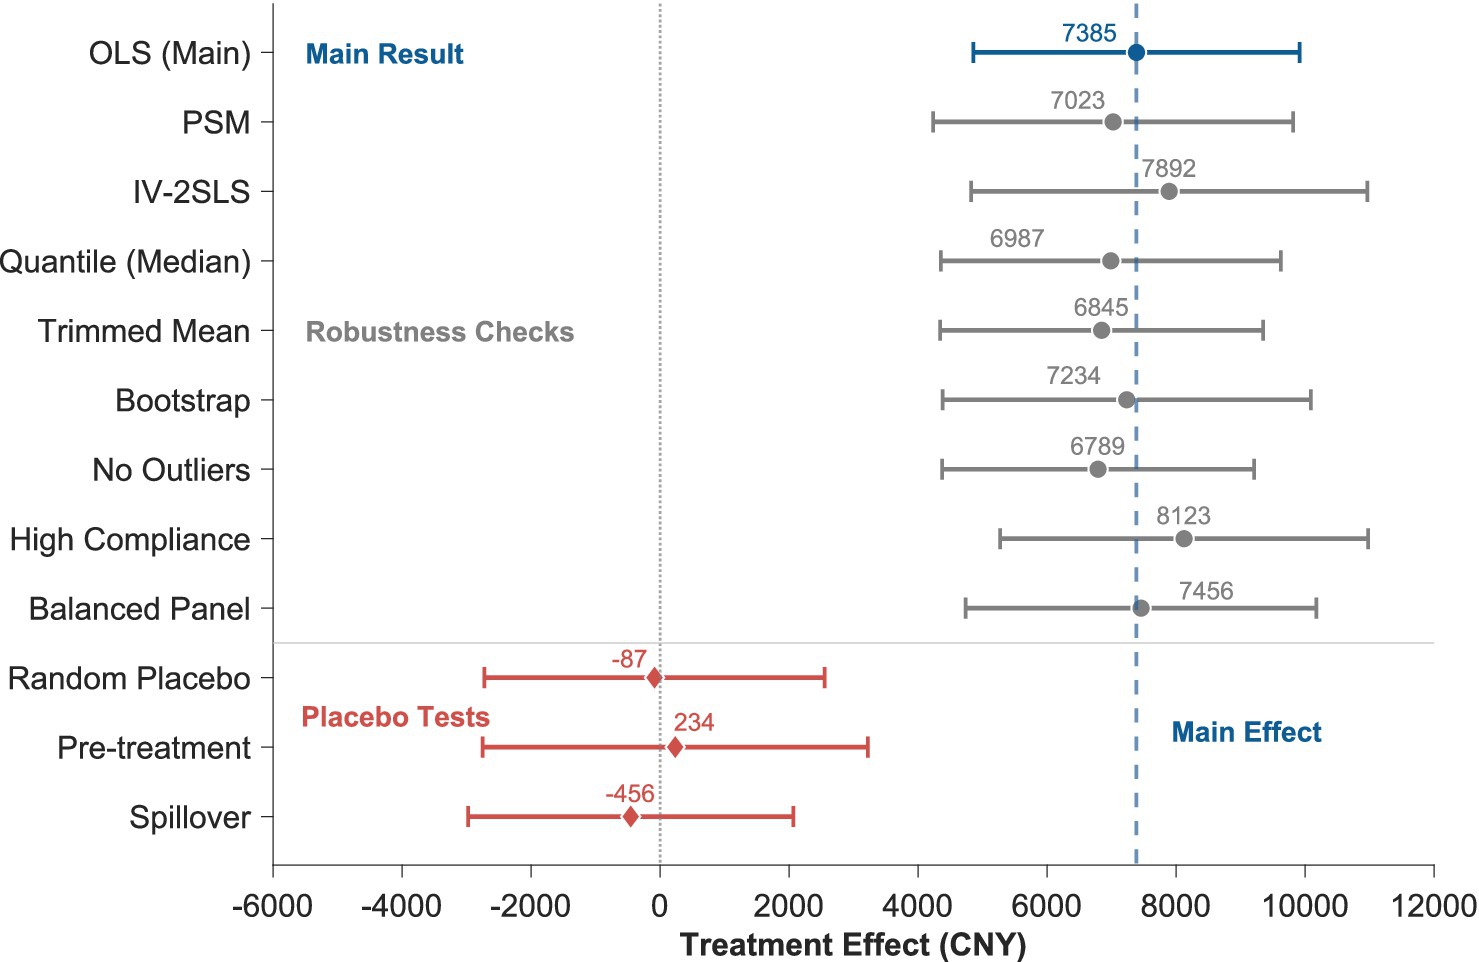
Figure 5. Forest plot of robustness checks.
4 Discussion
The observed treatment effect of 7,385 CNY (23.1% increase) in monthly sales substantially exceeds typical digital marketing intervention effect sizes in tourism contexts, which generally range from 15 to 20%. This superior performance reflects the unique characteristics of rural tourism markets where baseline digital penetration remains low and marginal returns to marketing investment consequently heightened. The platform-specific heterogeneity documented in this study advances theoretical understanding of how social media affordances interact with consumer psychology and product characteristics to shape marketing effectiveness (Ronzhyn et al., 2023).
The empirical findings validate the integrated theoretical framework while revealing nuanced mechanisms that transcend any single theory. Platform heterogeneity—short-video achieving ROI of 3.42 with 2.3% conversion versus live-streaming’s 8.7% conversion—demonstrates how affordance theory explains differential marketing pathways. Short-video platforms afford algorithmic scalability and persistent content, enabling awareness generation through high-volume exposure to young audiences (68.4% aged 18–35), whose initial engagement reflects elevated attention and curiosity rather than purchase intention (Liu et al., 2024). The 7–14 day conversion lag for short-video viewers indicates that this platform operates primarily through attitude formation and subjective norm amplification as specified by the Theory of Planned Behavior (Joo et al., 2020), where repeated exposure to visually compelling destination content gradually shifts purchase attitudes through social proof mechanisms and emotional resonance (Shang et al., 2021). Conversely, live-streaming’s superior conversion rate (8.7%) reflects mechanisms aligned with the S-O-R model: real-time product demonstration simultaneously reduces perceived risk and triggers cognitive engagement, while synchronous host-viewer interaction builds trust through perceived authenticity. Experienced streamers achieve 12.3% conversion versus novices’ 5.6%, suggesting that parasocial relationship development through the host’s apparent concern for viewer needs and transparent product explanation directly reduces purchase uncertainty (Zhang et al., 2024). This mechanism parallels findings in trust goods literature where consumer-seller interaction quality fundamentally shapes transaction decisions (Ye et al., 2024). The inferior ROI of live-streaming (2.89 versus short-video’s 3.42) reflects its higher operational costs (856 CNY per 2-h session, 3,456 CNY equipment investment threshold) despite higher conversion, indicating that platform affordances involve fundamental trade-offs between reach and conversion intensity.
Geographic distance decay from 8,967 CNY (within 30 km) to 4,123 CNY (beyond 60 km) provides empirical support for Theory of Planned Behavior’s perceived behavioral control dimension in tourism contexts. Despite digital platforms eliminating information asymmetries about rural destinations, they cannot overcome the physical friction costs of travel. Near-suburban merchants benefit from 7.8% conversion (versus 3.2% for remote locations) because weekend purchase decisions among nearby consumers occur with greater frequency (42% of immediate travel decisions), reflecting lower travel cost salience in destination choice. Remote merchants confront the “visible yet inaccessible” paradox where compelling digital content generates awareness but insufficient perceived behavioral control to convert interest into actual visits. This regional heterogeneity in digital marketing effectiveness parallels broader findings in rural development research showing stronger digital integration impacts in less-developed regions where marginal returns remain highest, extending the literature on rural digital economy development where evidence demonstrates that as digital infrastructure matures, its capacity to promote rural prosperity increases substantially (Lu et al., 2025), suggesting non-linear adoption dynamics in geographically dispersed markets. Interestingly, this distance penalty attenuates during peak tourism seasons when consumers’ willingness to tolerate longer travel times increases, suggesting temporal variation in perceived behavioral control constraints.
Product-type heterogeneity (9,234 CNY for experience-based offerings versus 5,467 CNY for food services) reveals interaction effects between affordance theory and S-O-R mechanisms. Experience products (tea-picking, pottery, folk performances) generate optimal returns through visual storytelling affordances of short-video platforms, receiving 2.8 times more engagement (3,456 average likes) than food content because immersive visual representation effectively communicates intangible experiential qualities (Xie et al., 2023). The S-O-R model explains this mechanism: experience product previews generate high-arousal emotional states establishing destination desirability before purchase consideration. Accommodation similarly benefits from scenario-based visual marketing, with higher average transaction values (458 CNY) amplifying marginal marketing returns. Food services face constrained effectiveness because visual presentation is limited by shooting technology and fierce competition produces homogenized market positioning, resulting in lower average transaction values (76 CNY) that reduce marketing ROI even with equivalent conversion rates. Notably, food product marketing effectiveness is further constrained by sustainability and regulatory dimensions beyond immediate sales considerations. Evidence demonstrates that environmental regulations and other institutional constraints shape consumer food purchasing decisions and producer competitiveness (Xu et al., 2025), particularly in agricultural contexts where regulatory frameworks facilitate sustainable production. This product-type variation demonstrates that social media marketing effectiveness depends fundamentally on alignment between platform affordances and product characteristics enabling authentic attribute communication, particularly for goods with high information asymmetry, while acknowledging that commodity-oriented products operate within broader institutional and regulatory constraints that moderate marketing effectiveness.
Temporal dynamics of treatment effects reveal important implementation implications. The initial four-week adaptation period reflects merchants’ learning curve in platform-specific content creation, after which effects escalate to peak at week 11 (Cohen’s d = 0.82) before moderating to 0.65. This inverted-U pattern differs substantially from urban tourism contexts where effects typically sustain longer, suggesting that rural markets’ smaller addressable audiences create audience saturation or algorithm depreciation effects. The plateau after week 11 likely reflects declining algorithmic recommendation priority for repeatedly-exposed content, consistent with platform mechanisms prioritizing novelty. This temporal heterogeneity underscores that sustained marketing effectiveness requires continuous content innovation rather than campaign repetition, with implications for both merchant strategy and experimental design methodology in tourism research.
5 Limitations and future research
Several limitations warrant acknowledgment. The geographic focus on Southwest China may constrain generalizability to rural contexts with different digital infrastructure, cultural characteristics, or institutional environments. The 16-week intervention captures short-to-medium term effects, with 6-month follow-up partially addressing longer-term sustainability; effects beyond this period remain uncertain. While randomization and statistical controls addressed major confounders, unobserved variables such as platform algorithm changes during the study period or competing merchants’ simultaneous marketing activities could influence results. The sample size of 142 merchants provides adequate statistical power for medium effect detection (Cohen’s d ≥ 0.47) but limits precision for detecting small effects (d = 0.3) or conducting highly granular subgroup analyses.
Attrition was minimal (2.1%, n = 3) with all dropouts occurring in the treatment group due to family health emergencies or unrelated business closures. Chi-square and t-tests revealed no significant baseline differences between completers and dropouts in business type, annual revenue, or digital literacy (all p > 0.60). Intention-to-treat analysis including dropouts yielded comparable results (effect = 7,223 CNY versus 7,385 CNY in per-protocol analysis), suggesting negligible bias. Nevertheless, selective dropout remains a potential internal validity threat in extended longitudinal studies with longer follow-up periods.
Future research should replicate this experimental design in diverse geographic and institutional contexts to test boundary conditions across different rural settings. Extended observation periods (12–24 months) would assess long-term sustainability and habituation effects beyond current knowledge. Automated platform engagement tracking through API integration would improve measurement precision beyond self-reported compliance metrics. Investigation of content quality and creative strategy effects independent of platform choice would illuminate whether platform affordances or content excellence drives differential outcomes. Finally, examination of potential negative externalities including overtourism or environmental impacts in fragile rural ecosystems would ensure comprehensive understanding of rural tourism digitalization consequences.
6 Conclusion
This randomized controlled trial establishes rigorous causal evidence that platform-specific social media marketing generates substantial economic returns for rural tourism enterprises. The 7,385 CNY average treatment effect (23.1% monthly sales increase, ROI 2.87) substantially exceeds pre-intervention predictions and demonstrates that structured digital marketing is economically viable even in resource-constrained rural contexts. Beyond quantifying effects, this research contributes theoretical advancement by demonstrating how three complementary frameworks—Theory of Planned Behavior, the S-O-R model, and social media affordance theory—operate in integrated fashion to explain heterogeneous treatment effects across platforms, products, and geographies. The platform dichotomy (short-video ROI 3.42 with 2.3% conversion; live-streaming 8.7% conversion with 2.89 ROI) reflects fundamental differences in user psychology and engagement mechanisms rather than simple channel preference. Short-video platforms generate awareness through emotional engagement and attitude formation, whereas live-streaming facilitates conversion through trust-building synchronous interaction and risk reduction. Product-type heterogeneity reflects affordance-product alignment: experiential offerings leveraging visual storytelling achieve highest returns (9,234 CNY), while commoditized food services constrained by visual representation and competitive homogenization show diminished returns (5,467 CNY). Geographic distance effects challenge conventional assumptions about digital marketing’s borderless nature, demonstrating that perceived behavioral control remains fundamentally constrained by physical travel costs despite information availability, with treatment effects declining 54% across the distance gradient.
For rural tourism practitioners, these findings establish that effective digital transformation requires sophisticated matching between platform affordances, product characteristics, and merchant capabilities rather than uniform technology adoption. Accommodation and experience-based operators should prioritize short-video as primary marketing channel with 3–5 weekly posts, accepting longer conversion cycles but achieving superior cost-efficiency. Food service and commodity merchants should emphasize live-streaming e-commerce with evening-hour scheduling (peak conversion periods) while leveraging real-time product demonstration to reduce purchase risk. The documented four-week adaptation period indicates that structured skill development is prerequisite to intensive campaigns, with performance plateauing absent continuous content innovation. For geographically remote destinations, realistic strategic expectations must acknowledge substantial marketing effect attenuation (approximately 54% of near-urban returns), necessitating either higher content volume, strategic urban distribution partnerships, or seasonal peak-period concentration.
For policy makers, findings identify specific intervention points where marginal policy investments generate disproportionate returns. Digital infrastructure remains foundational, as internet quality emerged as significant marketing effect moderator. This critical role of infrastructure aligns with broader rural development evidence demonstrating that digital financial inclusion and infrastructure investment substantially enhance agricultural productivity and enable rural revitalization (Jin and Zhong, 2024), while also bridging the digital divide to reduce income inequality and promote economic growth (Medhioub and Boujelbene, 2024), indicating the fundamental importance of comprehensive digital infrastructure as prerequisite to sectoral development initiatives. Capacity building initiatives should recognize the documented learning curve through tiered training programs progressing from basic digital literacy through intermediate content creation to advanced analytics. Platform-specific support—such as subsidized professional videography services for short-video creators or shared live-streaming studios reducing individual equipment barriers—directly reduces entry costs for resource-constrained merchants. Distance-sensitive subsidy design, providing higher support for remote merchants compensating for geographic disadvantages, should incorporate performance metrics ensuring that public investment produces measurable sales increases rather than mere platform adoption. Integration of environmental and sustainability considerations throughout capacity building and infrastructure investment merits attention, as evidence demonstrates that green finance mechanisms can simultaneously support environmental governance and rural green development (Zhang et al., 2025), while green finance reforms effectively unlock sustainability potential and enhance corporate ESG performance (Gao et al., 2024). These findings suggest that sustainable finance instruments can advance multiple sustainable development goals concurrently (Raman et al., 2025), indicating that comprehensive rural development requires simultaneous attention to economic efficiency and ecological sustainability. The 78% sustainability of effects at 6-month follow-up suggests that social media marketing generates durable benefits when implemented strategically, but this durability depends critically on continuous content innovation and platform engagement maintenance rather than one-time interventions.
Data availability statement
The original contributions presented in the study are included in the article/supplementary material, further inquiries can be directed to the corresponding author.
Author contributions
SC: Writing – original draft, Resources, Formal analysis, Visualization, Conceptualization, Validation, Methodology, Data curation, Investigation. YJ: Supervision, Writing – original draft, Writing – review & editing, Methodology, Conceptualization, Funding acquisition, Resources, Validation, Project administration.
Funding
The author(s) declare that financial support was received for the research and/or publication of this article. This research was funded by the General Project of Philosophy and Social Sciences Research in Jiangsu Universities. Project Title: Research on the Application of Digital Twin Technology in the Customization and Marketing of Personalized Rural Cultural Tourism Products (Grant No. 2025SJYB0979).
Conflict of interest
The authors declare that the research was conducted in the absence of any commercial or financial relationships that could be construed as a potential conflict of interest.
Generative AI statement
The authors declare that no Gen AI was used in the creation of this manuscript.
Any alternative text (alt text) provided alongside figures in this article has been generated by Frontiers with the support of artificial intelligence and reasonable efforts have been made to ensure accuracy, including review by the authors wherever possible. If you identify any issues, please contact us.
Publisher’s note
All claims expressed in this article are solely those of the authors and do not necessarily represent those of their affiliated organizations, or those of the publisher, the editors and the reviewers. Any product that may be evaluated in this article, or claim that may be made by its manufacturer, is not guaranteed or endorsed by the publisher.
References
Banas, J. (2017). “Z transformation” in The SAGE encyclopedia of communication research methods (Thousand Oaks: SAGE Publications, Inc.).
Bucher, T., and Helmond, A. (2018). “The affordances of social media platforms” in The SAGE handbook of social media. eds. J. Burgess, T. Poell, and A. Marwick (London: SAGE Publications Ltd).
Gao, D., Zhou, X., and Wan, J. (2024). Unlocking sustainability potential: the impact of green finance reform on corporate ESG performance. Corp. Soc. Responsib. Environ. Manag. 31, 4211–4226. doi: 10.1002/csr.2801
Hochreiter, V., Benedetto, C., and Loesch, M. (2023). The stimulus-organism-response (S-O-R) paradigm as a guiding principle in environmental psychology. J. Entrep. Bus. Dev. 3, 7–16. doi: 10.18775/jebd.31.5001
Hussain, T., Wang, D., and Li, B. (2024). Exploring the impact of social media on tourist behavior in rural mountain tourism during the COVID-19 pandemic: the role of perceived risk and community participation. Acta Psychol. 242:104113. doi: 10.1016/j.actpsy.2023.104113
Jin, S., and Zhong, Z. (2024). Impact of digital inclusive finance on agricultural total factor productivity in Zhejiang Province from the perspective of integrated development of rural industries. PLoS One 19:e0298034. doi: 10.1371/journal.pone.0298034
Joo, Y., Seok, H., and Nam, Y. (2020). The moderating effect of social media use on sustainable rural tourism: a theory of planned behavior model. Sustainability 12:4095. doi: 10.3390/su12104095
Kernan, W. N., Viscoli, C. M., Makuch, R. W., Brass, L. M., and Horwitz, R. I. (1999). Stratified randomization for clinical trials. J. Clin. Epidemiol. 52, 19–26. doi: 10.1016/S0895-4356(98)00138-3
Kim, M. J., Lee, C. K., and Jung, T. (2020). Exploring consumer behavior in virtual reality tourism using an extended stimulus-organism-response model. J. Travel Res. 59, 69–89. doi: 10.1177/0047287518818915
Li, K. T., and Shankar, V. (2024). A two-step synthetic control approach for estimating causal effects of marketing events. Manag. Sci. 70, 3734–3747. doi: 10.1287/mnsc.2023.4878
Liu, C., Jiang, M., and Muhammad, Z. A. (2024). The impact of TikTok short video factors on tourists' behavioral intention among generation Z and millennials: the role of flow experience. PLoS One 19:e0315140. doi: 10.1371/journal.pone.0315140
Lu, Z., Gou, D., Wu, Q., and Feng, H. (2025). Does the rural digital economy promote shared prosperity among farmers? Evidence from China. Front. Sustain. Food Syst. 9:1649753. doi: 10.3389/fsufs.2025.1649753
Luo, G., Yang, Y., and Wang, L. (2023). Driving rural industry revitalization in the digital economy era: exploring strategies and pathways in China. PLoS One 18:e0292241. doi: 10.1371/journal.pone.0292241
Mahalakshmi, S. (2023). “Exploring the role of social media influencers in shaping tourist motivation for rural tourism” in Emergent research on business and society: an India-centric perspective. eds. U. Salunkhe, V. Kumar, D. N. Murthy, and B. Rajan (London: Transnational Press London), 143–158.
Medhioub, N., and Boujelbene, Y. (2024). Bridging the digital divide: innovation, economic growth and income inequality. Innov. Dev. 1-26, 1–26. doi: 10.1080/2157930X.2024.2401236
Mehrabian, A., and Russell, J. A. (1974). An approach to environmental psychology. Cambridge: MIT Press.
Moriyama, T., and Kuwano, M. (2022). Causal inference for contemporaneous effects and its application to tourism product sales data. J. Mark. Anal. 10, 250–260. doi: 10.1057/s41270-021-00130-x
Raman, R., Ray, S., Das, D., and Nedungadi, P. (2025). Innovations and barriers in sustainable and green finance for advancing sustainable development goals. Front. Environ. Sci. 12:1513204. doi: 10.3389/fenvs.2024.1513204
Ronzhyn, A., Cardenal, A. S., and Batlle Rubio, A. (2023). Defining affordances in social media research: a literature review. New Media Soc. 25, 3165–3188. doi: 10.1177/14614448221135187
Shang, Y., Mehmood, K., Iftikhar, Y., Li, H., Zaman, K., Yu, Y., et al. (2021). Energizing intention to visit rural destinations: how social media disposition and social media use boost tourism through information publicity. Front. Psychol. 12:782461. doi: 10.3389/fpsyg.2021.782461
Shen, Z. (2023). Platform or content strategy? Exploring engagement with brand posts on different social media platforms. Soc. Media Soc. 9:21582440231219096. doi: 10.1177/21582440231219096
Souza-Neto, V., Moyle, B., Santos, G. E. D. O., and Jiang, Y. (2025). Leveraging experimental designs in tourism economics research. Tour. Econ. 1–25. doi: 10.1177/13548166251351277
Stylianou, C., Pipyros, K., and Aslanides, A. (2025). Rural place branding through social media: a stakeholder strategy perspective. Worldw. Hosp. Tour. Themes 17, 62–76. doi: 10.1108/WHATT-12-2024-0297
Xie, X., Lee, J. S., and Kang, S. (2023). How do short videos influence users' tourism intention? A study of key factors. Front. Psychol. 14:1215481. doi: 10.3389/fpsyg.2023.1215481
Xiong, C., Wang, Y., Wu, Z., and Liu, F. (2024). What drives the development of digital rural life in China? Heliyon 10:e40297. doi: 10.1016/j.heliyon.2024.e40297
Xu, M., Zhao, J., Lei, T., Shi, L., Tan, Y., He, L., et al. (2025). The influence mechanism of environmental regulations on food security: the mediating effect of technological innovation. Environ. Sci. Eur. 37:83. doi: 10.1186/s12302-025-01137-2
Ye, F., Ji, L., Ning, Y., and Li, Y. (2024). Influencer selection and strategic analysis for live-streaming e-commerce selling. J. Retail. Consum. Serv. 77:103673. doi: 10.1016/j.jretconser.2023.103673
Zhang, S. K., Tang, T. Y., and Krallman, A. (2024). Navigating livestream commerce: a dual-lens framework of influencers' impact on product sales. J. Bus. Res. 185:114919. doi: 10.1016/j.jbusres.2024.114919
Zhang, D., Zhao, N., and Yang, Z. (2025). The impact of green finance on rural green development: theory and evidence. Financ. Res. Lett. 84:107648. doi: 10.1016/j.frl.2025.107648
Keywords: rural tourism, social media marketing, live-streaming e-commerce, digital transformation, rural entrepreneurship
Citation: Cheng S and Jiang Y (2025) Effects of social media marketing on rural tourism product sales: evidence from controlled experiments. Front. Sustain. Food Syst. 9:1714233. doi: 10.3389/fsufs.2025.1714233
Edited by:
Yang Shen, Xiamen University, ChinaReviewed by:
Andy Yang, Monash University, AustraliaZhaoyang Lu, Southwest University of Political Science and Law, China
Yifei Wang, University of International Business and Economics, China
Copyright © 2025 Cheng and Jiang. This is an open-access article distributed under the terms of the Creative Commons Attribution License (CC BY). The use, distribution or reproduction in other forums is permitted, provided the original author(s) and the copyright owner(s) are credited and that the original publication in this journal is cited, in accordance with accepted academic practice. No use, distribution or reproduction is permitted which does not comply with these terms.
*Correspondence: Yi Jiang, ZHFtbzc5MTlAb3V0bG9vay5jb20=