 Zhaodan Cao
 Tingju Zhu
 Baofu Li
 Yuhan Yan2,4
 Yanfeng Chen
- 1Sino-Belgian Joint Laboratory for Geoinformation, School of Geography and Tourism, Qufu Normal University, Rizhao, China
- 2ZJU-UIUC Institute, Zhejiang University, Haining, China
- 3Department of Civil and Environmental Engineering, University of Illinois at Urbana-Champaign, Urbana, IL, United States
- 4College of Civil Engineering and Architecture, Zhejiang University, Hangzhou, China
- 5Institute of Environment and Ecology, Tsinghua Shenzhen International Graduate School, Tsinghua University, Shenzhen, China
Formulating sustainable canal-well conjunctive irrigation and drainage strategies remains a critical challenge for arid irrigated agriculture confronting with water scarcity and salinization, primarily due to the multifaceted impacts of such strategies on water-land allocation, water-salt dynamics, agricultural profitability and food security. This study developed an integrated hydroeconomic optimization framework for canal-well conjunctive irrigation and drainage management by integrating agro-hydrological processes (inter-annual root-zone/groundwater water-salt dynamics, salinity-stressed crop yield assessment, canal-well conjunctive irrigation module) into an economic optimization framework. Positive Mathematical Programming (PMP) was employed to calibrate the hydroeconomic framework to base-year observations, enabling it to capture farmers’ adaptive decisions under policy interventions. The framework was run continuously over a 15-year horizon under strategies defined by groundwater drainage capacity (α) and surface-to-groundwater irrigation area ratio (SGIAR) in the Hetao Irrigation District (HID). We assessed the impacts of these strategies on optimal cropping pattern and water allocation decisions, and the consequent feedback effects of these decisions on water-salt dynamics, agricultural profitability, and food security. Results show reducing SGIAR by 70% expands grain areas, enhances food security, reduces root-zone/groundwater salinity by 9.2%/8.0%, and saves 9.7% total conjunctive water consumption. In contrast, increasing SGIAR undermines food security. Enhancing α to 0.21 annually mitigates salinization and boosts productivity and benefits. Notably, the “10% SGIAR reduction and α = 0.21” scenario emerges as a sustainable strategy which annually increases net benefits, alleviates salinization, conserves water, sustains food security, and ensures groundwater sustainability. This study offers a hydroeconomic framework and policy insights for advancing sustainable irrigated agriculture in the HID and analogous arid irrigated systems worldwide.
1 Introduction
Irrigation is crucial to global agricultural production, food security, regional economic development, climate change adaptation, and even social and political stability (Cai et al., 2018; McDermid et al., 2023). Without irrigation, global grain production would decline by approximately 20% (Yang et al., 2023). Yet, irrigated agriculture in arid regions accounts for more than 95% of total freshwater consumption, exacerbating water scarcity (FAO, 2022). Compounding this challenge, two-thirds of the world’s saline lands are concentrated in arid regions (FAO, 2021). Consequently, irrigated agriculture in arid regions faces the pressing challenges of water shortage and prevalent soil salinization (Zhu et al., 2019).
Canal-well conjunctive irrigation has emerged as a promising strategy to effectively address water scarcity and salinization challenges (Hou et al., 2025). However, formulating sustainable canal-well conjunctive irrigation-drainage strategies remains complex due to the intrinsically interconnected impacts of such strategies on water-salt dynamics and salinization, agricultural productivity and profitability, food security, and farmers’ water-land resource allocation decisions. To illustrate this complexity, first, excessive surface water irrigation, along with inadequate groundwater drainage, tends to raise groundwater table, trigger soil salinization, and reduce crop yields and farm profits. In contrast, groundwater irrigation can alleviate surface water shortages (particularly under climate change) (Niazi et al., 2025) and lower groundwater table to mitigate salinization (Gao et al., 2024). Yet, over-reliance on groundwater irrigation reduces surface water irrigation, which in turn limits the salt leaching from the root-zone and intensifies salinization. Notably, soil salinization, in turn, reduces crop yields and net benefits, promoting farmers to adjust cropping patterns and water allocation decisions. Such adaptive decisions by farmers then exert cascading feedback effects on soil-groundwater water-salt dynamics, agricultural profitability, and regional food security. Therefore, identifying canal-well conjunctive irrigation-drainage policies that reconcile these inherent trade-offs is crucial yet challenging, especially for arid irrigated agriculture where water scarcity and soil salinization jointly jeopardize agricultural sustainability. However, critical knowledge gaps persist in developing integrated frameworks to integrate these interconnected biophysical, economic, and farmer-behavioral feedbacks holistically to quantify trade-offs and identify sustainable strategies.
Most existing studies on canal-well conjunctive irrigation reply on agro-hydrological simulations to analyze key agro-hydrological processes (e.g., crop growth, water-salt balance) and to identify suitable values for surface-to-groundwater irrigation area ratio (SGIAR) under pre-specified management scenarios. Common simulation models include HYDRUS-1D (Li et al., 2010), EPIC (Zhang et al., 2022), SaltMod (Mao et al., 2017), Hydrus-Dualkc (Ren et al., 2018), EPIC-VADOSE (Liu et al., 2019, 2020), and MODFLOW-MT3DMS (Mao et al., 2022). While these studies and models have advanced understanding of how conjunctive irrigation can facilitate groundwater balance and long-term sustainability, they suffer from some limitations. First, they primarily compare pre-set scenarios to identify sub-optimal strategies, rather than solving for mathematically optimal solutions, limiting their ability to pinpoint the most effective management options (Singh, 2014). Second, physics-based simulations for complex agro-hydrological processes demand extensive data and substantial computational resources, restricting their applicability to field scales and limiting their utility for irrigation district-level management and policy analysis. Third, these models typically presume fixed cropping patterns and water allocation schemes, yet fail to incorporate farmers’ annual adaptive adjustments on water-land resource reallocations which feed back into soil-groundwater water-salt dynamics, crop yields, and agricultural profitability. Besides, there remains a lack of a comprehensive framework to integrate salinization dynamics in both root-zone and groundwater, agricultural profitability and food security, and farmers’ adaptive water-land allocation decisions. These limitations collectively hinder existing simulation models from identifying optimal policy interventions for canal-well conjunctive management in arid irrigated systems, particularly at the irrigation district scale.
Hydroeconomic models (HEMs) can address these limitations by integrating agro-hydrological physical constraints and institutional water policy rules into economic optimization frameworks, enabling the identification of optimal water-land allocation decisions that maximize agricultural net economic benefits (Valle-García et al., 2025). As integrated simulation-optimization tools, HEMs uniquely enable the evaluation of socioeconomic impacts while explicitly accounting for agricultural and hydrological physical processes (Harou et al., 2009; Jaeger et al., 2024; Hu et al., 2025; Niazi et al., 2025), making them particularly well-suited and widely applied for conjunctive surface-groundwater management (MacEwan et al., 2017; Yao, 2020; Kumar et al., 2023; Jaeger et al., 2024; Rastegaripour et al., 2024). For example, Lambert et al. (2025) developed a HEM to optimize cropping patterns and water allocations over a 10-year planning horizon, balancing groundwater sustainability with agricultural profitability under varying groundwater extraction rates, energy prices, and discount rates. Jaeger et al. (2024) developed a HEM by linking a groundwater hydrology model with an agricultural economic model to inform policies for stabilizing regional groundwater levels. Aein and Alizadeh (2021) integrated salinity-induced impacts on crop productivity into HEMs to guide water-salinity management for irrigated agriculture. However, few existing HEMs explicitly integrate inter-annual salinity dynamics in root-zone soil and groundwater, alongside farmers’ adaptive decisions of adjusting cropping patterns and water allocations, all of which are critical to salinization-threatened arid irrigated systems.
To fill these gaps, this study developed an integrated HEM framework for canal-well conjunctive irrigation-drainage management in the Hetao Irrigation District (HID), a typical arid irrigated redistrict in China where water scarcity and salinization pose significant threats to long-term agricultural sustainability. The HEM framework embeds key agro-hydrological processes (i.e., root-zone and groundwater water-salt balance dynamics, groundwater drainage simulation, salinity-driven crop yield assessment, and a canal-well conjunctive irrigation module) into an economic optimization framework for optimizing agricultural water and land allocation decisions. To enhance model reliability and capture farmers’ adaptive decision-making (i.e., adaptive adjustments of water and land allocations in response to salinity variations under policy interventions), the framework is calibrated using a self-calibrating Positive Mathematical Programming (PMP) approach, which reliably replicates base-year observations. This design ensures the framework is well-suited for analyzing canal-well conjunctive irrigation-drainage policies in salinization-prone arid irrigated systems, with the HID as a case study region.
Leveraging the developed HEM, this study evaluates canal-well conjunctive irrigation-drainage strategies characterized by two key parameters: surface-to-groundwater irrigation area ratio (SGIAR) and groundwater drainage capacity. Specifically, this study seeks to address two critical knowledge gaps: (1) How do varying canal-well conjunctive irrigation-drainage strategies exert inter-annual systemic impacts on farmers’ adaptive decisions of optimizing cropping patterns and irrigation water allocations, and the subsequent feedback effects of these decisions on soil-groundwater water-salt dynamics, agricultural productivity and profitability, and food security? And (2) What targeted sustainable canal-well conjunctive irrigation-drainage strategies can simultaneously improve agricultural profitability, mitigate soil-groundwater salinization, ensure food security, and safeguard long-term groundwater sustainability in the HID? By addressing these questions, this study aims to advance sustainable canal-well conjunctive water management for arid irrigated agriculture in the HID and analogous arid irrigated systems worldwide.
2 Materials and methods
2.1 Agricultural production practice
The Hetao Irrigation District (HID) is located in the upper Yellow River basin and is one of the three super-large irrigation districts in China. The HID is administratively divided into five sub-irrigation districts: Wulanbuhe (WLBH), Jiefangzha (JFZ), Yongji (YJ), Yichang (YC), and Wulate (WLT) (Figure 1). The HID has an average annual precipitation of 130–210 mm and an annual potential evaporation of 2,100–2,300 mm. Notably 63.6% of the total cultivated areas is affected by soil salinization (Li D. et al., 2020). Irrigated agricultural in the HID thus faces severe challenges of water scarcity and soil salinization (Hetao Irrigation District Administration, 2019), threatening food security, economic profitability, and environmental sustainability (Mao et al., 2022).
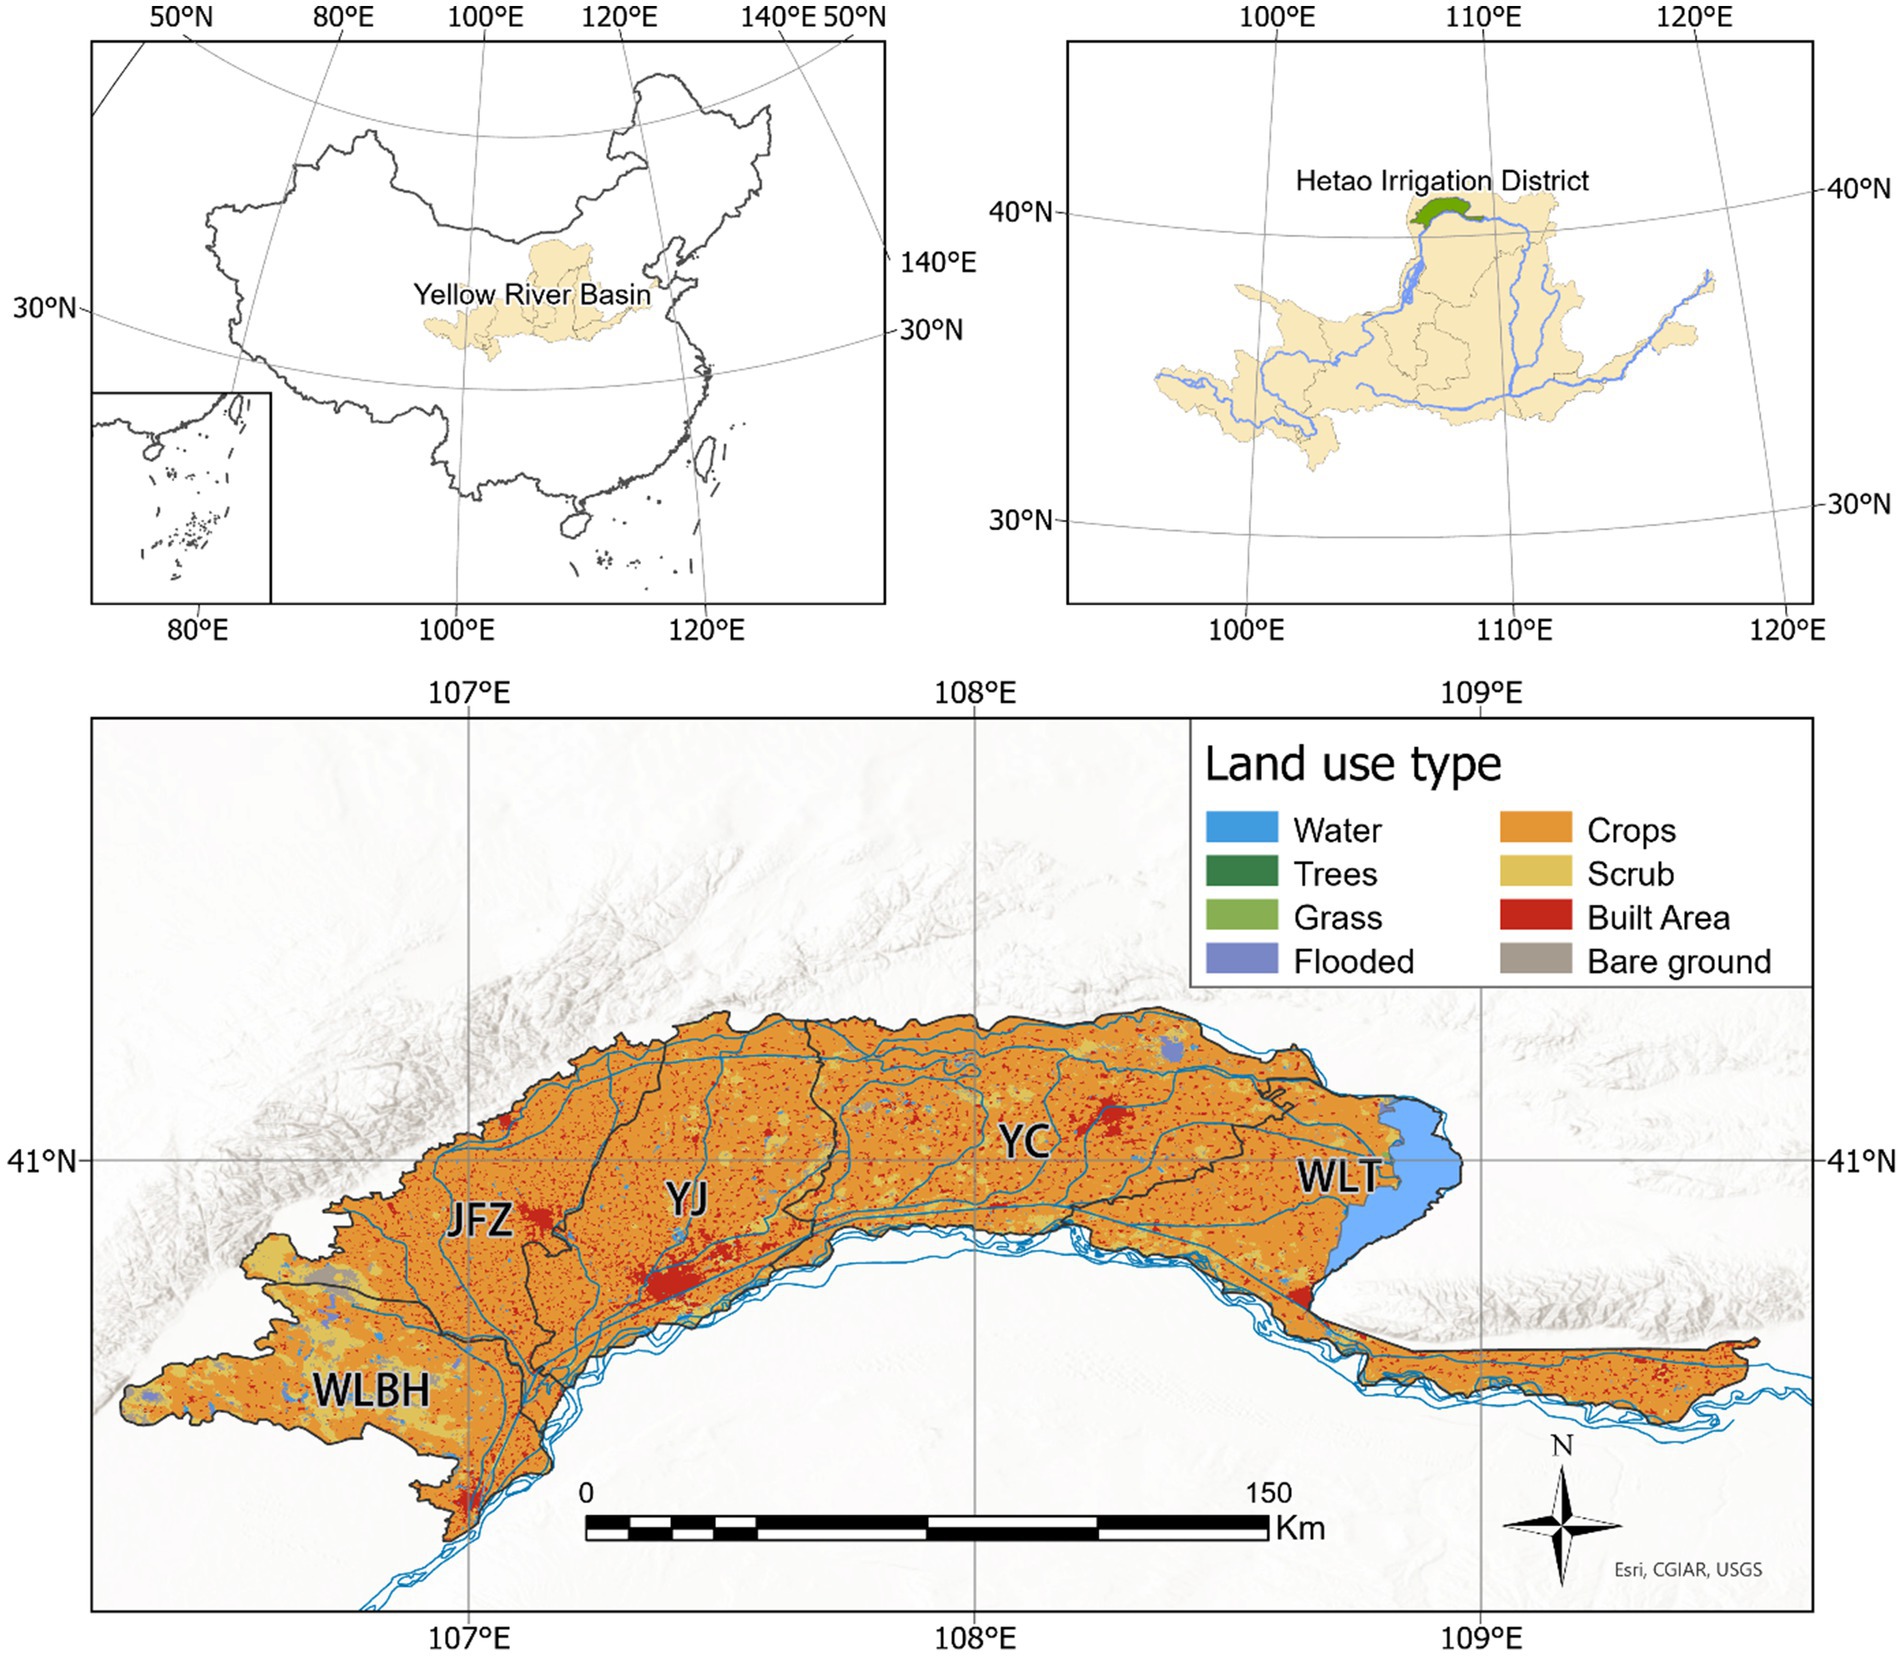
Figure 1. Location and land use types in the Hetao Irritation District (HID). WLBH, JFZ, YJ, YC, and WLT represent the five sub-irrigation districts of Wulanbuhe, Jiefangzha, Yongji, Yichang, and Wulate, respectively. The black lines denote the boundaries among sub-irrigation districts. The blue lines illustrate the irrigation and drainage canals in the HID. Maps created using ArcGIS software. Land use types in HID extracted from Esri 2020 Land Cover. Copyright © 2025 Esri and its licensors. All rights reserved.
Along with reduced irrigation diversions from Yellow River into the HID, canal-well conjunctive irrigation has emerged as a critical strategy for the arid HID to alleviate irrigation water scarcity and soil salinization. Approximately 45% of the irrigated area in the HID depends on the conjunctive use of surface and groundwater (i.e., canal-well conjunctive irrigation), and is categorized as the Canal-Well Conjunctive Irrigation District (CWCID), where the average groundwater salinity is 1,361 mg/L (Hetao Irrigation District Administration, 2019). The CWCID can be further divided into Canal-Irrigation District (CID) and Well-Irrigation District (WID) based on primary irrigation water sources (Wang, 2018), with the CID is irrigated exclusively with surface water diverted from the Yellow River while the WID relies solely on groundwater irrigation (Wang, 2018).
The annual irrigation cycle for each hydrological year consists of two distinct periods: a non-irrigation season (December to March of the following year) without crop production or irrigation activities, and an irrigation season from April to October. Agricultural production follows a dual-cropping system, with summer crops irrigated in April to June (including wheat, melons, and tomatoes), and fall crops irrigated in July to September (including maize, sunflowers and cucurbit). Collectively these crops account for 92.2% of the total cultivated area. Additionally, non-growing period irrigation (including spring irrigation in May and winter irrigation in October to November) is conducted exclusively via surface water irrigation, aiming at soil salinity leaching and moisture conservation (Cao et al., 2023). Detailed data are taken from previous studies (Wang, 2018; Ren et al., 2019; Xu et al., 2019; Dou et al., 2020; Zhu et al., 2020) and reports prepared by local governmental agencies (Bayannur Water Conservancy Bureau, 2019; Hetao Irrigation District Administration, 2019). Specifically, cropping patterns and surface-to-groundwater irrigation area ratio (SGIAR) (Wang, 2018; Bayannur Water Conservancy Bureau, 2019), and groundwater salinity (Hetao Irrigation District Administration, 2019; Zhu et al., 2020), root-zone soil salinity (Ren et al., 2019; Xu et al., 2019; Dou et al., 2020) and surface water salinity (Hetao Irrigation District Administration, 2019) in each sub-irrigation district are listed in Tables 1, 2, for the base year.
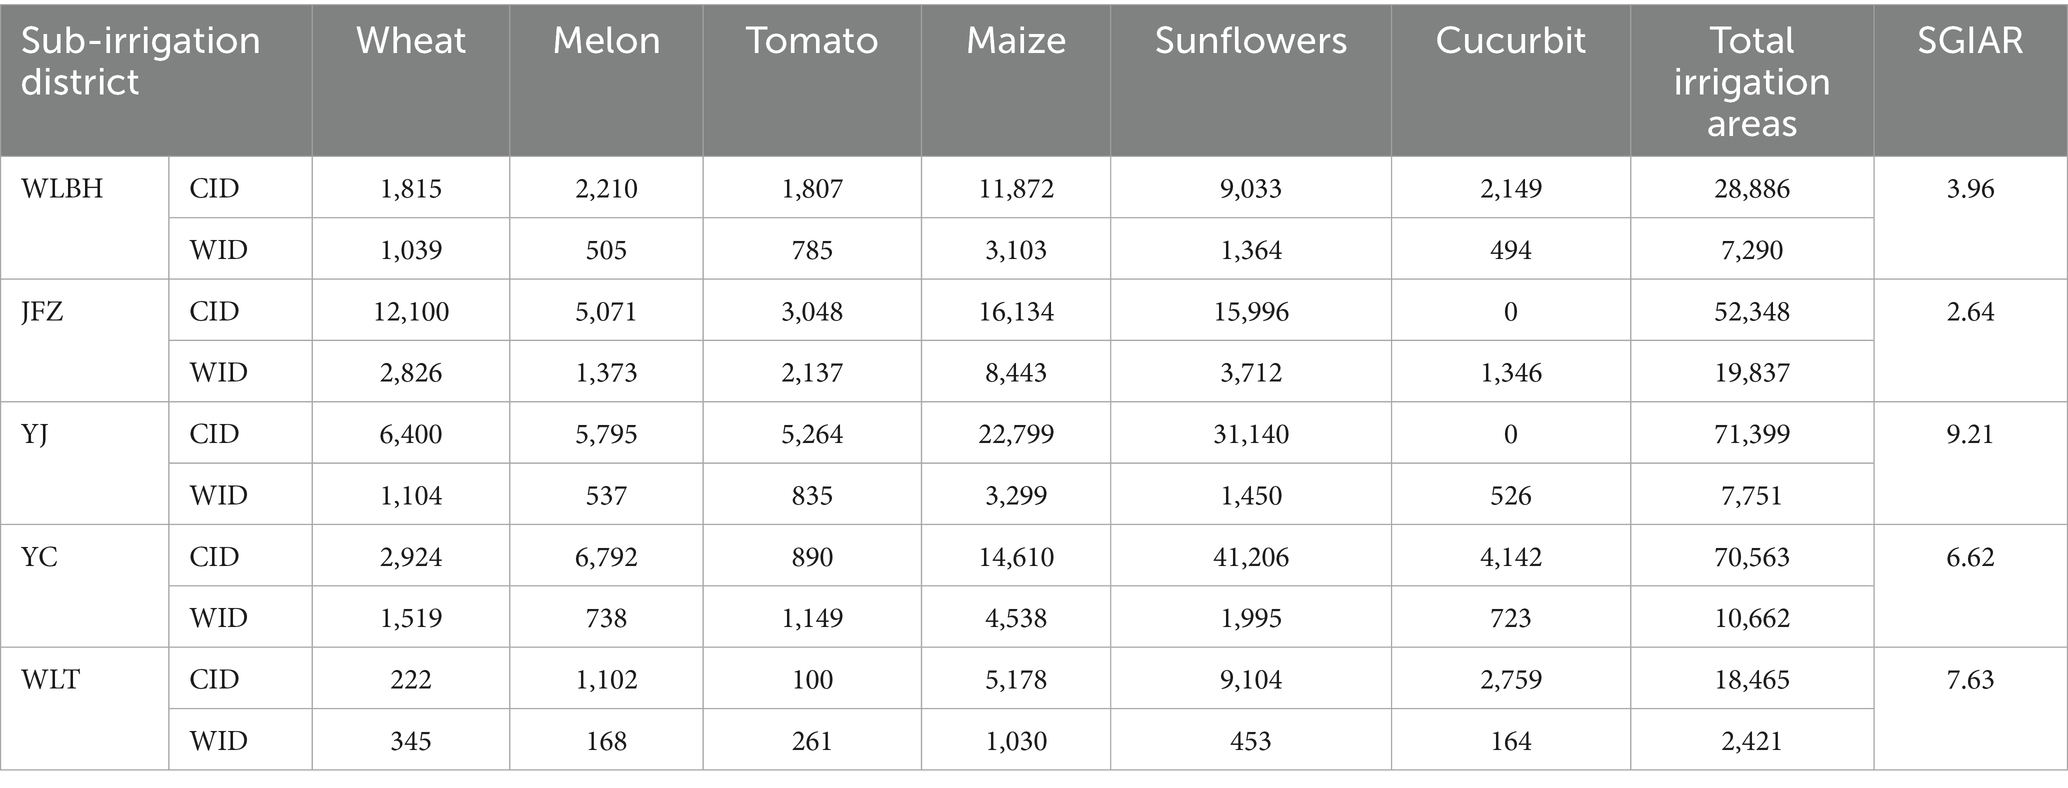
Table 1. Baseline observed crop irrigation areas (ha) in canal-irrigation district (CID) and well-irrigation district (WID), and the surface-to-groundwater irrigation area ratio (SGIAR) for each sub-irrigation district.
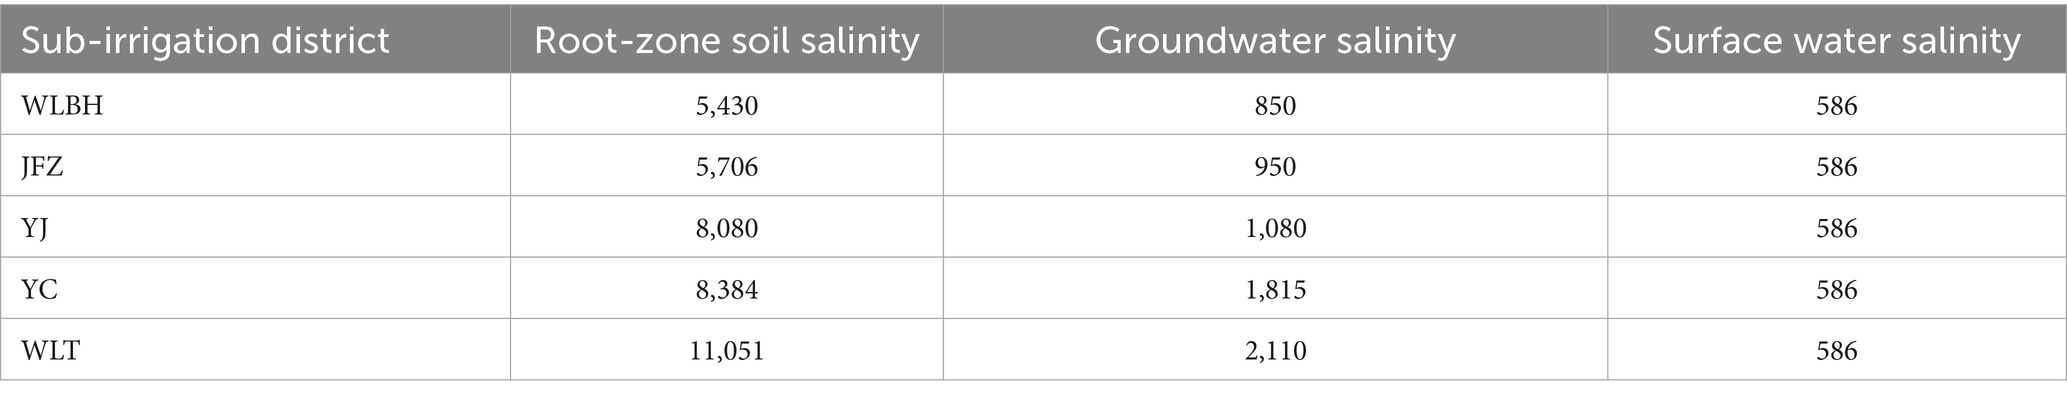
Table 2. Soil salinity, groundwater salinity, and surface irrigation water salinity in base year (mg/L).
2.2 Hydroeconomic model for canal-well conjunctive irrigation-drainage
2.2.1 Model framework and assumptions
The integrated HEM model incorporates agro-hydrological process (inter-annual water-salt balance modeling) into an economic optimization framework to optimize crop planting areas for maximizing annual agricultural net benefits across the entire CWCID, under various canal-well conjunctive irrigation-drainage strategies characterized by groundwater drainage capacity (α) and surface-to-groundwater irrigation area ratio (SGIAR) (Figure 2).
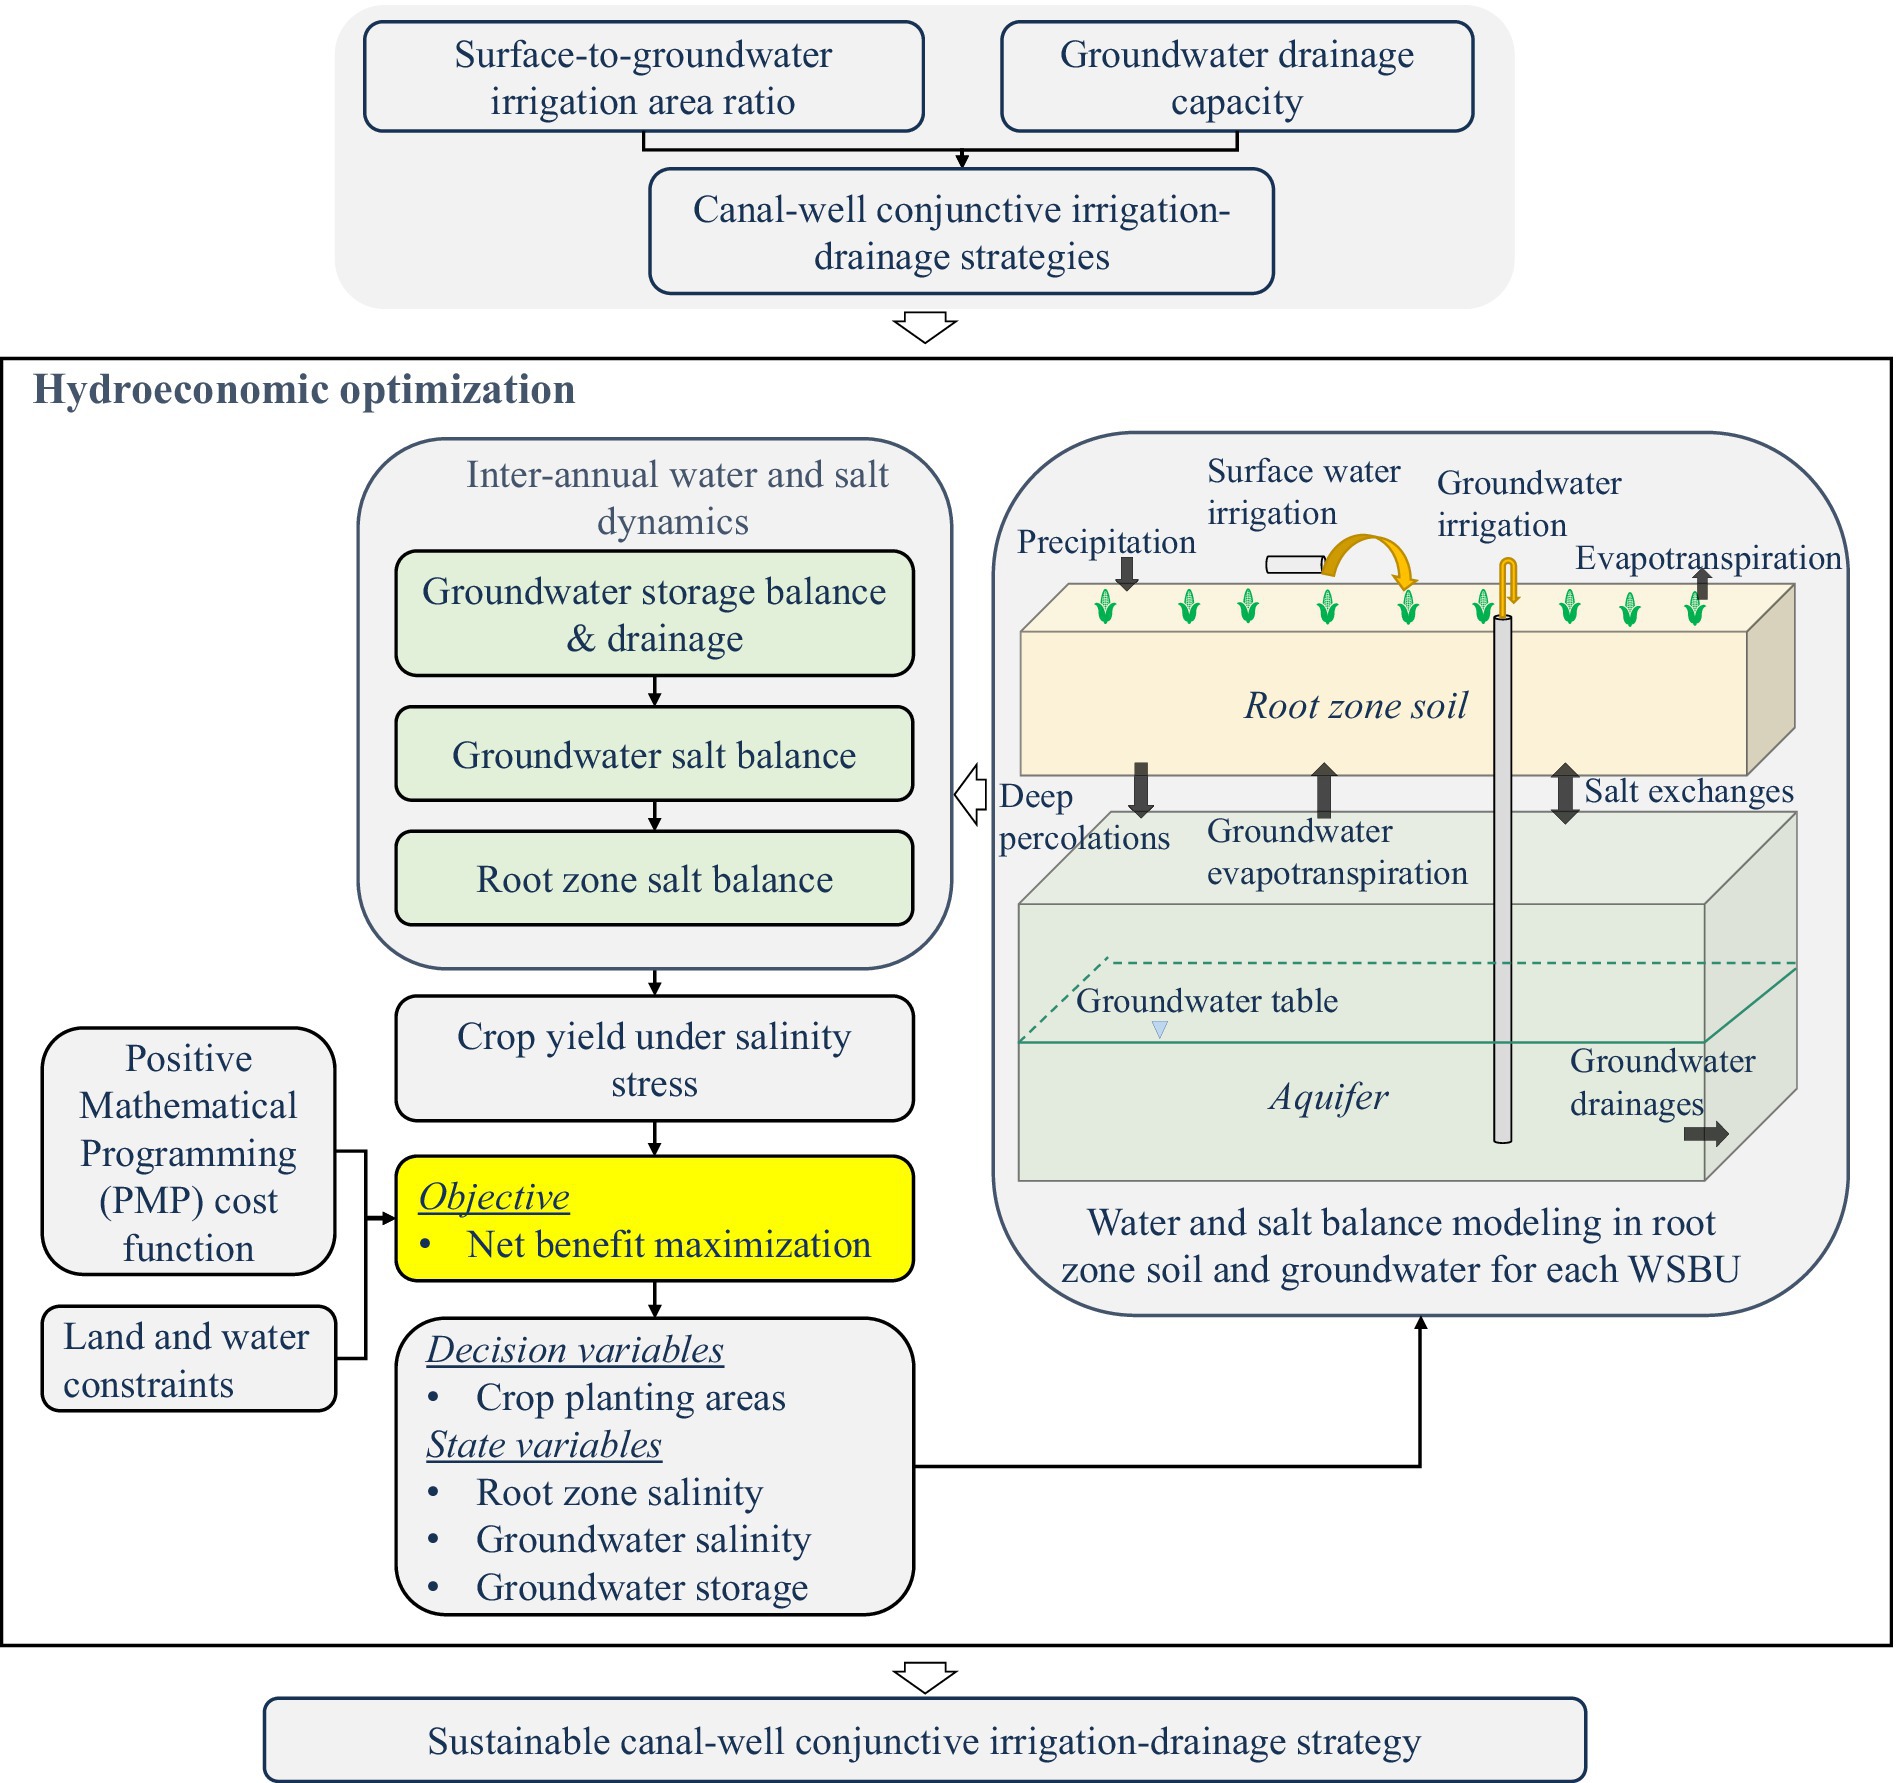
Figure 2. Hydroeconomic optimization framework for canal-well conjunctive irrigation-drainage management.
Based on irrigation practices in the HID, the following assumptions are made without affecting model accuracy. (1) Full irrigation is implemented, with crop net irrigation water requirement equaling the net irrigation water quota. (2) Total planting area (sum of canal- and well-irrigated areas) in each sub-irrigation district remains constant across all strategy scenarios, with no fallow land. (3) Crops in CID rely solely on surface water, while crops in WID depend entirely on groundwater (Jia, 2018). (4) Owing to the interspersed distribution of crops in the CID and WID of CWCID, each CWCID within a sub-irrigation district is treated as independent water-salt balance units (WSBUs) which can be considered as a spatially homogeneous and independent unit suitable for HEM optimization at the irrigation-district scale (He et al., 2016; Wang, 2018). In this study, water-salt dynamic modeling in root-zone soil and groundwater is conducted independently within each WSBU to quantify the average soil salinity, groundwater salinity, and salinity-stressed crop yield for each crop within each WSBU. (5) Water-salt migration in root-zone soil and groundwater is predominantly vertical (Mao et al., 2022), while lateral water-salt exchanges both within and between adjacent WSBU are reasonably negligible (Wen et al., 2017).
2.2.2 Model formulations
1. Objective function
The model is designed to maximize annual agricultural net benefits for the entire CWCID, which are calculated as agricultural revenue minus total production costs, as expressed in Equation (1):
where Bt represents agricultural net revenue in the tth year; Pi is crop commodity market prices for crop i; Ykit denotes crop yield under salinity stress for crop i within the kth sub-irrigation district during the tth year; SIkt, GPkt, and NGIkt denote irrigation water uses for surface water-irrigated crops in CID, groundwater-irrigated crops in WID, and non-growing period irrigation, respectively; CS and CG represent unit water price of surface water and groundwater, respectively; GPCkt is unit groundwater pumping cost; CPt is total production cost during the tth year estimated by PMP approach; Akit, CID and Akit, WID denote crop planting areas in CID and WID, respectively, which are non-negative decision variables. Under full irrigation practices, irrigation water allocations are proportional to crop areas.
1. Irrigation water uses
Irrigation water uses for surface water-irrigated crops in CID (SIkt), groundwater-irrigated crops in WID (GPkt), and non-growing period irrigation (NGIkt), are expressed in Equation 2, respectively.
where SIkt, GPkt and NGIkt are irrigation water uses for surface water-irrigated crops in CID, groundwater-irrigated crops in WID, and non-growing period irrigation, respectively. NIWRki and denote net irrigation water requirements for surface water-irriagaged crops in CID and groundwater-irrigated crops in WID, respectively (Jia, 2018), and they are determined using the observed net irrigation water quota under full irrigation practices. WUEki and IEki represent irrigation water use efficiency and field irrigation efficiency, respectively. Additionally, SAkt and WAkt denote irrigated areas, and SQkt and WQkt represent irrigation amounts per unit area, for the spring irrigation in May (SAkt and SQkt) and the winter irrigation in October to November (WAkt and WQkt).
1. Water and salt balance in root-zone soil and groundwater
As shown in Figure 2, the water-salt dynamic modeling in root-zone soil and groundwater is run within each WSBU. Between consecutive hydrological years, the end-of-year values of three water-salt balance state variables—root-zone soil salinity, groundwater salinity, and groundwater table—were assigned as the initial values for the subsequent year. Through annual iteration, the inter-annual water-salt dynamics in root-zone soil and groundwater within each WSBU were integrated into the HEM model to model annual average soil salinity, groundwater salinity and groundwater table within each WSBU.
The water-salt migration of groundwater mainly occurs along the vertical direction in the HID (Wang, 2018). As shown in Figure 2, groundwater recharge and its salt imports are mainly through the deep percolations of surface water irrigation ( ), groundwater irrigation ( ) and precipitation (Pkt). Groundwater discharge and its salt exports include groundwater extraction (GPkt), groundwater evapotranspiration (GWEkt), and groundwater drainages (Dkt). Therefore, groundwater storage balance and its salt balance for each WSBU are formulated as follows, respectively.
where Aaquifer,k is aquifer area; μ the specific yield; hkt is groundwater table level at the end of the tth year, m; Cgro,kt represent groundwater salinity at the end of tth year, mg/L, and denote the average groundwater salinity in the tth year; GWEkt denote groundwater evapotranspiration; Dkt denote groundwater drainages; Pkt is effective precipitation; RIGk, RIWk, RIk, and RPk are recharge coefficients for deep percolations from surface water irrigation, groundwater irrigation, non-growing period irrigation, and precipitation, respectively; CID,kt, CGD,kt and CPD,kt represent the leaching water salinity from precipitation, surface irrigation, and groundwater irrigation, and they can be determined using the irrigation water salinity, the average soil salinity and the average groundwater salinity following (Cao et al., 2024).
Since soil salt loss via surface runoff and crop uptake (Wen et al., 2017; Li X. et al., 2020) and lateral salt migration in root-zone soil (Ji et al., 2007) can be negligible, root-zone soil salinity in the HID is only discharged via vertical water-salt migration (Mao et al., 2022). As shown in Figure 2, salt is imported to root-zone soil through surface water irrigation ( ), groundwater irrigation ( ), and groundwater evapotranspiration ( ). Salt is leached out of root-zone soil through deep percolation of surface water irrigation ( ), groundwater irrigation ( ) and precipitation ( ). Therefore, the salt balance in root-zone soil within each WSBU is expressed in Equation 5.
where Z is root-zone soil thickness, and it is set to 1 m in this study; θf is soil field capacity; IAk denotes irrigated area, ha; Csur is surface water salinity, mg/L; Csoil,kt represent root-zone soil salinity at the end of tth year, mg/L.
Following Cao et al. (2024), groundwater evapotranspiration (GWEkt) and groundwater drainage (Dkt) are expressed in Equation (6), respectively.
where γ and ε are empirical parameters of groundwater evapotranspiration; EWt is open water evaporation per unit area, m; α denotes the groundwater drainage coefficient, year−1, and it is defined using the Linear Reservoir Model (LRM) which conceptualizes the groundwater aquifer as a linear reservoir system and models groundwater discharge as a linear function of groundwater storage (Jakeman et al., 2016; Macian-Sorribes et al., 2017). The value of α depends on the geometry, boundary conditions, and hydrodynamic parameters (Pulido-Velazquez et al., 2007). In this study, α is estimated to be 0.07 year−1 based on base-year observations of annual groundwater drainages (0.1668 billion m3) in the CWCID, which aligns with previous findings by Wen et al. (2020).
1. Crop yields under salinity stress
Salinity stress significantly reduces crop productivity. The relative crop yield under salinity stress is given in Equation (7), (Allen et al. 1998):
where, Ykit denotes the relative crop yield under salinity stress for crop i in sub-irrigation district k during the tth year; ECsoil,kt is the electrical conductivity of saturated soil paste extracts from the root-zone soil at the end of the tth year, dS/m; ECTH,i is the threshold electrical conductivity at which soil salinity begins to impair crop yield, dS/m; bi is the yield reduction coefficient representing the percentage yield loss per unit increase in electrical conductivity, %/(dS/m); Ymax,ki is the maximum crop yield without salinity stress, which can be derived from base-year observed crop yields ( ) and corresponding in-situ measured soil salinity ( ), as given in Equation (8):
Notably, the empirical relationship between ECsoil,kt and Csoil,kt can be described in Equation (9) following (Cao et al., 2023):
where δ is the bulk density, kg/L; μ is the soil water content, cm3/cm3. Root-zone soil salinity (Csoil,kt) can be recursively derived through inter-annual water and salt dynamic modeling in root-zone soil and groundwater as given in Equations 3–5.
1. Groundwater pumping cost
The unit groundwater pumping cost is calculated as the product of energy price and energy consumption per unit of groundwater pumping (Equation 10). The energy consumption is determined by groundwater pumping lift, defined as the vertical distance between the land surface and the phreatic surface, and pumping efficiency.
where GPCkt denotes unit groundwater pumping cost; ρ is water density; g is gravitational acceleration; ε is pumping efficiency; lkt represents groundwater pumping lift, m; H is the distance between land surface and aquifer floor, m; pel is energy price; and denote the average groundwater table level in the tth year, m.
1. Positive mathematical programming (PMP) calibration
As a self-calibrating algorithm, Positive mathematical programming (PMP) can integrate nonlinear characteristics representing unobserved behavioral costs or benefits into the objective function, and calibrate these using the shadow values of constraints (Howitt, 1995), and have been widely used to calibrate HEM model (Maneta et al., 2020; Yao, 2020; Kumar et al., 2023). The PMP-calibrated HEM model can replicate base-year observed crop planting areas, calibrating the HEM model, verifying model reliability, and making HEM model suitable for water management policy analysis through capturing farmers’ adaptive decisions on optimizing crop water-land resource allocations in response to external management policy interventions.
PMP approach is employed to estimate gross production costs and calibrate the HEM model to base-year observations, following calibration procedures in Zhu et al. (2015) and Cao et al. (2024). The total production cost in the tth year (CPt) is expressed in Equation (11):
where CPt represent the total production cost during the tth year; βki,CID and βki,WID denote the intercept terms, while γki,CID and γki,WID represent the slope terms of the quadratic PMP cost functions. These parameters are separately calibrated for each crop in each CID and each WID within each sub-irrigation district, respectively. The observed data used for the PMP cost function calibration include base-year observed crop areas, yields, crop commodity prices, land and water costs, available land and water resources, etc.
1. Canal-well conjunctive irrigation
The HEM optimization framework integrates the canal-well conjunctive irrigation module characterized by the surface-to-groundwater irrigation area ratio (SGIAR) at the sub-irrigation district scale (Equation 12).
where rkt is the surface-to-groundwater irrigation area ratio (SGIAR), which is defined as the ratios of surface water-irritated crop areas to groundwater-irrigated crop areas in the kth sub-irrigation district during the tth year. The sum of canal-irrigated and well-irrigated crop areas in the kth sub-irrigation district in different years (i.e., ) remains the same as the base-year total irrigated areas Abase,k,CID+WID, left no land allow for each sub-irrigation district. This constraint reflects actual agricultural production practices in the HID, where land use transitions occur solely between canal- and well-irrigated areas. Once the SGIAR is established, the distribution of canal- and well-irrigated crop areas within each CWCID in each sub-irrigation district remains stable over time.
The model integrating canal-well conjunctive irrigation can systemically assess the impacts of canal-well conjunctive irrigation-drainage strategies on optimal water and land allocations, salinization dynamics, agricultural profitability, and food security, providing a comprehensive framework for policy analysis for canal-well conjunctive irrigated agriculture.
1. Land and water constraints
Surface water availability is explicitly defined during October to November, April to June, and July to September, respectively, as formulated in Equation 13. Groundwater extraction is constrained by the annual renewable groundwater to maintain aquifer sustainability, as given in Equation 14. Land availability is constrained by the total cultivated area, as given in Equation 15.
where TQW, STS, and FTS represent the available surface water for irrigation in October to November, April to June, and July to September, respectively; TGkt denotes the annual renewable groundwater within the kth sub-irrigation district during the tth year; TAk is the total available canal-well conjunctive cultivated areas within the kth sub-irrigation district.
The developed HEM optimization model was implemented in the General Algebraic Modeling Systems (GAMS) and solved using the CONOPT solver (ARKI Consulting and Development, 2021). The model can continuously run for multi-year planning horizon (15-year planning horizon in this study).
2.3 Scenarios of drainage capacity and irrigation water composition
This study formulated comprehensive canal-well conjunctive irrigation-drainage policy intervention scenarios based on SGIAR and groundwater drainage capacity (α) (Figure 2). The policy framework includes two groundwater drainage capacity scenarios: baseline (α = 0.07) and enhanced drainage capacity (α = 0.21, a hypothetical value representing expected high drainage capacity by investing in groundwater drainage infrastructures such as drainage ditches or tile). For each drainage capacity scenario, 10 SGIAR policy interventions were further designed: five representing shifts from surface water irrigation to groundwater irrigation via reducing SGIAR by 0% (baseline), 10%, 30%, 50%, and 70%, and five representing shifts from groundwater irrigation to surface water irrigation via increasing SGIAR by 0% (baseline), 10%, 30%, 50%, and 70%. This design yields 20 canal-well conjunctive irrigation-drainage strategy scenarios. Under each scenario, the developed HEM model was run continuously over a 15-year planning horizon to optimize crop area and water allocation decisions to maximize annual agricultural net benefits across the entire CWCID.
3 Results
3.1 Optimization of stakeholder decision-making for cropping patterns and water allocations
Figure 3 shows the optimal cropping patterns (with crop water allocations align corresponding to cropping patterns) for summer crops (wheat, melons, and tomatoes) and fall crops (maize, sunflowers, and cucurbit) in the 15th year of strategy implementation.
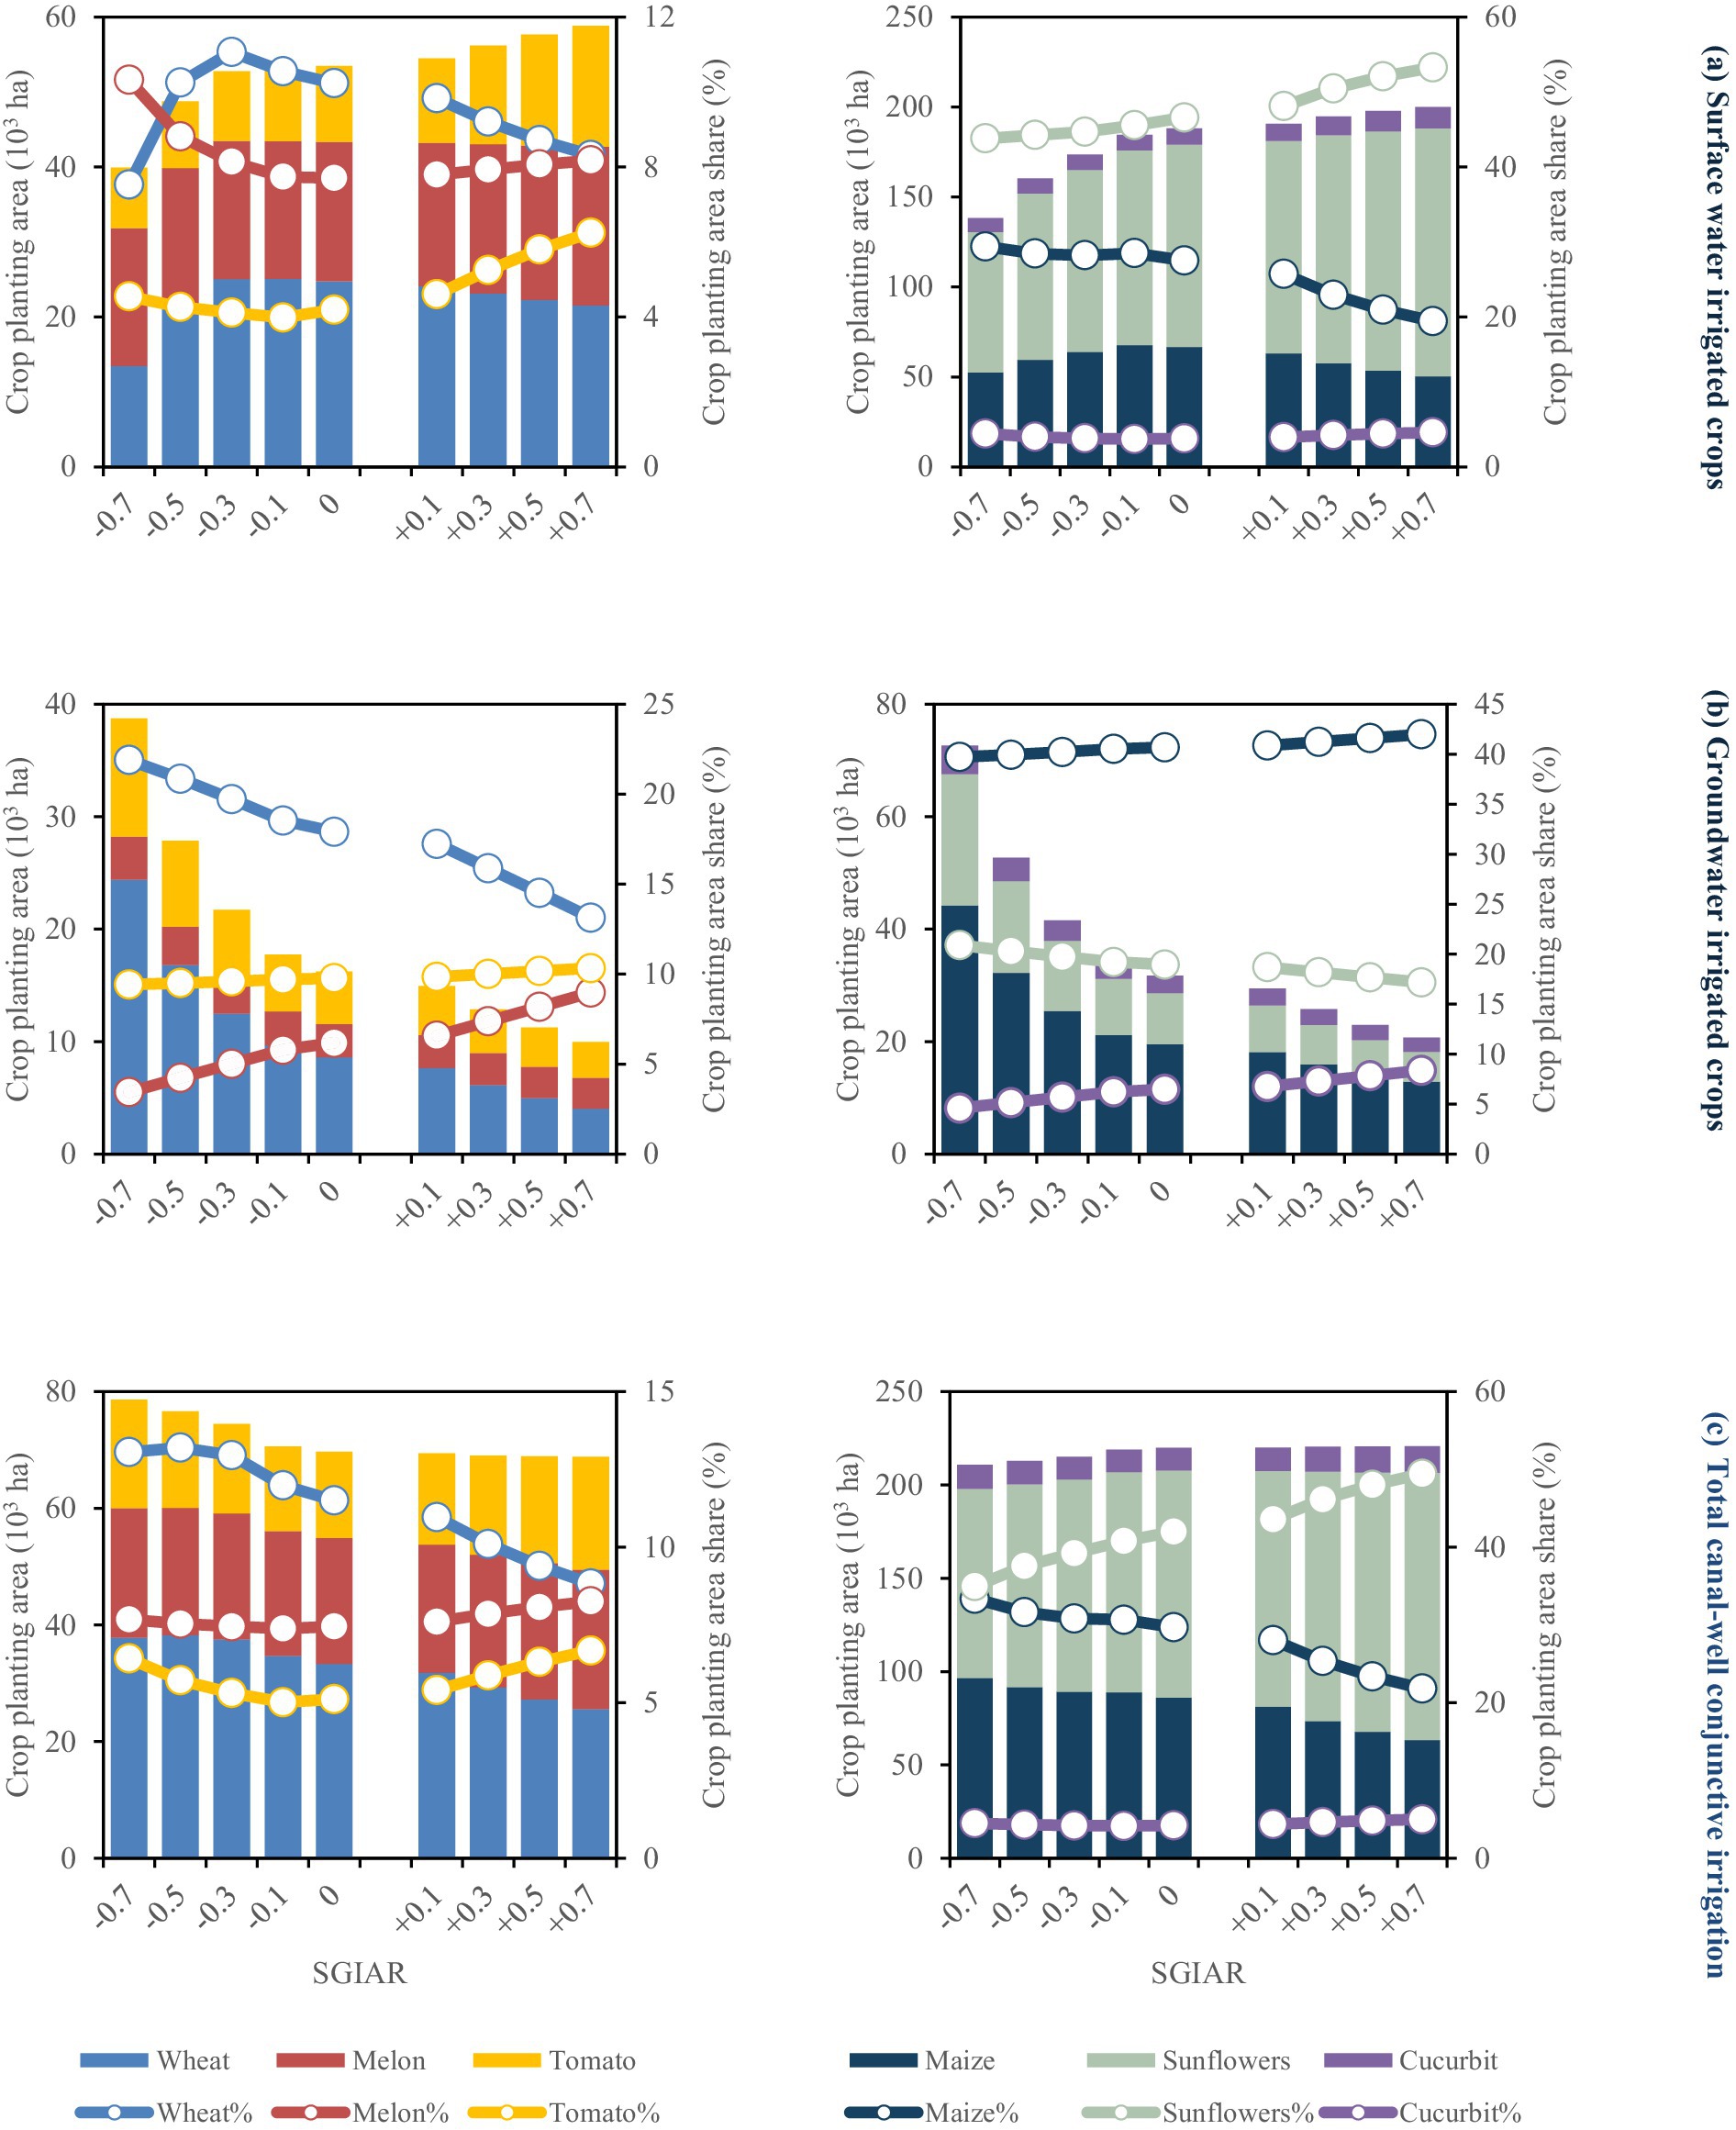
Figure 3. Crop areas (bars) and shares (lines) for summer (left side) and fall (right side) crops at the 15th year of strategy implementation. (a) Surface water irrigated crops; (b) groundwater irrigated crop; (c) total canal-well conjunctive irrigation crops. −0.1, −0.3, −0.5, and −0.7 indicate the reduction of the surface-to-groundwater irrigation area ratio (SGIAR) by 10, 30, 50, and 70%, respectively. +0.1, +0.3, +0.5, and +0.7 illustrate the SGIAR increase by 10, 30, 50, and 70%, respectively. All results are under baseline drainage capacity of α = 0.07.
When the SGIAR is decreased from baseline 0% to 70%, total planting areas of surface-water irrigated crops decrease. Among these crops, wheat planting shares first increase then decrease, tomato shares first decrease then increase, melon shares rise continuously, and sunflower shares decline continuously. This pattern indicates a strategic reallocation of summer crop planting shares shifting from wheat to higher-value melons and tomatoes, alongside a reduction in fall crop sunflower cultivation area. For groundwater-irrigated crops, the planting areas increase. Wheat planting shares rise while melon and tomato shares decline for summer crops, and sunflower shares rise while maize shares decrease for fall crops. This reflects a summer crop shift from melons/tomatoes to wheat and a fall crop shift from maize to sunflowers. Across the entire CWCID, summer crop planting areas increase, whereas fall crop areas decrease, highlighting farmers’ adaptive optimization to reallocated cultivated land from fall to summer crops. Notably, the planting share of sunflowers across the CWCID decreases significantly from 42.01% to 34.99%.
When the SGIAR is increased from baseline 0% to 70%, surface water shortages occur during April to June and July to September. For surface-water irrigated crops, farmers strategically reallocate planting shares from low-value grain crops (wheat and maize) to high-value cash crops (melons, tomatoes, and sunflowers) to maximize agricultural net benefits. For groundwater-irrigated crops, summer crop shares shift from wheat to melons/tomatoes, and fall crop shares shift from sunflowers to maize. Across the entire CWCID, the planting areas of wheat and maize decrease significantly, while those of tomatoes, melons and sunflowers increase. This trend aligns with the cropping patterns of surface-water irrigated crops, reflecting farmers’ adaptive decision-makings in response to surface water scarcity.
3.2 Salt dynamics, crop yields, water use, and agricultural net benefits
Figure 4 illustrates the impacts of these strategies on water-salt dynamics and salinization environment, agricultural productivity and profitability, water use and water savings at the 15th year of policy implementation.
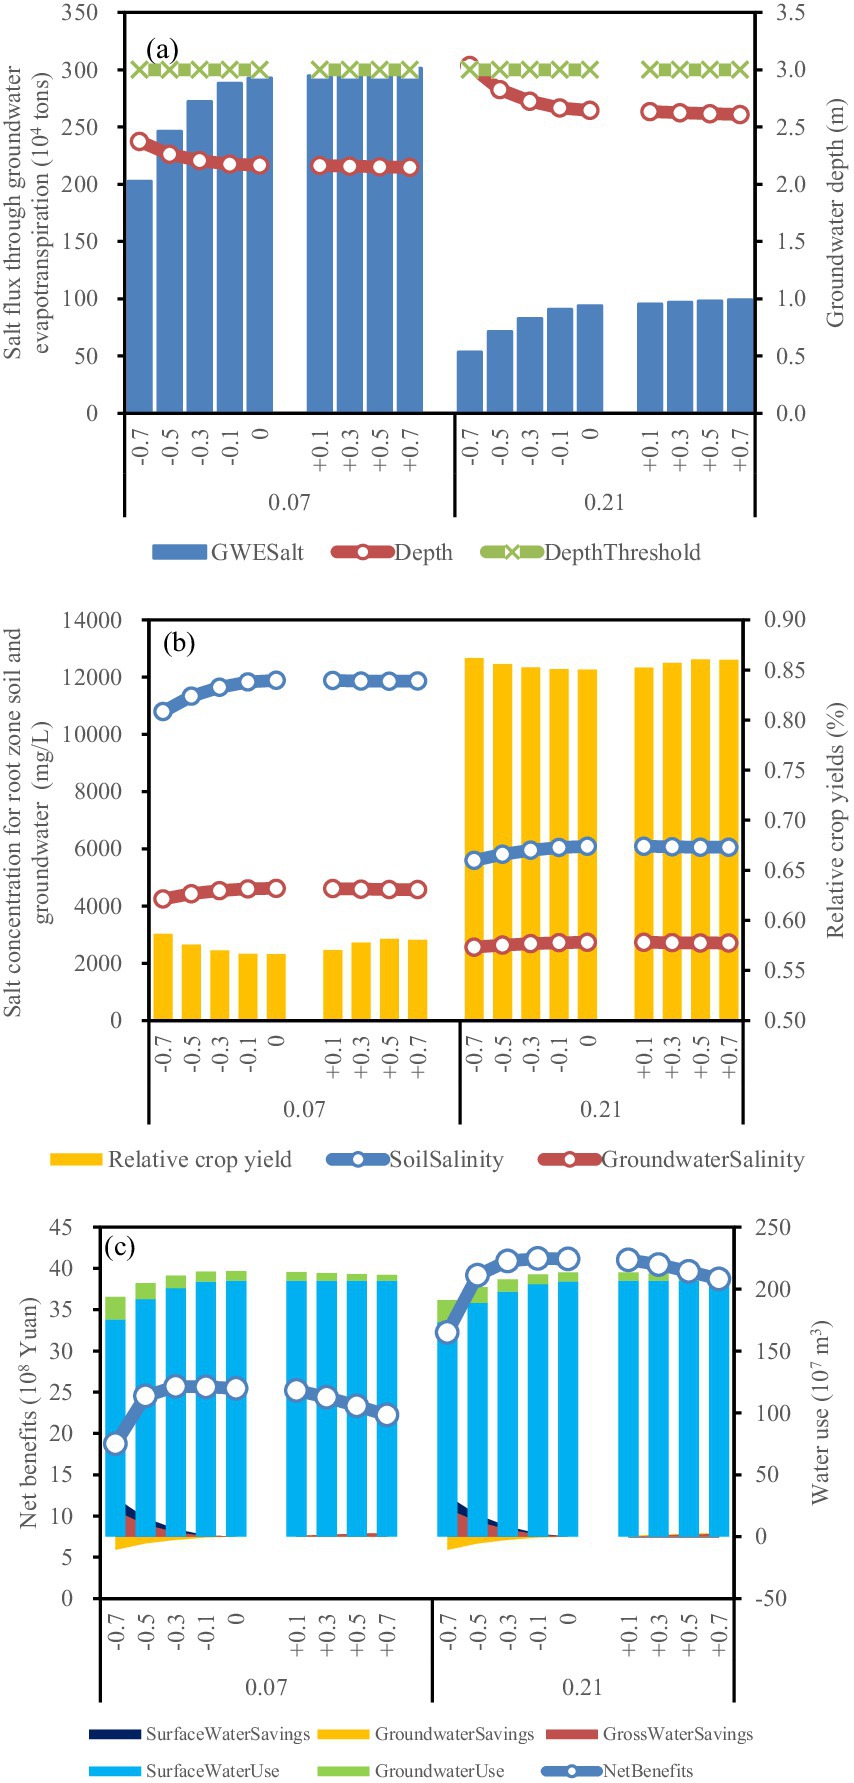
Figure 4. Effects of irrigation-drainage strategies on (a) groundwater depth and salt flux through groundwater evapotranspiration; (b) soil salinity, groundwater salinity, and relative crop yield under salinity stress; (c) water use, water savings and agricultural net benefits. 0.07 and 0.21 illustrate the groundwater drainage capacity of α = 0.07 and α = 0.21, respectively. −0.1, −0.3, −0.5, and −0.7 indicate the reduction of the surface-to-groundwater irrigation area ratio (SGIAR) by 10, 30, 50, and 70%, respectively. +0.1, +0.3, +0.5, and +0.7 illustrate the SGIAR increase by 10, 30, 50, and 70%, respectively. All results are at the 15th year of strategy implementation.
Under the baseline drainage capacity (α = 0.07), reducing SGIAR from baseline 0% to 70% increases groundwater depth by 9.6% (from 2.167 to 2.374 m), thereby decreasing groundwater evapotranspiration (Figure 4a). This conversion of ineffective groundwater evapotranspiration to productive groundwater use reduces salt transport into the root-zone soil by 30.7% (from 293 × 104 to 203 × 104 tons). Consequently, root-zone salinity decreases by 9.2% (from 11,887 to 10,795 mg/L) and groundwater salinity decreases by 8.0% (from 4,619 to 4,250 mg/L) (Figure 4b). These changes mitigate salinity-induced crop yield losses and improve agricultural productivity (Figure 4b).
Agricultural net benefits exhibit a nonlinear response to RSGI reductions: benefits first increase then decrease. An optimal net benefit of 25.7 × 10⁷ Yuan is achieved when the SGIAR is reduced by 30% under α = 0.07 (i.e., the “0.07 & −0.3” scenario) (Figure 4c). Notably, decreasing the SGIAR from 0 to 70% achieves substantial water savings without land fallow: surface water consumption decreases by 15% (a saving of 31.4 × 10⁷ m3, from 206.9 × 10⁷ to 175.5 × 10⁷ m3), and total water consumption from conjunctive surface and groundwater use decreases by 9.7% (a saving of 20.8 × 10⁷ m3, from 214.4 × 10⁷ to 193.6 × 10⁷ m3) (Figure 4c). These savings have the potential to alleviate intersect oral water competition between the agricultural sector and other sectors (e.g., ecological water users) and generate additional economic benefits in both the HID and the Yellow River Basin.
Increasing the drainage capacity to α = 0.21 significantly mitigates soil and groundwater salinization while concurrently improving agricultural productivity and economic net benefits. This capacity enhancement lowers groundwater table, thereby reducing groundwater evapotranspiration and associated salt fluxes from groundwater to root-zone soil (Figure 4a). Compared to baseline drainage capacity (α = 0.07), the enhanced drainage capacity (α = 0.21) reduces root-zone soil salinity by 49% (from 11,887 to 6,086 mg/L) and groundwater salinity by 41% (from 4,619 to 2,734 mg/L) under the baseline SGIAR, concurrently alleviating soil and groundwater salinization (Figure 4c). Consequently, relative crop yields increase significantly, demonstrating that salinity-induced crop yield losses are substantially reserved (Figure 4b).
Enhanced drainage capacity also improves agricultural profitability (Figure 4c). Specifically, under α = 0.21, reducing the SGIAR from 0% to 70% causes net benefits to first increase then decrease, with an optimal net benefit of 41.2 × 10⁷ Yuan achieved at a10% SGIAR reduction (i.e., the “0.21 & −0.1” scenario). This represents a 60% increase compared to the optimal net benefits under baseline drainage capacity (from 25.7 × 10⁷ Yuan at α = 0.07 to 41.2 × 10⁷ Yuan at α = 0.21).
3.3 Long-term evolutionary impacts over the 15-year planning horizon
Figure 5 illustrates the long-term evolutionary impacts of these strategies on salinization, agricultural productivity, and economic net benefits under stakeholder-optimized water-land allocations.
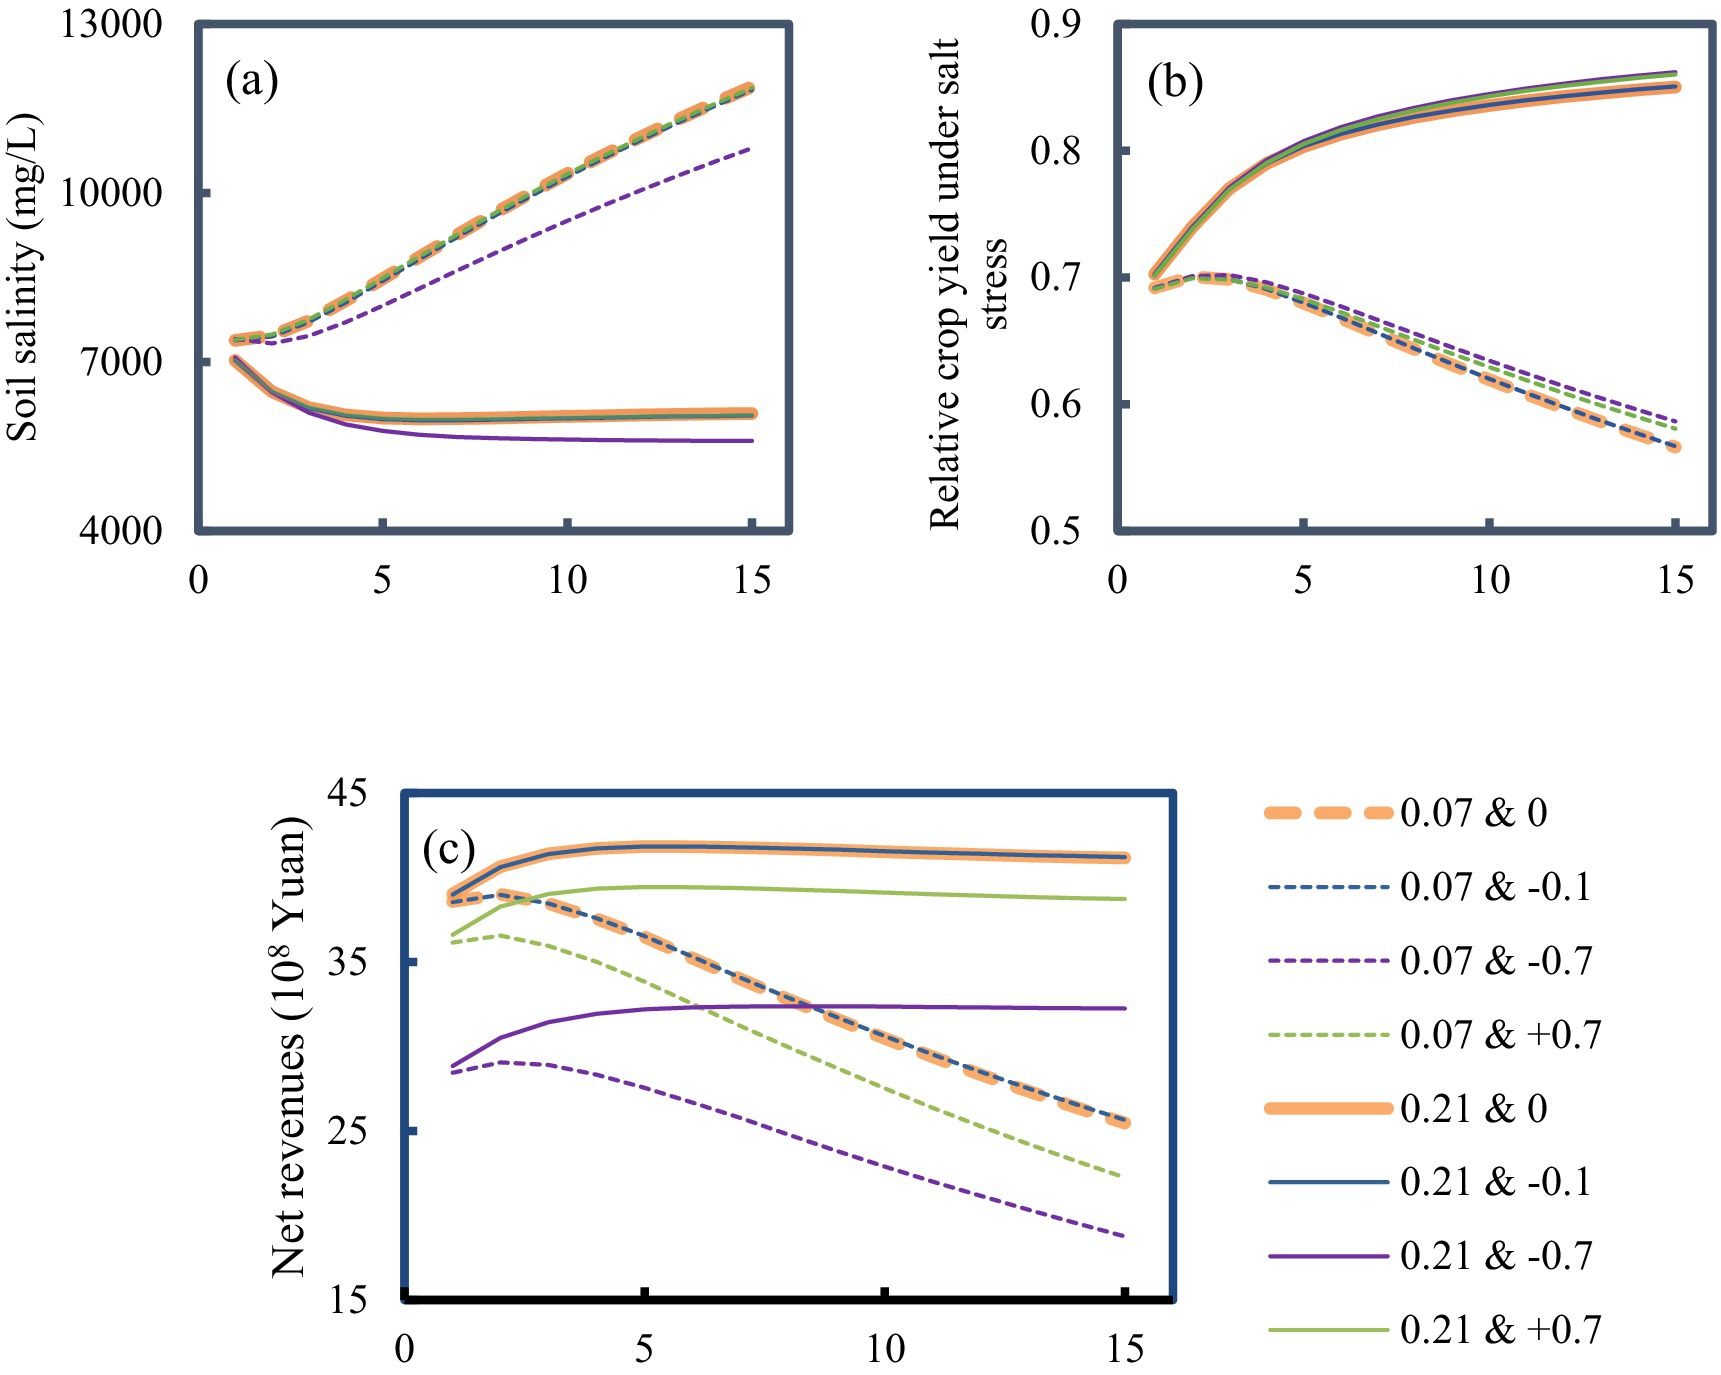
Figure 5. Long-term evolutionary impacts of canal-well conjunctive irrigation-drainage management policies on (a) soil salinity; (b) relative crop yield under salinity stress (with sunflower in the WLT as representative crop); (c) net benefits. “0.21 & –0.1” illustrates the reduction of the surface-to-groundwater irrigation area ratio (SGIAR) by 10% under groundwater drainage capacity of α = 0.21, and other symbols can be similarly explained. The horizontal axis denotes the model is continuously run over 15-year planning horizon.
Under baseline drainage capacity (α = 0.07), regardless of whether the SGIAR is increased or decreased, the strategies year-by-year exacerbate soil salinization (Figure 5a), reduce relative crop yields under salinity stress (Figure 5b), and result in progressive declines in agricultural net benefits over the 15-year planning horizon (Figure 5c). This implies that the inadequate drainage capacity can lead to a high groundwater table and subsequent intensive groundwater evapotranspiration, which exacerbates soil salinization and thereby reduces agricultural productivity and economic profitability. In contrast, increasing the drainage capacity (α = 0.21) establishes positive feedback loops: soil salinization is effectively alleviated year-by-year (Figure 5a), salinity-induced yield reductions are significantly reserved (Figure 5b), and agricultural net benefits exhibit sustained annual growth (Figure 5c). These results demonstrate that enhancing groundwater drainage capacity to α = 0.21, relative to the baseline drainage capacity, facilitates sustainable irrigated agriculture, as it concurrently mitigates soil salinization, enhances agricultural productivity, and increases net benefits year-by-year.
4 Discussion
4.1 Grain crop areas and food security
Figure 6 shows the impacts of canal-well conjunctive irrigation-drainage strategies on grain crop areas and food security within the CWCID. When the SGIAR is reduced from baseline (0%) to 70%, the planting area and share of grain crops increase, whereas those of cash crops decrease. This shift from cash crops to grain crops, adaptively adjusted by farmers, strengthens regional food security by prioritizing staple grain production. In contrast, when the SGIAR is increased from baseline 0% to 70%, the planting area and share of low-economic-value grain crops decrease, while the area allocated to high-economic-value cash crop expands accordingly, reflecting farmers’ optimization of crop area and water allocation to maximize annual net benefits under surface water scarcity. However, this shift poses a potential threaten to regional food security, underscoring the policy imperative of improving surface water availability to ensure long-term food security.
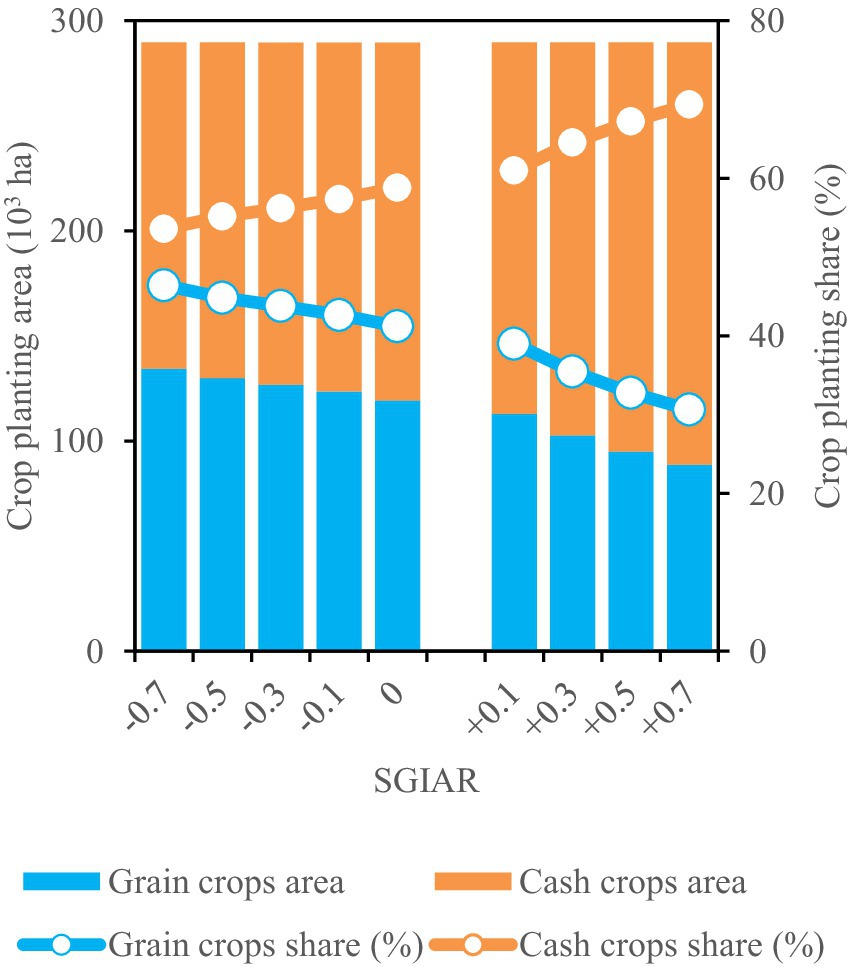
Figure 6. Planting area and share of grain crops and cash crops at the 15th year of strategy implementation. −0.1, −0.3, −0.5, and −0.7 indicate the reduction of the surface-to-groundwater irrigation area ratio (SGIAR) by 10, 30, 50, and 70%, respectively. +0.1, +0.3, +0.5, and +0.7 illustrate the SGIAR increase by 10, 30, 50, and 70%, respectively. All results are under baseline drainage capacity of α = 0.07.
Consequently, reducing the SGIAR from 0% to 70% is beneficial to food security, whereas increasing the SGIAR by 0 70% potentially compromises food security in the HID.
4.2 Sustainable canal-well conjunctive irrigation-drainage strategy
Through the HEM-based optimization modeling over the 15-year planning horizon, we identified a sustainable alternative canal-well conjunctive irrigation-drainage strategy that simultaneously addresses multiple sustainability objectives in the HID, improving agricultural profitability, alleviating salinization, saving water, ensuring food security, and sustaining groundwater sustainability.
As shown in Figure 5c, under α = 0.21, policies involving extreme SGIAR adjustments (the “0.21 & +0.7” strategy with a 70% increase or the “0.21 & −0.7” scenario with a 70% decrease) result in significant net benefits losses compared to baseline SGIAR strategy (i.e., “0.21 & 0”). In contrast, the economically optimal strategy under α = 0.21 is a moderate 10% SGIAR reduction (i.e., the “0.21 & −0.1” scenario). This scenario not only achieves the highest net benefits relative to other irrigation-drainage policies, but also mitigates salinization (Figure 5a) and increases economic net benefits (Figure 5c) year-by-year. This finding demonstrates a nonlinear economic response to SGIAR adjustments: extreme SGIAR modifications (e.g., a 70% reduction) incur economic penalties, whereas moderate SGIAR optimization (e.g., a 10% reduction) yields the optimal net benefits.
Beyond the year-by-year salinization mitigation and profitability improvement, the economically optimal “0.21 & −0.1” scenario further generates significant synergistic benefits for water conservation and food security (Figure 7). As illustrated in Figures 7a,b, this scenario significantly reduces both surface water use and total water consumption from conjunctive use, thereby promoting water conservation within the HID. The saved surface water can alleviate water competition between agricultural sector and other non-agricultural sectors (e.g., ecological water users) in the HID and across the broader Yellow River Basin. Furthermore, relative to the “0.21 & 0” scenario, the “0.21 & −0.1” scenario incentivizes farmers to optimize cropping patterns: grain crop areas decrease in the 1st–4th years yet increase year on year from the 5th year onward (Figure 7c). This adaptive adjustment in cropping patterns directly bolsters long-term regional food security.
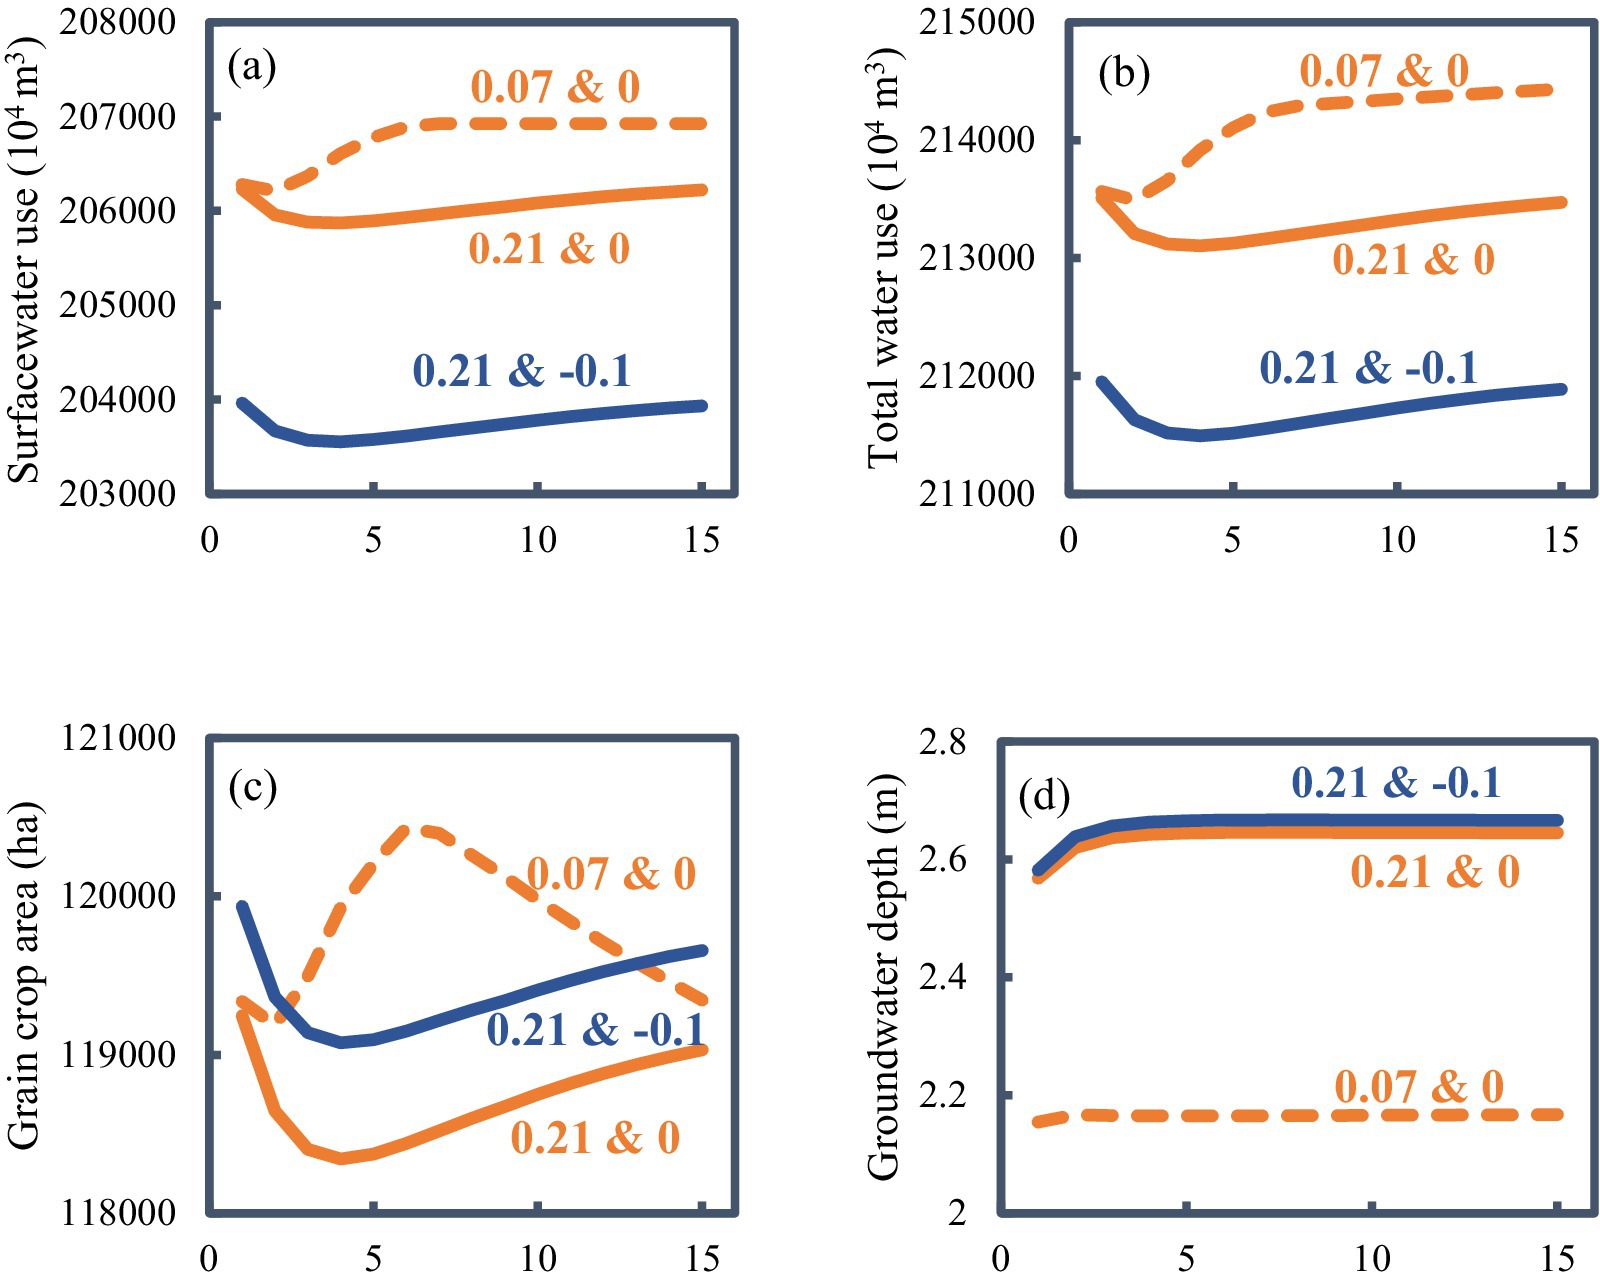
Figure 7. Comparison between economic optimal strategy of “0.21 & −0.1” with the benchmarking policies of “0.07 & 0” and “0.21 & 0” on (a) surface water use; (b) total water use; (c) grain crop planting area and food security, and (d) groundwater depth and groundwater sustainability. “0.21 & −0.1” illustrates the reduction of the surface-to-groundwater irrigation area ratio (SGIAR) by 10% under groundwater drainage capacity of α = 0.21, and other symbols can be similarly explained. The horizontal axis denotes the model is continuously run over 15-year planning horizon.
Widespread groundwater overdraft in intensively groundwater-irrigated agricultural regions worldwide, such as the North China Plain, northwestern India, and the central United States (Perez et al., 2024), can cause significant groundwater table declines, thereby threatening groundwater-dependent crops and natural vegetation in arid ecosystems where groundwater serves as a critical water source (Zhang et al., 2014; Qin et al., 2023). It underscores the need for sustainable canal-well conjunctive irrigation-drainage strategies that balance agricultural production with the long-term sustainability of groundwater resources and groundwater-dependent ecosystems (GDEs), particularly in the HID (Rodríguez-Flores et al., 2023). In the HID, shallow groundwater serves as a crucial water source for both crops and natural vegetation: a groundwater depth of 1.5–2.0 m is optimal for crop growth, whereas depths <1.5 m trigger soil salinization and depths>2.0 m induce crop water stress (Xu et al., 2010). Owing to declining surface water availability, increased groundwater pumping has led to the formation of a prominent groundwater depression cone in the northern HID, with a maximum drawdown of 30.26 m (Hetao Irrigation District Administration, 2019). Concurrently, the average groundwater depth declined from 1.93 m in 2013 to 2.25 m in 2017, exerting adverse impacts on vegetation coverage across the HID (Xue et al., 2019). Notably, according to the previous in-field experiment observations at the Shuguang Experimental Station in the HID, natural vegetation growth is threatened when groundwater table falls below the ecological threshold of 3.0 m (Yang et al., 2021). However, as illustrated in Figure 4a, extreme reductions in SGIAR under enhanced drainage α = 0.21 (e.g., the “0.21 & −0.7” scenario) result in a groundwater depth of 3.04 m, which exceeds the 3.0 m ecological threshold for GDEs and thereby undermines the sustainability of GDEs in the HID. In contrast, the “0.21 & −0.1” scenario sustains a stable groundwater depth of 2.66 m over the 15-year study period (Figure 7d), which stabilizes groundwater levels within an ecologically viable range and bolsters the sustainability of both groundwater resources and GDEs.
Therefore, the “0.21 & −0.1” scenario emerges as a sustainable canal-well conjunctive irrigation-drainage strategy for the HID. It generates synergistic, multi-dimensional benefits that promote the sustainability of irrigated agriculture in the HID. Specifically, it alleviates soil salinization to safeguard environmental sustainability (Figure 5a), enhances agricultural net benefits (Figure 5c), reduces surface water usage and total conjunctive irrigation consumption (Figures 7a,b), sustains long-term food security through adaptive cropping pattern adjustments (Figure 7c), and ensures groundwater sustainability by maintaining stable water table (Figure 7d).
5 Conclusion
This study developed a hydroeconomic optimization framework for canal-well conjunctive irrigation-drainage management in arid irrigated system confronted with water scarcity and salinization. This framework was implemented over a 15-year planning horizon under canal-well conjunctive irrigation-drainage strategies in the Hetao Irrigation District (HID). We systemically evaluated the impacts of these strategies on farmers’ adaptive decisions of optimizing cropping patterns and water allocations, and the subsequent feedback effects of these decisions on water-salt dynamics, salinization, agricultural productivity and profitability, food security, and groundwater sustainability. Moreover, a sustainable canal-well conjunctive irrigation-drainage strategy is identified. The main conclusions are as follows:
(1) Reducing the surface-to-groundwater irrigation area ratio (SGIAR) drives farmers to adaptively shift crop areas and water allocations from cash crops to grain crops, thereby strengthening food security. Under this scenario, the planting share of sunflowers decreased significantly from 42.01% to 34.99%. In contrast, increasing SGIAR undermines grain crop areas and threatens food security in the HID.
(2) Under baseline groundwater drainage capacity, decreasing SGIAR from the baseline 0% to 70% yields multiple synergistic co-benefits: a 9.2% reduction in root-zone salinity, an 8.0% decrease in groundwater salinity, and a 9.7% reduction in total conjunctive water consumption.
(3) Enhancing groundwater drainage capacity to α = 0.21 mitigates salinization annually while concurrently improving agricultural productivity and net benefits over the 15-year horizon, highlighting the critical role of drainage capacity in reconciling economic gains with salinization control.
(4) Reducing SGIAR by 10% under a drainage capacity of α = 0.21 emerges as a sustainable canal-well conjunctive irrigation and drainage strategy. Over the 15-year planning horizon, this strategy simultaneously enhances agricultural productivity and profitability, mitigates soil salinization, conserves water resources, ensures food security, and maintain long-term groundwater sustainability.
This study underscores that hydroeconomic optimization framework by integrating agro-hydrological process into economic optimization model can provide robust modeling and decision-making tool to reconcile the complex interactions between farmers’ adaptive water-land allocation decisions, water-salt dynamics, agricultural profitability, food security, and water use sustainability, advancing sustainable canal-well conjunctive irrigation and drainage management for arid irrigated agriculture facing water scarcity and soil salinization.
Data availability statement
The original contributions presented in the study are included in the article/supplementary material, further inquiries can be directed to the corresponding author.
Author contributions
ZC: Software, Investigation, Project administration, Data curation, Visualization, Writing – original draft, Conceptualization, Funding acquisition, Writing – review & editing, Validation, Formal analysis, Methodology. TZ: Methodology, Supervision, Conceptualization, Writing – review & editing. BL: Conceptualization, Funding acquisition, Methodology, Writing – review & editing, Supervision. YY: Writing – review & editing. YL: Writing – review & editing. YC: Writing – review & editing. TP: Writing – review & editing.
Funding
The author(s) declare that financial support was received for the research and/or publication of this article. This study was supported by Humanities and Social Sciences Youth Foundation of Ministry of Education of China (24YJCZH011), project ZR2024QE348 supported by Shandong Provincial Natural Science Foundation, National Natural Science Foundation of China (42171126), Taishan Scholars Project of Shandong Province (tsqn202306182) and Rizhao City Natural Science Foundation (RZ2022ZR51).
Conflict of interest
The authors declare that the research was conducted in the absence of any commercial or financial relationships that could be construed as a potential conflict of interest.
Generative AI statement
The authors declare that no Gen AI was used in the creation of this manuscript.
Any alternative text (alt text) provided alongside figures in this article has been generated by Frontiers with the support of artificial intelligence and reasonable efforts have been made to ensure accuracy, including review by the authors wherever possible. If you identify any issues, please contact us.
Publisher’s note
All claims expressed in this article are solely those of the authors and do not necessarily represent those of their affiliated organizations, or those of the publisher, the editors and the reviewers. Any product that may be evaluated in this article, or claim that may be made by its manufacturer, is not guaranteed or endorsed by the publisher.
References
Aein, R., and Alizadeh, H. (2021). Integrated hydro-economic modeling for optimal design of development scheme of salinity affected irrigated agriculture in Helleh River basin. Agric. Water Manag. 243:106505. doi: 10.1016/j.agwat.2020.106505
Allen, R. G., Pereira, L. S., Raes, D., and Smith, M. (1998). Crop evapotranspiration: Guidelines for computing crop water requirements. Irrigation and Drainage Paper No 56. Rome, Italy: Food and Agriculture Organization of the United Nations (FAO).
Bayannur Water Conservancy Bureau (2019). Farmland irrigation water use efficiency measurement in Hetao Irrigation District. Bayannur: Bayannur Water Conservancy Science Research Institute.
Cai, X., Wallington, K., Shafiee-Jood, M., and Marston, L. (2018). Understanding and managing the food-energy-water nexus—opportunities for water resources research. Adv. Water Resour. 111, 259–273. doi: 10.1016/j.advwatres.2017.11.014
Cao, Z., Zhu, T., and Cai, X. (2023). Hydro-agro-economic optimization for irrigated farming in an arid region: the Hetao Irrigation District, Inner Mongolia. Agric. Water Manag. 277, 1–16. doi: 10.1016/j.agwat.2022.108095
Cao, Z., Zhu, T., Cai, X., Wang, J., Zhao, Y., and Zhao, X. (2024). Hydroeconomic optimization of integrated water and salinity management in an arid agricultural region. J. Water Resour. Plan. Manag. 150:04024044. doi: 10.1061/jwrmd5.wreng-6098
Dou, X., Shi, H., Li, R., Miao, Q., Tian, F., Yu, D., et al. (2020). The analysis of the seasonal distribution characteristics of soil salinity in the Wulat irrigation area. Arid Zo. Res. 37, 1148–1155. doi: 10.13866/j.azr.2020.05.07
FAO (2021). Excess salt in soils puts food security at risk: FAO. Available online at: https://news.un.org/en/story/2021/12/1107172 (Accessed December 3, 2021).
FAO (2022). The state of the world’s land and water resources for food and agriculture 2021—systems at breaking point. Rome: Food and Agriculture Organization of the United Nations. doi: 10.4060/cb9910en
Gao, Y., Zha, Y., and Dong, B. (2024). Modelling groundwater recharge and discharge in Hetao irrigation district using water balance model. J. Irrig. Drain. 43, 74–81. doi: 10.13522/j.cnki.ggps.2023427
Harou, J. J., Pulido-Velazquez, M., Rosenberg, D. E., Medellín-Azuara, J., Lund, J. R., and Howitt, R. E. (2009). Hydro-economic models: concepts, design, applications, and future prospects. J. Hydrol. 375, 627–643. doi: 10.1016/j.jhydrol.2009.06.037
He, B., Lai, B., Mao, W., Yu, J., and Yang, J. (2016). A distribution-determination method of conjunctive use district with groundwater and surface water for Hetao Irrigation District based on GIS. J. Irrig. Drain. 35, 7–12. doi: 10.13522/j.cnki.ggps.2016.02.002
Hetao Irrigation District Administration (2019). Water resources bulletin of Bayannur city in 2019. Bayannur Water Conservancy Bureau: Bayannur, China.
Hou, J., Jiang, Y., Wei, T., Wang, Z., and Wang, X. (2025). A multi-objective simulation-optimization framework for water resources management in canal-well conjunctive irrigation area based on nexus perspective. J. Hydrol. 646:132308. doi: 10.1016/j.jhydrol.2024.132308
Howitt, R. E. (1995). Positive mathematical program. Am. J. Agric. Econ. 77, 329–342. doi: 10.2307/2982424
Hu, M., Tang, H., Yu, Q., and Wu, W. (2025). A new approach for spatial optimization of crop planting structure to balance economic and environmental benefits. Sustain. Prod. Consum. 53, 109–124. doi: 10.1016/j.spc.2024.12.003
Jaeger, W. K., Antle, J., Gingerich, S. B., and Bigelow, D. (2024). Advancing sustainable groundwater management with a hydro-economic system model: investigations in the Harney Basin, Oregon. Water Resour. Res. 60:e2023WR036972. doi: 10.1029/2023WR036972
Jakeman, A. J., Barreteau, O., Hunt, R. J., Rinaudo, J.-D., and Ross, A. (2016). Integrated groundwater management: concepts, approaches and challenges. NewYork: Springer.
Ji, X. B., Kang, E. S., Chen, R. S., Zhao, W. Z., Zhang, Z. H., and Jin, B. W. (2007). A mathematical model for simulating water balances in cropped sandy soil with conventional flood irrigation applied. Agric. Water Manag. 87, 337–346. doi: 10.1016/j.agwat.2006.08.011
Jia, Y. (2018). Study on water resources optimization of irrigation district based on the coupling model. Xi’an, China: Xi’an University of Technology.
Kumar, H., Zhu, T., and Sankarasubramanian, A. (2023). Understanding the food-energy-water nexus in mixed irrigation regimes using a regional hydro economic optimization modeling framework. Water Resour. Res. 59:e2022WR033691. doi: 10.1029/2022WR033691
Lambert, L. H., Yao, Y., and Levers, L. R. (2025). Optimal cropping patterns and intertemporal groundwater usage under extraction constraints in Oklahoma’s panhandle. Agric. Water Manag. 313:109472. doi: 10.1016/j.agwat.2025.109472
Li, L., Shi, H., Jia, J., Wang, C., and Liu, H. (2010). Simulation of water and salt transport of uncultivated land in Hetao Irrigation District in Inner Mongolia. Trans. Chin. Soc. Agric. Eng. 26, 31–35. doi: 10.3969/j.issn.1002-6819.2010.01.006
Li, X., Zhang, C., and Huo, Z. (2020). Optimizing irrigation and drainage by considering agricultural hydrological process in arid farmland with shallow groundwater. J. Hydrol. 585:124785. doi: 10.1016/j.jhydrol.2020.124785
Li, D., Zhang, J., Wang, G., Wang, X., and Wu, J. (2020). Impact of changes in water management on hydrology and environment: a case study in North China. J. Hydro. Environ. Res. 28, 75–84. doi: 10.1016/j.jher.2019.04.001
Liu, Z., Huo, Z., Wang, C., Zhang, L., Wang, X., Huang, G., et al. (2020). A field-validated surrogate crop model for predicting root-zone moisture and salt content in regions with shallow groundwater. Hydrol. Earth Syst. Sci. 24, 4213–4237. doi: 10.5194/hess-24-4213-2020
Liu, Z., Wang, X., Huo, Z., and Siert Steenhuis, T. (2019). A unique vadose zone model for shallow aquifers: the Hetao irrigation district, China. Hydrol. Earth Syst. Sci. 23, 3097–3115. doi: 10.5194/hess-23-3097-2019
MacEwan, D., Cayar, M., Taghavi, A., Mitchell, D., Hatchett, S., and Howitt, R. (2017). Hydro economic modeling of sustainable groundwater management. Water Resour. Res. 53, 2384–2403. doi: 10.1002/2016WR019639
Macian-Sorribes, H., Tilmant, A., and Pulido-Velazquez, M. (2017). Improving operating policies of large-scale surface-groundwater systems through stochastic programming. Water Resour. Res. 53, 1407–1423. doi: 10.1002/2016WR019573
Maneta, M. P., Cobourn, K., Kimball, J. S., He, M., Silverman, N. L., Chaffin, B. C., et al. (2020). A satellite-driven hydro-economic model to support agricultural water resources management. Environ. Model. Softw. 134:104836. doi: 10.1016/j.envsoft.2020.104836
Mao, W., Yang, J., Zhu, Y., Ye, M., and Wu, J. (2017). Loosely coupled SaltMod for simulating groundwater and salt dynamics under well-canal conjunctive irrigation in semi-arid areas. Agric. Water Manag. 192, 209–220. doi: 10.1016/j.agwat.2017.07.012
Mao, W., Zhu, Y., Wu, J., Ye, M., and Yang, J. (2022). Evaluation of effects of limited irrigation on regional-scale water movement and salt accumulation in arid agricultural areas. Agric. Water Manag. 262:107398. doi: 10.1016/j.agwat.2021.107398
McDermid, S., Nocco, M., Lawston-Parker, P., Keune, J., Pokhrel, Y., Jain, M., et al. (2023). Irrigation in the earth system. Nat. Rev. Earth. Environ. 4, 435–453. doi: 10.1038/s43017-023-00438-5
Niazi, H., Ferencz, S. B., Graham, N. T., Yoon, J., Wild, T. B., Hejazi, M., et al. (2025). Long-term hydro-economic analysis tool for evaluating global groundwater cost and supply: Super well v1.1. Geosci. Model Dev. 18, 1737–1767. doi: 10.5194/gmd-18-1737-2025
Perez, N., Singh, V., Ringler, C., Xie, H., Zhu, T., Sutanudjaja, E. H., et al. (2024). Ending groundwater overdraft without affecting food security. Nat. Sustain. 7, 1007–1017. doi: 10.1038/s41893-024-01376-w
Pulido-Velazquez, D., Sahuquillo, A., Andreu, J., and Pulido-Velazquez, M. (2007). An efficient conceptual model to simulate surface water body-aquifer interaction in conjunctive use management models. Water Resour. Res. 43:W07407. doi: 10.1029/2006WR005064,
Qin, G., Wu, B., Dong, X., Du, M., and Wang, B. (2023). Evolution of groundwater recharge-discharge balance in the Turpan Basin of China during 1959–2021. J. Arid. Land 15, 1037–1051. doi: 10.1007/s40333-023-0067-7
Rastegaripour, F., Tavassoli, A., Babaeian, M., Fernández-Gálvez, J., and Caballero-Calvo, A. (2024). Assessing the impacts of climate change on water resource management and crop patterns in eastern Iran. Agric. Water Manag. 295:108774. doi: 10.1016/j.agwat.2024.108774
Ren, D., Wei, B., Xu, X., Engel, B., Li, G., Huang, Q., et al. (2019). Analyzing spatiotemporal characteristics of soil salinity in arid irrigated agro-ecosystems using integrated approaches. Geoderma 356:113935. doi: 10.1016/j.geoderma.2019.113935
Ren, D., Xu, X., Engel, B., and Huang, G. (2018). Growth responses of crops and natural vegetation to irrigation and water table changes in an agro-ecosystem of Hetao, upper Yellow River basin: scenario analysis on maize, sunflower, watermelon and tamarisk. Agric. Water Manag. 199, 93–104. doi: 10.1016/j.agwat.2017.12.021
Rodríguez-Flores, J. M., Gupta, R. S., Zeff, H. B., Reed, P. M., and Medellín-Azuara, J. (2023). Identifying robust adaptive irrigation operating policies to balance deeply uncertain economic food production and groundwater sustainability trade-offs. J. Environ. Manag. 345:118901. doi: 10.1016/j.jenvman.2023.118901,
Singh, A. (2014). Simulation-optimization modeling for conjunctive water use management. Agric. Water Manag. 141, 23–29. doi: 10.1016/j.agwat.2014.04.003
Valle-García, Á., Montilla-López, N. M., Parrado, R., Berbel, J., Martínez-Dalmau, J., Kahil, T., et al. (2025). Integrated assessment of resilience to drought by coupling hydro-economic and macroeconomic models. J. Hydrol. 661:133549. doi: 10.1016/j.jhydrol.2025.133549
Wang, L. (2018). Area ratio of canal to well irrigation areas for combined use of groundwater and surface water in hetao irrigation district. Wuhan, China: Wuhan University.
Wen, Y., Shang, S., Rahman, K. U., Xia, Y., and Ren, D. (2020). A semi-distributed drainage model for monthly drainage water and salinity simulation in a large irrigation district in arid region. Agric. Water Manag. 230:105962. doi: 10.1016/j.agwat.2019.105962
Wen, Y., Shang, S., and Yang, J. (2017). Optimization of irrigation scheduling for spring wheat with mulching and limited irrigation water in an arid climate. Agric. Water Manag. 192, 33–44. doi: 10.1016/j.agwat.2017.06.023
Xu, Y., Ge, Z., Wang, J., Li, W., and Feng, S. (2019). Study on relationship between soil salinization and groundwater table depth based on indicator kriging. Trans. Chinese Soc. Agric. Eng. 35, 123–130. doi: 10.11975/j.issn.1002-6819.2019.01.015
Xu, X., Huang, G., Qu, Z., and Pereira, L. S. (2010). Assessing the groundwater dynamics and impacts of water saving in the Hetao Irrigation District, Yellow River basin. Agric. Water Manag. 98, 301–313. doi: 10.1016/j.agwat.2010.08.025
Xue, J., Huo, Z., Huang, Q., Wang, F., Boll, J., Huang, G., et al. (2019). Assessing sustainability of agricultural water saving in an arid area with shallow groundwater. Irrig. Drain. 68, 205–217. doi: 10.1002/ird.2295
Yang, Y., Jin, Z., Mueller, N. D., Driscoll, A. W., Hernandez, R. R., Grodsky, S. M., et al. (2023). Sustainable irrigation and climate feedbacks. Nat. Food 4, 654–663. doi: 10.1038/s43016-023-00821-x,
Yang, W., Mao, W., Yang, Y., Zhu, Y., and Yang, J. (2021). Optimizing conjunctive use of groundwater and cannel water in Hetao irrigation district aided by MODFLOW. J. Irrig. Drain. 40, 93–101. doi: 10.13522/j.cnki.ggps.2021180
Yao, Y. (2020). Managing groundwater for agriculture, with hydrologic uncertainty and salinity. Davis, California, USA: University of California, Davis.
Zhang, X., Guo, P., Wang, Y., and Guo, S. (2022). Impacts of droughts on agricultural and ecological systems based on integrated model in shallow groundwater area. Sci. Total Environ. 851:158228. doi: 10.1016/j.scitotenv.2022.158228,
Zhang, Z., Hu, H., Tian, F., Yao, X., and Sivapalan, M. (2014). Groundwater dynamics under water-saving irrigation and implications for sustainable water management in an oasis_ Tarim River basin of western China. Hydrol. Earth Syst. Sci. 18, 3951–3967. doi: 10.5194/hess-18-3951-2014
Zhu, T., Marques, G. F., and Lund, J. R. (2015). Hydroeconomic optimization of integrated water management and transfers under stochastic surface water supply. Water Resour. Res. 51, 3568–3587. doi: 10.1002/2014WR016519
Zhu, T., Ringler, C., and Rosegrant, M. W. (2019). Viewing agricultural water management through a systems analysis lens. Water Resour. Res. 55, 1778–1791. doi: 10.1029/2017WR021007
Keywords: hydroeconomic optimization, irrigated agriculture, canal-well conjunctive irrigation and drainage, arid region, salinization
Citation: Cao Z, Zhu T, Li B, Yan Y, Luo Y, Chen Y and Pan T (2025) Hydroeconomic optimization for canal-well conjunctive irrigation and drainage management in an arid region with salinization. Front. Sustain. Food Syst. 9:1721178. doi: 10.3389/fsufs.2025.1721178
Edited by:
Mengmeng Hu, Chinese Academy of Agricultural Sciences, ChinaReviewed by:
Jiangdong Chu, Northwest A&F University, ChinaPei Zhang, China Institute of Water Resources and Hydropower Research, China
Copyright © 2025 Cao, Zhu, Li, Yan, Luo, Chen and Pan. This is an open-access article distributed under the terms of the Creative Commons Attribution License (CC BY). The use, distribution or reproduction in other forums is permitted, provided the original author(s) and the copyright owner(s) are credited and that the original publication in this journal is cited, in accordance with accepted academic practice. No use, distribution or reproduction is permitted which does not comply with these terms.
*Correspondence: Baofu Li, bGliZkBxZm51LmVkdS5jbg==