 Aron Stubbins1*
 Robert G. M. Spencer2
 Paul J. Mann3
 R. Max Holmes4
 James W. McClelland5
 Jutta Niggemann6
 Thorsten Dittmar6
- 1Department of Marine Sciences, Skidaway Institute of Oceanography, University of Georgia, Savannah, GA, USA
- 2Department of Earth, Ocean and Atmospheric Science, Florida State University, Tallahassee, FL, USA
- 3Department of Geography, Northumbria University, Newcastle-upon-Tyne, UK
- 4Woods Hole Research Center, Falmouth, MA, USA
- 5University of Texas Marine Science Institute, Port Aransas, TX, USA
- 6Research Group for Marine Geochemistry, Institute for Chemistry and Biology of the Marine Environment, University of Oldenburg, Oldenburg, Germany
Wildfires have produced black carbon (BC) since land plants emerged. Condensed aromatic compounds, a form of BC, have accumulated to become a major component of the soil carbon pool. Condensed aromatics leach from soils into rivers, where they are termed dissolved black carbon (DBC). The transport of DBC by rivers to the sea is a major term in the global carbon and BC cycles. To estimate Arctic river DBC export, 25 samples collected from the six largest Arctic rivers (Kolyma, Lena, Mackenzie, Ob', Yenisey, and Yukon) were analyzed for dissolved organic carbon (DOC), colored dissolved organic matter (CDOM), and DBC. A simple, linear regression between DOC and DBC indicated that DBC accounted for 8.9 ± 0.3% of DOC exported by Arctic rivers. To improve upon this estimate, an optical proxy for DBC was developed based upon the linear correlation between DBC concentrations and CDOM light absorption coefficients at 254 nm (a254). Relatively easy to measure a254 values were determined for 410 Arctic river samples between 2004 and 2010. Each of these a254 values was converted to a DBC concentration based upon the linear correlation, providing an extended record of DBC concentration. The extended DBC record was coupled with daily discharge data from the six rivers to estimate riverine DBC loads using the LOADEST modeling program. The six rivers studied cover 53% of the pan-Arctic watershed and exported 1.5 ± 0.1 million tons of DBC per year. Scaling up to the full area of the pan-Arctic watershed, we estimate that Arctic rivers carry 2.8 ± 0.3 million tons of DBC from land to the Arctic Ocean each year. This equates to ~8% of Arctic river DOC export, slightly less than indicated by the simpler DBC vs. DOC correlation-based estimate. Riverine discharge is predicted to increase in a warmer Arctic. DBC export was positively correlated with river runoff, suggesting that the export of soil BC to the Arctic Ocean is likely to increase as the Arctic warms.
Introduction
Fire occurs in nearly all terrestrial ecosystems (Bowman et al., 2009) and is on the increase in the Arctic (Higuera et al., 2008; Hu et al., 2010). Black carbon (BC) refers to thermally altered organic material and it comes in many forms (Forbes et al., 2006), ranging in chemistry from minimally charred biomolecules (Myers-Pigg et al., 2015) to condensed aromatics formed at high temperatures (Dittmar, 2008). Once formed, condensed aromatics are ultra-refractory within soils, being preferentially preserved for hundreds to thousands of years (Schmidt et al., 2011). This stability, together with the ubiquity of fire, has resulted in condensed aromatics being distributed throughout the world's soils (Forbes et al., 2006; Guggenberger et al., 2008), where they have accumulated to represent approximately 10% of the global soil carbon store (Mitra et al., 2013). Wildfires have burned since the emergence of land plants 420 million years ago (Bowman et al., 2009). Without a significant loss term, condensed aromatics should have accumulated to represent an even greater pool of soil carbon than currently observed. The mobilization of soil condensed aromatics into solution and subsequent export by rivers to the oceans is the main loss term identified to date (Guggenberger et al., 2008; Dittmar et al., 2012a; Jaffé et al., 2013).
Once in solution, condensed aromatics are termed dissolved black carbon (DBC; Dittmar, 2008) and their export through rivers links the soil BC store to another major global carbon store, that of dissolved organic carbon (DOC) in the oceans (Hansell, 2013). As in soils, DBC in the oceans appears to be highly bio-refractory, based upon its ancient apparent radiocarbon age (Ziolkowski and Druffel, 2010), and has accumulated to become a major pool of global carbon (>12,000 Tg-C; Tg-C = 1012 grams of carbon; Dittmar and Paeng, 2009). Deep sea hydrothermal systems (Dittmar and Paeng, 2009) and atmospheric deposition (Jurado et al., 2008) have been proposed as sources of oceanic DBC. However, rivers are currently the major identified source of DBC to the ocean, delivering an estimated 26.5 Tg of DBC per year (Jaffé et al., 2013). Photo-degradation by sunlight is the major identified sink for DBC (Stubbins et al., 2010, 2012). However, at depth in the ocean, DBC behaves almost conservatively, suggesting minimal loss when light is not present (Dittmar and Paeng, 2009). Therefore, if DBC can reach areas of deep water formation before being photo-degraded, it may be in essence reburied in the deep ocean.
In this manuscript we present data for DBC concentrations in major Arctic rivers and estimate annual export of DBC from Arctic soils to the Arctic Ocean. While riverine inputs of DOC to the Arctic Ocean are well-constrained (Raymond et al., 2007; Spencer et al., 2009; Holmes et al., 2012), this is the first estimate of DBC export to the Arctic Ocean. To make this estimate, we quantified DBC in depth and flow integrated samples collected near the mouths of the six largest Arctic rivers under variable hydrological conditions (Figure 1; Kolyma, Lena, Mackenzie, Ob', Yenisey, and Yukon). Together, these six river watersheds cover 53% of the pan-Arctic watershed (Holmes et al., 2012). Discharge varies markedly with season in Arctic rivers. In winter, November to April, the watersheds and river surfaces are frozen such that groundwater derived discharge dominates, and only 10–15% of the annual Arctic river DOC load is exported during this 6 month period (Holmes et al., 2012). With the warmth of spring, thawing winter snow and ice drive a massive discharge peak that is accompanied by highest annual DOC concentrations. As a consequence, typically 45–65% of the annual Arctic DOC load is exported during May and June, the 2 months of the spring freshet (Raymond et al., 2007; Spencer et al., 2009; Holmes et al., 2012). After the intense spring freshet, the months from July through October account for the remainder of the annual DOC export.
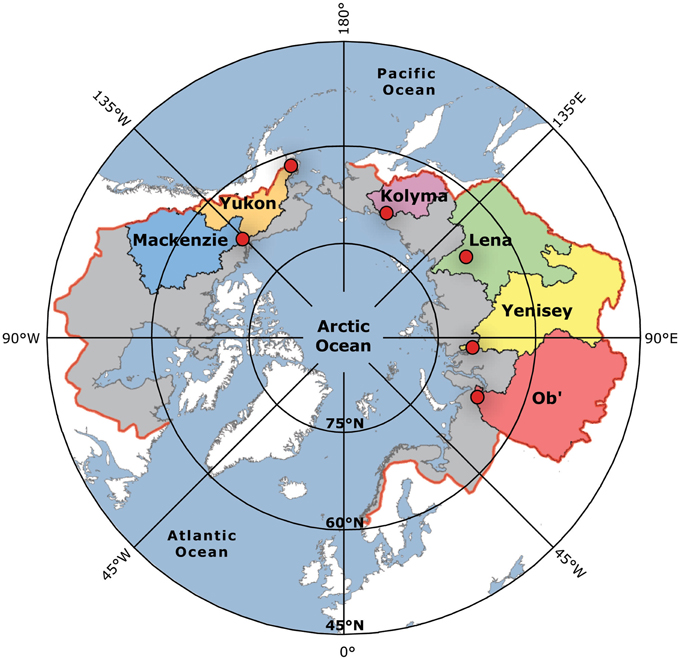
Figure 1. Map showing the six Arctic river watersheds sampled. The red dots indicate the sampling locations. Red line indicates the boundary and the gray fill the area of the pan-Arctic Ocean watershed. Data points in all subsequent figures are colored to match the river watershed colors here.
In the current study, DBC was quantified in 25 samples, collected over a broad range of runoff values in 2009. We also determined the Naperian light absorption coefficient of colored DOM (aCDOM; m−1), an optical property of DOM that is a good proxy for the aromatic components of the DOM pool (Weishaar et al., 2003; Stubbins et al., 2008; Spencer et al., 2009), including DBC (Stubbins et al., 2012). aCDOM was determined for 410 samples spanning the seasonal hydrographs of each river and 7 years (2004–2010). The utility of aCDOM as a proxy for DBC within Arctic rivers was confirmed and used within a LOADEST modeling exercise to develop a robust estimate for DBC export to the Arctic Ocean.
Methods
Sample Collection and Processing
Sample sites for each river were as follows, Salekhard (Ob'), Dudinka (Yenisey), Zhigansk (Lena), Cherskiy (Kolyma), Pilot Station (Yukon), and Tsiigehtchic (Mackenzie). Discharge data (m3 s−1) was taken from the ArcticRIMS website (http://rims.unh.edu/data.shtml) for nearby gauging stations and converted to surface area normalized runoff (m3 km−2 s−1; Table S1). The gauging stations and sampling locations are near the mouths of the rivers, capturing 96% of the six rivers' combined watershed area (Figure 1; Table 1). Depth integrated, flow weighted samples were collected following US Geological Survey protocols, filtered through pre-cleaned capsules (0.45 μm; Geotech), placed in acid-soaked Nalgene polycarbonate bottles and frozen until further processing (Holmes et al., 2012).
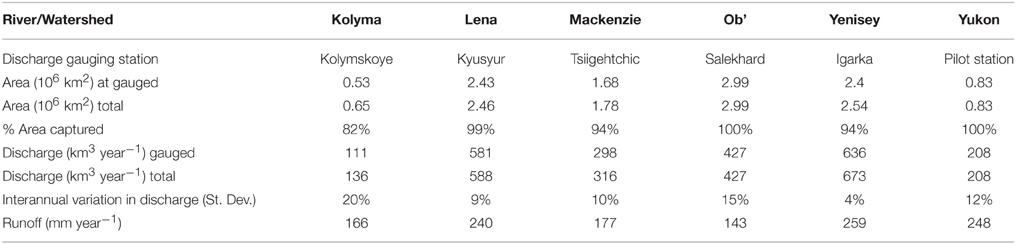
Table 1. Discharge gauging stations and watershed characteristics.
Dissolved Organic Carbon Concentrations
Aliquots of sample were transferred to pre-combusted 40 mL glass vials, acidified to pH 2 (hydrochloric acid), and analyzed for non-purgable organic carbon using a Shimadzu TOC-VCPH analyzer fitted with a Shimadzu ASI-V autosampler. In addition to potassium hydrogen phthalate standards, aliquots of deep seawater reference material, Batch 10, Lot# 05-10, from the Consensus Reference Material Project (CRM) were analyzed to check the precision and accuracy of the DOC analyses. Analyses of the CRM deviated by < 5% from the reported value for these standards (41–44 μM-DOC; http://yyy.rsmas.miami.edu/groups/biogeochem/Table1.htm). Routine minimum detection limits in the investigator's laboratory using the above configuration are 2.8 ± 0.3 μM-C and standard errors are typically 1.7 ± 0.5% of the DOC concentration (Stubbins and Dittmar, 2012).
Colored Dissolved Organic Matter Naperian Light Absorption
Sample was placed in a 1 cm quartz absorbance cell situated in the light path of an Agilent 8453 ultraviolet-visible spectrophotometer and sample CDOM absorbance spectra were recorded from 190 to 800 nm. Ultrapure water (Milli-Q) provided a blank. Blank corrected absorbance spectra were corrected for offsets due to scattering and instrument drift by subtraction of the average absorbance between 700 and 800 nm (Stubbins et al., 2011). Data output from the spectrophotometer were in the form of dimensionless absorbance (i.e., optical density, OD) and were subsequently converted to the Napierian absorption coefficient, a (m−1) (Hu et al., 2002).
Dissolved Black Carbon Concentration and Quality
Freeze dried river water samples were analyzed for DBC. DBC was determined at the molecular level via the benzenepolycarboxylic acid (BPCA) method as described in Dittmar (2008) and with modifications following (Stubbins et al., 2012). In brief, ~2 μmol of freeze dried DOC was transferred into pre-combusted (400°C, 4 h) 1 mL glass ampoules, and then redissolved in 500 μL of nitric acid (65%). The ampoules were sealed and heated to 170°C in a stainless steel pressure bomb inside a furnace for 9 h. After the ampoules cooled, 450 μL was transferred into 1 mL maximum recovery vials (Waters). The nitric acid was evaporated in a centrifugal evaporator (RVC 2-18, Christ, Germany) and the samples were redissolved in 100 μL of phosphate buffer solution (Na2HPO4 and NaH2PO4 each 5 mM in ultrapure water, buffered pH 7.2). BPCAs were determined on a Waters ACQUITY UPLC (Ultra Performance Liquid Chromatography) system composed of a binary solvent manager, a sample manager, a column manager and a photodiode array light absorbance detector (PDA eλ). BPCAs were separated on a Waters ACQUITY UPLC BEH C18 Column (2.1 × 150 mm, 1.7 μm) with an aqueous phase / methanol gradient. The aqueous phase consisted of a tetrabutylammonium bromide solution (4 mM, ACS quality) in phosphate buffer (Na2HPO4 and NaH2PO4 each 5 mM in ultrapure water, pH 7.2). The injection volume was 10 μL. BPCAs were identified according to retention time and absorbance spectra (220–380 nm). Quantification was performed using the absorption signal at 240 nm and external calibration.
DBC concentrations were calculated from the detected BPCA concentrations. The original equation to estimate DBC in nM of carbon (nM-C), from the molar BPCA concentrations of each BPCA (nM) (Dittmar, 2008) was:
The factor of 33.4 is based upon a conservative estimate of the average number of C atoms within DBC molecules identified by FT-ICR MS in a variety of natural waters (Dittmar, 2008). Note that the [DBC] is in nM-C and the BPCA concentrations are reported in nM of each molecule. Each BPCA is constituted of several C atoms. For instance, B6CA includes the 6 Cs in the aromatic ring, plus 6 carboxyl group (COOH) Cs. Therefore, the conversion factor of 33.4 represents a factor of approximately 3 on a carbon basis. This compares with factors of 2.27 in an early study that assessed the yield of BPCAs from solid charcoals (Glaser et al., 1998) and a factor of four suggested for aquatic samples (Ziolkowski and Druffel, 2010; Ziolkowski et al., 2011). Under certain oxidation conditions the nitric acid oxidation of BC to BPCAs can yield nitrated analogs of the BPCAs that are not quantified here, but do constitute part of the DBC pool (Ziolkowski et al., 2011). Thus, the total DBC concentrations reported here represent a conservative estimate of total DBC in aquatic systems given that the conversion factor was lower than used elsewhere and nitrated-BPCAs were not included in the analysis.
The method used here as originally presented utilized each of the BPCAs to calculate [DBC] via equation 1 (Dittmar, 2008). Although, B3CAs were reported to be stable at 170°C (Dittmar, 2008), subsequent experience suggests that recoveries of B3CAs are not always 100% (Stubbins et al., 2012). Furthermore, 1,2,4,5-B4CA is the only B4CA that is commercially available as a standard, prohibiting the confident conversion of the absorption signal at 240 nm for the other B4CAs to quantities. Therefore, as in a previous study (Stubbins et al., 2012), total DBC concentrations here were calculated directly from the robustly quantified B5CA and B6CA concentrations. An extensive BPCA data set collected for the Southern Ocean (Dittmar and Paeng, 2009), the Gulf of Mexico (Dittmar et al., 2012b) and other regions (unpublished) was used to develop a power-function relationship (R = 0.998, n = 351, p < 0.0001; Figure S1 on Data Sheet 1) to predict the concentration of DBC from the sum of the quantitatively dominant and robustly quantified B5CA and B6CA. This extrapolation reduced the analytical error range of replicate analysis for the calculation of total DBC within the model dataset to below 2% and provided a method to compare the data reported here with the total DBC concentrations reported elsewhere (Dittmar, 2008; Dittmar and Paeng, 2009; Dittmar et al., 2012a; Jaffé et al., 2013).
Given the differences in oxidation conditions and conversion factors applied in the literature, we also report the concentrations of the individual BPCAs to enable comparison with other datasets (Table S1).
Results
The six rivers were sampled at variable discharge (Table S1). Concentrations of DOC ranged from 2.6 to 17.5 mg-C L−1, and a254 from 12 to 148 m−1. Concentrations of each BPCA quantified are listed in Table S1. B5CA was the most abundant BPCA and total DBC concentrations ranged from 0.14 to 1.51 mg-C L−1. Changes in the quality of DBC being exported were also evident, with the B6CA:B5CA ratio ranging from 0.16 to 0.43 (Table S1). DBC loads on days when DBC concentrations were measured (i.e., DBC concentration × daily discharge) varied from 0.26 to 194.5 kg s−1 (Table S1). Within each river, the concentrations and loads of DBC were highest during peak discharge.
Discussion
Dissolved Black Carbon Concentrations
DBC concentrations varied by over an order of magnitude, from 0.14 to 1.51 mg-C L−1 (Table S1). For comparison, reported DBC concentrations ranged from 0.002 to 2.77 mg-C L−1 in global rivers (Jaffé et al., 2013) and from 0.02 to 0.88 mg-C L−1 in a small Arctic stream (Guggenberger et al., 2008). Upper limits to the concentrations of highly bio-labile forms of thermogenic DOC have been estimated in the Siberian rivers studied here based upon concentrations of levoglucosan (Myers-Pigg et al., 2015). These highly bio-labile forms of thermogenic DOC contribute up to 0.1–0.3 mg-C L−1 to the DOC pool at the sites studied here (data from 2004 to 2006; Myers-Pigg et al., 2015).
Previous work in the Arctic has demonstrated a strong link between DOC concentration and river hydrology. Early in the year, under ice flow cannot access the organic-rich seasonally thawed soil layer. Consequently, DOC concentrations in the river are low and sourced from groundwater (Table S1; Holmes et al., 2012). In the spring, soils and waterways thaw, and the spring freshet inundates the watershed. DOC concentrations reach maxima during this flushing event and subsequently decline as water levels fall (Holmes et al., 2012). For DBC, the same trend of high concentration at high flow, is apparent in the regression of DBC concentrations vs. runoff (watershed area normalized discharge; m3 km−2 s−1; Table S1), which reveals a significant linear correlation across the six rivers studied (Figure 2A; R2=0.63; n = 25; p < 0.0001).
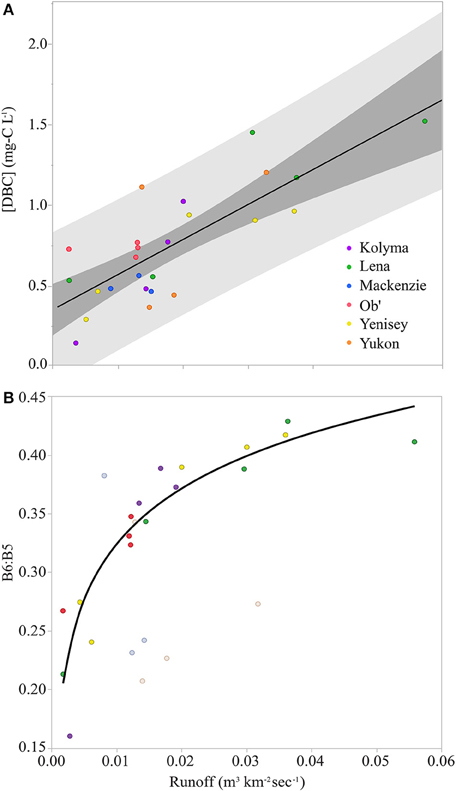
Figure 2. (A) Dissolved black carbon concentrations ([DBC]) vs. runoff for samples from across the hydrographs of the six Arctic rivers. Black line represents the linear regression of the data ([DBC] mg-C L−1 = 0.359 + 21.94 × runoff; Standard error of the intercept = 0.075; Standard error of the slope = 3.48; R2 = 0.63; n = 25; p < 0.0001). Dark gray represents extent of the confidence of fit (95% confidence limit). Light gray represents extent of confidence of prediction (95% confidence limit). (B) The ratio of benzeneHEXAcarboxylic acid to benzenePENTAcarboxylic acid (B6:B5) vs. runoff for samples from across the hydrographs of the six Arctic rivers. Data points from North American rivers are faded. Black line represents the logarithmic regression of the data from the Siberian rivers (B6:B5 = 0.638 + 0.0683 ln(runoff); Standard error of the intercept = 0.033; Standard error of the slope = 0.007; R2 = 0.84; p < 0.0001; n = 18).
Plots of solute concentration vs. runoff are used in hydrological studies to learn more about potential solute sources and the mechanisms controlling their export (Evans and Davies, 1998). The simplest interpretation of the linear correlation between DBC and runoff requires the conservative mixing of only two sources. In the Paraíba do Sul River, Brazil, variations in DBC concentrations with hydrology were explained by a simple two endmember model, with low DBC concentrations in groundwater under base flow conditions mixing with inputs of higher, but constant DBC concentration waters from active soil layers as discharge increased (Dittmar et al., 2012a). In Arctic rivers, the relationship between hydrology and DBC concentration also indicates that in the winter, when the watersheds are frozen and discharge at a minimum, rivers are dominated by inputs from groundwater with low DBC. As runoff increases in the spring, the hydrological pathway incorporates soil active layers, which are rich in organics, including soluble BC (Guggenberger et al., 2008).
The lack of a plateau at high runoff in the current dataset (Figure 2A) suggests that if runoff were to increase, then DBC concentrations would also continue to increase, leading to greater DBC export. Eurasian Arctic river discharge has increased (Peterson et al., 2002). Modeling studies predict that runoff will increase further as the Arctic warms in the future, with the greatest increases occurring as an amplification of the spring freshet (Van Vliet et al., 2013). If these models are correct, Figure 2A suggests DBC exports will also increase, with the spring freshet contributing ever more to annual DBC loads. Thus, both the magnitude and the timing of DBC delivery to the Arctic Ocean are liable to change in the future.
Dissolved Black Carbon Quality
The molecular BPCA method as applied here quantifies broad classes of DBC oxidation products, each with a different number of carboxylic groups (Dittmar, 2008). These are the: benzeneTRIcarboxylic acids (B3); benzeneTETRAcarboxylic acids (B4); benzenePENTAcarboxylic acid (B5); and, benzeneHEXAcarboxylic acid (B6). Each of these BPCAs provides structural information about DBC. B6 is indicative of highly condensed aromatics, whereas the benzene products with lower numbers of carboxylic substitutes are indicative of molecules with smaller numbers of condensed rings at their core (Schneider et al., 2010). As B6 and B5 were the most robustly quantified BPCAs, only the ratios of these two BPCAs are reported. The B6:B5 ratio provides an index, where higher values indicate greater levels of the most condensed forms of DBC (Stubbins et al., 2012). B6:B5 ratios have been reported for Little Grawijka Creek, a small Arctic stream (watershed area 0.44 km2; Guggenberger et al., 2008) within the watershed of the Yenisei River (watershed area 2.54 × 10⁶ km2; Table 1). Comparison of B6:B5 values for the 6 large Arctic rivers (0.16 to 0.43; Table S1) to values in the Little Grawijka Creek (0.30 to 0.65; Guggenberger et al., 2008) suggests the DBC within the mainstems of the large Arctic rivers may be less condensed than DBC in Little Grawijka Creek, and possibly other Arctic headwaters.
In the Siberian rivers (Kolyma, Lena, Ob', and Yenisey), there was a significant correlation between B6:B5 and runoff (Figure 2B). The logarithmic fit indicates that at low flow, these Siberian rivers are dominated by water from a source with low concentrations of DBC (Figure 2A) and that the DBC in this water is less condensed than the DBC exported at high runoff (Figure 2B). The B6:B5 ratio then approaches a plateau at high runoff, where the value reached at the plateau can be considered the B6:B5 ratio of a putative high runoff, high DBC concentration endmember derived from the soil active layer. The logarithmic fit to the data (Figure 2B caption) suggests this endmember would have a B6:B5 ratio of 0.63, a-value similar to the highest B6:B5 ratio observed at peak discharge during the spring freshet within Little Grawijka Creek (0.65; Guggenberger et al., 2008).
Although future work is required to determine the source of DBC to Arctic rivers, in the current study, both the concentrations (Figure 2A) and the degree of DBC condensation (Figure 2B) were elevated in the Siberian rivers during high flow, suggesting a soil source. It is unclear why this trend in B6:B5 was not apparent in the Yukon and Mackenzie Rivers of Northern America. The significantly higher sediment loads and associated sorption reactions in the North American rivers (Holmes et al., 2012) may differentiate their B6:B5 ratios from those observed in the sediment-poor Siberian rivers. Within the Mackenzie, B6:B5 ratios may also be influenced by inputs from petrogenic sources (Yunker et al., 2002). More data is required to verify these trends and, once verified, to seek mechanistic explanations.
Estimating Dissolved Black Carbon Export from Dissolved Organic Carbon
DBC and DOC concentrations were correlated (R2 = 0.96; Figure 3A). Previous work has reported similar correlations between total DOC and DBC concentrations within rivers. For instance, Jaffé et al. (2013) conducted an assessment including 109 DBC concentrations for rivers diverse in stream order and latitude, including seasonally averaged values for the DBC values of the 6 Arctic rivers studied here (i.e., data for each of the 25 samples analyzed here were not presented in Jaffé et al. (2013), only their averages on a river-by-river basis). As in the current study, the intercept of the slope between DBC and DOC was statistically indistinguishable from zero (current study intercept = −0.019±0.035 mg-C L−1). Therefore, Jaffé et al. (2013) interpreted the slope of the linear regression to approximate the globally averaged contribution of DBC to riverine DOC concentrations. For their dataset, DBC was estimated to account for 10.5 ± 0.7% of global DOC exports. Following the same approach, reference to the slope in Figure 3A indicates that DBC constitutes 8.9 ± 0.3% of Arctic river DOC. This suggests Arctic river DOC is slightly depleted in DBC relative to rivers globally, though larger datasets for both global and Arctic rivers are required to strengthen this conclusion. Jaffé et al. (2013) used the percentage contribution of DBC to riverine DOC concentrations and a global DOC load of 250 Tg-C yr−1 (Hedges et al., 1997) to estimate that 26.5 ± 0.8 Tg-C yr−1 of DBC is exported to the oceans each year. An analogous calculation based upon an Arctic DOC load of 34 Tg-C yr−1 (Holmes et al., 2012) and the DBC percentage for Arctic rivers, leads to an estimated DBC export by Arctic rivers of 3.0 ± 0.1 Tg-C yr−1.
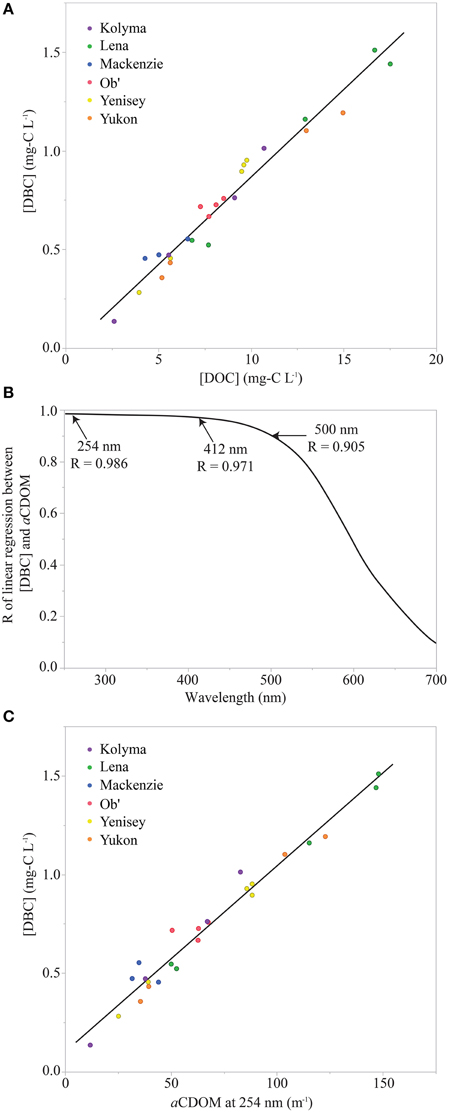
Figure 3. (A) Dissolved black carbon concentration ([DBC]) vs. dissolved organic carbon concentration ([DOC]). Black line represents the linear regression of the data ([DBC] = –0.019 + 0.887 × [DOC]; Standard error of the intercept = 0.035; Standard error of the slope = 0.004; R2 = 0.96; n = 25; p < 0.0001) (B) Plot of correlation coefficient (R) values for linear regressions of [DBC] vs. colored dissolved organic carbon Naperian light absorption coefficients (aCDOM) vs. wavelength. (C) [DBC] vs. aCDOM at 254 nm (a254). Black line represents the linear regression of the data ([DBC] = 0.104 + 0.00942 × a254; Standard error of the intercept = 0.028; Standard error of the slope = 0.00036; R = 0.986; R2 = 0.968; n = 25; p < 0.0001).
Refining Estimates of Dissolved Black Carbon Export Using CDOM
The above correlations between DOC and DBC provide a method of converting between relatively common DOC loads and rarer, more analytically challenging measurements of DBC. However, when looking for a proxy of aromatic carbon components, CDOM measurements offer even greater potential. First of all, light absorption by CDOM provides a robust empirical proxy for aromatic DOM components in Arctic rivers (Spencer et al., 2009) and model systems (Weishaar et al., 2003; Stubbins et al., 2008), including DBC concentrations in a photochemical degradation experiment (Stubbins et al., 2012). Second, measuring CDOM is simpler and cheaper than measuring DOC. Finally, estimates of CDOM can be made in situ with in water spectrophotometers (Spencer et al., 2007; Tait et al., 2015) and from space, using satellite remote sensing of water color (Griffin et al., 2011). To determine if CDOM could provide a robust proxy for DBC in Arctic rivers, a series of linear regressions were performed between DBC concentration and CDOM light absorption at wavelengths from 250 to 600 nm. Plotting the resultant correlation values (R) for the linear regressions against wavelength revealed which wavelengths provided the most robust proxies for DBC concentration (Figure 3B). Values for R peaked (R = 0.986) around 254 nm, a wavelength long used to estimate the relative aromatic content of DOM (Weishaar et al., 2003). At longer wavelengths, R declined gradually to 0.971 at 412 nm and 0.905 at 500 nm, before dropping more rapidly at increasing wavelengths (Figure 3B). The robust correlation at 412 nm is encouraging for those wishing to remote sense DBC from space, as estimates of CDOM at 412 nm can be retrieved from SeaWiFS (http://oceancolor.gsfc.nasa.gov/SeaWiFS) and MODIS (http://modis.gsfc.nasa.gov) satellites.
In the current study, the equation of the linear regression between DBC and CDOM light absorption at 254 nm (a254) was used as a proxy to estimate DBC concentrations for each of the 410 samples analyzed for CDOM (Figure 3C). This increased the temporal extent and resolution of our DBC dataset from 25 samples over 1 year to 410 samples over 7 years. Under ice sampling for CDOM was limited as it is logistically challenging. Where data gaps exceeding 1 month occurred, the average under ice CDOM for each river was used to estimate winter concentrations of DBC for the modeling exercise below. This is unlikely to have significantly altered estimates of DBC export as under ice DOC concentration and water discharge are low and contribute minimally to annual Arctic river discharge and DOC loads (Holmes et al., 2012).
LOADEST Model Estimates of Daily Dissolved Black Carbon Loads
The goal of the current study was to develop a continuous record of DBC export for each river across 7 years. To achieve this, daily discharge values for each river, along with the 410 CDOM derived DBC concentrations, were entered into a hydrological load estimating model (LOADEST using predefined regression model 4; http://water.usgs.gov/software/loadest; Runkel et al., 2004) to determine daily and annual DBC loads. The predefined model 4 was chosen as it provides robust estimates of DOC export for Arctic rivers and to enable the resultant DBC loads to be compared directly to previous estimates of DOC loads made using the same model (Holmes et al., 2012). Output from the model provides estimated daily loads for DBC across the 7 years of hydrological data. To assess model performance, modeled daily loads were compared to daily loads calculated for the 25 days when DBC samples were collected. On these days, DBC loads were calculated as DBC concentration multiplied by measured discharge at the gauging station (Table S1). The hydrograph together with predicted and measured DBC loads for the Lena River are presented in Figure 4. Visual inspection indicates the model matches calculated data. Considering data for all rivers, the mean absolute error between modeled and calculated DBC loads was 11%. A two component linear regression (R2 = 0.987; p < 0.0001) of modeled vs. calculated DBC loads yielded a slope of 0.999 ± 0.02 (p < 0.0001) and intercept of 0.11 ± 0.11 (p = 0.3489). The intercept was insignificantly different from zero. Forcing the slope through zero yielded a slope of 1.01 ± 0.02 (R2 = 0.987; p < 0.0001; Figure 5). That the slope of the regression was insignificantly different from unity (i.e., 1) indicates that use of a254 as a proxy for DBC and the assumptions of the LOADEST model provided a quantitatively robust estimate of daily DBC loads.
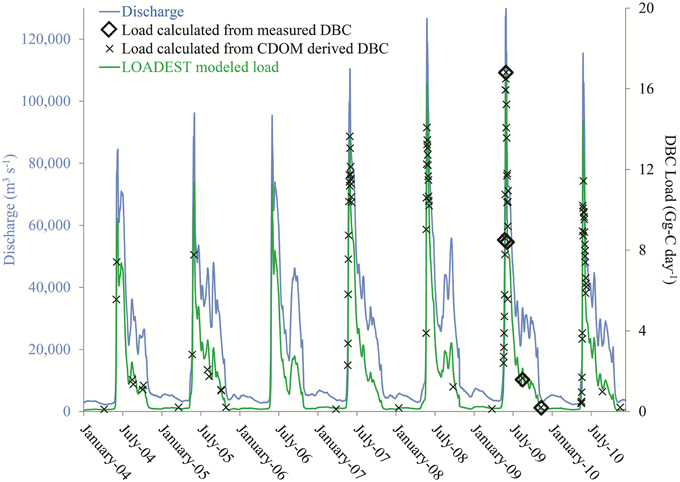
Figure 4. Discharge plus calculated and modeled dissolved black carbon (DBC) loads for the Lena River between 2004 and 2010. Loads calculated from measured DBC were calculated as discharge on the day DBC was sampled multiplied by the measured [DBC] (n = 5). Loads calculated based upon colored dissolved organic matter (CDOM) derived DBC were calculate as discharge on the days CDOM was sampled multiplied by [DBC] estimated from CDOM absorbance and the slope of the linear regression in Figure 3C (n = 132). LOADEST modeled loads were estimated using the LOADEST load model with daily discharge and CDOM based estimates of [DBC] as input data (n = 2557).
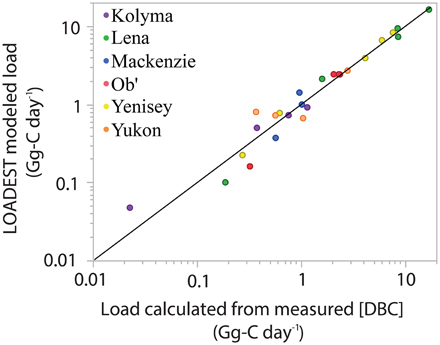
Figure 5. LOADEST modeled dissolved black carbon (DBC) loads vs. loads calculated from measured [DBC] and discharge on the day of sampling. Black line represents the zero intercept linear regression of the data. When the fit was not constrained, the intercept was not significantly different from zero (0.11 ± 0.11; p = 0.35). Therefore, the intercept was constrained to zero and the fit on the graph has the following parameters (LOADEST modeled load = Load calculated from measured [DBC] × 1.012; R2 = 0.987; Standard error of the slope = 0.019; p < 0.0001; n = 25).
Gauging stations were near the mouths of the rivers, capturing from 82 to 100 % of each individual river's discharge, and 96% of the six rivers' combined discharge (Table 1). To determine DBC loads (Gg-C yr−1) for the entirety of the river watersheds, the DBC yields (Gg-C km−2 yr−1) for the gauged river areas were extrapolated to the total river area (Table 1). The same modeling exercise was repeated for each BPCA quantified. Annual export of each BPCA to the Arctic Ocean is presented in the Supplementary Materials in (Tables S2A–D). Below we focus upon the total DBC flux estimates.
The annual DBC load for the six rivers ranged from 1.4 million tons per year in 2004 and 2010 to 1.7 million tons per year in 2007. Interannual variations in DBC loads were greater than interannual variation in discharge, highlighting how variations in discharge amplify variations in the export of dissolved organics (compare Table 1 and Table 2). The greatest year-to-year variation was observed in the Kolyma (33% st. dev.) and the Yukon (27% st. dev.) Rivers while the Yenisey River (5% st. dev.) showed the lowest interannual variation in loads (Table 2). The majority of the trend in interannual variability in DBC loads between rivers stems from their trends in interannual variability in discharge, which is also greatest in the Kolyma (20%) and minimal in the Yenisey River (4%; Table 1). However, interannual variability in the Yukon River discharge was only 12%, suggesting that Yukon River DBC export is particularly sensitive to discharge variation. The average annual DBC load for the six rivers was 1.5 ± 0.1 million tons per year (Table 2). This translates to an average areal yield of 138 ± 13 kg-C km−2 yr−1, a DBC yield similar to that determined for a tundra forest watershed in Northern Siberia (100 kg-C km−2 yr−1; Guggenberger et al., 2008), but more than double that of the Paraíba do Sul which drains an area of intense slash-and-burn land clearing in Brazil (Dittmar et al., 2012a).
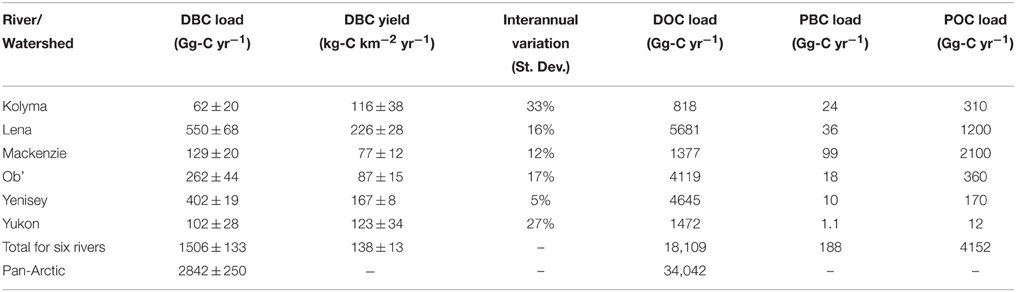
Table 2. Average dissolved black carbon (DBC) loads, yields and interannual variation in both for the six rivers studied and for the pan-Arctic watershed, plus literature values for the rivers' dissolved organic carbon (DOC; Holmes et al., 2012), particulate organic carbon (POC; Stein and MacDonald, 2004) and particulate black carbon (PBC; Elmquist et al., 2008) loads.
The gauged area of the six rivers studied covered 10.9 × 10⁶ km2 or 53% of the pan-Arctic watershed (Figure 1). A pan-Arctic DBC load of 2.8 ± 0.25 million tons per year was estimated assuming DBC yields to be the same in the sampled and unsampled fractions of the pan-Arctic watershed. Riverine export of particulate BC has been presented for the six rivers studied here (Elmquist et al., 2008; Table 2). This estimate of particulate BC loads (Elmquist et al., 2008) was made using the chemothermic oxidation (CTO) method that over estimates BC in organic rich samples such as particulate organic matter samples (Hammes et al., 2007). Therefore, the particulate BC fluxes should be considered an upper limit or an over estimate of true loads. Despite the potential for the CTO particulate BC to be an overestimate, our calculated load based upon the BPCA method which yields conservative estimates of DBC from the six rivers is eight times that of particulate BC (Table 2). This makes riverine DBC export the largest quantified term for BC removal from the pan-Arctic watershed, suggesting that DBC export plays a major role in the Arctic storage of soil BC. This appears to be true elsewhere in the world. For instance, estimated DBC export by a tropical river in Brazil is far greater than contemporary BC production in the watershed (Dittmar et al., 2012a).
Comparing DBC export to total organic carbon fluxes reveals that DBC contributes approximately 8% of DOC export (Holmes et al., 2012), which is slightly less than the 8.9% of DOC estimated using the linear correlation between DBC and DOC (Figure 3A). This flux equates to 36% of total particulate organic carbon (POC) export from the six rivers studied (Stein and MacDonald, 2004; Table 2). The export and burial of terrestrial POC in ocean margins is a significant long-term carbon sink (Blair and Aller, 2012). By analogy, if DBC is also locked away in the marine environment, riverine DBC export represents a translocation of refractory carbon from one store to another. If however, DBC is labile within the ocean, the once refractory carbon stored in the soil black carbon pool will re-enter the contemporary carbon cycle. As DBC is refractory in the deep ocean (Dittmar and Paeng, 2009; Ziolkowski and Druffel, 2010), yet highly labile when exposed to sunlight (Stubbins et al., 2010, 2012), the efficiency of carbon translocation from soil to ocean stores may be strongest in Arctic waters where it has been demonstrated that a significant fraction of other terrestrially derived, photo-labile aromatics survive transport to the major regions of North Atlantic Deep Water formation (Benner et al., 2005). Therefore, although Arctic rivers contribute 11% of the 26.5 million tons per year of DBC delivered to the oceans globally (Jaffé et al., 2013), their relative contribution to the global deep ocean store of DBC is potentially much higher. The Arctic rivers alone would replenish the global marine pool of DBC (>12 Pg-C; Dittmar and Paeng, 2009) in approximately 4300 years. This initial estimate is considerably shorter than the apparent age of DBC in the open ocean (Ziolkowski and Druffel, 2010) suggesting that Arctic river DBC export and subsequent entrainment into the abyssal ocean at points of deep water formation could provide the single most important pathway of DBC delivery to the deep ocean.
Conclusions
Today, the DBC mediated transfer of BC from the land to the oceans is a major term in the Arctic carbon cycle. In terms of continued research, measurement of photo-labile, but bio-refractory thermogenic DOM, i.e., DBC quantified as BPCAs, and highly bio-labile thermogenic DOM quantified via levoglucosan offer an intriguing dual tracer approach to assess the dynamics of thermogenic DOM within aquatic systems (Myers-Pigg et al., 2015). Optical measurements of absorbance, including at 412 nm, a wavelength amenable to remote sensing, provide robust proxies for DBC concentrations in Arctic rivers that should enable us to resolve temporal and spatial patterns in DBC cycling. Looking to the future of the Arctic, Arctic warming is set to continue at rates exceeding global average temperature increases, leading to pronounced perturbations in the Arctic which are likely to increase the production and export of BC. Warming and associated changes to the water cycle appear to be increasing Arctic wildfire frequency (Higuera et al., 2008; Hu et al., 2010), potentially increasing BC production. Arctic soils store the largest pool of organic carbon on the planet (Gruber et al., 2004). Changing climate in the Arctic is increasing river water discharge (Peterson et al., 2002; Van Vliet et al., 2013). Increasing runoff will likely increase DBC export (Figure 2). Therefore, it is likely that the transfer of BC from Arctic soils to the ocean will accelerate. Measurements of CDOM light absorption for discrete water samples, using in situ spectrophotometers, or via remote sensing techniques could provide an effective way of monitoring future DBC fluxes to the Arctic Ocean so long as periodic checks are made to test the continuing veracity of the linear regression presented here (Figure 3C). The eventual fate of exported DBC in the Arctic and global ocean will influence the sign and degree of climate-carbon cycle feedbacks. If exported DBC is effectively photo-degraded in ocean surface waters, its carbon will likely enter the atmospheric CO2 pool. However, if exported Arctic DBC reaches areas of deep water formation around Greenland, it will be reburied, not in the soils of the Arctic, but the deep waters of the global ocean.
Author Contributions
All authors contributed to the design of the study. JN analyzed samples for dissolved black carbon. AS, RS, and PM conducted modeling studies. All authors contributed to the writing of the manuscript.
Conflict of Interest Statement
The Guest Associate Editor Christopher Osburn declares that, despite having collaborated with authors Thorsten Dittmar and Jutta Niggemann, the review process was handled objectively. The authors declare that the research was conducted in the absence of any commercial or financial relationships that could be construed as a potential conflict of interest.
Acknowledgments
Ekaterina Bulygina is thanked for CDOM analyses, Ina Ulber for assistance with BPCA samples, Greg Fiske for assistance with GIS analysis and the preparation of Figure 1, and Anna Boyette for assistance with figures. This work was funded by the U.S. National Science Foundation (ANT-1203885, OPP-0732522, OPP-0732821, OPP-1107774, DEB-1146161, DEB-1145932, PLR-1500169) and a Fellowship from the Hanse Institute for Advanced Studies (HWK, Delmenhorst, Germany) granted to AS. Data are archived at the Skidaway Institute of Oceanography and are attainable from AS or via the Arctic Great Rivers Observatory website (http://arcticgreatrivers.org/).
Supplementary Material
The Supplementary Material for this article can be found online at: http://journal.frontiersin.org/article/10.3389/feart.2015.00063
References
Benner, R., Louchouarn, P., and Amon, R. M. W. (2005). Terrigenous dissolved organic matter in the Arctic Ocean and its transport to surface and deep waters of the North Atlantic. Global Biogeochem. Cycles 19:GB2025. doi: 10.1029/2004GB002398
Blair, N. E., and Aller, R. C. (2012). The fate of terrestrial organic carbon in the marine environment. Ann. Rev. Mar. Sci. 4, 401–423. doi: 10.1146/annurev-marine-120709-142717
Bowman, D. M. J. S., Balch, J. K., Artaxo, P., Bond, W. J., Carlson, J. M., Cochrane, M. A., et al. (2009). Fire in the earth system. Science 324, 481–484. doi: 10.1126/science.1163886
Dittmar, T. (2008). The molecular level determination of black carbon in marine dissolved organic matter. Org. Geochem. 39, 396–407. doi: 10.1016/j.orggeochem.2008.01.015
Dittmar, T., De Rezende, C. E., Manecki, M., Niggemann, J., Coelho Ovalle, A. R., Stubbins, A., et al. (2012a). Continuous flux of dissolved black carbon from a vanished tropical forest biome. Nat. Geosci. 5, 618–622. doi: 10.1038/ngeo1541
Dittmar, T., and Paeng, J. (2009). A heat-induced molecular signature in marine dissolved organic matter. Nat. Geosci. 2, 175–179. doi: 10.1038/ngeo440
Dittmar, T., Paeng, J., Gihring, T. M., Suryaputra, I. G., and Huettel, M. (2012b). Discharge of dissolved black carbon from a fire−affected intertidal system. Limnol. Oceanogr. 57, 1171–1181. doi: 10.4319/lo.2012.57.4.1171
Elmquist, M., Semiletov, I., Guo, L., and Gustafsson, Ö. (2008). Pan−Arctic patterns in black carbon sources and fluvial discharges deduced from radiocarbon and PAH source apportionment markers in estuarine surface sediments. Global Biogeochem. Cycles 22:GB2018. doi: 10.1029/2007GB002994
Evans, C., and Davies, T. D. (1998). Causes of concentration/discharge hysteresis and its potential as a tool for analysis of episode hydrochemistry. Water Resour. Res. 34, 129–137. doi: 10.1029/97WR01881
Forbes, M. S., Raison, R. J., and Skjemstad, J. O. (2006). Formation, transformation and transport of black carbon (charcoal) in terrestrial and aquatic ecosystems. Sci. Total Environ. 370, 190–206. doi: 10.1016/j.scitotenv.2006.06.007
Glaser, B., Haumaier, L., Guggenberger, G., and Zech, W. (1998). Black carbon in soils: the use of benzenecarboxylic acids as specific markers. Org. Geochem. 29, 811–819. doi: 10.1016/S0146-6380(98)00194-6
Griffin, C. G., Frey, K. E., Rogan, J., and Holmes, R. M. (2011). Spatial and interannual variability of dissolved organic matter in the Kolyma River, East Siberia, observed using satellite imagery. J. Geophys. Res. Biogeosci. 116:G03018. doi: 10.1029/2010JG001634
Gruber, N., Friedlingstein, P., Field, C. B., Valentini, R., Heimann, M., Richey, J. E., et al. (2004). “The vulnerability of the carbon cycle in the 21st century: An assessment of carbon-climate-human interactions,” in The Global Carbon Cycle: Integrating Humans, Climate, and the Natural World, eds M. R. R. Christopher and B. Field (Washington, DC: Island Press), 45–76.
Guggenberger, G., Rodionov, A., Shibistova, O., Grabe, M., Kasansky, O. A., Fuchs, H., et al. (2008). Storage and mobility of black carbon in permafrost soils of the forest tundra ecotone in Northern Siberia. Glob. Change Biol. 14, 1367–1381. doi: 10.1111/j.1365-2486.2008.01568.x
Hammes, K., Schmidt, M. W. I., Smernik, R. J., Currie, L. A., Ball, W. P., Nguyen, T. H., et al. (2007). Comparison of quantification methods to measure fire-derived (black/elemental) carbon in soils and sediments using reference materials from soil, water, sediment and the atmosphere. Glob. Biogeochem. Cycles 21:GB3016. doi: 10.1029/2006GB002914
Hansell, D. A. (2013). Recalcitrant dissolved organic carbon fractions. Ann. Rev. Mar. Sci. 5, 421–445. doi: 10.1146/annurev-marine-120710-100757
Hedges, J., Keil, R., and Benner, R. (1997). What happens to terrestrial organic matter in the ocean? Org. Geochem. 27, 195–212. doi: 10.1016/S0146-6380(97)00066-1
Higuera, P. E., Brubaker, L. B., Anderson, P. M., Brown, T. A., Kennedy, A. T., and Hu, F. S. (2008). Frequent fires in ancient shrub tundra: implications of paleorecords for arctic environmental change. PLoS ONE 3:e0001744. doi: 10.1371/journal.pone.0001744
Holmes, R. M., McClelland, J. W., Peterson, B. J., Tank, S. E., Bulygina, E., Eglinton, T. I., et al. (2012). Seasonal and annual fluxes of nutrients and organic matter from large rivers to the arctic ocean and surrounding seas. Estuar. Coast. 35, 369–382. doi: 10.1007/s12237-011-9386-6
Hu, C., Muller-Karger, F. E., and Zepp, R. G. (2002). Absorbance, absorption coefficient, and apparent quantum yield: a comment on common ambiguity in the use of these optical concepts. Limnol. Oceanogr. 47, 1261–1267. doi: 10.4319/lo.2002.47.4.1261
Hu, F. S., Higuera, P. E., Walsh, J. E., Chapman, W. L., Duffy, P. A., Brubaker, L. B., et al. (2010). Tundra burning in Alaska: linkages to climatic change and sea ice retreat. J. Geophys. Res. Biogeosci. 115:G04002. doi: 10.1029/2009JG001270
Jaffé, R., Ding, Y., Niggemann, J., Vähätalo, A. V., Stubbins, A., Spencer, R. G. M., et al. (2013). Global charcoal mobilization from soils via dissolution and riverine transport to the oceans. Science 340, 345–347. doi: 10.1126/science.1231476
Jurado, E., Dachs, J., Duarte, C. M., and Simo, R. (2008). Atmospheric deposition of organic and black carbon to the global oceans. Atmos. Environ. 42, 7931–7939. doi: 10.1016/j.atmosenv.2008.07.029
Mitra, S., Zimmerman, A., Hunsinger, G., and Woerner, W. (2013). Black carbon in coastal and large river systems. Biogeochem. Dyn. Major River Coast. Interfaces 200, 200–236. doi: 10.1017/CBO9781139136853.012
Myers-Pigg, A. N., Louchouarn, P., Amon, R. M., Prokushkin, A., Pierce, K., and Rubtsov, A. (2015). Labile pyrogenic dissolved organic carbon in major Siberian Arctic rivers: implications for wildfire−stream metabolic linkages. Geophys. Res. Lett. 42, 377–385. doi: 10.1002/2014GL062762
Peterson, B. J., Holmes, R. M., McClelland, J. W., Vörösmarty, C. J., Lammers, R. B., Shiklomanov, A. I., et al. (2002). Increasing river discharge to the Arctic Ocean. Science 298, 2171–2173. doi: 10.1126/science.1077445
Raymond, P. A., McClelland, J. W., Holmes, R. M., Zhulidov, A. V., Mull, K., Peterson, B. J., et al. (2007). Flux and age of dissolved organic carbon exported to the Arctic Ocean: a carbon isotopic study of the five largest arctic rivers. Global Biogeochem. Cycles 21:GB4011. doi: 10.1029/2007GB002934
Runkel, R. L., Crawford, C. G., and Cohn, T. A. (2004). “Load Estimator (LOADEST): A FORTRAN program for estimating constituent loads in streams and rivers,” in Techniques and Methods (Colorado: United States Geological Survey).
Schmidt, M. W. I., Torn, M. S., Abiven, S., Dittmar, T., Guggenberger, G., Janssens, I. A. Trumbore, S.E., et al. (2011). Persistence of soil organic matter as an ecosystem property. Nature 478, 49–56. doi: 10.1038/nature10386
Schneider, M. P. W., Hilf, M., Vogt, U. F., and Schmidt, M. W. I. (2010). The benzene polycarboxylic acid (BPCA) pattern of wood pyrolyzed between 200°C and 1000°C. Org. Geochem. 41, 1082–1088. doi: 10.1016/j.orggeochem.2010.07.001
Spencer, R. G. M., Aiken, G. R., Butler, K. D., Dornblaser, M. M., Striegl, R. G., and Hernes, P. J. (2009). Utilizing chromophoric dissolved organic matter measurements to derive export and reactivity of dissolved organic carbon exported to the Arctic Ocean: a case study of the Yukon River, Alaska. Geophys. Res. Lett. 36:L06401. doi: 10.1029/2008GL036831
Spencer, R. G. M., Pellerin, B. A., Bergamaschi, B. A., Downing, B. D., Kraus, T. E. C., Smart, D. R., et al. (2007). Diurnal variability in riverine dissolved organic matter composition determined by in situ optical measurement in the San Joaquin River (California, USA). Hydrol. Process. 21, 3181–3189. doi: 10.1002/hyp.6887
Stein, R., and MacDonald, R. W. (eds.). (2004). The Organic Carbon Cycle in the Arctic Ocean. Berlin; Heidelberg: Springer. doi: 10.1007/978-3-642-18912-8
Stubbins, A., and Dittmar, T. (2012). Low volume quantification of dissolved organic carbon and dissolved nitrogen. Limnol. Oceanogr. Methods 10, 347–352. doi: 10.4319/lom.2012.10.347
Stubbins, A., Hubbard, V., Uher, G., Law, C. S., Upstill-Goddard, R. C., Aiken, G. R., et al. (2008). Relating carbon monoxide photoproduction to dissolved organic matter functionality. Environ. Sci. Technol. 42, 3271–3276. doi: 10.1021/es703014q
Stubbins, A., Law, C. S., Uher, G., and Upstill-Goddard, R. C. (2011). Carbon monoxide apparent quantum yields and photoproduction in the Tyne estuary. Biogeosciences 8, 703–713. doi: 10.5194/bg-8-703-2011
Stubbins, A., Niggemann, J., and Dittmar, T. (2012). Photo-lability of deep ocean dissolved black carbon. Biogeosciences 9, 1661–1670. doi: 10.5194/bg-9-1661-2012
Stubbins, A., Spencer, R. G. M., Chen, H., Hatcher, P. G., Mopper, K., Hernes, P. J., et al. (2010). Illuminated darkness: molecular signatures of Congo River dissolved organic matter and its photochemical alteration as revealed by ultrahigh precision mass spectrometry. Limnol. Oceanogr. 55, 1467–1477. doi: 10.4319/lo.2010.55.4.1467
Tait, Z. S., Thompson, M., and Stubbins, A. (2015). Chemical fouling reduction of a submersible steel spectrophotometer in estuarine environments using a sacrificial zinc anode. J. Environ. Qual. 44, 1321–1325. doi: 10.2134/jeq2014.11.0484
Van Vliet, M. T. H., Franssen, W. H. P., Yearsley, J. R., Ludwig, F., Haddeland, I., Lettenmaier, D. P., et al. (2013). Global river discharge and water temperature under climate change. Glob. Environ. Change 23, 450–464. doi: 10.1016/j.gloenvcha.2012.11.002
Weishaar, J. L., Aiken, G. R., Bergamaschi, B. A., Fram, M. S., Fujii, R., and Mopper, K. (2003). Evaluation of specific ultraviolet absorbance as an indicator of the chemical composition and reactivity of dissolved organic carbon. Environ. Sci. Technol. 37, 4702–4708. doi: 10.1021/es030360x
Yunker, M., Backus, S., Pannatier, E. G., Jeffries, D., and MacDonald, R. (2002). Sources and significance of alkane and PAH hydrocarbons in Canadian arctic rivers. Estuar. Coast. Shelf Sci. 55, 1–31. doi: 10.1006/ecss.2001.0880
Ziolkowski, L. A., Chamberlin, A., Greaves, J., and Druffel, E. R. (2011). Quantification of black carbon in marine systems using the benzene polycarboxylic acid method: a mechanistic and yield study. Limnol. Oceanogr. Methods 9, 140–140. doi: 10.4319/lom.2011.9.140
Keywords: carbon cycle, arctic, black carbon, colored dissolved organic matter (CDOM), climate change, rivers, hydrology
Citation: Stubbins A, Spencer RGM, Mann PJ, Holmes RM, McClelland JW, Niggemann J and Dittmar T (2015) Utilizing colored dissolved organic matter to derive dissolved black carbon export by arctic rivers. Front. Earth Sci. 3:63. doi: 10.3389/feart.2015.00063
Received: 02 September 2015; Accepted: 06 October 2015;
Published: 26 October 2015.
Edited by:
Christopher Osburn, North Carolina State University, USAReviewed by:
Mukesh Gupta, Environment Canada, CanadaX. Antón Álvarez-Salgado, Consejo Superior de Investigaciones Científicas, Spain
Copyright © 2015 Stubbins, Spencer, Mann, Holmes, McClelland, Niggemann and Dittmar. This is an open-access article distributed under the terms of the Creative Commons Attribution License (CC BY). The use, distribution or reproduction in other forums is permitted, provided the original author(s) or licensor are credited and that the original publication in this journal is cited, in accordance with accepted academic practice. No use, distribution or reproduction is permitted which does not comply with these terms.
*Correspondence: Aron Stubbins, YXJvbi5zdHViYmluc0Bza2lvLnVnYS5lZHU=