 Peter J. Hernes
 Robert G. M. Spencer
 Rachael Y. Dyda
 Anthony T. O'Geen1
 Randy A. Dahlgren
- 1Department of Land, Air and Water Resources, University of California, Davis, Davis, CA, USA
- 2Department of Earth, Ocean and Atmospheric Science, Florida State University, Tallahassee, FL, USA
Evaluating the collective impact of small source inputs to larger rivers is a constant challenge in riverine biogeochemistry. In this study, we investigated the generation of dissolved organic matter (DOM) in a small oak woodland catchment in the foothills of northern California, the subsequent transformation in lignin biomarkers and chromophoric DOM (CDOM) parameters during transport through the landscape to an exporting stream, and finally the overall compositional impact on the larger receiving stream and river. Our study included a natural leaching experiment in which precipitation passing through oak, pine, and grass litter and duff samples was collected after each of a series of storms. Also included were soil trench samples to capture subsurface lateral flow, stream samples along with point-source reservoir inputs, and samples of canopy throughfall, stemflow, and gopher hole (bypass) flow. The litter/duff leaching study demonstrated changing DOM fractionation patterns throughout the season, as evidenced by changing lignin compositions in the leachates with each successive storm. This adds a necessary seasonal component to interpreting lignin compositions in streams, as the source signatures are constantly changing. Released DOM from leaching was modified extensively during transit through the subsurface to the stream, with preferential increases in aromaticity as evidenced by increases in carbon-normalized absorbance at 254 nm, yet preferential decreases in lignin phenols, as evidence by carbon-normalized lignin yields in the headwater stream that was less than half that of the litter/duff leachates. Our extensive number of lignin measurements for source materials reveals a much more complex perspective on using lignin as a source indicator, as many riverine values for syringyl:vanillyl and cinnamyl:vanillyl ratios that have previously been interpreted as degraded lignin signatures are also possible as unmodified source signatures. Finally, this study demonstrated that the impact of numerous small headwater streams can significantly overprint the DOM signatures of much larger rivers over relatively short distances spanning several to tens of kilometers. This finding in particular challenges the assumption that river studies can be adequately conducted by focusing only on the main tributaries.
Introduction
The allure of pipe flow models for DOM in large rivers is unmistakable: large loads and rapid transit would seem to preclude the opportunity for any significant change. Over the past decade, this model has largely been debunked in terms of DOM processing and degradation, as we now know that considerable DOM transformation and remineralization occurs in situ, thereby enhancing the CO2 outgassing signal from these rivers (Richey et al., 2002; Bouillon et al., 2012). However, the idea of pipe flow or unchanging large loads still persists in terms of tributary allochthonous sources to large rivers. It seems impossible, for example, to consider that streams with discharge <5% of the mainstem can significantly alter the mainstem DOM quality and quantity. Yet riverine chemistry represents an integrated signature of all upstream sources and processes within the catchment/basin, and even those small inputs must be incorporated into models of how riverine chemistry evolves.
Although rivers are grand integrators, it is clear that not all sources and processes are equally represented. Rather, some element of hydrologic connectivity must be incorporated into models of riverine chemistry, such that a soil or vegetation perched on top of a hill is much less connected than a soil or vegetation in the riparian zone. For example, the distinct lignin signature of conifer forests in the headwaters of the Sacramento River basin is overwhelmed by the lignin signature of wetlands and agricultural islands in the Sacramento/San Joaquin River Delta upon passage through the latter (Eckard et al., 2007). However, in terms of discharge, water movement, and land area, this is not a surprising finding as tidal pumping in the Delta essentially throws riverine discharge into reverse during the transition from low tide to high tide, and the land area of the Delta approaches 3000 km2. In contrast, what happens to DOM dynamics in a non-tidally influenced system with stream inputs that are so small as to be considered insignificant sources?
Evaluating sources and processing of DOM in rivers requires a multitude of experimental, analytical, and sampling approaches, as well as attention to hydrologic flowpaths. Biomarkers such as lignin offer the specificity to trace DOM derived from angiosperm vs. gymnosperms, and woody vs. non-woody tissues (Hedges and Mann, 1979; Spencer et al., 2016). Optical parameters derived from UV-visible absorbance can trace the bulk properties of chromophoric DOM (CDOM) such as aromaticity, microbial vs. terrigenous sources, and high- vs. low-molecular weight properties (Traina et al., 1990; Helms et al., 2008; Spencer et al., 2013). Leaching experiments generate a posteriori sources of DOM that can be traced through the study region and evaluated for processing effects (Aufdenkampe et al., 2001; Hernes et al., 2007; Spencer et al., 2008). And of course, demarcating and sampling representative hydrologic flowpaths can be instrumental in determining how the bulk of DOM enters headwater streams, which in turn helps to understand which processes and depths within the soil column are most influential in transforming the initial leachate compositions (Sanderman et al., 2009; Swarowsky et al., 2012).
In this study, we took the approach of characterizing sources, transport, and processing of DOM within an oak woodland landscape from the nanoscale to tens of kilometers with the goal of quantifying the ways in which headwater catchment processes can influence the DOM chemistry of a large river. Because DOM export in the Mediterranean climate of the Sierra Nevada foothills is dominated by storm events, our leaching experiment and sampling strategy revolved around a time series approach during the rainy portion of the water year in January through April. Our suite of analyses included molecular lignin analyses as a biomarker for vascular plant sources and diagenetic change, optical parameters that capture the aromatic component of DOM, and bulk carbon analyses. We collected samples from a perched water monitoring system (trench) that was constructed to intercept hydrologic flowpaths at different depths within the soil profile, from samples of opportunity such as flow from gopher holes and stem/canopy flow, and from streams, reservoirs, and the Yuba River to which all DOM in our study region eventually flows. The central premise of our study was that the cumulative effects of small streams can have a quantitative and traceable impact on the DOM chemistry of a large river.
Materials and Methods
Site Description
The litter/duff leaching experiment was conducted in the northern Sierra Nevada foothills at the University of California Sierra Foothill Research and Extension Center (SFREC), approximately 80 km north of Sacramento, CA (Figure 1). Additional water sampling occurred in and around SFREC (Figure 1), which experiences a Mediterranean climate with cool, moist winters and hot, dry summers. Elevation at the site ranges from 250 to 450 m. The mean annual air temperature is 15°C (January mean of 8.4°C, July mean of 25.9°C). Annual precipitation is 734 mm (307—1235 mm during the past 20 years) and falls exclusively as rainfall, primarily between November and March (Lewis et al., 2006). The dominant ecosystem at the site is oak woodland, which regionally constitutes a mixture of winter-deciduous blue oak (Quercus douglasii H.&A.; ~45% coverage), an evergreen interior live oak (Quercus wislizenii A. DC.; ~5% coverage), foothill pine (Pinus sabiniana Dougl.; ~5% coverage), and mixed annual grasses (~45% coverage, common species include soft chess [Bromus hordeaceus], ripgut brome [Bromus diandrus], red brome [Bromus madritensis spp. rubens], annual fescue [Vulpia sp.], wild oats [Avena fatua and Avena barbata], and medusahead [Taeniantherum caput-medusae]) (Chow et al., 2009; O'Geen et al., 2010).
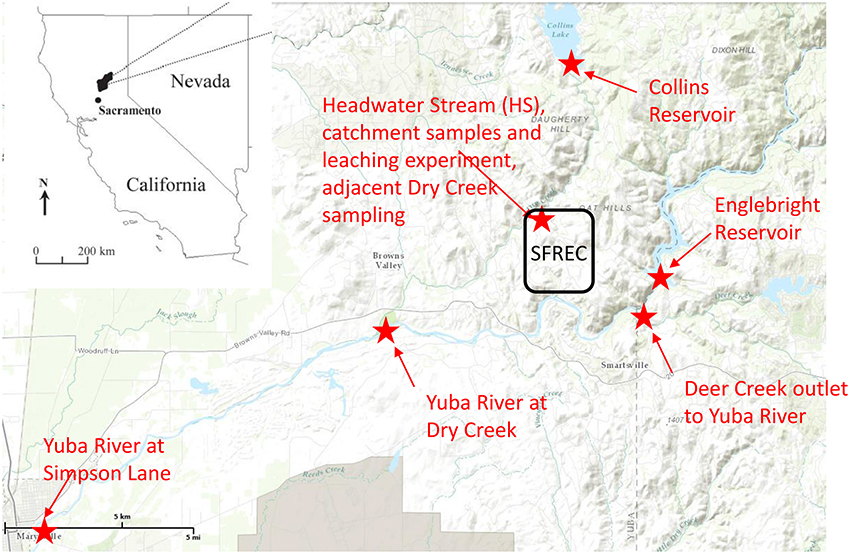
Figure 1. Regional map of sampling site, placed in the context of the state of California. The Sierra Foothills Research and Extension Center (SFREC) is located within the black rectangle, and all locations in which samples were collected or experiments conducted are indicated in red, along with the confluence of Deer Creek into the Yuba River, which is labeled for context.
Field Incubation and Measurements
Storm-associated leachates (eleven events) were collected during a 182-day field incubation (December 1, 2006 through May 31, 2007 comprising the entire rainy season) using fresh litterfall (equivalent to Oi horizon in soil taxonomy) and associated duff (i.e., litter decomposed at the soil surface over 2–4 years, or Oe/Oa horizons) for the four dominant vegetation components (Chow et al., 2009). Litter materials were collected during the first week of November, 2006 prior to any major rainfall events, and triplicate incubations were initiated in polyethylene trays (54 × 43 × 13 cm) using 200–300 g dry weight equivalent of most materials, but ~900 g for grass duff and ~500 g for foothill pine duff. Trays were covered with 0.1 cm mesh stainless steel screen to minimize particulate loss or inputs, then slightly tilted to allow rapid drainage. The trays were suspended one meter above the ground with polyethylene tubes connected to 50-L high density polyethylene (HDPE) carboys (Supplementary Figure 1A). Leachate volumes were measured from each tray the day following each rainfall event and one-liter subsamples (HDPE bottles) were collected for analyses after vigorous mixing. Carboys were emptied and rinsed after each collection. The mass of leachate DOC yielded from each tray for each rainstorm was calculated from the volume of leachate collected times the measured DOC concentration, and this was normalized by the original mass of material according to each tray (i.e., leached C per mass litter in units of mg g−1). Remaining mass of material in each tray was measured at the end of the experiment. More details about the experiment and bulk measurements can be found in Chow et al. (2009). Although the experiment was conducted in triplicate, in most cases only a single lignin analysis was conducted due to time and expense. Those that were analyzed in duplicate or triplicate are reported in Supplementary Table 1.
While there are likely “bottle effects” in conducting a leaching/incubation experiment in this manner (e.g., differences in microbial activity, light conditions, and wetness compared to litters and duffs in contact with the natural soil), containing the materials in trays was necessary to maintain reasonable controls on the experiment. Although the experiment may not be a perfect proxy for natural leaching and degradation, the results are still informative as to overall dynamics.
Flowpath Continuum Sampling
In addition to the litter/duff leachates, a longitudinal continuum of samples was collected in order to evaluate the evolution of the primary DOM leachate signal along the hydrologic flowpath (Figure 1, Supplementary Figure 2). Sampling began in an ungrazed 36 ha catchment that contains an ephemeral stream, hereafter abbreviated as HS for “headwater stream,” and is equipped with a perched water collection system (trench) to monitor and collect subsurface water flowing out of several distinct soil horizons, with collection trays inserted at the bottom of each of these horizons within the trench (Supplementary Figure 1B). Sampling depths included 0–10, 10–30, 30–60, and 60–100 cm, although we did not include any samples from the 60–100 cm depth in our analyses as flow was smaller and more sporadic in this layer than the other three. More details about the perched water sampling system can be gleaned from O'Geen et al. (2010). For this study, stream and trench samples were collected during two different rain events in mid-February 2007 and late January 2008, and the stream alone was sampled in late February 2007. Also included in the January 2008 rain event were stemflow and canopy throughfall for the three tree species as well as gopher hole samples in which water was rapidly flowing out of the gopher holes during peak flow. The latter represent bypass flow as water flowing through gopher holes does not have the typical contact time with soils. The overall sampling within the HS catchment aimed at capturing prominent hydrologic flowpaths depicted in Supplementary Figure 2. The larger synoptic study linkages are depicted in Figure 1. Briefly, the Collins reservoir discharges into Dry Creek, for which HS is a representative tributary, and Dry Creek flows into the Yuba River. Englebright reservoir is on the Yuba River and its outflow was sampled along with downstream water from the Yuba River above the confluence with Dry Creek and again near Marysville, CA at Simpson Lane, ~20 km downstream of the Dry Creek confluence. Both reservoirs, Dry Creek, and the Yuba River were sampled in conjunction with the late January 2008 storm event.
DOC and C-specific UV Absorbance (SUVA254) Analyses
Leachates were pre-filtered through glass fiber filters (Whatman GF/F) and all leachates and water samples passed through a 0.2 μm polycarbonate membrane filters (Millipore), prior to DOC and UV-visible analyses. All samples were filtered within 24 h and analyzed within 72 h. DOC concentrations were measured on acidified samples (pH ~ 2) using a Dohrmann UV-enhanced persulfate TOC analyzer (Phoenix 8000; MDL = 0.1 mg L−1). UV absorbance at 254 nm was measured on a Helios Gamma UV/VIS Spectrophotometer (Thermo Fisher Scientific, Inc.). C-specific UV absorbance at 254 nm (SUVA254) was determined by normalizing UV absorbance at 254 nm with DOC concentration and is reported in the units of liter per milligram carbon per meter (L mg C−1 m−1).
Lignin Analyses
All dissolved lignin samples were filtered through a 0.2 μm membrane filter (Millipore polycarbonate) then frozen. Prior to cupric oxide (CuO) oxidation for lignin measurements, water was thawed (20 mL for leachates, 100–500 mL for water samples), acidified to pH 2 to minimize precipitation, then rotary evaporated to ~3 mL. The concentrate was transferred to Monel reaction vessels (Prime Focus, Inc.) and dried under vacuum centrifugation. Weighed and ground litter and duff materials (10–80 mg) both pre- and post-experiment were transferred directly into the reaction vessels. Lignin analyses were carried out by CuO oxidation following a modified version as outlined by Hedges and Ertel (1982), Spencer et al. (2010a) and Hernes et al. (2013b). Following oxidation in 8% NaOH in the presence of excess CuO at 155°C for 3 h, samples were acidified and extracted three times with ethyl acetate, with the latter fraction evaporated under a gentle stream of ultrapure nitrogen. Samples were then stored frozen until analysis. Lignin phenols were trimethylsilyl derivatized using bis-trimethylsilyltrifluoromethylacetamide (BSTFA); separation of phenols was achieved using an Agilent 6890 gas chromatograph fitted with a DB5-MS capillary column (30 m, 0.25 mm inner diameter, J&W Scientific) and attached to an Agilent 5973 mass selective detector. Quantification was achieved using selected ion monitoring with cinnamic acid as an internal standard following the five-point calibration scheme of Hernes and Benner (2002). All samples were blank-corrected due to the presence of trace amounts of contamination in the NaOH reagent. At least one blank was run for every 10 sample oxidations performed. Blank concentrations of lignin phenols were low (40–55 ng) for the eight lignin phenols measured in this study (three vanillyl phenols: vanillin, acetovanillone, vanillic acid; three syringyl phenols: syringaldehyde, acetosyringone, syringic acid; and two cinnamyl phenols: p-coumaric acid, ferulic acid). Total blanks for these eight compounds never exceeded 5% of the sample yields (average 1.3%).
Lignin Mixing Model Calculations
Calculations of lignin overprinting were conducted using linear mixing models of lignin parameters. Depending on the question (i.e., is the goal to determine volumes of water mixed, or amounts of DOC mixed, or amounts of lignin mixed?), this is not strictly correct for ratios, which may not mix linearly over their entire range. In our case, we are primarily asking the question about how much lignin comes from each source, and with similar weighting (i.e., concentrations), linear mixing is a reasonable approximation. This exercise is not presented as a quantitatively precise calculation of mixing, but rather to demonstrate the potential for overprinting to exert significant controls on river DOC compositions. In light of this, the simplest approach that makes the point was chosen. Accurately modeling mixing of ratios necessitates an iterative approach that involves its own uncertainties related to assumptions about weighting, but ultimately leads to greater calculated proportions for the endmember with the most weight. In our case, we are interested in how much the HS stream as a representative endmember overprints larger creeks/rivers, and because lignin concentrations are higher in the composite HS sample than receiving waters, calculating mixed ratios more accurately (i.e., linear mixing of terms in the numerator separately from those in the denominator, and then calculating the ratio) would lead to higher calculated HS proportions than linear mixing of the entire ratio, hence our approach is conservative as to the question of overprinting.
Linear mixing models are typically used when a sample value is bracketed by two endmembers believed to be the primary sources for that sample. If the sample value is equidistant from either endmember value, then the sample is a 50% mixture of each endmember. Determining the percentage of either endmember is possible by calculating the relative offset between the sample value and an endmember and dividing this by the total difference between the two endmembers. For example, if Endmember A has a value of 0.9, Endmember B has a value of 1.0, and the sample value is 0.93, intuitively we know that there is a higher percentage of Endmember A represented in that sample than Endmember B because the sample value is closer to Endmember A. A linear mixing model calculates the percentage of Endmember A as follows: |Endmember B – Sample|*100%/|Endmember A – Endmember B|, or in this example, |1.0 – 9.3|*100%/|0.9 – 1.0| = 70% Endmember A. Calculated values >100% are possible if the endmembers do not bracket the sample, which is less helpful for attributing sources, but can still provide context for the magnitude of compositional change that occurs.
Results
Due to the large volume of data from this study, much of the data in figures consists of averages and does not capture the full range of values. However, many of these ranges are described below and the comprehensive dataset is available in Table 1 and Supplementary Tables 1, 2. Weighted averages presented for leachates in Table 2 were computed only across a single tray/replicate, even when replicate samples were analyzed occasionally from other trays. Because there was variation in mass loss between replicate trays in any given storm, incorporating those replications in weighted averages would have been unnecessarily complicated with minimal added value.
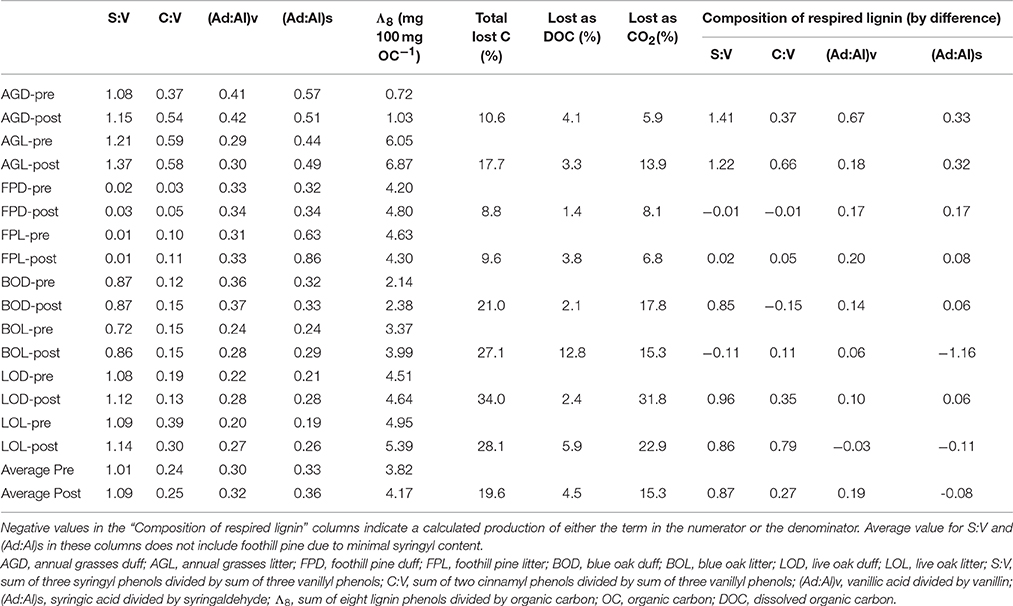
Table 1. Pairwise comparisons of lignin parameters for litter/duff materials pre- and post-experiment.
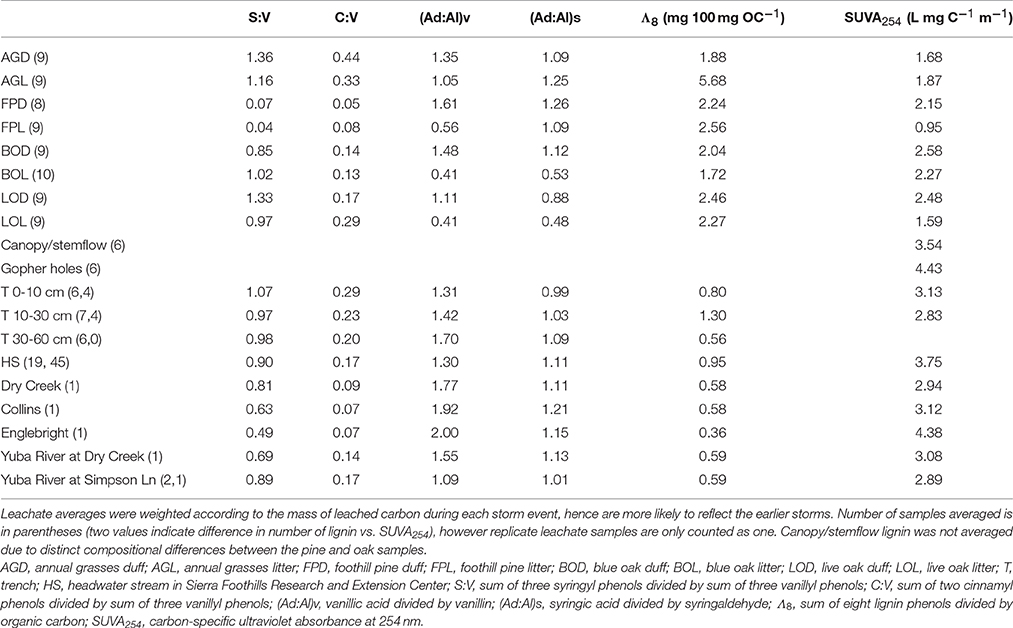
Table 2. Average lignin parameters and SUVA254 values for oak woodland leachates, trench samples, and stream in comparison to snapshot parameters for down and upstream sources of water/DOM.
Carbon loss from the leachate experiment has previously been reported by Chow et al. (2009). Briefly, total carbon lost, as determined by difference between pre- and post-litter/duff C mass, ranged from 8.8 to 34% (Table 1). The total lost as leached DOC (volume of leachate collected multiplied by DOC concentration) ranged from 1.4 to 12.8%, and after accounting for a small amount lost as particulate organic carbon in the leachates, the remainder by difference was attributed to remineralized organic carbon (OC) lost as carbon dioxide (CO2), which ranged from 5.9 to 31.8% (Table 1; Chow et al., 2009).
Lignin concentrations in litter/duff leachates were highly variable, varying by nearly an order of magnitude from 0.15 to 12.1 mg L−1 (Supplementary Table 1). These values were one to three orders of magnitude larger than typical riverine values (Spencer et al., 2008; Hernes et al., 2013b; Mann et al., 2014). On average, lignin concentrations were 2- to 3-fold higher in the litter-derived leachates compared to duff-derived leachates. In general, there was some evidence of a “first flush” in the two December storm events, as lignin concentrations in all litter leachates were 2- to 4-fold higher in averaged December samples than the average over the remainder of the sampling period (Supplementary Table 1). Annual grass duff lignin was approximately 2-fold higher in December, while the other three duffs were similar across the sampling period.
Across the 15 month sampling period, HS DOC concentrations ranged from 2.2 to 17.2 mg L−1, with all values >10 associated with a single storm on 1/4/2008 which was not part of the leaching experiment (Supplementary Table 2). During the snapshot synoptic sampling, DOC for the Collins reservoir sample was 2.9 mg L−1, Englebright reservoir was 1.6 mg L−1, Dry Creek was 4.8 mg L−1, Yuba River near Dry Creek was 2.0 mg L−1, and Yuba River at Simpson Lane was 2.4 mg L−1 (Supplementary Table 1). Calculations involving DOC utilized at least two decimal points and tabulated DOC is reported at two decimal points, however one decimal point is more representative of the accuracy and therefore the convention adopted for the text.
Lignin concentrations in the trench and HS samples were up to three orders of magnitude smaller than in the leachates (Supplementary Table 1: note units of mg L−1 for leachates vs. μg L−1 for everything else), ranging from 4.4 to 84.5 μg L−1. HS lignin concentrations on average were significantly higher than trench samples (41.2 vs. 20.6 μg L−1), suggesting that lignin in the streams does not solely come from subsurface sources. Lignin concentrations in the Collins reservoir was 16.7 μg L−1 and increased into Dry Creek at 27.6 μg L−1, while the Englebright-to-Yuba River transition also resulted in increased lignin concentrations, from 5.6 μg L−1 in the former to 11.9 μg L−1 at the Dry Creek confluence to 13.9 μg L−1 at Simpson Lane (Supplementary Table 1).
In contrast to lignin concentrations, carbon-normalized yields of lignin were less variable between duff and litter leachates, with the exception of annual grasses, which averaged 5.68 mg 100 mg OC−1 in the litters compared to 2.16 mg 100 mg OC−1 in the duffs (Table 2). Average weighted carbon-normalized yields in the other six sample types ranged from 1.72 to 2.56 mg 100 mg OC−1. These values are consistent with previous studies involving plant leachates (Hernes et al., 2007, 2013a; Pellerin et al., 2010). Carbon-normalized yields in the litters and duffs prior to leaching ranged from 0.72 mg 100 mg OC−1 in the annual grass duff to 6.05 mg 100 mg OC−1 in the annual grass litter, and averaged 3.82 mg 100 mg OC−1, while post-leaching values were 1.03–6.87 mg 100 mg OC−1 with an average of 4.17 mg 100 mg OC−1, indicating preferential leaching/degradation of non-lignin plant constituents (Table 1).
Carbon-normalized lignin yields in the trench and HS samples were consistently lower than that of the leachates, ranging from 0.12 mg 100 mg OC−1 (a trench sample) to 3.06 mg 100 mg OC−1 (a HS sample) with a combined average of 0.93 mg 100 mg OC−1. Carbon-normalized yields in the Collins-to-Dry Creek system were essentially identical at 0.58 mg 100 mg OC−1, while experiencing an increase from 0.35 mg 100 mg OC−1 to 0.59 mg 100 mg OC−1 in the Englebright-to-Yuba River system (Table 2).
Diagnostic lignin ratios include source indicators, S:V (indicator of angiosperms, or deciduous plants) and C:V (indicator of non-woody tissue), and diagenetic acid:aldehyde ratios for both vanillyl and syringyl phenols. The lowest dissolved S:V ratios were in the two reservoirs, at 0.63 for Collins (with Dry Creek at 0.81) and 0.49 for Englebright (with Yuba River at 0.69 and 0.89) (Table 2). HS and trench samples ranged from 0.51 to 1.17, while angiosperm (i.e., the oaks and grasses) leachates were somewhat higher at 0.75–1.62 (Supplementary Table 1). Angiosperm litters and duffs ranged from 0.72 to 1.21 prior to leaching and 0.86 to 1.37 post-leaching. Trends in S:V were largely mirrored in C:V, with the lowest surface water dissolved values (0.07) in the two reservoirs (stemflow and canopy throughfall values were comparable or lower) and increasing into Dry Creek (0.09) and Yuba River (0.14 and 0.17). C:V in HS and trench samples ranged from 0.09 to 0.48, with an average of 0.21, while leachates ranged from 0.04 to 0.34 and on average was higher in the litter leachate than the duff leachate for all four plant types. Litter and duff C:V ranged from 0.03 to 0.59 prior to leaching and 0.05 to 0.58 post-leaching (Table 1).
Average dissolved vanillyl acid:aldehyde ratios, (Ad:Al)v, were lowest in the litter leachates (0.41–1.05), and generally higher in all other sample types (1.09–2.00) (Table 2). Litter and duff (Ad:Al)v ranged from 0.20 to 0.41 prior to leaching and 0.27 to 0.42 post-leaching (Table 1). Average dissolved syringic acid:aldehyde ratios, (Ad:Al)s, were less distinguishable between litters and duffs, ranging from 0.48 to 1.26, while all other samples varied from 0.99 to 1.21 (Table 2). Angiosperm litter and duff (Ad:Al)s ranged from 0.19 to 0.57 prior to leaching and 0.26 to 0.51 post-leaching (Table 1).
Absorbance of UV-visible light by CDOM can offer complementary information to lignin, as unsaturated compounds such as lignin polyphenols are largely responsible for absorbance patterns (Traina et al., 1990; Blough et al., 1993; Fooken and Liebezeit, 2000). In particular, carbon-specific UV absorbance (SUVA) exhibits strong correlations to aromaticity in DOM (Traina et al., 1990). In this study, SUVA254 in any single leachate sample ranged from 0.45 L mg C−1 m−1 in the foothill pine litter leachate to 4.47 L mg C−1 m−1 in the blue oak litter leachate (Supplementary Table 1), corresponding to an approximation from past studies of <10% aromaticity to >30% aromaticity, respectively (Weishaar et al., 2003). Blue oak duff leachate on average had the highest SUVA254 value at 2.58 L mg C−1 m−1 while foothill pine litter leachate was the lowest with an average SUVA254 of 0.95 L mg C−1 m−1 (Table 2). The litter leachate SUVA254 values (1.64 L mg C−1 m−1) were on average ~25% lower than the duff leachates (2.22 L mg C−1 m−1). Across the continuum, SUVA254 values were highest in the gopher hole water flows (4.43 L mg C−1 m−1 on average), lower in the stem flow and canopy throughfall samples (3.54 L mg C−1 m−1 on average) and HS samples (3.75 L mg C−1 m−1), still lower in the 0–10 and 10–30 cm trench samples (3.13 and 2.83 L mg C−1 m−1, respectively), and then exhibited a range of values in the reservoir, Yuba River, and Dry Creek samples (2.89–4.38 L mg C−1 m−1) (Table 2 and Supplementary Tables 1, 2). For comparison, 21 site-averaged SUVA254 values measured throughout the Sacramento River basin in 2002-3 ranged from 2.56 to 3.72 L mg C−1 m−1, including an average value of 2.93 L mg C−1 m−1 at Yuba River at Simpson Lane (Chow et al., 2007).
Discussion
Lignin Relativity As Demonstrated by Fractionation Effects in Leachates
Characterizing fractionation effects in lignin biomarkers has significantly improved interpretation of DOM and lignin parameters in various environments, explaining apparent degradation trends that previously were conundrums (Hernes et al., 2007, 2013a; Spencer et al., 2008, 2016). Lignin fractionation studies to date have primarily consisted of snapshot measurements, in which dissolved and particulate lignin is allowed to reach equilibrium, then a single measurement of each is compared to assess the magnitude of fractionation (Hernes et al., 2007, 2013a). Our system was much more dynamic, with repeated leaching with every rainstorm. We observed changing trends in fractionation across the season in 12 out of 24 plant material/diagnostic lignin parameter combinations (p < 0.1, Figures 2, 3). Acid to aldehyde ratios, (Ad:Al)v, increased in five of the eight plant material leachates, S:V increased in live oak and foothill pine litter leachates and decreased in blue oak and annual grasses duff leachates, and C:V decreased in all the duff leachates except foothill pine duff. These seasonal changes add considerable complexity to interpretations of streamwater lignin measurements, but more broadly highlight the need for seasonal measurements of rivers and streams themselves—as well as source materials for DOM—as snapshots are simply inadequate for capturing all the dynamics of integrated river basin biogeochemistry.
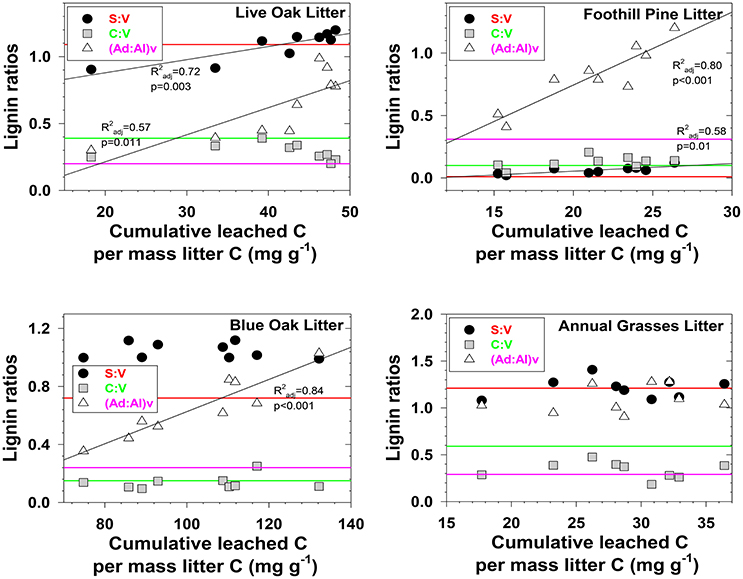
Figure 2. Evolving lignin compositions in litter leachates with each successive storm, plotted against total cumulative leached carbon on a mass-normalized basis. Horizontal reference lines correspond to the starting lignin compositions of the original litters and are color matched to the lignin parameter in the legend.
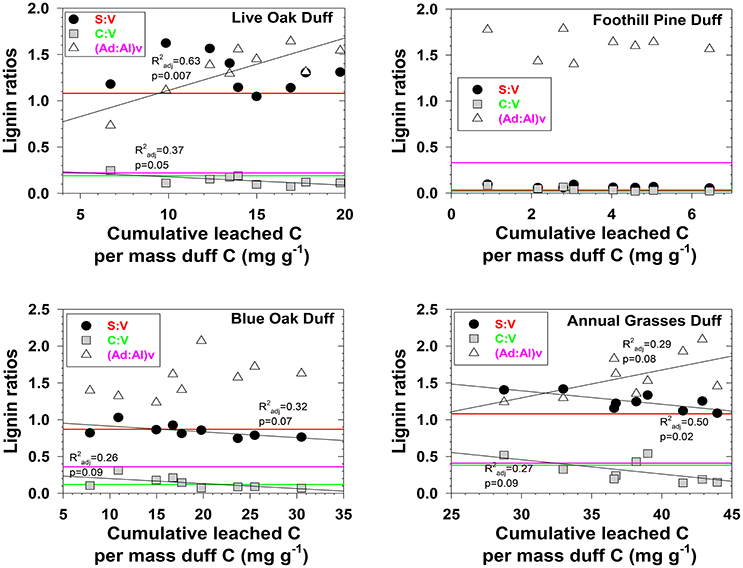
Figure 3. Evolving lignin compositions in duff leachates with each successive storm, plotted against total cumulative leached carbon on a mass-normalized basis. Horizontal reference lines correspond to the starting lignin compositions of the original duffs and are color matched to the lignin parameter in the legend.
Three different mechanisms separately or in combination could be responsible for the changing trends in leachates that we observed: (1) in the absence of significant degradation, the changing trends could simply represent a continuum of solubilities, with the early season ratios representing more soluble lignin and the late season ratios representing less soluble lignin, (2) in the absence of significant solubility differences in the initial litter/duff materials, the changing trends could be due to degradation of litter/duff lignin, which typically results in elevated (Ad:Al)v ratios and decreased S:V and C:V ratios, and (3) if neither solubility nor degradation of lignin is a significant factor, then degradation of cellulose or other organic matter that binds with lignin and inhibits leaching could be slowly releasing lignin of changing compositions. Although none of the mechanisms can be ruled out with certainty, there are some clues as to the overall reactivity of each material. For example, foothill pine litter, annual grasses duff, and foothill pine duff lost <10% of their initial mass due to mineralization of OC to CO2, which would appear to favor a solubility control over a degradation control. On the other hand, live oak duff and live oak litter lost 23 and 32%, respectively, of OC to CO2, which could favor a degradation control over solubility. Perhaps not surprisingly, four out of six lignin parameters for the two live oak materials were linearly correlated to OC loss, with the remaining two parameters showing more complex change (Figures 2, 3). Blue oak litter lost 27% of its carbon over the course of the experiment, with roughly equal proportions to respiration and to DOC leaching (Table 1), and the linear relationship between (Ad:Al)v and leached carbon was the strongest of all correlations (Figure 2), perhaps a reflection of synergistic effects between leaching and respiration. At the molecular level, (Ad:Al)v in duff leachates are consistently higher than in litter leachates (Figures 2, 3), which clearly indicates that degradation plays a role over the course of 2–4 years (i.e., the approximate age of the duffs), but it remains to be seen if degradation over a few months has the same impact.
Some uncertainty in interpreting fractionation effects on dissolved lignin can be mitigated by measuring particulate and dissolved lignin simultaneously, as it can be reasonably assumed that partitioning between DOM and POM in higher stream order systems is at equilibrium. For example, DOM- derived lignin measured in four rivers in Papau New Guinea demonstrated higher C:V, S:V, and (Ad:Al)v than in POM in 11 of 12 pairings by up to an order of magnitude (Burns et al., 2008), whereas in the Amazon River basin, ultrafiltered DOM C:V and S:V values were consistently lower than fine or coarse POM while (Ad:Al)v values were two to three times higher (Hedges et al., 2000). Our leachate study indicates that both plant sources and timing must be considered when interpreting the direction and magnitude of fractionated lignin measurements in riverine DOM and POM. However, we hypothesize that DOC:POC ratios will exert some level of control on whether the nature of partitioning in rivers is net sorption to or desorption from POM. Ultimately, interpreting DOM lignin data in absolute terms is simply not possible: lignin parameters are a relative accounting system and there must be points of comparison either internally across gradients or externally with particulate sources of dissolved lignin.
Leaching and Degradation
In all systems, mass balance must apply: the total amount of any individual lignin phenol in the initial parent materials must be accounted for in either the residual parent material, the cumulative leachate produced, the cumulate particulate material produced, remineralization to CO2, and chemical transformation to other compounds, which could include other lignin phenols (i.e., conversion from aldehyde precursors to acid precursors). The latter two processes are challenging to determine experimentally/analytically and generally must be inferred. Carbon-normalized yields of lignin (Λ8, mg lignin per 100 mg OC) increased in the residual material compared to the starting materials in seven out of the eight treatments (Table 1), indicating that lignin was more resistant to leaching and degradation than bulk carbon.
Composition of lignin remineralized to CO2 can be approximated by difference using mass balance, in which carbon-normalized lignin yields can be used to calculate the mass of each lignin phenol in the pre-litter/duff materials, and then the mass from the post-litter/duff materials along with leached DOC lignin are subtracted to get respired lignin. Although our experimental design was not optimized for this analysis, the general trend indicates that remineralized lignin was slightly depleted in syringyl phenols, enriched in cinnamyl phenols, and depleted in vanillic and syringic acid relative to litter/duff materials (Table 1). However, the latter trend could also be explained by the conversion of aldehyde precursors to acid precursors (i.e., production of acid precursors in the remaining litter/duff materials would lead to smaller amount-by-difference calculations), as is commonly thought to occur during degradation of lignin.
It is now well-documented that the process of leaching releases dissolved lignin with a different composition than the original plant material (Hernes et al., 2007, 2013a; Spencer et al., 2008). The magnitude of the fractionation can readily be seen in this study by comparing the time-series leachate data in Figures 2, 3 to the solid colored lines that represent the initial litter/duff material. However, a plot of S:V vs. C:V, which can be used to distinguish angiosperm (deciduous) tissues from gymnosperm (conifer) tissues and woody tissues from non-woody tissues (Hedges and Mann, 1979), puts this fractionation into interpretive context. For example, grass litter and duff leachates span C:V ratios from 0.1 to 0.6, with the lower value traditionally interpreted as degraded plant material while the higher value is considered fresh (Figure 4). (In general, litter C:V do appear higher than duff values (Figure 4), lending credence to the idea that C:V is responsive to degradation, however this does not appear the case for annual grasses, while systematic differences between litter and duff leachate S:V values are ambiguous.) In the bigger picture, all of the foothill pine, blue oak, and live oak C:V ratios, including fresh litters, are below the ranges originally considered (Hedges and Mann, 1979) as either gymnosperm or angiosperm non-woody tissues (Figure 4). Similar to the lower end of the grasses C:V values, all of these samples would traditionally be defined as degraded. Hence it is clear that the range of values for S:V and C:V in plant materials themselves are broader than once thought, let alone the values of leachates, which places even more importance on adequately characterizing source materials to rivers and streams before attempting to interpret dissolved lignin values.
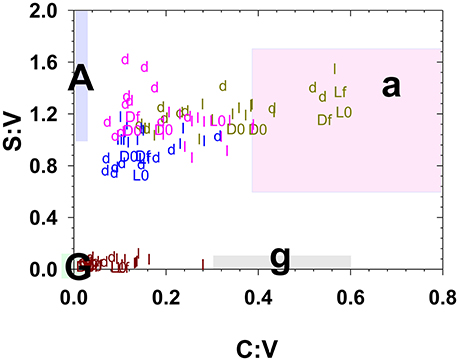
Figure 4. Litter and duff leachates along with the starting and ending litter/duff materials plotted in S:V vs. C:V space. Small letters “l” and “d” represent leachate values, while capital “L” and “D” represent litter/duff materials with an appended “0” for initial and an appended “f” for final. Brown symbols are derived from foothill pine, light green from annual grasses, pink from live oak, and blue from blue oak. The shaded regions represent traditionally defined regions for angiosperm woods (A), angiosperm non-woody tissues (a), gymnosperm woods (G), and gymnosperm non-woody tissues (g) (Hedges and Mann, 1979).
DOM Export to Streams
In California oak woodlands, most DOM export from catchments is driven by storm events that rapidly mobilize DOM from the adjacent landscape which in turn flows to streams via several dynamic hydrologic flowpaths (Swarowsky et al., 2012). Scaling our litter/duff leachate yields (mass DOC released per mass of litter/duff) to a total annual amount of litter and duff on the landscape of HS (field observations of litter and duff horizon depths multiplied times density and area) indicates a net production of approximately 450 kg ha−1 DOC (Chow et al., 2009). In contrast, calculated stream yields from HS and other similar streams at the research site indicate a DOC export of approximately 0.03 kg ha−1 DOC. Rapid microbial remineralization of plant leachates has previously been demonstrated (Cleveland et al., 2004; Pellerin et al., 2010). Our study shows that DOM produced on the landscape is nearly quantitatively retained or remineralized, and DOM that does flow into adjacent streams has the potential to be highly modified by biotic and abiotic processes.
Our study did not capture subsurface flow (i.e., trench samples) or stream dynamics for all storms across the leaching experiment, but were instead focused on two storm events in February 2007 and an additional sampling in January 2008 as part of an effort to capture a snapshot of DOM at multiple scales (stream orders) simultaneously. Hysteresis effects, in which DOC concentrations at a given discharge are significantly different between the rising and falling limbs of a storm, are well-known for streams and rivers (McGlynn and McDonnell, 2003), and similar variability extended to DOM composition as represented by lignin parameters (Figure 5). Short time-series sampling during the storm events revealed little in the way of consistent trends in how lignin parameters respond to DOM mobilization in HS (Figure 5), as S:V in any individual sampling event varied by up to 0.2, C:V by 0.1, (Ad:Al)v and (Ad:Al)s by 0.4, and Λ8 by >2.0.
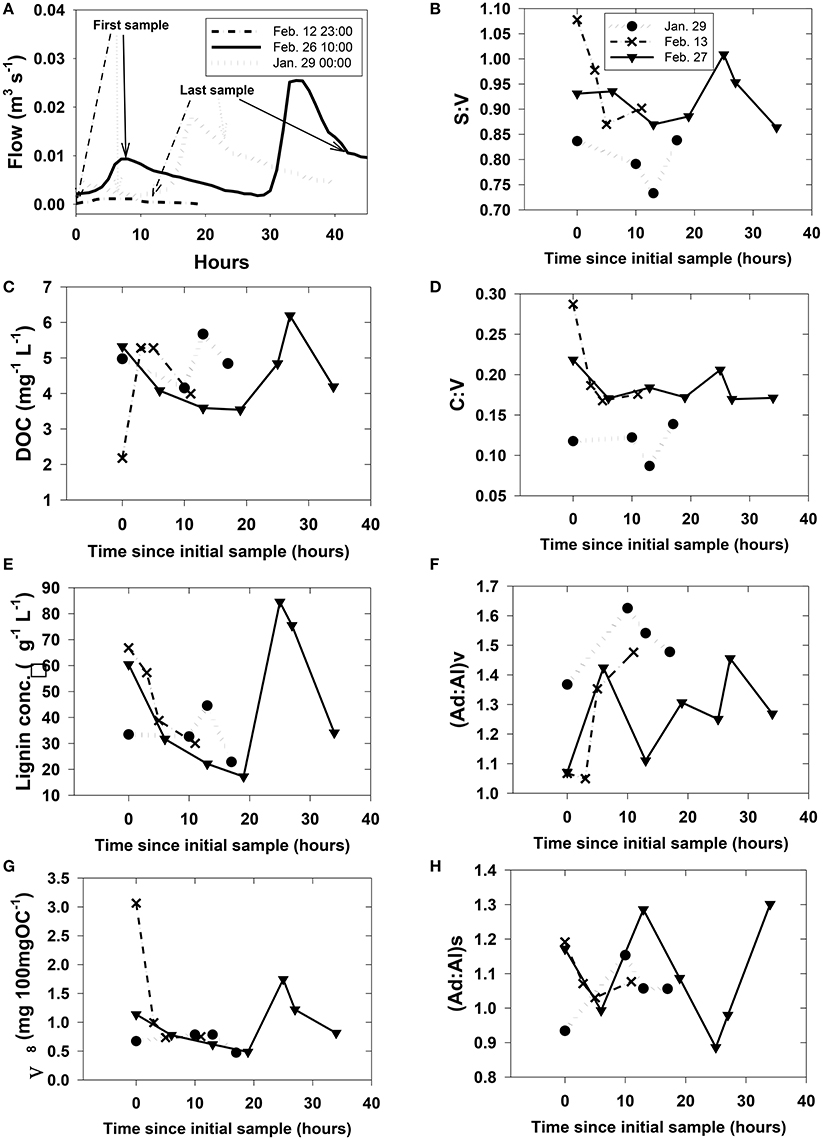
Figure 5. Rapidly changing streamwater (HS) chemistry during three storms. Plot (A) shows discharge with greater context for each of the storms. Plots (B)–(H) were arbitrarily plotted with the first sample at time = 0 since the onset of storm runoff is difficult to pinpoint and sampling at each storm was initiated during a different phase of the runoff. However, the first and last sampling points for plots (B)–(H) are identified on their respective hydrographs in (A).
A portion of compositional variability is likely due to first-flush phenomena, which can be delayed by the necessity of wetting up in Mediterranean climates (O'Geen et al., 2010), however, changing contributions from different hydrologic flowpaths also must play a role (Swarowsky et al., 2012). The soil trench samples that isolate water transport through different soil horizons can be potentially helpful in parsing out these differences. Our most complete set of trench samples was collected in conjunction with the January 2008 storm, and it is clear that in terms of lignin compositions, the 10–30 cm depth was the most volatile, with large changes in every lignin parameter during the storm, while the 0–10 and 30–60 cm depths were more stable (Figure 6). The 10–30 cm depth during this storm event accounted for over half of the total flow measured in the trench (Swarowsky et al., 2012). Based on DOC (and to some extent lignin concentrations) in HS stream water that was higher than the trench samples, it is clear that there must be additional sources of DOM to the stream. Overland flow is generally not observed in this system due to rapid infiltration. However, during the January 2008 storm, water gushed out of gopher holes in the catchment, indicating a potential role for horizontal bypass flow, and the six samples collected during this study yielded DOC values of 3.9–8.7 mg L−1, with a mean of 5.8 mg L−1, which could partially account for the higher HS DOC values. Alternatively, if our leachate samples are proxies for bypass flow, then the potential contributions for bypass vs. subsurface DOC sources to HS can be evaluated compositionally with lignin property:property plots. In terms of S:V vs. C:V, HS most resembles the 30–60 cm depth trench sample and the blue oak duff leachate sample (Figure 7A), while (Ad:Al)v vs. (Ad:Al)s favors the 0–10 and 10–30 cm depths, along with the annual grass duff and blue oak duff leachates (Figure 7B). Of the two, S:V vs. C:V is more conducive to identifying sources (Hedges and Mann, 1979), and since blue oak comprises ~45% of the vegetation in the catchment, it is not surprising that HS lignin would more closely resemble blue oak leachates. Yet the results of (Ad:Al)v vs. (Ad:Al)s actually seem to fit intuition, as the landscape is dominated by blue oak and annual grasses, and the 0–10 and 10–30 cm trench depths generate the most flow. This raises the possibility that in certain environments, acid:aldehyde ratios may have utility as a secondary source indicator, i.e., not useful for identifying the original plant materials, but becoming a “signature” of a water body. This has previously been postulated for water masses in marine environments where lignin diagenesis below the surface appears conservative on the timescale of centuries (Hernes and Benner, 2002). Given that annual grasses cover ~45% of the landscape, it is a bit surprising that they are not more representative of HS in S:V vs. C:V space. However, percent coverage is not the critical factor, but rather, the total amount of litter/duff that accumulates from each vegetation type. Blue oak and foothill pine accumulate >20 times the amount in litter/duff materials per unit area compared to annual grasses (Chow et al., 2009), hence blue oak is the dominant vegetative source in this landscape and even foothill pine at ~5% coverage has similar amounts of litter/duff materials compared to annual grasses.
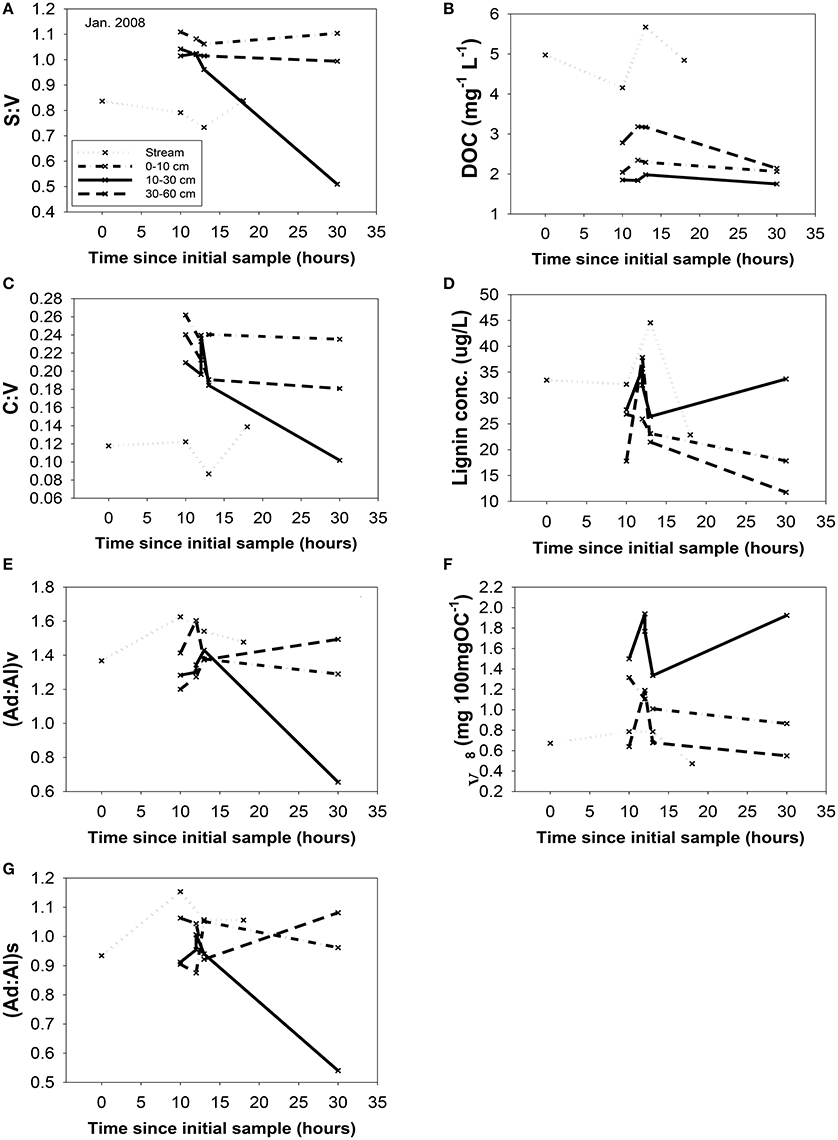
Figure 6. Changing chemistry in the trench samples during the January, 2008 storm, with the streamwater (HS) chemistry as a reference point. All parameters are plotted vs. time: (A) S:V, (B) DOC, (C) C:V, (D) lignin concentration, (E) (Ad:Al)v, (F) carbon-normalized yields, Λ8, and (G) (Ad:Al)s. Sampling time points are plotted relative to the first HS sample for that storm. All abbreviations were defined previously in the text.
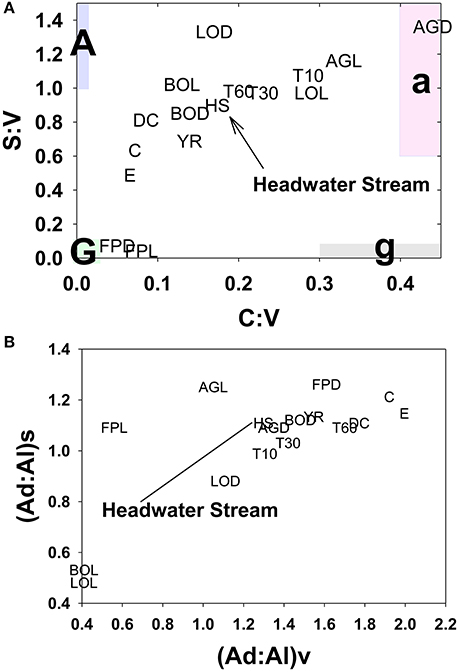
Figure 7. HS lignin composition relative to multiple potential source compositions for (A) S:V vs. C:V and (B) (Ad:Al)v vs. (Ad:Al)s. Leachate and stream abbreviations are previously defined in the text, this plot also includes the following: E, Englebright; C, Collins; Y, Yuba; DC, Dry Creek; T10, 0–10 cm trench horizon; T30, 10–30 cm trench horizon; T60, 30–60 cm trench horizon.
In some systems, lignin compositions can be used quantitatively to determine relative contributions from different sources of vascular plant DOM (Eckard et al., 2007), however in this system the compositions of all the potential contributors are too similar for this type of analysis. Carbon-normalized yields of lignin are another quantitative tool that can be used to differentiate between vascular plant sources and non-vascular plant sources such as microbes or algae. Values of Λ8 for HS averaged 0.95 mg lignin 100 mg OC−1, which is significantly lower than weighted averages for all leachates (Table 2), including a Λ8 value of 2.04 mg lignin 100 mg OC−1 for blue oak duff leachate, which appears to be the predominant source compositionally. This indicates that all leachate sources contain more than sufficient lignin to account for HS yields and that either lignin is preferentially lost relative to bulk carbon, or that HS DOM has been significantly augmented with algal/microbial sources. Again, the trench samples give an indication of where this modification may take place, as all trench Λ8 values are significantly lower than the leachates, but the 0–10 and 30–60 cm depths are even lower than HS. Microbial communities are known contributors to the soil organic matter pool, so lower trench Λ8 values could reflect dilution by non-vascular plant sources such as microbially-derived DOM. On the other hand, lignin phenols are also surface active and hence subject to sorption to soils (Kaiser et al., 1996; Hernes et al., 2007; Klotzbücher et al., 2016), which could preferentially remove lignin relative to bulk carbon. However, soils do not have infinite sites for lignin sorption, so over time the sorbed lignin would need to be degraded by microbes to free up those sites for the next storm event. Regardless of the mechanism for reducing Λ8 values between leachates and passage through various soil horizons, the Λ8 values of the three trench samples indicate that the 10–30 cm depth must constitute at least half the DOM in HS, if no other sources are considered, which is consistent with the fact that the 10–30 cm depth was the dominant hydrologic flowpath during the storm event (Swarowsky et al., 2012).
Optical properties do not have the specificity of biomarkers, but likely represent a larger proportion of the total DOM than any individual biomarker, and as such, can offer other clues as to the sources of DOM to streams. Carbon-normalized UV absorbance shows strong correlations to aromaticity (Traina et al., 1990), and in this study, HS SUVA254 values averaged 3.75 L mg C−1 m−1. In contrast, the weighted average SUVA254 value for blue oak duff leachate was the highest of all the leachates at 2.58 L mg C−1 m−1, yet still considerably lower than the stream values. Trench samples are closer in magnitude to HS streams, with lower SUVA254 values (average 2.98 L mg C−1 m−1) compared to streams indicating that DOC modification must occur in conjunction with other higher SUVA254 sources, such as gopher holes (SUVA254 values from 4.29 to 4.70 L mg C−1 m−1) or stem-flow and canopy throughfall (SUVA254 ranging from 3.04 to 3.83 L mg C−1 m−1). Overall, the SUVA254 values highlight a more complex picture of sources than perhaps lignin values alone. While blue oak is clearly an important contributor to stream DOM in this catchment, the optical properties of leachate DOM from blue oak duff still must undergo considerable modification before export to streams, including the preferential loss of non-aromatic carbon. This appears somewhat contradictory to the Λ8 analysis in which leachates are also likely modified by preferential loss of lignin, which is an aromatic carbon component. However, lignin is just one of many different classes of aromatic compounds in organic matter, and the more straightforward conclusion is that SUVA254 and lignin are tracing different components of DOM.
DOM Dynamics across a Continuum of Stream Orders
DOM chemistry at any given point in a river represents the sum of all sources and processes upstream. Those sources and processes are not weighted equally, as local landscape features tend to overprint more remote signatures (Eckard et al., 2007). In the regional system studied here, HS flows into Dry Creek, which in turn flows into the Yuba River. Dry Creek flows out of the Collins reservoir, so a stream like HS would act to overprint the Collins reservoir signature. Similarly, the Yuba River flows out of Englebright reservoir, and Dry Creek would act to overprint that signature. In reality, a complete picture of DOM dynamics would require continuous composition and concentration monitoring at all these sites over an extended time period, but our snapshot still provides insight into the evolution of DOM from catchments to higher order streams and rivers.
Among the many impacts of building dams, impounding river water in reservoirs can have a significant effect on both DOM quantity and quality (Oliver et al., 2016). Increased residence time allows for more input from algal sources and greater degradation of allochthonous DOM, the latter which is enhanced by sedimentation that increases optical transparency and allows photochemical degradation of aromatic-rich terrigenous DOM (Kraus et al., 2011). The dissolved lignin signatures of both the Collins and Englebright reservoirs appear consistent with these effects, as Λ8 values are low (0.58 and 0.36 mg lignin 100 mg OC−1, respectively), which can be achieved by both algal production and lignin degradation, and the (Ad:Al)v values are the highest measured in our dataset (1.92 and 2.00). SUVA254 values are more complicated to interpret: the SUVA254 value in Collins of 3.12 L mg C−1 m−1 falls within the range that seems typical of rivers and streams in this region and is similar to values tracked in the San Luis Reservoir (2.94 L mg C−1 m−1 average) associated with the State Water Project (Kraus et al., 2011). In contrast, Englebright SUVA254 of 4.38 L mg C−1 m−1 is considerably higher, but with low total DOC of 1.6 mg L−1, it seems more likely that this high SUVA254 results from conservative concentration of non-lignin aromatics, as opposed to production from new sources. In natural river systems, source inputs for river DOC are challenging to determine as a starting point, but the presence of these large and well-homogenized reservoirs serves as a strong backdrop for evolving DOM signatures downstream.
Dry Creek DOM clearly carries the signature of the Collins reservoir out of which it flows, as evidenced by identical Λ8, as well as other lignin compositional parameters and SUVA254 values that are all within 10–20% of Collins (Table 2). Although HS itself may not constitute a high enough discharge to overprint Dry Creek all by itself, it is representative of many small streams that discharge into Dry Creek along its transit from Collins reservoir to the Yuba River. In this context, the lignin compositional parameters of Dry Creek are all intermediate between Collins reservoir and HS, indicating a clear compositional shift to the Dry Creek signature imparted by HS and similar streams over the ~7 km transit distance between Collins and the Dry Creek sampling point. A linear mixing model, |Dry Creek – Collins|*100%/|HS – Collins|, applied to each of the four lignin compositional parameters suggests that the proportion of Dry Creek DOM derived from HS and similar streams ranges from 13 to 101% (Table 3). Granted, this does not account for variations from stream to stream, nor does it account for in situ processing, but it provides a clear indication as to the potential collective impact of seemingly insignificant streams (in terms of discharge) on larger streams. Simply by DOC mass balance alone, the difference between Collins DOC at 2.9 mg L−1 and Dry Creek DOC at 4.7 mg L−1 indicates that small streams must account for ~40% of the DOC in Dry Creek.
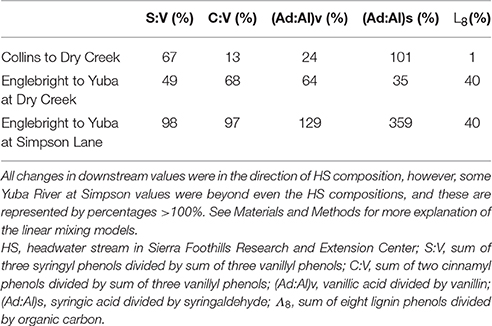
Table 3. Linear mixing models to demonstrate the magnitude of overprinting over 7–35 km reaches of Dry Creek and the Yuba River.
In comparison to the Collins to Dry Creek transformation, the Englebright to Yuba River at Dry Creek transformation appears greater over the ~15 km reach between sampling points: Λ8 values increase by >60% from 0.36 to 0.59 mg lignin 100 mg OC−1, SUVA254 values drop from 4.38 to 3.08 L mg C−1 m−1, C:V values double, S:V values increase by ~40%, and (Ad:Al)v values appear less degraded (Table 2). A ~25% increase in DOC from 1.6 mg L−1 in Englebright compared to 2.0 mg L−1 in the Yuba River at Dry Creek reflects distinct inputs of carbon. Only one notable tributary, Deer Creek, enters the Yuba River in between Englebright reservoir and the Yuba River sampling point at Dry Creek, and discharge from Deer Creek was ~8% that of the Yuba River at the time of sampling (Figure 8), although lag times between precipitation runoff and management decisions to release water from reservoirs adds nuance to interpretation. Hence the transformation in DOM in the Yuba River is not coming from a single point source, but must also be driven by the collective inputs from multiple smaller streams as well as DOM exchange with local landscape features and geomorphological features within the river channel itself. Given the relative magnitudes of the Yuba River compared to Dry Creek (<5% of the discharge of the Yuba River), it is somewhat surprising that Dry Creek is less impacted during transit than the Yuba River. However, this also reflects the challenges in making generalizations between processes in streams and rivers of significantly different orders (8th order for Yuba, 3rd or 4th order for Dry Creek).
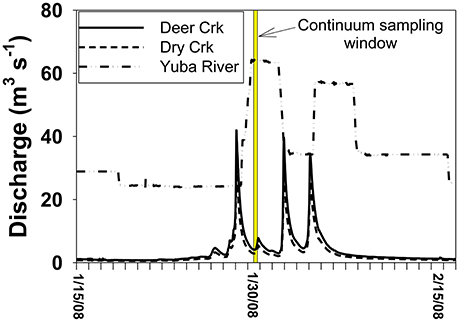
Figure 8. Discharge context for the continuum sampling. Because Englebright is a managed reservoir, releases are not in synch with natural runoff and storm pulses from tributaries below the reservoir occur before the controlled release from the reservoir.
Ultimately, there is great interest in gauging how well the DOM signature of a larger river like the Yuba River reflects the headwater sources. Clearly, the more diversity in landscapes within a river basin, the less likely river chemistry will mimic any single headwater source. In this case, there are distinct similarities in lignin chemistry and SUVA254 between HS and the Yuba River despite the influence of reservoir effects on the Yuba River. Similar to the Dry Creek analysis, the Yuba River is bracketed well by Englebright vs. HS compositions, with linear mixing model calculations, |Yuba River – Englebright|*100%/|HS – Englebright|, indicating that 35–70% of the DOM at the Yuba River sampling point is derived from streams similar to HS (Table 3). This analysis can be extended even further with the Yuba River at Simpson Lane measurement ~35 km downstream of Englebright. DOC has increased from 1.6 to 2.4 mg L−1, and essentially, Yuba River at Simpson Lane lignin has completely converted to an HS-like signature, with three parameters at or near 100% and one greatly exceeding even the HS composite (Table 3). While parameterizing small source signatures as a single average is overly simplistic (among the many HS lignin measurements, there are individual samples that would sufficiently bracket Yuba River at Simpson with Englebright), this exercise overall speaks to the dominance of oak woodlands in the lower Yuba River basin.
Implications
This study captured DOM sources and processing at multiple scales, highlighting (1) the dynamic temporal changes in DOM source signatures even from the same source materials, (2) extensive modification and attenuation of DOM during transport through the landscape to the exporting stream, (3) more diversity in lignin source signatures than has previously been reported, and (4) the significant DOM overprinting capacity of small streams to much larger rivers. While these finding unquestionably address significant gaps in our knowledge of river basin biogeochemistry, they also highlight the greater challenges of river biogeochemistry research overall.
It is clear that novel and more comprehensive experimental designs must be brought into river research. A recent emphasis on time-series sampling in the past decade, for example, has led to significant modifications in measurements of river fluxes and seasonally evolving DOM and POM compositions (Hernes et al., 2008; Spencer et al., 2010b, 2016; Ellis et al., 2012). However, there is a great need for parsing out in situ sources and processing of riverine OM vs. external inputs, and one potential approach could be to pair studies of concrete-lined aquaducts with nearby rivers to try to constrain the relative role of external vs. internal. Lagrangian sampling of rivers could be useful for determining OM transformation hotspots (both new sources and processing) within a river channel, that could then lead to more intense investigations of sources and processing at those hotspots. Continual advancements in sensors that allow high temporal and spatial monitoring of colored DOM (CDOM) properties in rivers will undoubtedly help in capturing the complexity of river systems (Downing et al., 2012; Pellerin et al., 2012), but in spite of their potential, CDOM and fluorescent DOM (FDOM) by themselves have proven elusive in giving the chemical specificity that is needed to truly understand DOM dynamics. On the other hand, such sensors could also be used as targeting agents to point toward regions where chemical analyses can be put to the greatest use (Hernes et al., 2009).
River systems are incredibly complex both spatially and temporally, with flows that vary over several orders of magnitude, varying degrees of exchange in both directions with groundwater, varying landscapes through which they flow, changes in sediment loads that impact primary production and photochemical oxidation as well as sorption/desorption processes, and a myriad of point and non-point sources to deconvolute in order to interpret chemistry. In the collective attempts by the research community to narrow the scope of river studies to scales that are conceivably more accessible to interpretation, we lose the overall richness and complexity of the entire system. The overall connectedness of river chemistry to the landscape through which it flows re-emphasizes the incredible potential of rivers as canaries in the coal mine for capturing the effects of climate and land use change.
Author Contributions
RAD and AO designed leaching experiment and field sampling scheme and conducted DOC analyses, hydrology measurements, and select UV-visible absorbance measurements. Lignin analyses were conducted by or under the supervision of RD and PH. RS conducted additional UV-visible measurements. The manuscript was written by PH, with the contribution of all authors.
Funding
This work was funded by the California State Water Resources Control Board (agreement no. 04-120-555-01), with additional contributions from National Science Foundation grant 1335622 (PH). Open access publication fees were supported in part by the Gordon and Betty Moore Foundation.
Conflict of Interest Statement
The authors declare that the research was conducted in the absence of any commercial or financial relationships that could be construed as a potential conflict of interest.
Acknowledgments
The authors would like to thank Jiayou Deng, Alex Swarowsky, Tony Orozco, and Jeannie Evatt at the Department of Land, Air, and Water Resource for their field and lab support. Sarah Flores, Daniel Jara, and Jennifer Harfmann conducted lignin analyses on various subsets of the samples.
Supplementary Material
The Supplementary Material for this article can be found online at: http://journal.frontiersin.org/article/10.3389/feart.2017.00009/full#supplementary-material
Supplementary Figure 1. Experimental setup for (A) litter and duff leaching during storms, and (B) subsurface lateral flow sampling via the trench.
Supplementary Figure 2. Conceptual diagram of hydrologic flowpaths within the HS catchment at SFREC ultimately leading to export via HS. Percentages refer to the total lateral flow contributed by each soil layer during a typical storm event. The top three horizons correspond to the three perched water (trench) samples analyzed in this study. This figure is reproduced from O'Geen et al. (2010). ©The Regents of the University of California.
Supplementary Table 1. All lignin data from the study, along with ancillary bulk data (when measured) and information, including leached volumes from the leachate study, DOC, SUVA254, times, and dates.
Supplementary Table 2. Additional DOC and SUVA254 data from the study on samples that were not analyzed for lignin.
References
Aufdenkampe, A. K., Hedges, J. I., Richey, J. E., Krusche, A. V., and Llerena, C. A. (2001). Sorptive fractionation of dissolved organic nitrogen and amino acids onto fine sediments within the Amazon Basin. Limnol. Oceanogr. 46, 1921–1935. doi: 10.4319/lo.2001.46.8.1921
Blough, N. V., Zafiriou, O. C., and Bonilla, J. (1993). Optical absorption spectra of waters from the Orinoco River outflow: terrestrial input of colored organic matter to the Caribbean. J. Geophys. Res. Oceans 98, 2271–2278. doi: 10.1029/92JC02763
Bouillon, S., Yambele, A., Spencer, R. G. M., Gillikin, D. P., Hernes, P. J., Six, J., et al. (2012). Organic matter sources, fluxes and greenhouse gas exchange in the Oubangui River (Congo River basin). Biogeosciences 9, 2045–2062. doi: 10.5194/bg-9-2045-2012
Burns, K. A., Hernes, P. J., Brinkman, D., Poulsen, A., and Benner, R. (2008). Dispersion and cycling of organic matter from the Sepik River outflow to the Papua New Guinea coast as determined from biomarkers. Org. Geochem. 39, 1747–1764. doi: 10.1016/j.orggeochem.2008.08.003
Chow, A. T., Dahlgren, R. A., and Harrison, J. A. (2007). Watershed sources of disinfection byproduct precursors in the Sacramento and San Joaquin rivers, California. Environ. Sci. Technol. 41, 7645–7652. doi: 10.1021/es070621t
Chow, A. T., Lee, S. T., O'Geen, A. T., Orozco, T., Beaudette, D., Wong, P. K., et al. (2009). Litter contributions to dissolved organic matter and disinfection byproduct precursors in California oak woodland watersheds. J. Environ. Qual. 38, 2334–2343. doi: 10.2134/jeq2008.0394
Cleveland, C. C., Neff, J. C., Townsend, A. R., and Hood, E. (2004). Composition, dynamics, and fate of leached dissolved organic matter in terrestrial ecosystems: results from a decomposition experiment. Ecosystems 7, 275–285. doi: 10.1007/s10021-003-0236-7
Downing, B. D., Pellerin, B. A., Bergamaschi, B. A., Saraceno, J. F., and Kraus, T. E. C. (2012). Seeing the light: the effects of particles, dissolved materials, and temperature on in situ measurements of DOM fluorescence in rivers and streams. Limnol. Oceanogr. Methods 10, 767–775. doi: 10.4319/lom.2012.10.767
Eckard, R. S., Hernes, P. J., Bergamaschi, B. A., Stepanauskas, R., and Kendall, C. (2007). Landscape scale controls on the vascular plant component of dissolved organic carbon across a freshwater delta. Geochim. Cosmochim. Acta 71, 5968–5984. doi: 10.1016/j.gca.2007.09.027
Ellis, E. E., Keil, R. G., Ingalls, A. E., Richey, J. E., and Alin, S. R. (2012). Seasonal variability in the sources of particulate organic matter of the Mekong River as discerned by elemental and lignin analyses. J. Geophys. Res. Biogeosci. 117, 15. doi: 10.1029/2011JG001816
Fooken, U., and Liebezeit, G. (2000). Distinction of marine and terrestrial origin of humic acids in North Sea surface sediments by absorption spectroscopy. Mar. Geol. 164, 173–181. doi: 10.1016/S0025-3227(99)00133-4
Hedges, J. I., and Ertel, J. R. (1982). Characterization of lignin by gas capillary chromatography of cupric oxide oxidation products. Anal. Chem. 54, 174–178. doi: 10.1021/ac00239a007
Hedges, J. I., and Mann, D. C. (1979). Characterization of plant tissues by their lignin oxidation products. Geochim. Cosmochim. Acta 43, 1803–1807. doi: 10.1016/0016-7037(79)90028-0
Hedges, J. I., Mayorga, E., Tsamakis, E., McClain, M. E., Aufdenkampe, A., Quay, P., et al. (2000). Organic matter in Bolivian tributaries of the Amazon River: a comparison to the lower mainstream. Limnol. Oceanogr. 45, 1449–1466. doi: 10.4319/lo.2000.45.7.1449
Helms, J. R., Stubbins, A., Ritchie, J. D., Minor, E. C., Kieber, D. J., and Mopper, K. (2008). Absorption spectral slopes and slope ratios as indicators of molecular weight, source, and photobleaching of chromophoric dissolved organic matter. Limnol. Oceanogr. 53, 955–969. doi: 10.4319/lo.2008.53.3.0955
Hernes, P. J., and Benner, R. (2002). Transport and diagenesis of dissolved and particulate terrigenous organic matter in the North Pacific Ocean. Deep Sea Res. I 49, 2119–2132. doi: 10.1016/S0967-0637(02)00128-0
Hernes, P. J., Bergamaschi, B. A., Eckard, R. S., and Spencer, R. G. M. (2009). Fluorescence-based proxies for lignin in freshwater dissolved organic matter. J. Geophys. Res. Biogeosci. 114, 10. doi: 10.1029/2009JG000938
Hernes, P. J., Kaiser, K., Dyda, R. Y., and Cerli, C. (2013a). Molecular trickery in soil organic matter: hidden lignin. Environ. Sci. Technol. 47, 9077–9085. doi: 10.1021/es401019n
Hernes, P. J., Robinson, A. C., and Aufdenkampe, A. K. (2007). Fractionation of lignin during leaching and sorption and implications for organic matter “freshness”. Geophys. Res. Lett. 34, L17401. doi: 10.1029/2007GL031017
Hernes, P. J., Spencer, R. G. M., Dyda, R. Y., Pellerin, B. A., Bachand, P. A. M., and Bergamaschi, B. A. (2008). The role of hydrologic regimes on dissolved organic carbon composition in an agricultural watershed. Geochim. Cosmochim. Acta 72, 5266–5277. doi: 10.1016/j.gca.2008.07.031
Hernes, P. J., Spencer, R. G. M., Dyda, R. Y., Pellerin, B. A., Bachand, P. A. M., and Bergamaschi, B. A. (2013b). DOM composition in an agricultural watershed: assessing patterns and variability in the context of spatial scales. Geochim. Cosmochim. Acta 121, 599–610. doi: 10.1016/j.gca.2013.07.039
Kaiser, K., Guggenberger, G., and Zech, W. (1996). Sorption of DOM and DOM fractions to forest soils. Geoderma 74, 281–303. doi: 10.1016/S0016-7061(96)00071-7
Klotzbücher, T., Kalbitz, K., Cerli, C., Hernes, P. J., and Kaiser, K. (2016). Gone or just out of sight? The apparent disappearance of aromatic litter components in soils. Soil 2, 325–335. doi: 10.5194/soil-2-325-2016
Kraus, T. E. C., Bergamaschi, B. A., Hernes, P. J., Doctor, D., Kendall, C., Downing, B. D., et al. (2011). How reservoirs alter drinking water quality: organic matter sources, sinks, and transformations. Lake Reserv. Manag. 27, 205–219. doi: 10.1080/07438141.2011.597283
Lewis, D. J., Singer, M. J., Dahlgren, R. A., and Tate, K. W. (2006). Nitrate and sediment fluxes from a California rangeland watershed. J. Environ. Qual. 35, 2202–2211. doi: 10.2134/jeq2006.0042
Mann, P. J., Spencer, R. G. M., Dinga, B. J., Poulsen, J. R., Hernes, P. J., Fiske, G., et al. (2014). The biogeochemistry of carbon across a gradient of streams and rivers within the Congo Basin. J. Geophys. Res. Biogeosci. 119, 687–702. doi: 10.1002/2013JG002442
McGlynn, B. L., and McDonnell, J. J. (2003). Role of discrete landscape units in controlling catchment dissolved organic carbon dynamics. Water Resour. Res. 39, 18. doi: 10.1029/2002WR001525
O'Geen, A. T., Dahlgren, R. A., Swarowsky, A., Tate, K. W., Lewis, D. J., and Singer, M. J. (2010). Research connects soil hydrology and stream water chemistry in California oak woodlands. Calif. Agric. 64, 78–84. doi: 10.3733/ca.v064n02p78
Oliver, A. A., Spencer, R. G. M., Deas, M. L., and Dahlgren, R. A. (2016). Impact of seasonality and anthropogenic impoundments on dissolved organic matter dynamics in the Klamath River (Oregon/California, USA). J. Geophys. Res. Biogeosci. 121, 1946–1958. doi: 10.1002/2016JG003497
Pellerin, B. A., Hernes, P. J., Saraceno, J., Spencer, R. G., and Bergamaschi, B. A. (2010). Microbial degradation of plant leachate alters lignin phenols and trihalomethane precursors. J. Environ. Qual. 39, 946–954. doi: 10.2134/jeq2009.0487
Pellerin, B. A., Saraceno, J. F., Shanley, J. B., Sebestyen, S. D., Aiken, G. R., Wollheim, W. M., et al. (2012). Taking the pulse of snowmelt: in situ sensors reveal seasonal, event and diurnal patterns of nitrate and dissolved organic matter variability in an upland forest stream. Biogeochemistry 108, 183–198. doi: 10.1007/s10533-011-9589-8
Richey, J. E., Melack, J. M., Aufdenkampe, A. K., Ballester, V. M., and Hess, L. L. (2002). Outgassing from Amazonian rivers and wetlands as a large tropical source of atmospheric CO2. Nature 416, 617–620. doi: 10.1038/416617a
Sanderman, J., Lohse, K. A., Baldock, J. A., and Amundson, R. (2009). Linking soils and streams: sources and chemistry of dissolved organic matter in a small coastal watershed. Water Resour. Res. 45:W03418. doi: 10.1029/2008WR006977
Spencer, R. G. M., Aiken, G. R., Dornblaser, M. M., Butler, K. D., Holmes, R. M., Fiske, G., et al. (2013). Chromophoric dissolved organic matter export from U.S. rivers. Geophys. Res. Lett. 40, 1575–1579. doi: 10.1002/grl.50357
Spencer, R. G. M., Aiken, G. R., Dyda, R. Y., Butler, K. D., Bergamaschi, B. A., and Hernes, P. J. (2010a). Comparison of XAD with other dissolved lignin isolation techniques and a compilation of analytical improvements for the analysis of lignin in aquatic settings. Org. Geochem. 41, 445–453. doi: 10.1016/j.orggeochem.2010.02.004
Spencer, R. G. M., Aiken, G. R., Wickland, K. P., Striegl, R. G., and Hernes, P. J. (2008). Seasonal and spatial variability in dissolved organic matter quantity and composition from the Yukon River basin, Alaska. Glob. Biogeochem. Cycle 22, 13. doi: 10.1029/2008gb003231
Spencer, R. G. M., Hernes, P. J., Dinga, B., Wabakanghanzi, J. N., Drake, T. W., and Six, J. (2016). Origins, seasonality, and fluxes of organic matter in the Congo River. Glob. Biogeochem. Cycle 30, 1105–1121. doi: 10.1002/2016GB005427
Spencer, R. G. M., Hernes, P. J., Ruf, R., Baker, A., Dyda, R. Y., Stubbins, A., et al. (2010b). Temporal controls on dissolved organic matter and lignin biogeochemistry in a pristine tropical river, Democratic Republic of Congo. J. Geophys. Res. Biogeosci. 115:G03013. doi: 10.1029/2009JG001180
Swarowsky, A., Dahlgren, R. A., and O'Geen, A. T. (2012). Linking subsurface lateral flowpath activity with streamflow characteristics in a semiarid headwater catchment. Soil Sci. Soc. Am. J. 76, 532–547. doi: 10.2136/sssaj2011.0061
Traina, S. J., Novak, J., and Smeck, N. E. (1990). An ultraviolet absorbance method of estimating the percent aromatic carbon content of humic acids. J. Environ. Qual. 19, 151–153. doi: 10.2134/jeq1990.00472425001900010023x
Keywords: dissolved organic matter, lignin biomarkers, hydrologic flowpaths, overprinting, oak woodland, stream order, SUVA
Citation: Hernes PJ, Spencer RGM, Dyda RY, O'Geen AT and Dahlgren RA (2017) The Genesis and Exodus of Vascular Plant DOM from an Oak Woodland Landscape. Front. Earth Sci. 5:9. doi: 10.3389/feart.2017.00009
Received: 03 September 2016; Accepted: 23 January 2017;
Published: 13 February 2017.
Edited by:
Rick Keil, University of Washington, USAReviewed by:
Mar Nieto-Cid, Spanish National Research Council, SpainCedric G. Fichot, Boston University, USA
Youhei Yamashita, Hokkaido University, Japan
Copyright © 2017 Hernes, Spencer, Dyda, O'Geen and Dahlgren. This is an open-access article distributed under the terms of the Creative Commons Attribution License (CC BY). The use, distribution or reproduction in other forums is permitted, provided the original author(s) or licensor are credited and that the original publication in this journal is cited, in accordance with accepted academic practice. No use, distribution or reproduction is permitted which does not comply with these terms.
*Correspondence: Peter J. Hernes, cGpoZXJuZXNAdWNkYXZpcy5lZHU=