- School of Communication Engineering, Chengdu University of Information Technology, Chengdu, China
As one of the important seismic attributes, instantaneous frequency (IF) is widely used to reveal geological features. Compared to the normally IF extraction using Hilbert transform (HT), IF extraction using the wavelet ridge is demonstrated to have a more robust characteristic and anti-noise feature. Due to IF extraction using the wavelet ridge is suitable for the gradual single-frequency signal, to get a meaningful instantaneous attributes Empirical Mode Decomposition (EMD) is applied to the seismic signal first to decompose each seismic trace into the IMFs which are single-frequency signal. Application of the simulated signals and the seismic trace show that IF extraction using the EMD-based wavelet ridge is more accurate than HT does. Application of the EMD-based wavelet ridge method in a gas field located in PengLai, Central Sichuan(China), shows its effectiveness. IF extraction using the EMD-based wavelet ridge method can be used as a strong tool to detect the instantaneous spectral properties of a reservoir to reveal hydrocarbon related strong amplitude anomaly and reservoir thickness variation and lateral changes information.
Introduction
Frequency components of a seismic signal are mainly determined by the bandwidth of the source pulse and the absorption characteristics of the subsurface medium. Factors such as fluid-containing, thickness variation, and lateral changes and so on in the formation all can cause changes in frequency components of a seismic signal (Chopra and Marfurt, 2005; Zeng, 2010; Zhou et al., 2012). Instantaneous Frequency (IF) is used to describe the frequency changes over the time variation for a special “monocomponent” signal (Boashash, 1992; Cohen, 1995). As one of the important seismic attributes, IF has been successfully used to reveal geological features such as subsurface structure (e.g., Chopra and Marfurt, 2005), seismic attenuation estimation (e.g., Yang and Gao, 2010), and the fluid-containing properties of the formation (e.g., Zhou et al., 2012). There exist many IF extraction methods for seismic data such as complex trace analysis (Taner et al., 1979), IF extraction based on time-frequency method (e.g., Hardy et al., 2003; Huang and Milkereit, 2009; Han and van der Baan, 2011; Fomel, 2013). However, it is still a very hot research topic to seek the IF calculation method and improve the IF estimation precision and make the IF physical interpretation clearly and further explore its various applications.
The conventional IF extraction method uses Hilbert Transform (HT) to obtain the analytic signal corresponding to the real signal and then calculate the IF by this analytic signal (Gabor, 1946; Taner et al., 1979). But this method is very effective for stationary signals, while for non-stationary signal it will lose physical meaning. Because the IF calculated by HT is only suitable for narrow band or monocomponent signal (Huang et al., 1998). Furthermore, HT method is very sensitive to noise. A noisy environment will bring difficulty for IF physical interpretation.
IF estimation based on wavelet transform is proved to be better than that from other time-frequency method such as short-time Fourier transform and so on (Sinha et al., 2009). But when wavelet transform is applied to a real signal using analytic wavelet in one scale, the decomposition result is an analytical signal which can be used to obtain the IF of the real signal in this scale (Farge, 1992). Although IF extraction method based on wavelet transform has some effects on non-stationary signals analysis, the analysis results will turn bad when scale used for a broadband non-stationary signal distributes in a larger range. If the discrete interval of the scale is too large, the calculation precision will not be high enough and at the same time some frequency components will be lost. Otherwise, if the discrete interval of the scale is too small, false frequencies will be produced and the calculating time will also increase a lot. Thus, it is difficult to obtain the complete and accurate IF of a real non-stationary signal by using analytic wavelet. To solve these problems, we apply an Empirical Mode Decomposition (EMD) based wavelet ridge method for IF extraction from seismic data. We extract wavelet ridge in the amplitude-angle function from the wavelet coefficients. Then, IF of the real signal are extracted by wavelet ridge. Since IF extraction using wavelet ridge only use for a gradual single-frequency signal, we introduce the EMD method (Huang et al., 1998) to decompose the multiple seismic signal into IMFs which are gradual single-frequency signals first.
Principle and Methods
Instantaneous Attributes Extraction Using Wavelet Ridge
Let a gradual single-frequency signal be
Its analytic signal can be obtained by HT:
where, ŝ(t) is the HT of the s(t).
Selected an analytic mother wavelet having gradual form, it can be expressed as
Then use this mother wavelet to Zs(t) for wavelet transform. We can get:
where, a is scale. And
Assuming for any (a, b), φab(t) only have a first-order stationary point ts = ts(a, b) about ι, meeting and . Then the asymptotic expansion of Wz(a, b) can be expressed as (Yu et al., 2006)
where
The wavelet ridge is defined as
where, H2(R) = {f∈L2(R), f(ω) = 0, ifω ≤ 0} is Hardy real space.
Then on the wavelet ridge line there is .
From equation (6) we can obtain:
The wavelet ridge can be represented by ar(b).
The wavelet coefficients on the wavelet ridge line are
When the wavelet ridge ar(b) is extracted, the instantaneous frequency fs(b) of the signal can be obtained by
Here, we use the iterative method to calculate the wavelet ridge. Let a discrete sequence be
where Ts is the sampling period.
The wavelet transform of the Sk at scale a is Ws(a, tk). The amplitude and angle function is Ψ(a, tk). Db denotes discrete differential operator of the shift factor b. Then
Therefore
Let be the estimator of ar(tk). Then the wavelet ridge can be calculated by the following iterative method:
The wavelet ridge is .
A simulated signal is used to demonstrate the effects on IF extraction methods using the wavelet ridge and HT respectively. The simulated signal is given by the equation as
Where,
From Equation (17), we know the real frequency of s(t) is: f(t) = 80t+20. The real frequency ranges from 20 to 80Hz.
Applying the wavelet ridge and HT respectively to the signal s(t) Figure 1 shows the IF extracted results. As shown by Figure 1B, the end effect in HT is obvious. At the both end IF extracted by HT is distorted. IF extracted by the wavelet ridge is more accordance with the real frequency and shows better effects than HT does.
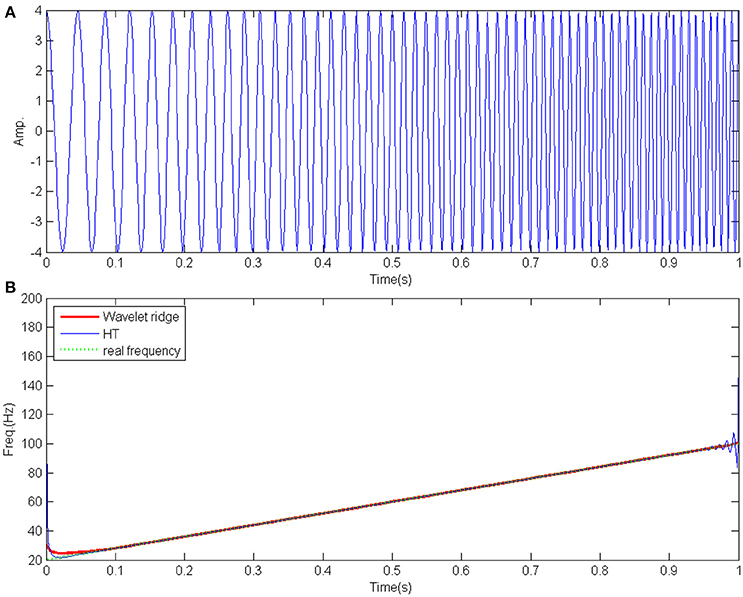
Figure 1. EMD applied to the simulated signal without noise. (A) The simulated signal. (B) IF extracted respectively by wavelet ridge and HT. The real frequency is plotted in green color.
To further demonstrate the characteristics of IF extraction using the wavelet ridge and HT respectively, we add a white noise with the mean of 0 and the variance of 0.2 in the signal with the time ranges from 0.5 to 0.7 s. The added noise and the signal with noise are respectively shown in Figures 2A,B. Figure 2C shows the IF extracted by the wavelet ridge and HT respectively. As Figure 2C shown, the IF extracted by HT within the time [0.5–0.7] is seriously distorted. The HT method is much sensitive to the noise. While the IF extracted by the wavelet ridge still fit the real frequency very well. The wavelet ridge method is much more robust than the HT does.

Figure 2. EMD applied to the simulated signal with noise. (A) The added white noise with the mean of 0 and the variance of 0.2 within the time ranges from 0.5 to 0.7 s. (B) The simulated signal with noise. (C) IF extracted respectively by wavelet ridge and HT. The real frequency of the simulated signal is plotted in green color.
Seismic signal is usually non-stationary multi-component signal. To get a meaningful instantaneous attribute, the original seismic signal must be decomposed into the gradual single-frequency signal as Equation (1) first. This process can be completed by EMD method.
EMD Method
The EMD method proposed by Huang et al. (1998) is a data-driven adaptive decomposition method for non-stationary and non-linear signals. EMD can decompose a seismic signal into a finite number of Intrinsic Mode Functions (IMFs) with gradual single-frequency signal from high frequency to low frequency to a monotonous trend (Huang et al., 1998; Magrin-Chagnolleau and Baraniuk, 1999; Macelloni et al., 2011). Thus, only the IF of one IMF has physical meaning.
EMD mainly contain the following steps:
(a) Compute the corresponding interpolating envelope of the original signal x(t) by finding all the local extrema:
Where u(t) and v(t) are respectively the corresponding upper and lower interpolating envelopes. Mi(i = 1, 2, L) and mk(k = 1, 2, L) are respectively the local maxima and minima.
(b) Let m(t): = (u(t)+v(t))/2. Subtract m(t) from the original signal x(t): Let.
(c) Return to step (a). Replace x(t) with h1(t). Repeat the above process until the resultant hk(t) meets the IMF conditions. Then the first IMFc1(t):c1(t) = hk(t). The residual part of the signal r1(t):r1(t) = x(t)−c1(t).
(d) If there are more than one extremes (neither the constant nor the trend term) in x(t), the remaining part of the signal can be proceeded by EMD until the remaining portion of the resulting signal is a monotone or a value less than a predetermined given value. Finally, all the IMFs and the margin are:
After EMD decomposition, the original seismic signal x(t) can be expressed as:
Where ci(t) is the i−th(i = 1~n) IMF. rn(t) is the margin.
Generally, ci(t) has the form as equation (1) shown.
Recently, EEMD and CEEMD are proposed for overcoming the mode mixing in EMD to make the IMF physical meaning more clearly (Wu and Huang, 2009; Torres et al., 2011). Both EEMD and CEEMD are noise-assisted data analysis methods, that is, in their decomposition processes, they need add different white noise series to cancel each other and the mean IMFs stays within the natural dyadic filter windows. But another main problem introduced by EEMD and CEEMD is they will decompose the Morlet wavelet or Ricker wavelet which has some bandwidth into a single frequency. Thus, they will destroy the true bandwidth of the sub-signals (Han and van der Baan, 2013; Xue et al., 2014). For these reasons, we consider the EMD will give better effects than EEMD and CEEMD do in instantaneous spectral analysis techniques and other attenuation estimation methods which need the sub-signals have some bandwidth for revealing geological features.
The EMD-Based Wavelet Ridge Method Used for Instantaneous Attributes Extraction
Due to the non-stationary and non-linear features of the seismic signal, the seismic signals always have multi-frequency components which lead to the above instantaneous attribute extraction using the wavelet ridge method alone lose effectiveness. Thus, we apply the EMD method to seismic signals before the wavelet ridge attribute extraction. After EMD decomposition, each IMF is a gradual single-frequency signal having clear physical meaning. Then the IFs of the IMFs can be completely and accurately obtained by the wavelet ridge extraction.
For comparing the effects on IF extraction methods using the wavelet ridge and HT to a multi-component signal respectively, another simulated multi-component signal is examined as an example. The simulated signal is given by the equation as
Where, s1(t) = sin(2π(20 + 40t)t).s2(t) = cos(2π(80 + 80t)t). . We can find that the real frequency of s1(t) is 20 + 80t and the real frequency of s2(t) is 80 + 160t.
After EMD is applied to the simulated signal, two IMFs and one residue are obtained (Figure 3). As Figure 3 shown, the first IMF (IMF1) resembles the s2(t) best which has higher frequency. s1(t)which has lower frequency is mainly embodied in the second IMF (IMF2).
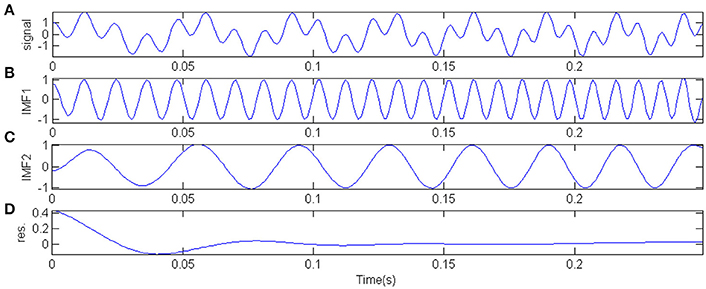
Figure 3. EMD applied to the multi-component signal. (A) The simulated multi-component signal. (B) The first IMF(IMF1). (C) The second IMF(IMF2). (D) The residue.
Then IF extractions of these two IMFs using HT and wavelet ridge respectively are carried out. Figure 4 shows that IF extracted by HT at both ends of the IMF1 and IMF2 is distorted. IF extracted by the wavelet ridge are more fit the real frequency of the simulated signal.

Figure 4. IF extraction of the two IMFs using wavelet ridge and HT without adding Gaussian white noise. (A) IF of the IMF1. The real frequency of s1(t) is plotted in green color. (B) IF of the IMF2. The real frequency of s2(t) is plotted in green color.
For further test the effects on IF extraction methods using the wavelet ridge and HT respectively, we add the Gaussian white noise in the signal given by the Equation (19) with the Signal to Noise Ratio (SNR) being 30 dB. As Figure 5 shown, due to the adding of Gaussian white noise involved in the original signal, IFs extracted by HT are sensitive to the noise and thus the accuracy and the completeness are turn bad (Figure 5A). Since the noise is mainly reflected in IMF1, we can find that the IF of IMF2 extracted by HT (Figure 5B) is not various much to the case without adding noise in Figure 4B. While IFs extracted by the wavelet ridge are still fit the real frequency well and show the better effects (Figures 5A,B). IF extracted using the wavelet ridge is more robust and anti-noise than that using HT.
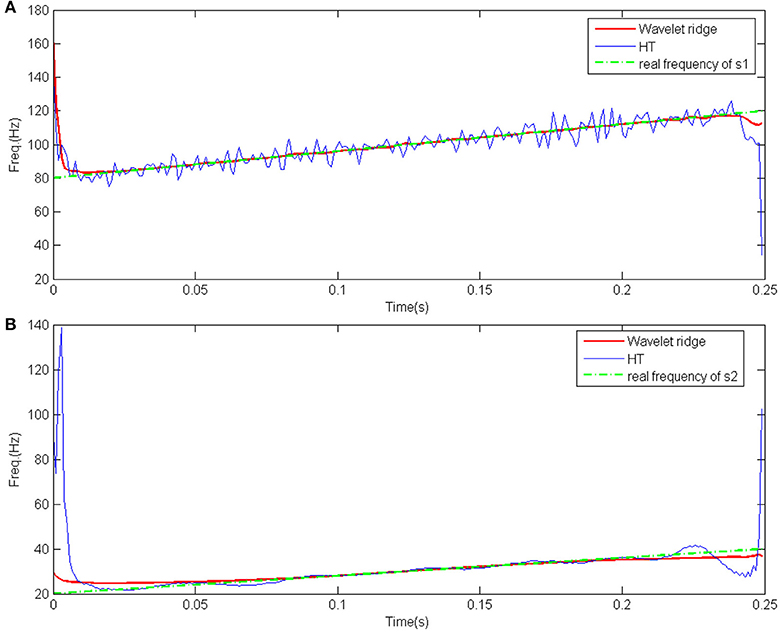
Figure 5. IF extraction of the two IMFs using wavelet ridge and HT with adding Gaussian white noise. SNR is 30 dB. (A) IF of the IMF1. The real frequency of s1(t) is plotted in green color. (B) IF of the IMF2. The real frequency of s2(t) is plotted in green color.
Seismic Data
To evaluate the effects of the IF extraction using the EMD-based wavelet ridge, an original two-dimensional broad-band migrated stacked seismic data from PengLai gas field, located in Central Sichuan, China, is collected for analysis. The gas field is mainly composed of tight sandstone reservoirs. The Xujiahe Formation is the major producing gas reservoir in this field. We mainly study the 2nd section of Xujiahe Formation. There are an average porosity of approximately 5.12% and an average permeability of 0.23 × 10⁻³μm2 in the 2nd section. Mainly the middle to thick sandstone with little thin silty mudstone and carbonaceous mudstone is locates in the reservoir segment. Figure 6A depicts a high-quality seismic section over the PengLai gas field, which the pre-stack shots of this data were acquired in 2009 and then the data is processed by residual static correction and prestack depth domain migration processing. Sectional waveform is active and the events in the seismic section are continuous and waveform characteristics are clearly. The study area in this paper is set by the black rectangular. Figure 6B shows the setting study area between two horizon lines which is in the 2nd section of the Xujiahe Formation. It contains a prolific gas well named A. Gas testing results show that there are 12,060 cubic meters of gas and 0.65 cubic meters of oil in Well A. The reservoir around well A is targeted by a black ellipse. The dominant frequency of the seismic section is about 50 Hz by the analysis of the target layers using Fourier transform.
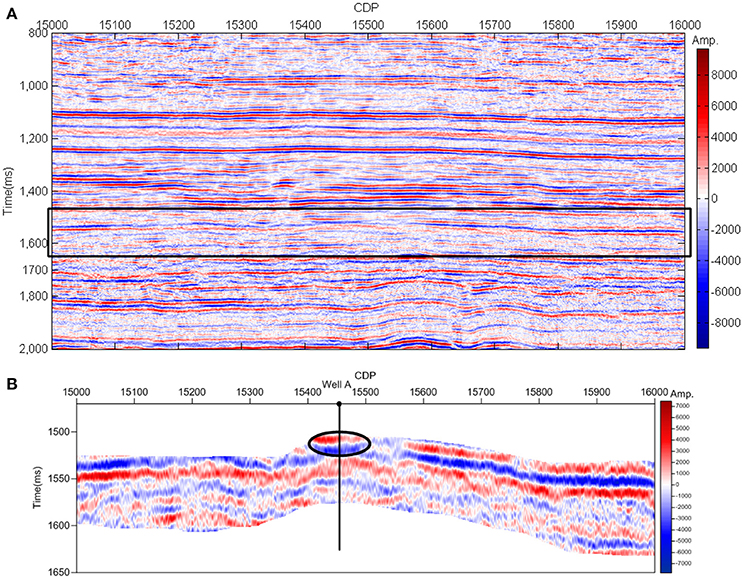
Figure 6. the orignal seismic section and the study area setting. (A) The original two-dimensional broad-band migrated stacked seismic data with the time ranges from 800 to 1,200 ms. The black rectangular area is the study section. (B) The studied part of the seismic section between two horizon lines.
Discussion
Comparative Analysis of the IF Extraction of the Wavelet Ridge and HT
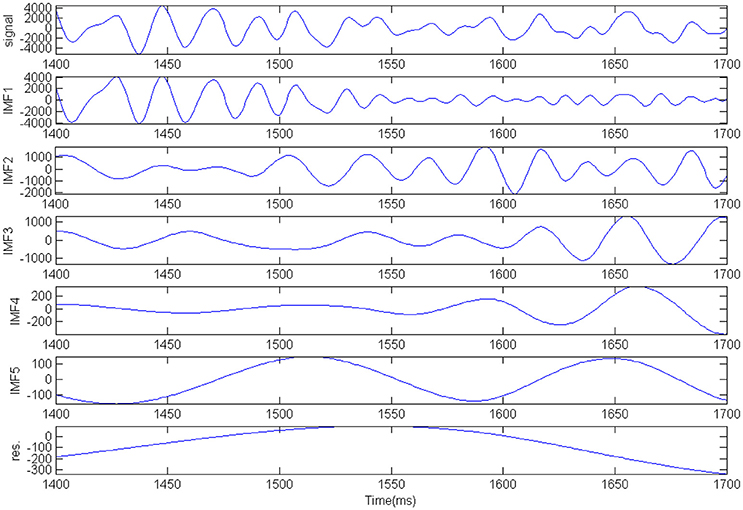
The seismic signal at CDP stacked trace 15454 intersecting well A is used to analyze the IF extraction first. After EMD decomposition, the signal at CDP stacked trace 15454 is decomposed into five IMFs and a residual term (Figure 7). Table 1 shows the correlation analysis of the original seismic trace and their five corresponding IMFs extracted by EMD. As shown in Table 1, the strong correlation is mainly in IMF1 and IMF2 and the main energy of seismic signal at CDP stacked trace 409 is mainly concentrated in the 1st to 2nd IMFs (IMF1–IMF2). Then the IF extracted by the wavelet ridge and HT is applied to the first two IMFs respectively (Figure 8). Figure 8 shows that the IF extracted by HT is more sensitive to noise and there exist some false IF in the IF extracted by HT. The IF extracted by the wavelet ridge gives more acceptable results to the true values of the data.

Table 1. Correlation analysis of the original seismic trace and their five corresponding IMFs extracted by EMD.
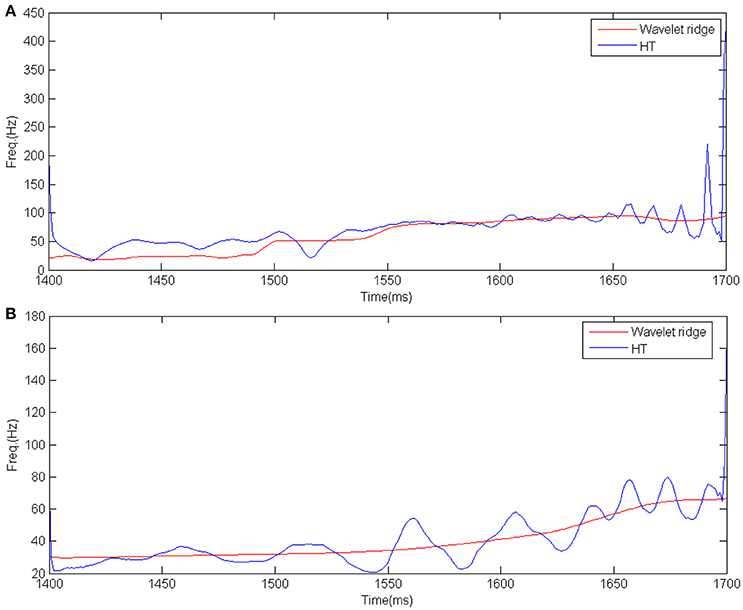
Figure 8. the IFs of the first two IMFs extracted by the wavelet ridge and HT respectively. (A) The IF of the IMF1. (B) The IF of the IMF2.
Hydrocarbon Information Revealing
The peak frequency of the seismic signal at CDP stacked trace 15454 intersecting well A (Figures 9A, 10A) with maximum energy at each time sample is extracted by the EMD-based wavelet ridge and EMD-based HT respectively to show the temporal thickness of the layer (Figures 9B, 10B). Maximum amplitude at each time sample above the average amplitude extracted by the EMD-based wavelet ridge and EMD-based HT respectively is also shown in Figures 9C, 10C to show the amplitude anomaly related to the hydrocarbons information. Comparing Figure 9B with Figure 10B, the peak frequency in the reservoir (orange color) extracted by the EMD-based wavelet ridge is obviously higher than the other area. The high frequency at this area can be interpreted as the presence of a thin bed. While in Figure 10B the peak frequency in the reservoir extracted by EMD-HT is not obviously as the EMD-based wavelet ridge method does. Comparing Figure 9C with Figure 10C, the maximum amplitude at each time sample above the average amplitude extracted by the EMD-based wavelet ridge is clearly larger than the amplitude in the other samples. It shows a larger amplitude anomaly. Besides the lithology, it is mainly caused by the hydrocarbons. While the amplitude in the reservoir in Figure 10C is not as larger as Figure 9C shows. In conclusion, the EMD-based wavelet ridge method gives a better interpretation related to the hydrocarbons information and bed thickness.
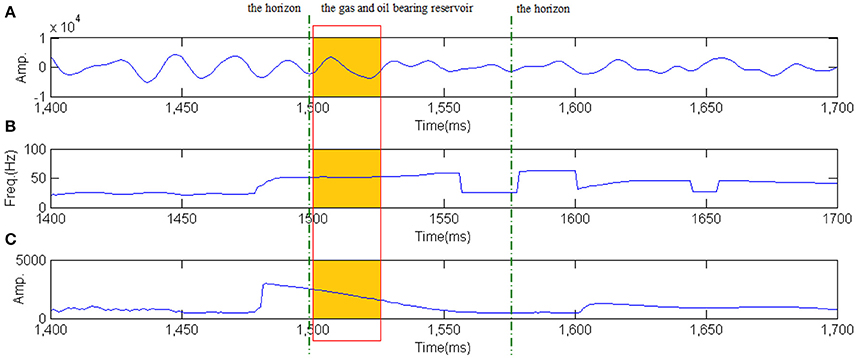
Figure 9. The peak frequency and the maximum amplitude at each time sample above the average amplitude extraction using the EMD-based wavelet ridge. (A) The seismic signal at CDP stacked trace 15454 intersecting well A. (B) The peak frequency with maximum energy at each time sample. (C) The maximum amplitude at each time sample above the average amplitude.
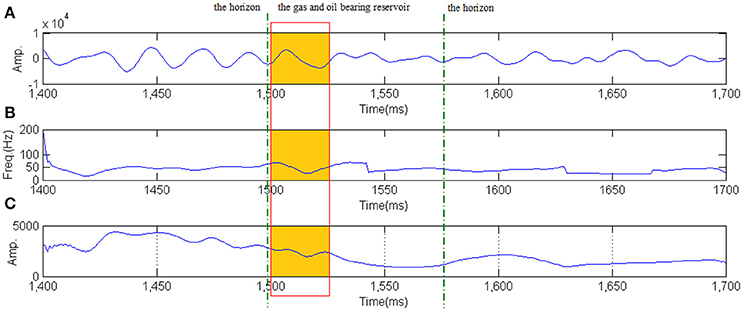
Figure 10. The peak frequency and the maximum amplitude at each time sample above the average amplitude extraction using the EMD-based HT. (A) The seismic signal at CDP stacked trace 15454 intersecting well A. (B) The peak frequency with maximum energy at each time sample. (C) The maximum amplitude at each time sample above the average amplitude.
2D Seismic Section Analysis
The EMD-based wavelet ridge is applied to the seismic section intersecting well A. At first, each seismic trace is decomposed into a series of IMFs by EMD. For each trace the peak frequency with maximum energy at each time sample in different IMFs is extracted to show the bed thickness (Figure 11A). At the same time the maximum amplitude at each time sample above the average amplitude in different IMFs for each trace is extracted to show the amplitude anomaly (Figure 11B). As Figure 11A shows, in the study area (black ellipse), the peak frequency is higher. This can be interpreted as the presence of thin stratified beds. Figure 11B shows amplitude anomaly is higher in the study area. It backs a better interpretation related to hydrocarbons information. The interpretation results are identical to the gas testing results. IF extracted by the EMD-based wavelet ridge gives a more realistic value reflection.
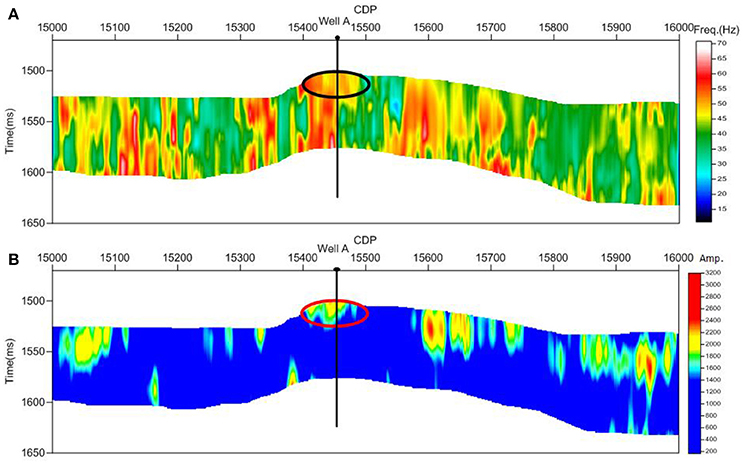
Figure 11. The peak frequency volume and the maximum amplitude above the average amplitude volume extraction using the EMD-based wavelet ridge. (A) The peak frequency volume. (B) The maximum amplitude above the average amplitude volume.
Conclusion
By extending IF extraction of seismic signal using the wavelet ridge, the EMD based wavelet ridge is demonstrated to be a robust anti-noise tool to reveal hydrocarbons information related to a tight sandstone reservoir. As a multi-component signal, seismic signal needs to be decomposed into the gradual single-frequency signal to get meaningful instantaneous attributes. This process is completed by EMD. Then the wavelet ridge is used to extract the instantaneous attributes. Applications of the simulated signals and the real seismic trace and the seismic section show the IF extracted by the EMD based wavelet ridge are more robust than HT does. The interpretations related to bed thickness given by frequency attributes are more accurate in our study case. The extension of IF extraction using the EMD based wavelet ridge has a great potential to real geological features in future.
Author Contributions
YX contributes to the ideas and the algorithm steps. JZ contributes to the processing of the seismic data. QC and LZ contributes to the writing of the manuscript. FZ contributes to the collecting of the data and other materials.
Conflict of Interest Statement
The authors declare that the research was conducted in the absence of any commercial or financial relationships that could be construed as a potential conflict of interest.
Acknowledgments
This work was supported by the National Natural Science Foundation of China under Grants 41404102, the Sichuan Youth Science and Technology Foundation under Grant 2016JQ0012, and the State Scholarship Fund of China Scholarship Council (Grant 201708515067).
References
Boashash, B. (1992). Estimating and interpreting the instantaneous frequency of a signal. 1. Fundamentals. Proc. IEEE 80, 520–538. doi: 10.1109/5.135376
Chopra, S., and Marfurt, K. (2005). Seismic attributes-A historical perspective. Geophysics 70, 3SO−28SO. doi: 10.1190/1.2098670
Cohen, I. (1995). Time-Frequency Analysis: Theory and Application. Eaglewood Cliffs, NJ: Prentice Hall.
Farge, M. (1992). Wavelet transform and their application to turbulence. Ann. Rev. Fluid Mech. 24, 395–457. doi: 10.1146/annurev.fl.24.010192.002143
Fomel, S. (2013). Seismic data decomposition into spectral components using regularized nonstationary autoregression. Geophysics 78, O69–O76. doi: 10.1190/geo2013-0221.1
Gabor, D. (1946). Theory of communication. Part 1: the analysis of information. J. Inst. Elect. Eng. 93, 429–441. doi: 10.1049/ji-3-2.1946.0074
Han, J., and van der Baan, M. (2011). “Empirical mode decomposition and robust seismic attribute analysis,” in CSPG CSEG CWLS Convention (Alberta, CA), 114.
Han, J., and van der Baan, M. (2013). Empirical mode decomposition for seismic time-frequency analysis. Geophysics 78, O9–O19. doi: 10.1190/geo2012-0199.1
Hardy, H., Beier, R. A., and Gaston, J. D. (2003). Frequency estimates of seismic traces. Geophysics 68, 370–380. doi: 10.1190/1.1543222
Huang, J., and Milkereit, B. (2009). “Empirical mode decomposition based instantaneous spectral analysis and its applications to heterogeneous petrophysical model construction,” in CSPG CSEG CWLS Convention (Alberta, CA), 205–210.
Huang, N. E., Shen, Z., Long, S. R., Wu, M. C., Shih, H. H., Zheng, Q., et al. (1998). The empirical mode decomposition and the Hilbert spectrum for nonlinear and non-stationary time series analysis. Proc. R. Soc. 454, 903–995. doi: 10.1098/rspa.1998.0193
Macelloni, L., Battista, B. M., and Knapp, C. C. (2011). Optimal filtering high-resolution seismic reflection data using a weighted-mode empirical mode decomposition operator. J. Appl. Geophys. 75, 603–614. doi: 10.1016/j.jappgeo.2011.09.018
Magrin-Chagnolleau, I., and Baraniuk, R. G. (1999). “Empirical mode decomposition based frequency attributes,” in 1999 SEG Annual Meeting (Houston, TX).
Sinha, S., Routh, P., and Anno, P. (2009). Instantaneous spectral attributes using scales in continuous-wavelet transform. Geophysics 74, WA137–WA142. doi: 10.1190/1.3054145
Taner, M. T., Koehler, F., and Sheriff, R. E. (1979). Complex seismic trace analysis. Geophysics 44, 1041–1063. doi: 10.1190/1.1440994
Torres, M. E., Colominas, M. A., Schlotthauer, G., and Flandrin, P. (2011). “A complete ensemble empirical mode decomposition with adaptive noise,” in Acoustics, Speech and Signal Processing (ICASSP), 2011 IEEE International Conference (Prague), 4144IEEE−4147IEEE.
Wu, Z., and Huang, N. E. (2009). Ensemble empirical mode decomposition: a noise-assisted data analysis method. Adv. Adapt. Data Anal. 1, 1–41. doi: 10.1142/S1793536909000047
Xue, Y. J., Cao, J. X., and Tian, R. F. (2014). EMD and Teager–Kaiser energy applied to hydrocarbon detection in a carbonate reservoir. Geophys. J. Int. 197, 277–291. doi: 10.1093/gji/ggt530
Yang, S., and Gao, J. (2010). Seismic attenuation estimation from instantaneous frequency. IEEE Geosci. Remote Sens. Lett. 7, 113–117. doi: 10.1109/LGRS.2009.2028302
Yu, D., Cheng, J., and Yang, Y. (2006). Mechanical Fault Diagnosis Based on the Hilbert-Huang Transform Method. Beijing: Science Press.
Zeng, H. (2010). Geologic significance of anomalous instantaneous frequency. Geophysics 75, P23–P30. doi: 10.1190/1.3427638
Keywords: empirical mode decomposition, wavelet ridge, instantaneous frequency, peak frequency volume, tight sandstone reservoirs
Citation: Xue Y, Zhang J, Chang Q, Zhang L and Zou F (2018) Instantaneous Frequency Extraction Using the EMD-Based Wavelet Ridge to Reveal Geological Features. Front. Earth Sci. 6:65. doi: 10.3389/feart.2018.00065
Received: 09 March 2018; Accepted: 14 May 2018;
Published: 30 May 2018.
Edited by:
Peng Liu, Institute of Remote Sensing and Digital Earth (CAS), ChinaReviewed by:
Emanuele Brunesi, European Centre for Training and Research in Earthquake Engineering, ItalyAlessandro Tibaldi, Università degli studi di Milano Bicocca, Italy
Mohammad Amin Hariri-Ardebili, University of Colorado Boulder, United States
Copyright © 2018 Xue, Zhang, Chang, Zhang and Zou. This is an open-access article distributed under the terms of the Creative Commons Attribution License (CC BY). The use, distribution or reproduction in other forums is permitted, provided the original author(s) and the copyright owner are credited and that the original publication in this journal is cited, in accordance with accepted academic practice. No use, distribution or reproduction is permitted which does not comply with these terms.
*Correspondence: Ya-juan Xue, eHVleWowODY5QDE2My5jb20=
 Ya-juan Xue
 Jian Zhang