 Torgeir O. Røthe
 Jostein Bakke
 Eivind W. N. Støren
 Raymond S. Bradley3
- 1Department of Earth Science, University of Bergen, Bergen, Norway
- 2Bjerknes Centre for Climate Research, Bergen, Norway
- 3Department of Geosciences, University of Massachusetts, Amherst, MA, United States
A process-based understanding of lacustrine deposited sediments in Arctic lakes is essential to set the present warming and hydroclimatic shift into perspective. From such a perspective, we can enhance our understanding of the natural climate variability in the Arctic. Here, we present work from the northern coast of Spitsbergen in which we unravel the sediment sequence from a distal glacier-fed lake, Vårfluesjøen. Utilizing recent methodological and technological developments, we base our interpretation on new tools that better visualize and characterize the sediments cores. High-resolution X-ray Computed Tomography (X-ray CT) is used to visualize the lake sediments and quantify the sand-sized particles found in the 210Pb- and radiocarbon-dated sediments, together with a multi-proxy approach including measurement of their physical, geochemical, and magnetic properties. Our findings suggest that Vårfluesjøen (6 m a.s.l.) was isolated from Woodfjorden at c. 10200 ± 260 cal. yr. BP. During the early Holocene, the glaciers in the Vårfluesjøen catchment were considerably smaller than today or had even melted completely. At the start of the Neoglacial period (c. 3500 cal. yr. BP), we find increased glacier activity in the catchment of the lake. X-ray CT reveals an increased frequency of sand-sized particles from 3500 to 1750 cal. yr. BP, suggesting greater wintertime aeolian activity. Starting c. 2250 years ago, we find a progressive increase in snowmelt runoff in the Vårfluesjøen catchment, with peak runoff from 1000 to 750 cal. yr. BP. This coincides with a drop in sand-sized particles, hence less favorable environment for aeolian activity, and implying wetter conditions. During the last 2000 years, there is evidence for high glacier activity between c. 2000 to 900 and 750–350 cal. yr. BP. In between these time spans, less activity is recorded in the periods 1900–1800, 1000–800, and 350–150 cal. yr. BP.
Introduction
The present warming of the Arctic is twice that of the global average due to polar amplification (AMAP, 2017). The accompanying decrease in sea-ice cover and increase in the northward transport of warm and moist air masses has resulted in dramatic changes in the current Arctic hydroclimate, especially during the winter season. Future projections show that Arctic precipitation will increase by over 50% during the twenty-first century, and this increased precipitation is more likely to be rain than snow (Bintanja and Andry, 2017). This hydroclimatic regime shift in the Arctic will likely haves societal and ecological impacts through increased frequency of extreme events, potentially causing damage to infrastructure and threatening the safety of people living in the Arctic. However, to put the present regime shift into a climatic context, it is important to understand the historical variability of the natural climate and the frequency of extreme events. Increased knowledge about the scope of Arctic climate variability is relevant for not only the science community but also for policy- and decision-makers as well as local communities in the Arctic.
Lakes are prime natural archives for understanding past environmental conditions prior to the observed instrumental period. Earth surface processes occurring in the catchment of a lake can leave a sedimentological imprint in pristine Arctic lakes. Complete ice cover for 8–9 months is characteristic of Arctic lakes and affects both the clastic sediment input and the autochthonous production within the lakes (Bradley et al., 1996). Most of the material within the glaciated catchments has its origins from glacier activity and is transported to and deposited in the lake mainly by glaciofluvial and fluvial processes (Church, 1973). Monitoring of presently glacierized and non-glacierized catchments from the Canadian Arctic has shown how episodic events resulting from spring snowmelt, precipitation, and aeolian processes may also influence the sedimentation in Arctic lakes (Lamoureux et al., 2002; Lewis et al., 2002; Francus et al., 2008). Little vegetation cover and permafrost results in rapid run-off from any extreme precipitation event (Church, 1973). Furthermore, ice drifting from the breakup of lake ice, avalanches, and mass movement events can remobilize old material in the catchment and disrupt the sediment sequence in the lake. Therefore, a process-based understanding of the deposited sediments is needed to identify the underlying environmental and climatic factors.
Understanding the characteristic sedimentological signatures of different catchment driven processes is vital in order to use the sedimentary record to reconstruct past intensity in, for example, glacier erosion (Leemann and Niessen, 1994; Leonard, 1997) or flood frequency (Støren et al., 2010; Wilhelm et al., 2013). This approach has been shown to be highly successful in reconstructing past glacier variability in Scandinavia and the Arctic (Karlèn, 1976; Karlén, 1981; Nesje et al., 1991; Matthews et al., 2000; Dahl et al., 2003; Bakke et al., 2005, 2009, 2010; Røthe et al., 2015; van der Bilt et al., 2015; de Wet et al., 2018), as well as in reconstructing flood frequency (Bøe et al., 2006; Støren et al., 2008, 2010) and avalanche history (Sletten et al., 2003; Nesje et al., 2007; Vasskog et al., 2011). A possible limitation of this method is that it is challenging to distinguish between sediments deposited by different processes occurring in the catchment, due to common sediment sources and transport distance and paraglacial modification (Ballantyne, 2002; Rubensdotter and Rosqvist, 2009; van der Bilt et al., 2016). However, recent methodological and technological developments (e.g., the X-ray CT) improves how we can visualize complex structures and quantify coarse grains from the lake sediments in a precise and non-destructive way (Bendle et al., 2015; Fouinat et al., 2017).
In this paper, we present result from a continuous high-resolution sediment core from a distal glacier-fed lake, Vårfluesjøen, covering the Holocene epoch. Using a multi-proxy approach, we aim to unravel, characterize, and identify the sediments deposited by different earth surface processes in the Vårfluesjøen catchment. First, we use the input of inorganic detrital material to reconstruct the relative glacier activity of the upstream glaciers in the catchment. Second, we use X-ray CT to visualize and quantify individual event layers believed to represent increased runoff from snowmelt in the catchment. Third, we use discrete sand-sized particles identified by the X-ray CT as a measure of wintertime aeolian activity.
Study Site
Vårfluesjøen (79.7269°N, 14.4112°E) is located on the Andrée Land peninsula, on the north coast of Spitsbergen (Figure 1). The lake is situated on the west side of the peninsula, at the mouth of Stratusdalen, Cirrusdalen, and Grennadalen, with a river (~700 m long) that drains the lake into Woodfjorden (Figure 1). Vårfluesjøen is dammed by a bedrock threshold, which separates the lake from Woodfjorden (Mäusbucher et al., 2002). The bathymetry of Vårfluesjøen, shown in Figure 2, reveals three sub-basins from east to west at water depths of 31, 33, and 10 m. The main inlet is on the eastern shore of the lake, where the main tributary rivers from Stratusdalen, Cirrusdalen, and Grennadalen cross a sandur before forming the three main deltas. The total catchment area of the lake is 27.8 km2, within which Vårfluesjøen covers an area of approximately 1.2 km2.
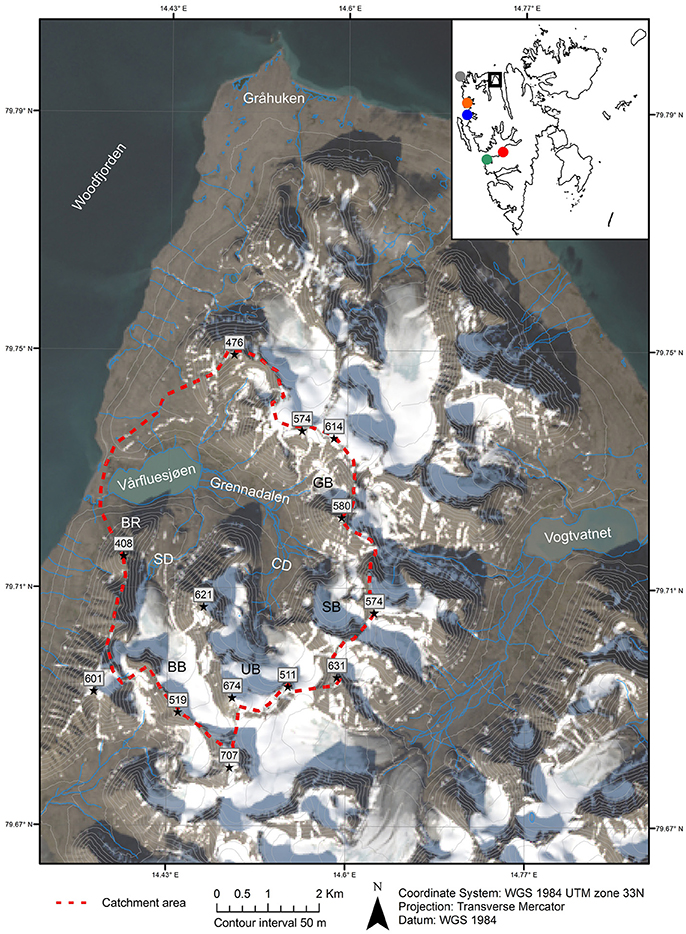
Figure 1. Overview photo of Andrée Land Peninsula, showing the study area within the red dashed line. Glaciers in the catchment area are abbreviated as follows: BB, Bybreen; UB, Uglebreen; SB, Salamonbreen; and GB, Grennabreen. Numbers in white correspond to height above sea level. Three valleys are joined at Vårfluesjøen: Grennadalen, Stratusdalen (SD), and Cirrusdalen (CD). In the west, we find the mountain range Bråvallafjella (BR). The smaller inlet map shows the Svalbard archipelago, and the black square indicates where the study area is located. Dots refer to sites mentioned in the text: gray, Amsterdamøya; orange, Mitrahalvøya (Karlbreen); blue, Ny-Ålesund; green, Isfjord Radio/Linnedalen; red, Longyearbyen and Longyearbreen.
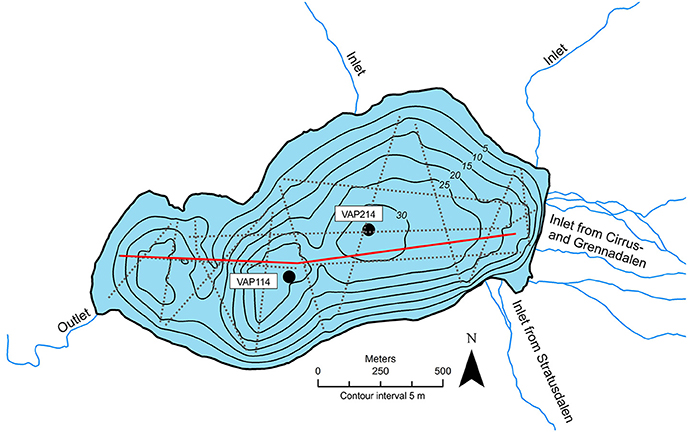
Figure 2. Bathymetric map of Vårfluesjøen based on interpolation between GPR profiles (n = 16 lines), indicated by gray stippled line, in the lake using ArcMap 10.2 software. Black dots mark the coring locations of VAP114 and VAP214. Red line indicates cross section line used to develop Figure 4.
The lake surface is at 6 m a.s.l., which is below the highest former sea level since the last glacial maximum in the area (marine limit), and the lake was isolated from the sea around 9600 14C years BP (Mäusbucher et al., 2002). Salvigsen and Österholm (1982) report an upper and lower marine limit of 80 and 40 m a.s.l. at the northern tip of Andrée Land, with an age of approximately 11,000 14C years BP based on radiocarbon dating of a shell found in a raised terrace at Gråhuken. Previous work in the area discovered and described beach ridge systems at 74–50 m a.s.l. from the Allerød Interstadial, 43–22 m a.s.l from the early Holocene, and close to the present shoreline at 17–3 m a.s.l. (Brückner et al., 2002).
Climate, Bedrock, Geomorphology, and Glaciers
Climate
Today, the recent increase in temperatures around Spitsbergen is mainly due to variations in large-scale atmospheric circulation and diminishing sea ice cover (Isaksen et al., 2016). The Arctic Oscillation (AO) mainly controls the large-scale atmospheric circulation pattern in the region. The AO influences the alternating transport of wind between the southeast and dry air from the northeast (Thompson and Wallace, 1998). This modulates the storm trajectories in the region as a positive AO steers winter storms northwards and in turn impacts the amount of snow falling on Svalbard during the winter time (Luks et al., 2011). During a negative AO, the region is influenced by wind from the east/northeast and consequently less precipitation falling as snow or rain.
The northward transport of warm surface water by the West Spitsbergen Current (WSC), a branch of the North Atlantic Current, significantly influences the climate of Svalbard (Aagaard et al., 1987). Along the northern coast of Svalbard, the WSC is weakened, but it plays an important role in moderating the regional-scale atmospheric conditions and, in turn, moderates the amount of sea ice around Svalbard (Onarheim et al., 2014). The strong positive feedbacks from the diminishing sea-ice cover is believed to reinforce the rapid warming in the Arctic as it allows for heat fluxes between the ocean to the atmosphere (Serreze et al., 2009; Screen and Simmonds, 2010).
Based on nearby weather stations located in Ny-Ålesund (Station ID: 99910) and at Svalbard Airport (Station ID: 99840), the average (from 1961 to 1990) June, July, and August temperatures range from 3.4 to 4.2°C; the average in the winter months is between −13.8 and −15.1°C (Førland et al., 2011). Average (from 1961 to 1990) precipitation varies from 190 to 385 mm between the two stations on the west coast of Svalbard (Førland et al., 2011). Precipitation measurements are typically highly unreliable in the High Arctic, and so the actual amount of precipitation Svalbard receives may be somewhat underestimated (Førland and Hanssen-Bauer, 2000; Førland et al., 2011).
Bedrock Geology
Early to middle Devonian Old Red Sandstone dominates the bedrock on the Andrée Land peninsula. The characteristic red sandstone from the Wood-Bay formation is found in the inner part of Woodfjorden and stretches northwards along the fjord to Kapp Auguste Viktoria, which is ~25 km south of Vårfluesjøen (Dallmann and Elvevold, 2015).
The bedrock in the Vårfluesjøen catchment consists of clastic sedimentary rocks from the Andrée Land group. The bedrock types are mainly gray shale, siltstone, and fine-grained sandstone from the Grey Hoek formation that was deposited in the Devonian Graben system (Eitel et al., 2002; Dallmann and Elvevold, 2015).
Geomorphology
The Vårfluesjøen catchment area (Figure 1) is characterized by u-shaped valleys in a rounded mountainous landscape, where the highest peaks range from 500 to 700 m a.s.l. In the flat valley bottoms, the rivers bring sediment-laden meltwater from the glaciers upstream of Vårfluesjøen into the lake. The meltwater rivers then separate onto a sandur plain through a mature braided channel system (Figure 3C).
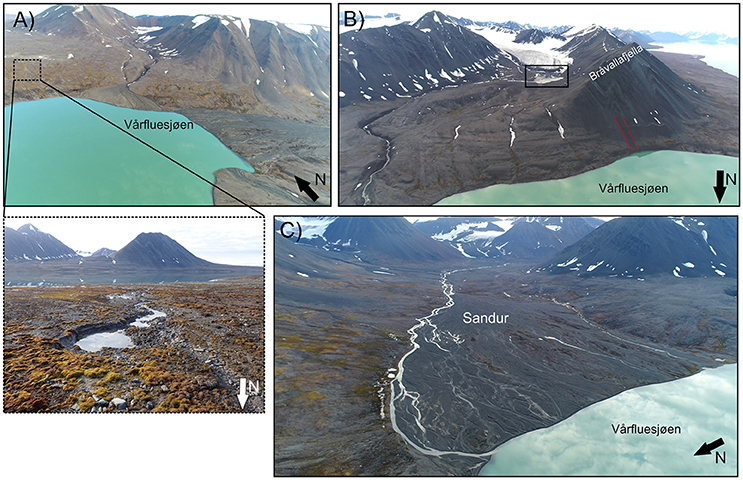
Figure 3. Pictures from the Vårfluesjøen catchment showing (A) the inlet from north with the delta fan. Dotted rectangle indicates the area with slope failure, as shown in the picture below. Smaller pit is ~1–2 m wide. (B) Stratusdalen with the terminus of Bybreen. Note the black rectangle showing a smaller lake upstream from Vårfluesjøen. The red dotted line suggests the minor avalanche track down from Bråvallafjella. (C) Main valley in the Vårfluesjøen catchment with the prominent sandur plain (~450 m wide).
The large sandur plain from the main valley (Cirrusdalen) acts as a local sediment sink where the coarsest material is deposited. The delta-fans at the mouth of Stratusdalen (Figure 3B) and north of Vårfluesjøen (Figure 3A) also have a similar function, as they collect the coarsest material transported by the meltwater rivers. Upstream from both delta fans, incised channels funnel the meltwater toward Vårfluesjøen. In Stratusdalen, the meltwater passes through a local sediment sink, as a lake is present in the glacier foreland of Bybreen (black square in Figure 3B).
The gently sloping landscape surrounding Vårfluesjøen limits any potential source of avalanches to the lake. The slope down from Bråvallafjella (Figure 3B) is ~30.5° but only show minor avalanche tracks, indicated by the red dotted lines in Figure 3B. North of Vårfluesjøen, smaller incisions (2–3 m wide) occur due to minor slope failures (dotted square in Figure 3A). Similar features with smaller incisions can also be seen on the southern side of the lake, as seen in Figure 3B.
Glaciers
Today, there are four glaciers (Bybreen, Uglebreen, Salomonbreen, and Grennabreen) in the Vårfluesjøen catchment (Figure 1). The largest is Uglebreen (79.6939° N 14.5341° E), which covers 2.57 km2 and is located upstream from Vårfluesjøen in the main valley. The glacier ranges in elevation from 400 to 150 m a.s.l. The valley glacier Bybreen is located in Stratusdalen (79.6964° N 14.4296° E), covering an area of 2.29 km2. Its headwall is located at ~500 m a.s.l. The two largest glaciers in the catchment have a northerly aspect. Two smaller cirque glaciers, Salomonbreen (79.7046° N 14.5882° E) and Grennabreen (79.7253° N 14.5906° E), covering 0.66 and 0.15 km2, are found in Cirrusdalen and Grennadalen, respectively. They both have a westerly aspect and range in elevation from 500 to 200 m a.s.l. (Salomonbreen) and from 350 to 200 m a.s.l. (Grennabreen).
Methods
During a field campaign to Vårfluesjøen in August 2014, two sediment cores (Table 1) were retrieved using a piston corer (Nesje, 1992) equipped with a 110 mm diameter 6 m long PVC tube (VAP114 and VAP214). In addition, five surface sediment cores were extracted using an Uwitec gravity corer with a 90 mm diameter core tube (VAD114, VAD214, VAD314, and VAD514). All of the coring was performed from an inflatable raft during ice-free conditions.
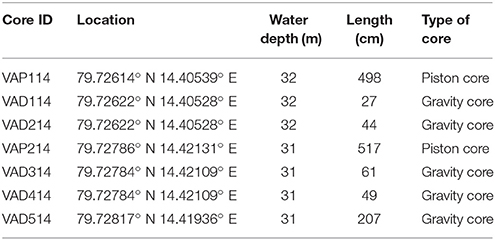
Table 1. Overview of sediment cores retrieved from Vårfluesjøen.
Prior to the coring, the lake was surveyed using a Malå Geoscience ground-penetrating radar (GPR) to map the water depth (Figure 2) and the soft sediment infill in Vårfluesjøen. The survey was conducted using a 25 MHz GPR antenna placed in two 6 m PVC tubes and towed behind a rubber boat. Two optimal coring locations where found based on this survey, showing a flat lake bottom and undisturbed sediment package (Figure 4).
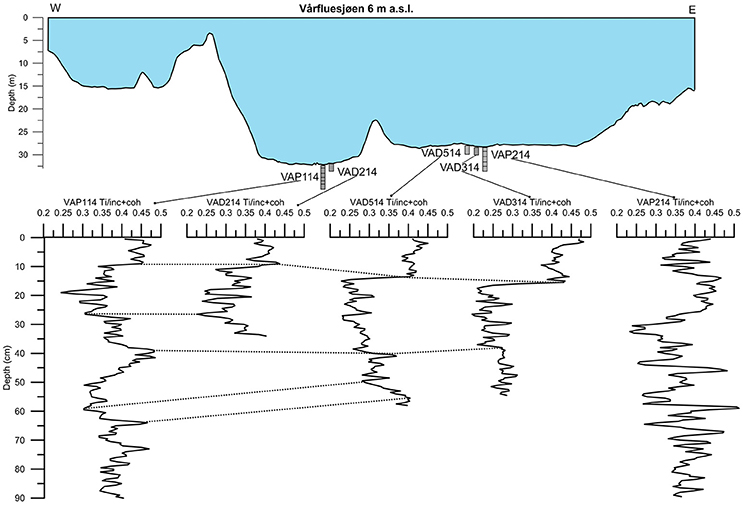
Figure 4. Transect through the three basins of Vårfluesjøen from west to east (red line in Figure 2). The relative position of the piston cores (VAP) used in this study are plotted together with the gravity cores (VAD). The sediment cores are visually matched based on the Ti/inc+cohderived from the ITRAX XRF scanner. The dotted lines between the different cores indicate correlation between the different cores derived from Vårfluesjøen. Based on this, it is suggested that the piston core VAP114 holds the most complete sediment sequence.
Laboratory Analyses
The cores were split lengthwise, and the two parts (one reference and one working part) were placed in a cooling room (~4°C) for storage. Prior to the laboratory analyses, the sediment cores were visually logged (with respect to color and visual characteristics) and photographed using a Geoscan V linescan imaging camera from Geotek Ltd.
Non-destructive Scanning Techniques
The magnetic properties of the sediments from both the piston and surface cores were analyzed using a Coresusc MkIII with a Bartington MS2E sensor for down core variations of magnetic susceptibility (MS). The resolution of the scan was set to 5 mm, and total lengths of 498 cm (VAP114) and 520 cm (VAP214) were measured.
Both piston cores from Vårfluesjøen were scanned using a non-destructive X-ray fluorescence (XRF) ITRAX core scanner from Cox Analytics. The XRF surface scans of VAP114 (498 cm) and VAP214 (520 cm) mapped out the concentration of elements, ranging from aluminum (Al) to uranium (U), and were completed at 200 μm resolution, with a 10 s. dwelltime, using a chromium (Cr) tube with a current of 30 kV and 50 mA, respectively. The total counts from the XRF scan of VAP114 revealed a median of 24,773 kcps (15th percentile: 23,964 and 85th percentile: 25,846) while the mean square error (MSE) of the data set resulted in a median of 1.55 MSE (15th percentile: 1.44 and 85th percentile: 1.66). The results from the XRF scanner are regarded as semi-quantitative because the element data are given as counts per second (cps) (Croudace et al., 2006). To account for changes in water content and organic matter, the elemental data presented here have been normalized by the sum of incoherent and coherent scattering (e.g., as in Kylander et al., 2011) following Davies et al. (2015).
High-resolution X-ray CT scanning was performed using a ProCon Alpha Core CT scanner. The helix scan of each core part was performed on split cores with a voxel (volumetric pixel) size of 51 μm, using a tube voltage of 120 kV, 750 μA current, and an exposure time of 250 ms. The upper part of VAP114 was scanned using 140 kV tube voltage, 700 μA current, and a 250 ms exposure time. A total of 66,632 X-ray slices from the upper 398 cm of VAP114 were then reconstructed using the median and the ring artifact filter in the Volex software program (ProCon X-ray gmbh). Due to high computational demand when analyzing the CT slices, each voxel was binned four times, resulting in a voxel resolution of 253.63 μm. The processing, visualization, and analysis were accomplished using Avizo Fire (FEI) software. CT numbers are given as grayscale units ranging from 0 to 65,536 (16-bit), which indicate relative density differences in the sediment core, as the photoelectric effect is minimal above 100 kV (Wellington and Vinegar, 1987). The grayscale values were extracted along a 1 × 1 cm profile at the center of VAP114 and re-sampled at a resolution of 200 μm (total length = 398 cm) Avizo Fire.
To quantify discrete particles within the core, the 99th percentile grayscale value was used as a segmentation threshold, and the number of particles larger than a single voxel (253.63 μm) exceeding this threshold within each cm down core was counted (see Figure 5). The size distribution (diam. eq.) of the particles ranged from 254 to 1,878 μm, with a median of 366 μm (15th percentile: 319 μm and 85th percentile: 597 μm), meaning that the 99th threshold reveals the number of sand-sized particles per cm3 in VAP114.
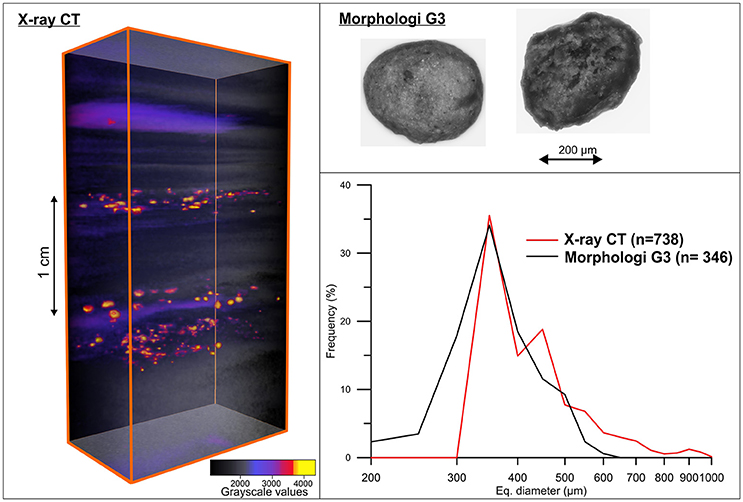
Figure 5. Selected interval from VAP114 visualized by the X-ray CT. Here, the grayscale threshold is set to highlight the sand-sized particles obtained using the 99th percentile of the grayscale values, i.e., the less dense material is not shown (background deposits). Upper right: Two examples, from selected intervals in VAP114 (95 cm and 122 cm), of the particles measured by the Morphology G3. Lower right: A comparison of the frequency (percentage) of particle sizes counted by the X-ray CT and measured by the Morphologi G3. Note logarithmic x-axis.
Bulk samples from selected intervals in VAP114 were extracted to verify the sand-sized particles found using the X-ray CT. An automated microscope (Morphologi G3 from Malvern Instruments) was used to count and characterize the bulk samples after they were sieved at 250 μm. The Morphology G3 has a 2.5x magnification objective lens, which covers the size range from 13 to 1,000 μm. The result of the microscopy at the selected intervals at 95 and 122 cm in VAP114 is shown in Figure 5 together with the particles counted at every 1 cc down core in VAP114 using the X-ray CT.
Bulk Sediment Samples
Volume-specific (1 cm3) samples extracted at 0.5 cm intervals from the uppermost 398 cm of VAP114 (n = 795) and uppermost 411 cm of VAP214 (n = 819) were dried overnight at 105°C and subsequently ignited at 550°C for 1 h to measure water content (WC), dry bulk density (DBD) (Blake and Hartge, 1986) and loss-on-ignition (LOI) (Dean, 1974; Heiri et al., 2001).
Grain size distributions in VAP114 were measured for every 4 cm using a Mastersizer 3000 laser diffraction instrument with a HydroLV dispersion unit (Malvern Instruments). Diatoms or sponge spicules as well as organic matter could potential influence the grain size distribution and must be removed prior to grain size measurements. No diatoms or sponge spicules were present after examination of the sediments, at selected depths throughout VAP114, using the Morphologi G3 and the 2.5x magnification objective lens. The samples were therefore pretreated with 35% H2O2 to remove the organic matter following Vasskog et al. (2016) and sonicated for 180 s prior to the measurements. The refraction index was set to 1.80, the absorption index to 0.01, and all samples were measured for 20 s in a 0.05% Calgon [(NaPO3)6] solution at a stirring speed of 2,400 rpm. The grain size distribution from each sample was averaged over five measurements.
Rate of Change
By dividing the change in a measured sediment parameter (e.g., the grayscale values from the X-ray CT) by the change in time we can measure the rapid change in the sedimentation regime in Vårfluesjøen (Støren et al., 2010). The rate of change (RoC), see Figure 9A, was calculated using de-trended (300 year running average) annually resampled grayscale data from the X-ray CT, to which a 10-point average was applied to overcome the background noise. Any sudden change in input of material to the lake shows a positive response in the physical sediment properties (i.e., the grayscale values from the X-ray CT). We used a threshold following the 90th percentile to define the positive RoC in the grayscale values from VAP114 in Vårfluesjøen.
Chronology
The top-most sediments (10 cm) of VAD114 were subsampled continuously every cm, with slices of one cm, for 210Pb dating at the Laboratory for Isotope Dating and Environmental Research, Institute of Geological Sciences at the Polish Academy of Science. The measurements were done by alpha spectrometry using an Ortec Alfa Ensemble spectrometer. Based on the result from the radionuclide measurements (Table S1), the constant rate of supply (CRS) model was used to estimate the ages for the surface sediments (Binford, 1990).
Materials from VAP114 were sampled at selected intervals (n = 8) for 14C radiocarbon dating (see Table 2). As only fragmented macrofossils were found, it was not possible to identify the species for each sample. Sampled materials were dried at 50°C and placed in sterilized and sealed vials before they were sent to the Radiocarbon Dating Laboratory at Lund University in Sweden for radiocarbon dating using an accelerator mass spectrometer. Prior to the radiocarbon dating, the sampled materials were pretreated with HCl to remove any carbonates on the macrofossils.
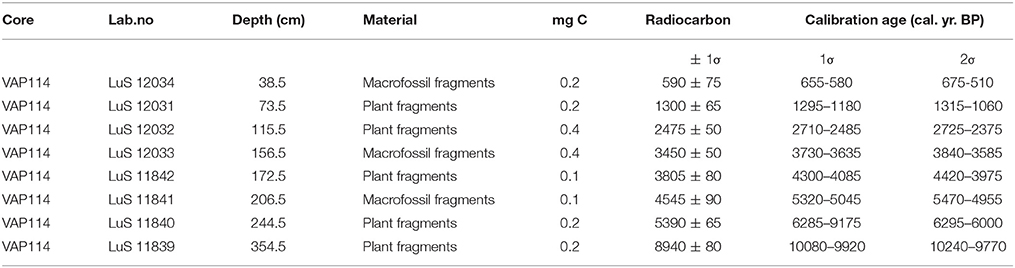
Table 2. Results from radiocarbon dating of macrofossil remains from selected intervals in VAP114.
The age-depth model was constructed in “R” with the Bayesian framework calibration software code Bacon v.2.2 (Blaauw and Christen, 2011), using the IntCAL13 calibration curve (Reimer et al., 2013). The result from the 210Pb dating was used along with the ages from the radiocarbon dating to build an age-depth model for VAP114.
Results
Sediment Cores From Vårfluesjøen
Piston cores VAP114 and VAP214 were taken in the two deepest basins of Vårfluesjøen (Figure 2). The short gravity cores (VAD114, VAD214, VAD315, and VAD514) contained undisturbed surface sediments based on the preserved sediment–water interface in addition to sediments that overlapped with the long piston cores. Based on the matching of the Ti/inc+coh (shown in Figure 4) and the lithostratigraphy, we believe that VAP114 covers the top-most sediments. We find a distinct feature in the sediment at 10 cm in both the short gravity core (VAD214) and the long piston core (VAP114) which is also evident in the Ti/inc+coh in both sediment cores. By comparing VAD314 and VAP214, it appears that a minimum of 61 cm of the top-most sediment in VAP214 is lacking. Based on this, we decided to continue with in-depth analyses of VAP114, as it contained the complete sediment stratigraphy of Vårfluesjøen. The down core variability in MS together with the lithostratigraphy from both piston cores (VAP114 and VAP214) broadly show the coherency in sediment infill in both basins in Vårfluesjøen (Figure 6). However, it also suggest variability between the two sediment cores mainly due to the different sedimentation rates between the two sediment basins (i.e., VAP214 is located closer to the main inlet of Vårfluesjøen).
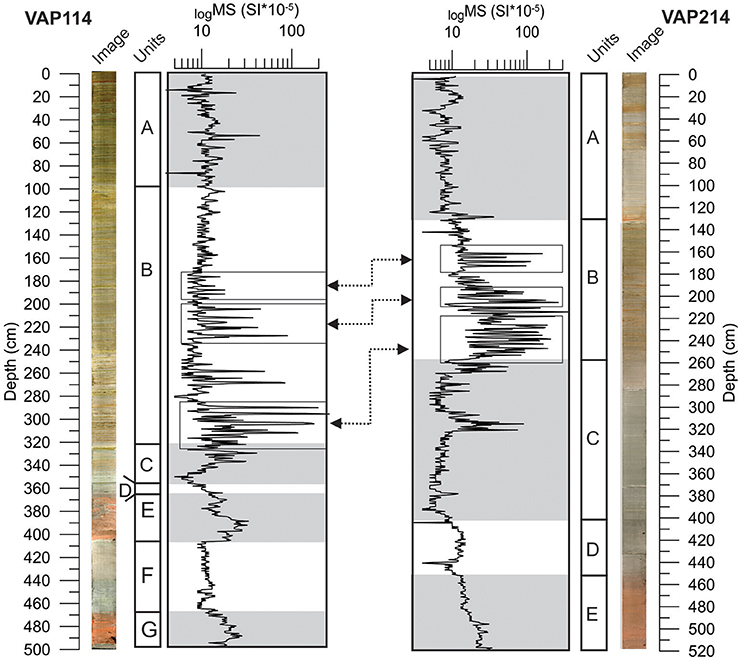
Figure 6. Magnetic susceptibility of VAP114 and VAP214 on a log scale. The two sediment cores from Vårfluesjøen are divided into units based on lithostratigraphy. The small squares suggest common features in the MS results.
VAP114
The sediment cores were subdivided into different units based on the lithostratigraphy (visual logging). The results from the logging, bulk measurements, and non-destructive scanning techniques from the VAP114 core are presented in Figure 7. Some of the geochemical elements measured on the ITRAX scanner were rejected due to low signal-to-noise ratio. Therefore, we report only the geochemical elements showing higher than 300 counts per second: silicon (Si), potassium (K), calcium (Ca), titanium (Ti), manganese (Mn), and iron (Fe).
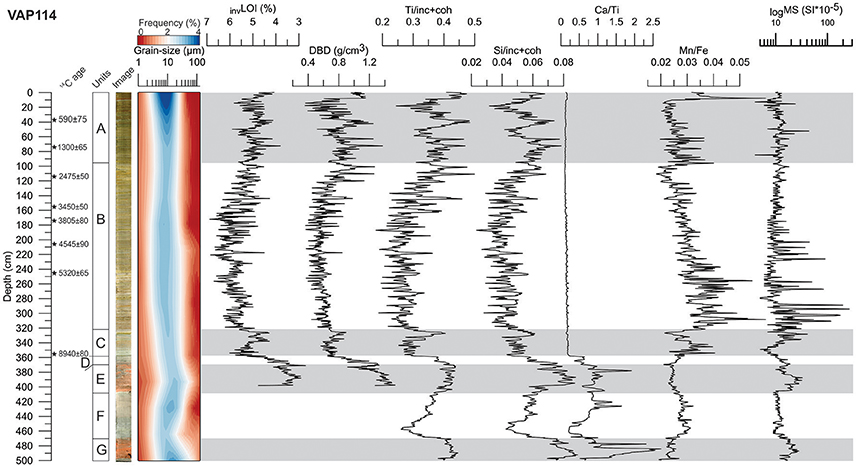
Figure 7. Selected magnetic, physical, and geochemical properties of VAP114. From left to right: 14C-ages ± 1σ from selected intervals; core image of VAP114; units (A–F) found in VAP114 based on lithostratigraphy; grain size frequency presented as surface plot (Beierle et al., 2002); loss-on-ignition (LOI); dry bulk density (DBD); ratio between titanium and the sum of incoherent and coherent scattering (Ti/inc+coh); ratio between silica and the sum of incoherent and coherent scattering (Si/inc+coh); ratio between calcium (Ca) and titanium (Ti); ratio between manganese (Mn) and iron (Fe); magnetic susceptibility (MS).
Unit G (498–471 cm)
The bottom-most part of VAP114 consists of gray coarse silt to sandy sediments, with shell fragments at the very bottom. A sharp transition to red-brown sediments is found at 495 cm, where surface MS shows an increase from ~15 to 26 SI 10−5. Above this, we find massive sediments for the next 12 cm, changing to more alternating light gray and reddish brown sediments toward the top of the unit (471 cm). The geochemical properties and MS show a similar trend, as both the Ti/inc+coh and Si/inc+coh are high (~0.41 and ~0.08, respectively) at the interval between 495 and 471 cm depth. Here, the Ca/Ti ratio shows distinct peaks at 484 and 477 cm.
Unit F (471–408 cm)
The first 27 cm from the base of unit F consists of gray sediment, with a medium silt grain size. At 444 cm, the grain size shifts toward coarser silt. Here, there is a change in color to lighter gray sediments. The whole unit is massive, apart from some slight laminations from 449 to 444 cm. At the very top of the unit, we find a sharp transition in color, with multiple shells and shell fragments situated in a marked horizon at the transition to the unit above.
Both surface MS, Ti/inc+coh and Si/inc+coh show a decreasing trend from the lower unit (G), as the surface MS decreases to ~10 SI 10−5 at 467 cm and stabilizes at that level until 412 cm. A similar pattern is seen in the Ti/inc+coh and Si/inc+coh, as they both drop from ~0.42 and ~0.075 to ~0.3 and 0.05, respectively, at bottom of the unit. At 456 cm, the values increase again toward the top of the unit. A similar response is seen in the Ca/Ti ratio, which goes from 0.2 to ~1.25 from 456 cm to the top of unit (408 cm).
Unit E (408–371 cm)
Massive reddish brown sediments are found from 408 to 386 cm. Generally, the grain size is coarse silt at the base of the unit, and a transition to less coarse sediments (medium silt) occurs at 386 cm. The surface MS is high in the first 22 cm of the unit (~20 SI 10−5) with a declining trend toward the top (~12 SI 10−5). Ti/inc+coh shows a steady signal, with an average of 0.26. The Si/inc+coh shows a distinct increase at 399 cm; following this, it drops from ~0.085 to ~0.07 toward the top of the unit. The Ca/Ti ratio is generally high in the unit, with marked spikes at 404 and 377 cm. The uppermost 22 cm of the unit show more chaotic sediment, with alternating gray and reddish brown sediments. Toward the top of the unit, there is a gradual transition toward the unit above (D).
Unit D (371–357.5 cm)
The unit consists of gray to light gray sediments, with shell fragments at 365.5 cm. The whole unit is massive and shows a fine to medium silt grain size. A steady decline in the surface MS from 12 to 6 SI 10−5 occurs from the base of the unit to the top. A similar trend is seen in the dry bulk density (DBD), which decreases from 1.26 to 0.65 g/cm3; in the same interval, the loss of ignition (LOI) increases from 2.7 to 5.5%. A decline is also seen in the standardized grayscale values as we move from 2.2 to 0.56 at the top of the unit. The Mn/Fe and Ca/Ti ratios maintain similar values to those in the unit below, with an average of 0.024 and 0.4 throughout the unit, respectively.
A distinct layer (0.5 cm) marks the transition to the unit above, as the color is distinctly different (brown). Here, the Ca/Ti ratio drops distinctly at the transition from unit D to C and stays stable at 0.2 throughout the whole unit.
Unit C (357.5–322 cm)
The lowermost 12 cm of unit C consists of gray-colored sediments with sporadic (0.7 cm thick) brown bands. From 347 cm, the sediments alternate between 0.5 cm layers of reddish brown and gray sediments until 341 cm. Above this, we find massive sediments toward 326 cm, where a light yellow layer of fine sediments occurs. A distinct drop is seen at the transition from the unit below (D) in the magnetic, geochemical, and physical properties of VAP114. Following this, the surface MS increases from 6 to 21 SI 10−5 in the first 18 cm of the unit. In this interval, both the Ti/inc+coh and Si/inc+coh are stable and show an average of ~0.28 and ~0.05, respectively. The Mn/Fe ratio exhibits moderate variability in the first 18 cm of the unit, with values ranging between 0.02 and 0.04. The standardized grayscale values show small variability in the first 24 cm of the unit, with an average value of −0.4.
Gray sediments with diffuse laminations dominate the uppermost part of the unit. The grain size is generally finer than in the unit below, as unit D consist of fine silts. At 326 cm, a distinct yellow layer is found, and a marked increase in surface MS, Ti/inc+coh, Si/inc+coh, and DBD occurs. The number of particles is low throughout the unit; however, a distinct peak occurs at 346 cm, where we find 53 particles/cm3. The transition toward the unit above (unit B) is gradual, and we see a progressive change in color from gray to more reddish brown sediments.
Unit B (322–98 cm)
Reddish gray color dominates the sediments in unit B; however, sporadic laminated sediments occur throughout the unit with a reddish brown color. Individual layers (0.2–1 cm thick), dark gray at the base and light yellow at the top, occur at 102.5, 111, 120.5, 142, 142, 151.5, 160, 177, 194.5, 188, and 218 cm. The grain size is mainly fine silt throughout the unit, but coarser material is found at the base of the above-mentioned layers.
The results from the DBD, grayscale values, Ti and Si show a similar pattern in the first part of this unit, from 322 to 165 cm. Here, the DBD values are low, with an average of 0.68 g/cm3. In the same interval, we find low Ti/inc+coh and Si/inc+coh (average of 0.26 and 0.04, respectively). The standardized grayscale values show an average of −0.42 from the bottom of the unit toward 165 cm. The interval from 322 to 165 cm also shows the highest LOI values throughout VAP114, with an average LOI percentage of 5.6%.
The magnetic properties show the largest variability and the highest values throughout VAP114, with peaks at 316 cm (110 SI 10−5), 308.5 cm (177 SI 10−5), 300 cm (263 SI 10−5), 294.5 cm (197 SI 10−5), 273 cm (84 SI 10−5), and 263 cm (50 SI 10−5). The interval between 230 and 202 cm shows similar variability, with peaks at 229, 222, 217.5, 213.5, and 206 cm. The Mn/Fe ratio exhibits its highest variability in the interval from 317.5 to 250 cm, with distinct peaks at 313, 308, 299, 289, 279, 271, 265.5–263, 257, and 253.5 cm. Furthermore, this ratio shows high variability from 243 to 233 cm. From this point, the Mn/Fe ratio show a gradual decreasing trend, with less variability and values ranging from 0.03 to 0.02.
The numbers of particles (above 253.62 μm) identified from the X-ray CT are high in the intervals from 312–293, 276–271, 241–201, and 145–103 cm. The interval from 145 to 103 cm shows the highest numbers of particles per cm3 for the entire core, with distinct peaks at 128 cm (n = 56), 120 cm (n = 72), 103 cm (n = 103), 110 cm (n = 52), and 105 cm (n = 76).
From 165 cm toward the top of the unit, the DBD, Ti/inc+coh, and Si/inc+coh show a distinct increasing trend, as DBD increases from 0.55 to 1.01 g/cm3, Ti increases from 0.28 to 0.35, and Si increases from 0.04 to 0.056. Here, the standardized grayscale values increase from −0.43 to 0.01. The surface MS shows a gradual increase from ~9 to ~13 (SI 10−5) toward the top of the unit. The transition to the unit above (unit A) is continuous, with the color gradually changing to dark gray.
Unit A (98–0 cm)
Grayish brown sediments dominate the top-most unit of VAP114. Diffuse laminations are found from the base of the unit toward ~49 cm. The grain size is fine silt throughout the unit. Small decreases in DBD, Ti, and Si are found at the base of unit A. Following this, the values for DBD are 0.84 g/cm3 on average, ranging from 82 to 60 cm. There is an increase in the three parameters between 50 and 40 cm, with DBD, Ti/inc+coh, and Si/inc+coh values rising from 0.8 to 1 g/cm3, 0.35 to 0.48, and 0.044 to 0.06, respectively. A similar pattern is seen in the standardized grayscale value, which increases from −0.3 to 0.13 in the interval between 95 and 65 cm. A slight decrease then occurs between 61 and 51 cm, before the value increases to 0.65 between 50 and 40 cm. The Mn/Fe interval exhibits some variability from 98 to 61 cm, with values ranging from 0.02 to 0.38.
Throughout the unit, we find multiple layers (0.5–1 cm thick) with similar characteristics as described in unit B at 78, 73, 64, 44, 41, 39.5, 29.5, 28, 14, 13, and 8 cm. The distinct peak in the lithostratigraphy coincides with the peak values in DBD, Ti/inc+coh, Si/inc+coh, and the gray values from the X-ray CT. Grain size measurement of a selected peak (73 cm) suggests a fining upwards trend in the individual layer. The distribution of sand-sized particles in unit A is low, although three distinct peaks at 95, 83, and 60 cm show layers of particles above 253.63 μm.
From 49 cm, we find distinct laminations toward the top of the sediment core. Laminated sediments with generally lower values of DBD, Ti/inc+coh, and Si/inc+coh (the averages are 0.65 g/cm3, 0.35 and 0.049, respectively) characterize the interval between 35 and 9 cm. From 35 to 9 cm, the standardized grayscale value shows high variability, with a mean of −0.57. A distinct increase is found at 8.5 cm, where the value reach 0.53 before steadily declining toward the top of the core. At 8.5, a distinct peak is found in the Mn/Fe ratio followed by a steady decrease toward the top of the unit.
Age-Depth Model
Based on the intrabasin inspection (Sediment Cores From Vårfluesjøen and Figure 4), our interpretation is that the piston core (VAP114) contains most of the top sediments (< 1 cm) as we find a distinct feature in the sediments, at 10 cm, that we can match between the two sediment cores. We therefore develop a composite core from VAD214 and VAP114 using both the 210Pb-ages from VAD214 and 14C-ages from VAP114.
As in most high Arctic lakes, low biological production and low organic content makes it challenging to build a robust chronology for Vårfluesjøen based on radiocarbon dating (Snyder et al., 1994). The result from the radiocarbon dating of VAP114 showed adequately carbon yields, ranging from 0.1 to 0.4 mg C, and within the proposed limit of 0.05 mg C by Oswald et al. (2005). The individual layers found throughout VAP114 were most likely deposited instantaneously and introduce uncertainty into the age-depth modeling (Rubensdotter and Rosqvist, 2009).
Discussion
Unraveling the Sediments Deposited in Vårfluesjøen
The results from the multi-proxy analyses of the sediment cores from Vårfluesjøen suggest a marine phase first and then continuous lacustrine sedimentation beginning c. 10200 ± 270 cal. yr. BP. The main objective of this study is to unravel the different earth surface processes in the Vårfluesjøen catchment that have contributed with sediments to the lake. By visualizing (X-ray CT) and characterizing (physical sediment properties) the sedimentary signal from Vårfluesjøen, we can distinguish between four main types (1) the marine phase, (2) the Neoglacial phase, (3) snowmelt runoff, and (4) aeolian activity.
Marine Phase (Until c. 10200 Cal. yr. BP)
The bottom-most units of VAP114 (units G, F, E, and D) and VAP214 (units E and D) are interpreted to be deposited in a marine environment based on the presence of shells (Mya truncata), shell fragments and distinctly gray- and reddish-colored sediments compared to the rest of VAP114. The characteristic red-colored sediments differ significantly from the rest of the sediment core from Vårfluesjøen. In Woodfjorden, a similar sediment characteristic is also found in marine sediment cores (Hansen, 2014).
Devonian sedimentary rocks dominate the inner part of Woodfjorden and outwards to Kapp Auguste Viktoria. In the inner part of Woodfjorden, the red color is evident in the bedrock outcrops. This is most likely the source of the reddish sediments found in the marine sediment cores from Woodfjorden as well as in the marine deposits found in Vårfluesjøen. When Vårfluesjøen is isolated from the sea, the catchment area of the lake is located within the Grey Hekla Hoek formation, suggesting a different bedrock source compared to the marine deposits.
High Ca/Ti ratios along with high Ca have previously been used as a diagnostic indicator for marine conditions (Piva et al., 2008). Balascio et al. (2011) used increased Ca values to indicate marine-influenced sediments in a lake on Lofoten Island in Norway. High Ca values reflect the presence of calcium carbonate derived from the shell material in the sediments or coating on the mineral grains. Above, we reported an abrupt drop in Ca/Ti at 357 cm in VAP114. This coincides with a distinct lithostratigraphy boundary, suggesting a transition from marine to lacustrine conditions. Based on the age-depth model (Figure 8) of VAP114, the transition from marine to lacustrine conditions occurred c. 10200 ± 270 cal. yr. BP.
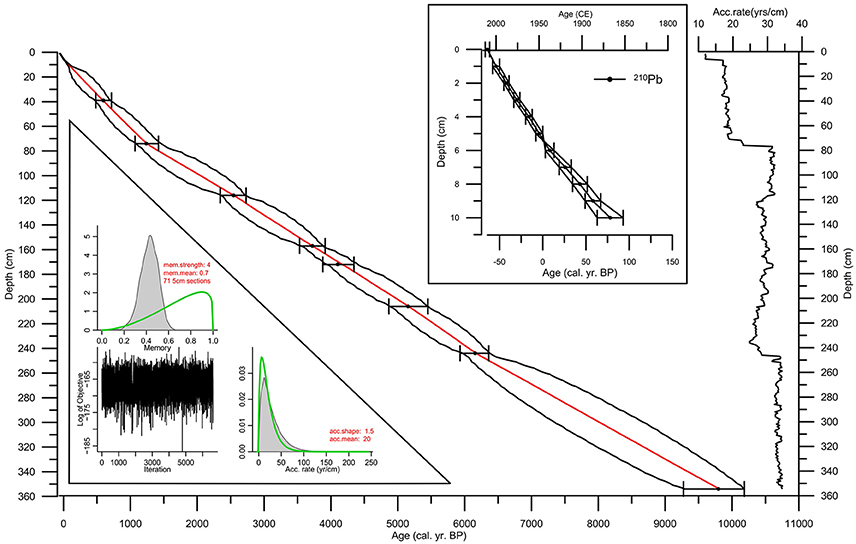
Figure 8. The upper-most 210Pb-dated sediments in VAP114 are shown in the upper inset figure. The age-depth model was constructed using the R-package Bacon v.2.2 (Blaauw and Christen, 2011) and includes the 210Pb-dated sediments in the top of the core (inlet figure) and the radiocarbon dates from Table 2. The error bars indicate the 2σ uncertainty range for each radiocarbon sample. The reconstructed sedimentation rate (years/cm) is shown on the right-hand side. Also, the output panels from the age-depth modeling using the Bacon v.2.2 is found in the lower left inset figure.
Glacier Derived Sediments (Inorganic Detrital Deposits)
Increased count rates of Ti and Si in distal glacier-fed lakes have previously been interpreted to reflect inputs of inorganic detrital material resulting from catchment processes, such as glacier activity or flood events (Croudace et al., 2006; Bakke et al., 2009; Røthe et al., 2015). DBD is a measure of the density of the sediments and is indicative of how tightly a matrix of particles is packed. Based on this, DBD has been used to quantify the variability of inorganic sedimentation in catchments dominated by glaciers (Bakke et al., 2005; Vasskog et al., 2012). The positive correlation between both geochemical elements and DBD (Table 3) suggest that the variability in these parameters reliably quantifies the amount of inorganic detrital input to Vårfluesjøen.
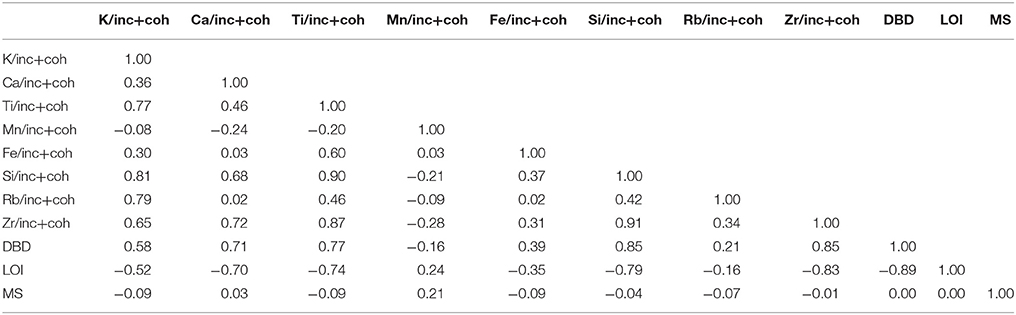
Table 3. Correlation coefficients of selected parameters from VAP114.
The lacustrine sediment deposits in Vårfluesjøen are dominated by materials with a fine silt grain size distribution (Figure 7). Glacier erosion typical delivers a large amount of silt and clay, which can easily be transported by meltwater streams and deposited in distal glacier-fed lakes. Upstream from Vårfluesjøen, the catchment area includes several sediment traps, as presented in section Geomorphology. These local sinks act as a filter for the coarser materials in the catchment of the lake, making the input of coarser inorganic detrital deposits to Vårfluesjøen through the meltwater streams negligible. Hence, it is believed that the coarser materials are transported to Vårfluesjøen during episodic events, such as strong aeolian activity, extreme precipitation events, or avalanches.
Today, four glaciers covering 5.4 km2 of the total catchment (~27.8 km2) influence the catchment of Vårfluesjøen. We argue that most inorganic detrital material is glacigenic as this is typical for sites where a large part of the catchment is glacier-covered (e.g., Roland and Haakensen, 1985; Leemann and Niessen, 1994). We assume that the larger glacier produces more meltwater and thus transports more sediment to the lake (Leonard, 1997). The strong negative correlation (Table 3) between the inorganic detrital parameters and LOI throughout the lacustrine part of the sediment core supports this, as the production of the fine-grained sediments will override any other input from the catchment. Hence, in periods with reduced inorganic detrital material inputs, the LOI is high, and vice versa (Karlèn, 1976; Nesje et al., 2000). Therefore, higher Ti, Si, and DBD values are interpreted to reflect higher glacier activity through enhanced glacier erosion in the Vårfluesjøen catchment and/or greater glacier melt and sediment transport to the lake (Figure 11D).
Most glaciers in Svalbard today are classified as polythermal, i.e., they are cold-based at their margins and depending on their thickness, temperate at the base in central parts of the glacier (Hagen et al., 1993). It has also been argued that several smaller glaciers in the central part of Svalbard underwent a thermal cycle during the “Little Ice Age” (LIA) (Sevestre et al., 2015) shifting from an early-LIA cold-based state, to a temperate state during the LIA maximum before returning to a cold-based state post-LIA (Lovell et al., 2015). Such changes could have led to surge-type behavior when the glaciers changed from an initial cold-based state to a temperate state, with increased sliding before returning to a cold state. However, we find no evidence for any surge-type behavior in the Vårfluesjøen catchment (i.e., looped moraines and/or crevassed moraines; Farnsworth et al., 2016). Thus, we regard the deposition of continuously laminated inorganic material in the lake to reflect the size of the glaciers in the catchment.
Snowmelt and Deposition of 2–10 mm Layers of Silt
Superimposed on the general trend in inorganic detrital sedimentation in the lake are distinct peaks in DBD, Si, Ti, and grayscale values. Visually, this coincides with the individual layers found in units A and B, as discussed above. Grain size measurements of selected distinct peaks, e.g., at 73 cm (Figure S1) suggest a fining upwards trend within the layers. This is indicative of short-lived events, as similar sediment imprints have been linked to increased discharge in the upstream river channels bringing coarse inorganic material into the lake (Lamoureux, 2000; Sletten et al., 2003; Francus et al., 2008).
X-ray CT has been proven valuable for characterization and identification of instantaneous deposits and earth surface processes (Støren et al., 2010; Fouinat et al., 2017; van der Bilt et al., 2018b). The interpretation of the individual layers in VAP114 is based on the rapid input of minerogenic material to Vårfluesjøen and the RoC (time derivate) from the grayscale values was used to objectively identify these event layers (Støren et al., 2010). The result thus records any sudden increases in grayscale values, representing high-density inorganic detrital material, into Vårfluesjøen as a positive RoC, regardless of trends in the background sedimentation. A threshold following the 90th percentile of RoC defines the sensitivity of the model and thereby the recognized layers seen in Figure 9A.
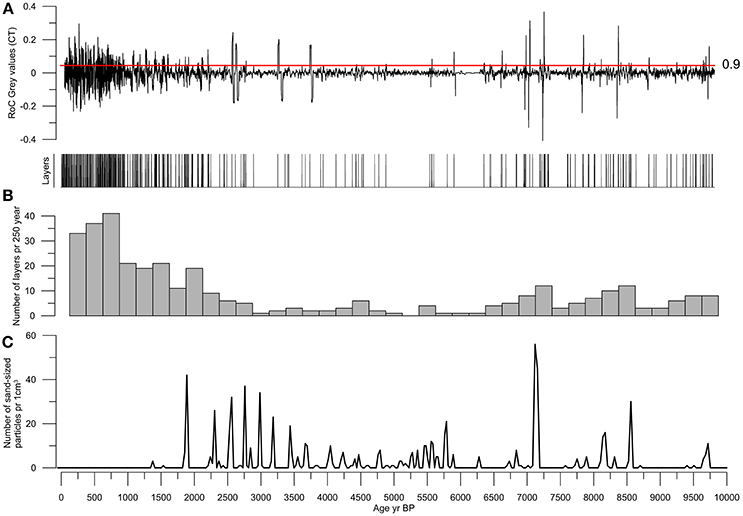
Figure 9. Top part (A) shows the result of the rate of change (RoC) analysis of VAP114 using the grayscale values obtained from the X-ray CT. The red line marks the 90th percentile, which is set as a threshold for recognizing and identifying the event layers. (B) The frequency of snowmelt layers is shown below using a bin size of 250 yr. (C) The frequency of sand-size particles (larger than 255 μm) identified and counted using the X-ray CT is shown against age (cal. yr. BP) for every 1 cm3.
The number of events exceeding the threshold, as seen in Figure 9B, indicate rapid input of minerogenic material to the lake and is interpreted to represent snowmelt events in the Vårfluesjøen catchment. The individual layers show similar sedimentary facies to those found in other places in Arctic and Scandinavian lakes, composed of silty inorganic detrital materials and graded sediments (e.g., Nesje et al., 2001; Bøe et al., 2006; Støren et al., 2008, 2010; Vasskog et al., 2011). In addition, Francus et al. (2008) monitored how clastic sediments can be transported to lake basins by increased river discharge during spring snowmelt. The Vårfluesjøen catchment is currently glaciated, and it is reasonable to argue that snowmelt accompanied by the increased meltwater discharge from the glaciers during the spring and summer melt could deliver sediments to the lake with a similar sedimentary signature.
Aeolian Transported Sand-Sized Particles
The X-ray-CT results, Figure 5, revealed discrete sand-sized particles in matrix-supported layers, although isolated grains were also found throughout units B and C in VAP114, as highlighted in slices 3, 5, and 6 in Figure 10. Thus, the transport and depositional environment for the isolated grains are challenging to interpret. Lamoureux et al. (2002) reported similar isolated grains and discrete poorly sorted layers in the deep sediments originating from extensive aeolian deposits in lake ice. Francus et al. (2008) discussed the depositional environment of sand laminae found in Sawtooth Lake but disregarded aeolian processes based on the lack of any sand source in close proximity to the lake. Instead, they related the sand layers to density flows within the lake basin triggered by summer rain.
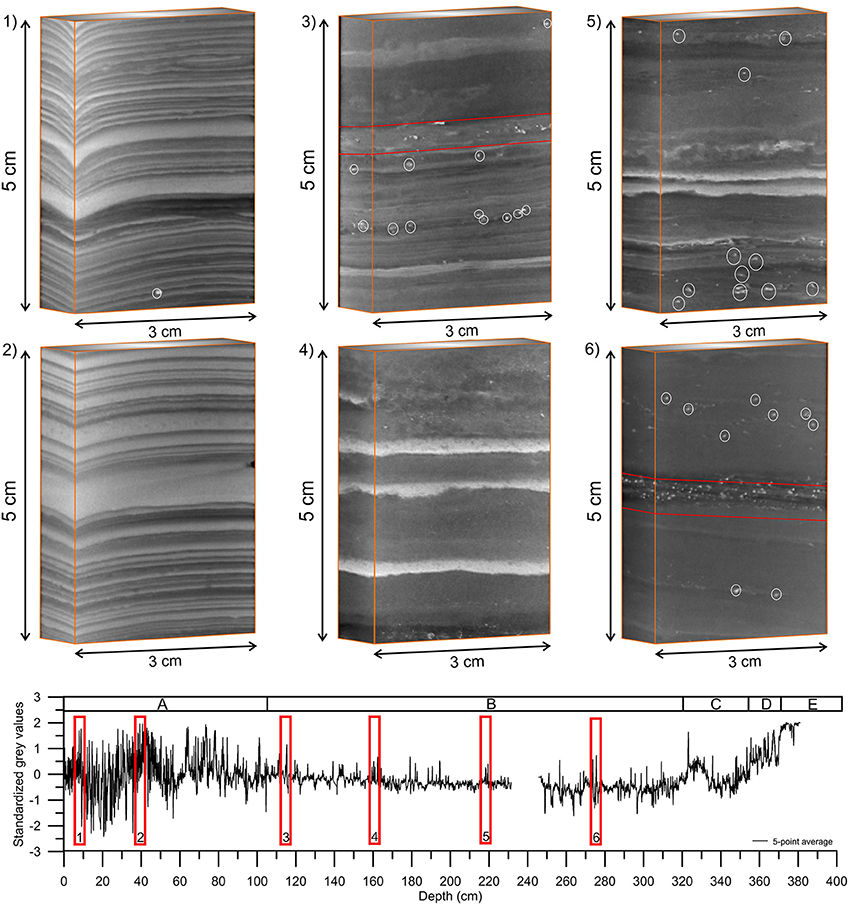
Figure 10. 3D segments (3 × 1.5 × 5 cm) from the CT scan at selected intervals (Slice 1: 7–11 cm; Slice 2: 37–42 cm; Slice 3: 61–66 cm; Slice 4: 160–165 cm; Slice 5: 215–220 cm; Slice 6: 277–282 cm). The grayscale values reveal the relative density of the sediments, with the bright color being the densest. The white circles indicate the distribution of isolated grains (sand-sized particles) while the red lines indicate layers of sand-sized particles. These particles were furthermore mapped out and extracted using the software Avizo throughout VAP114 as seen in Figure 9C. Below: The result from the CT scan shown as standardized grayscale values along a probe in the middle of the different core parts of VAP114. The section from 235–247 cm is missing due to a lack of data from the X-ray CT.
Aeolian processes can transport large particles either directly into the lake or on top of the lake ice during winter (DeVries-Zimmerman et al., 2014). In High Arctic environments, the vegetation cover is sparse, providing abundant material for aeolian activity. Moisture can limit the availability of these sediments, but snow cover in high Arctic regions is not sufficient to hinder erosion from aeolian activity. Therefore, aeolian activity in this region is believed to be the strongest during the winter months, when the moisture supply is limited (Gilbert, 1990).
A potential source of the material for the wintertime aeolian activity to Vårfluesjøen is the valley sandur, located in close proximity to the lake (Figure 3). Typically, Arctic sandar are dry in winter, and strong winds can create sand storms that mobilize a great deal of material in a short time interval. Observations from Bear Lake in Arctic Canada document an example of such a scenario, where aeolian sands were found on the lake ice in 1999 CE and also seen in aerial photographs from 1959 CE (Lewis et al., 2002).
We acknowledge the challenge of interpreting the source and transport mechanism of the sand-sized particles found in VAP114. Therefore, we cannot rule out the possibility of summer rainfall, avalanches onto lake ice during wintertime or ice rafting of beach sand as sources for the sand-sized particles. However, the distance from the lakeshore to the coring point and the water depth at the coring point in Vårfluesjøen provide significant transport and depositional challenges for sand-sized particles. We believe the close proximity to the source and the distinct distribution of particles in VAP114 makes it more likely that aeolian activity during winter was responsible for transporting and depositing the sand-sized particles found in Vårfluesjøen. Therefore, we suggest that the distribution of sand-sized particles reflects past aeolian activity in the Vårfluesjøen catchment.
Environmental and Climatic Implications
We have discussed four different lithological features that are present in the sediment cores from Vårfluesjøen. In the following, we will discuss the climatic implications of these processes dominating the Vårfluesjøen catchment and their delivery of sediments to the lake over the past 10,200 years.
Marine Phase
The relatively higher sea level during the early Holocene caused Vårfluesjøen to be part of the Woodfjorden, as the marine limit in the northern part of Andrée Land is ~40 m a.s.l. (Forman et al., 2004). The above-mentioned isolation contact in VAP114 at 357.5 cm marks the time when Vårfluesjøen became isolated from Woodfjorden. By extrapolating the bottom-most radiocarbon-dated interval in VAP114 (3.5 cm above the isolation contact in VAP114), we find that the lacustrine sedimentation commenced at 10200 ± 270 cal. yr. BP. This is in agreement with work from Salvigsen and Høgvard (2006) suggesting a rapid change in relative sea level between 10,000 and 9,000 14C years ago. This conclusion is based on their tentative shoreline displacement curve, reconstructed by 14C-dated materials, shell, wood, and whalebone from the Bockfjorden area located ~35 km southwest from Vårfluesjøen.
Warm and Wet Early- and Dry Mid-Holocene
From the start of the lacustrine phase in Vårfluesjøen to the mid-Holocene (10200–4200 cal. yr. BP), the input of inorganic detrital material to the lake was low. This period is characterized by the lowest Si/inc+coh and Ti/inc+coh values of the last 10,200 years, shown in Figure 11D as standardized values to facility comparison with other datasets, coinciding with the highest values of LOI (Figure 7). From this, we suggests that the glaciers in the catchment of Vårfluesjøen were small or absent.
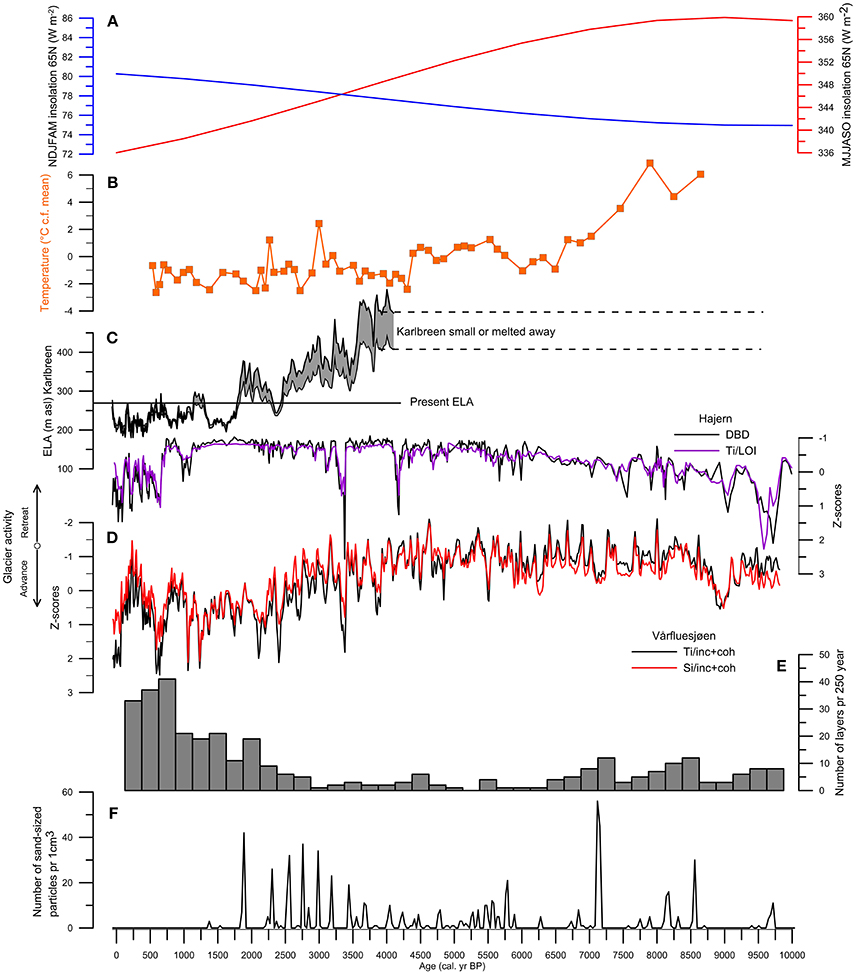
Figure 11. Top part (A) Mean insolation at 65°N for the summer months [May, June, July, August, September, and October (MJJASO)] and the winter months [November, December, January, February, March, and April (NDJFMA)] from (Laskar et al., 2004). (B) Alkenone-based reconstruction of temperature based from van der Bilt et al. (2018a) (C) Reconstructed equilibrium-line altitude (ELA) for Karlbreen from Røthe et al. (2015). (D) The standardized Ti/LOI and DBD values from the record of van der Bilt et al. (2015), at Hajern (Mitrahalvøya), is plotted using purple and black lines, respectively. Red and black line indicates the relative glacier variability upstream from Vårfluesjøen (this study) using standardized Ti/inc+coh and Si/inc+coh values with a 24-point running average (0.5 cm resolution). (E) Number of snowmelt layers recorded in Vårfluesjøen (this study) is shown using a bin size of 250 yr. (F) The frequency of sand-size particles (larger than 255 μm) identified and counted using the X-ray CT is shown against age (cal. yr. BP) for every 1 cm3.
In this period, three intervals−9500, 8500, and 7250 cal. yr. BP—show higher frequency of snowmelt layers in Vårfluesjøen (Figure 11E). In total, significantly more layers (n = 85) are found in the period from 10150 to 7000 cal. yr. BP compared to the period from 7000 to 4000 cal. yr. BP (n = 30), which suggests higher runoff from snowmelt in the early Holocene compared to the mid-Holocene. In sum, this points to a sedimentary regime during the early Holocene in which glaciers were considerable smaller or absent together with a snowmelt dominated runoff regime and possibly snow-rich winters. Between 7000 and 4000 cal. yr. BP the reduced spring snowmelt activity together with increased influx of aeolian sands c. 6,000–5000 cal. yr. BP indicate a shift toward drier conditions during the mid-Holocene.
During the early and mid-Holocene period, other glacier reconstructions from the west coast of Svalbard suggests that many glaciers were small or completely melted during this time interval (Svendsen and Mangerud, 1997; Røthe et al., 2015; van der Bilt et al., 2015; de Wet et al., 2018). Mangerud and Svendsen (2018) postulated that August temperatures in Svalbard were 6°C warmer from 10000 to 9000 cal. yr. BP than they are today, based on the presence of Zirfaea crispate. Bartels et al. (2017) argues that sea surface temperatures were warmer at the head of Woodfjorden during the early Holocene, with reduced sea ice coverage and open waters. Alkenone-based temperature reconstructions from Amsterdamøya and Mitrahalvøya, Figure 11B, suggests an early Holocene warming of 4.5°C at 10500 cal. yr. BP, and cooler temperatures between 10500 and 8300 cal. yr. BP, after which warming resumed. Between c. 7800 and 7000 cal. yr. BP, however, temperatures dropped dramatically and stayed more or less stable until 4400 cal. yr. BP (van der Bilt et al., 2018a). This coincide with, and could support, cool and hence drier conditions as inferred from the reduction in snowmelt layers and the increase in aeolian activity recorded in Vårfluesjøen.
The MS result from Vårfluesjøen show its highest values during this time period. Variations in MS reflect the concentration of magnetic minerals in the sediment (Dearing, 1999) and are commonly also used as an indicator of the input of inorganic sediments from the catchment (e.g., Thompson et al., 1975). However, the MS variability in VAP114 shows no co-variability with Ti, Si, or DBD (Table 3). This point toward another explanation for the high MS values and suggests a different, possibly non-glacial, source area for magnetic grains in the early and mid-Holocene. A possible source could be related to processes within the lake, e.g., the presence of magnetotactic bacteria in the sediments (Blakemore, 1975). The magnetotactic bacteria are usually found in the oxic-anoxic transition zone and produces magnetite, which in turn could explain the unmatched high MS signal in Vårfluesjøen during this period. The elevated MS coincides with a high variability in Mn, as well as Mn/Fe, a commonly used indicator of paleo-redox variability in lake sediment cores (e.g., Olsen et al., 2012; Naeher et al., 2013). Although both the presence of magnetotactic bacteria and the validity of Mn as a redox indicator in Vårfluesjøen needs to be further tested, they both hint at a lake environment where autochthonous material, such as blooming of magnetotactic bacteria, dominate. Such a scenario is plausible during a mid.-Holocene non-glacial phase in Vårfluesjøen.
High Frequent Variations in Winter Precipitation During the Neoglacial
The increased inorganic detrital input to Vårfluesjøen, at c. 3500 cal. yr. BP, marks the onset of the Neoglacial period at the northern coast of Svalbard. During the late Holocene on Svalbard, the rejuvenation of the glaciers can be seen as a response to the declining summer insolation (Figure 11A) and is evident in other glacier reconstructions from the west and northwest coast of Svalbard (Figure 11C) (Svendsen and Mangerud, 1997; Reusche et al., 2014; Røthe et al., 2015). A distinct cooling step at c. 4400–4300 cal. yr. BP can also be seen in the alkenone paleothermometry results from lake Hajern (Figure 11A) and indicate a regional onset of the Neoglacial period in Svalbard (van der Bilt et al., 2018a). The spatial difference in the timing of glacier reemergence from the west, e.g., Gjøavatnet (de Wet et al., 2018) and Hajern (van der Bilt et al., 2015), and north coast of Svalbard (this study) may be due to individual catchment properties, such as aspect and/or hypsometry and moisture availability (mainly controlled by the sea-ice extent).
From the record in Vårfluesjøen, we find increased aeolian activity between 3500 and 1750 cal. yr. BP. This implies relatively dry and polar conditions in the catchment during this period, and that the Vårfluesjøen catchment must have been dominated by strong, likely predominantly easterly winds, as the source of the sand-sized particles is the valley sandur located to the east of Vårfluesjøen (Figure 3C). At c. 1750 cal. yr. BP, the input of aeolian sands stops and the sedimentation is dominated by silty laminated material recorded as a dramatic increase in the number of snowmelt layers (Figure 9B). The highest glacier activity throughout the Holocene are recorded in Vårfluesjøen during the period after 1750 cal. yr. BP, however, with large variability peaking at c. 750 cal. yr. BP and c. 150 cal. yr. BP.
Balascio et al. (2018) suggested that progressive cooling has occurred in the last 5,000 years, with a stepwise shift toward a cooler environment during the last 1,800 years based on the record from Amsterdamøya, NW Svalbard. The last 1,800 years is characterized as stable, with no significant cooling trend, and this notion is further supported by findings from Kongressvatnet, which is close to Isfjord Radio (D'Andrea et al., 2012). The transition to a new state, as hinted by Balascio et al. (2018), at c. 1,800 years ago corresponds with the abrupt drop in aeolian activity at c. 1750 cal. yr. BP from Vårfluesjøen. We infer that the lack of sand particles after 1750 cal. yr. BP could be due to increased winter precipitation, i.e. wetter conditions, limiting the aeolian activity. Although, we cannot rule out the possibility of less wind and/or change in wind direction to explain the lack of sand particles, found in Vårfluesjøen.
The increasing glacier activity in the Vårfluesjøen catchment and progressive increase in runoff from snowmelt over this period, see Figure 9B, coincides with the gradual increase in winter insolation (Meyer et al., 2015) during the winter season (Figure 11A, NDJFAM). In turn, increasing snow cover and winter precipitation during this interval, could very well explain the presence of larger glaciers producing more pronounced and regular spring snowmelt events in the Vårfluesjøen catchment. Furthermore, changes in moisture may also explain the large variability seen in the glacier activity over the last c. 1750 years, alternating between wetter and drier conditions, more like that described in the early part to the of the Neoglacial (3500–1750 cal. yr. BP). At Vårfluesjøen, the LIA period is defined by the distinct increase in inorganic detrital input to Vårfluesjøen at c. 750 cal. yr. BP and show a second LIA peak from 350 to 150 cal. yr. BP Comparable to this is the increased glacier activity, from c. 700 to 600 cal. yr. BP, as reported from two records at Hajern and Kløsa (Figure 11C) at Mitrahalvøya and both show a similar two-step LIA phase (Røthe et al., 2015; van der Bilt et al., 2015). The result from Vårfluesjøen show continuous laminations over the last c. 750 years (Figure 11D), representing high glacier mass turnover and pronounced spring melting throughout the period, indicating more winter precipitation. This is in agreement with D'Andrea et al. (2012) who point to increased heat transport via the West Spitsbergen Current, and accompanying increased winter precipitation, rather than cold temperatures, to have caused LIA expansions on Svalbard.
Conclusions
Through a process-based understanding of the sediment from Vårfluesjøen, we can unravel the multiple earth surface processes active in the catchment of a High Arctic lake. By combining sediment analyses of the physical, magnetic, and geochemical element properties together with high-resolution X-ray CTs, we can visualize and quantify the sedimentary inputs to the lake.
Our findings suggest that Vårfluesjøen became isolated from the fjord 10200 ± 260 cal. yr. BP, when we record a transition from marine to lacustrine conditions in the lake. The glaciers in the Vårfluesjøen catchment reemerged at c. 3500 cal. yr. BP, after having been considerably smaller or completely melted during the early and mid-Holocene. In particularly the periods c. 2000–900 and around c. 750 cal. yr. BP, as well the last 150 years (BP) show large glacier activity. However, the records also suggest shifts to a less active glacier at 1900–1800, 1000–800, and 350–150 cal. yr. BP. Increased aeolian activity indicated by increased distribution of sand-sized particles (obtained by X-ray CT) suggest cold and arid (polar) environmental conditions from 3500 to 1750 cal. yr. BP. In general, the last 1,750 years have been marked by an abrupt drop in aeolian activity coinciding with high glacier activity upstream from Vårfluesjøen, also characterized by a progressive increase in runoff by snowmelt, with a peak after 1000 cal. yr. BP. We argue that this represent a shift toward increased wintertime precipitation in the Vårfluesjøen catchment during this last 1,750 years.
Author Contributions
JB, TR, and ES were responsible for the conceptual design of the work. TR and RB retrieved the sediment cores during fieldwork to Vårfluesjøen in 2014. All authors participated in mapping of the area during fieldwork in 2017. TR performed the laboratory analyses and led the writing of the manuscript and compilation of figures and tables. All authors have given substantial contributions to the data interpretations and writing of the manuscript.
Conflict of Interest Statement
The authors declare that the research was conducted in the absence of any commercial or financial relationships that could be construed as a potential conflict of interest.
Acknowledgments
This research was supported by funding from the Arctic Field Grant (Svalbard Science Forum) and the SHIFTS project (NRC: 21004). Permission to do fieldwork was granted by the Governor of Svalbard (RIS ID: 5155). The authors would like to thank Sædis Ólafsdóttir, Marthe Gjerde, Greg de Wet, Willem van der Bilt, William D'Andrea, and Nick Balascio for assistance during the fieldwork. All analyses were done at the National infrastructure EARTHLAB (NRC 226171) at the University of Bergen. The authors extend their thanks to Willem van der Bilt for valuable comments on the manuscript. Finally, we would like to thank the two reviewers, Maarten Blaauw and Matt Finkenbinder, who provided valuable comments and suggestions that greatly improved the quality of the paper.
Supplementary Material
The Supplementary Material for this article can be found online at: https://www.frontiersin.org/articles/10.3389/feart.2018.00091/full#supplementary-material
Figure S1. Selected interval from VAP114 (69–74 cm) showing a 3D image of the X-ray CT scan. The grayscale color corresponds to the relative density of the sediments, where the brighter color represents the densest material. The red arrows show the position of grain-size measurements using the Mastersizer 3000 from Malvern obtained from a distinct layer in VAP114.
Table S1. The results from the 210Pb-dating of the VAD114 done at the Laboratory for Isotope Dating and Environmental Research, Institute of Geological Sciences at the Polish Academy of Science.
References
Aagaard, K., Foldvik, A., and Hillman, S. R. (1987). The west spitsbergen current: disposition and water mass transformation. J. Geophys. Res. 92, 3778–3784.
AMAP (2017). Snow, Water, Ice and Permafrost. Summary for Policy-makers. Arctic Monitoring and Assessment Programme (AMAP).
Bakke, J., Dahl, S. O., Paasche, Ø., Riis Simonsen, J., Kvisvik, B., Bakke, K., et al. (2010). A complete record of Holocene glacier variability at Austre Okstindbreen, northern Norway: an integrated approach. Q. Sci. Rev. 29, 1246–1262. doi: 10.1016/j.quascirev.2010.02.012
Bakke, J., Lie, O., Heegaard, E., Dokken, T., Haug, G. H., Birks, H. H., et al. (2009). Rapid oceanic and atmospheric changes during the Younger Dryas cold period. Nat. Geosci. 2, 202–205. doi: 10.1038/ngeo439
Bakke, J., Lie, O., Nesje, A., Dahl, S. O., and Paasche, O. (2005). Utilizing physical sediment variability in glacier-fed lakes for continuous glacier reconstructions during the Holocene, northern Folgefonna, western Norway. Holocene 15, 161–176. doi: 10.1191/0959683605hl797rp
Balascio, N. L., D'Andrea, W. J., Gjerde, M., and Bakke, J. (2018). Hydroclimate variability of High Arctic Svalbard during the Holocene inferred from hydrogen isotopes of leaf waxes. Quat. Sci. Rev. 183, 177–187. doi: 10.1016/j.quascirev.2016.11.036
Balascio, N. L., Zhang, Z., Bradley, R. S., Perren, B., Dahl, S. O., and Bakke, J. (2011). A multi-proxy approach to assessing isolation basin stratigraphy from the Lofoten Islands, Norway. Quat. Res. 75, 288–300. doi: 10.1016/j.yqres.2010.08.012
Ballantyne, C. K. (2002). Paraglacial geomorphology. Quat. Sci. Rev. 21, 1935–2017. doi: 10.1016/S0277-3791(02)00005-7
Bartels, M., Titschack, J., Fahl, K., Stein, R., Seidenkrantz, M. S., Hillaire-Marcel, C., et al. (2017). Atlantic water advection vs. glacier dynamics in northern Spitsbergen since early deglaciation. Clim. Past 13, 1717–1749. doi: 10.5194/cp-13-1717-2017
Beierle, B. D., Lamoureux, S. F., Cockburn, J. M. H., and Spooner, I. (2002). A new method for visualizing sediment particle size distributions. J. Paleolimnol. 27, 279–283. doi: 10.1023/A:1014209120642
Bendle, J. M., Palmer, A. P., and Carr, S. J. (2015). A comparison of micro-CT and thin section analysis of Lateglacial glaciolacustrine varves from Glen Roy, Scotland. Quat. Sci. Rev. 114, 61–77. doi: 10.1016/j.quascirev.2015.02.008
Binford, M. W. (1990). Calculation and uncertainty analysis of 210Pb dates for PIRLA project lake sediment cores. J. Paleolimnol. 3, 253–267. doi: 10.1007/BF00219461
Bintanja, R., and Andry, O. (2017). Towards a rain-dominated Arctic. Nat. Clim. Chang. 7, 263–267. doi: 10.1038/nclimate3240
Blaauw, M., and Christen, J. A. (2011). Flexible paleoclimate age-depth models using an autoregressive gamma process. Bayesian Analysis 6, 457–474. doi: 10.1214/11-BA618
Blake, G. R., and Hartge, K. H. (1986). “Bulk Density,” in Methods of Soil Analysis: Part 1—Physical and Mineralogical Methods, ed A. Klut (Madison: American Society of Agronomy-Soil Science Societey of America), 363–375.
Bøe, A.-G., Dahl, S. O., Lie, Ø., and Nesje, A. (2006). Holocene river floods in the upper Glomma catchment, southern Norway: a high-resolution multiproxy record from lacustrine sediments. Holocene 16, 445–455. doi: 10.1191/0959683606hl940rp
Bradley, R., Retelle, M., Ludlam, S., Hardy, D., Zolitschka, B., Lamoureux, S., et al. (1996). The taconite inlet lakes project: a systems approach to paleoclimatic reconstruction. J. Paleolimnol. 16, 97–110. doi: 10.1007/BF00176930
Brückner, H., Schellmann, G., and van der Borg, K. (2002). Uplifted beach ridges in Northern Spitsbergen as indicators for glacio-isostasy and palaeo-oceanography. Zeitschrift fur Geomorphologie 46, 309–336.
Church, M. (1973). Baffin Island Sandar: A Study of Arctic Fluvial Environments. University of British Columbia.
Croudace, I. W., Rindby, A., and Rothwell, R. G. (2006). ITRAX: description and evaluation of a new multi-function X-ray core scanner. Special Public 267, 51–63. doi: 10.1144/GSL.SP.2006.267.01.04
D'Andrea, W. J., Vaillencourt, D. A., Balascio, N. L., Werner, A., Roof, S. R., Retelle, M., et al. (2012). Mild little ice age and unprecedented recent warmth in an 1800 year lake sediment record from Svalbard. Geology 40, 1007–1010. doi: 10.1130/G33365.1
Dahl, S. O., Bakke, J., Lie, Ø., and Nesje, A. (2003). Reconstruction of former glacier equilibrium-line altitudes based on proglacial sites: an evaluation of approaches and selection of sites. Quat. Sci. Rev. 22, 275–287. doi: 10.1016/S0277-3791(02)00135-X
Dallmann, W. K., and Elvevold, S. (2015). “Bedrock geology,” in Geoscience Atlas of Svalbard, eds W. K. Dallmann and K. Winfried (Tromsø: Norwegian Polar Insititute, Fram Centre).
Davies, S. J., Lamb, H. F., and Roberts, S. J. (2015). “Micro-XRF core scanning in palaeolimnology: recent developments,” in Micro-XRF Studies of Sediment Cores, eds I. W. Croudace and R. G. Rothwell (Dordrecht: Springer), 189–226.
de Wet, G. A., Balascio, N. L., D'Andrea, W. J., Bakke, J., Bradley, R. S., and Perren, B. (2018). Holocene glacier activity reconstructed from proglacial lake Gjøavatnet on Amsterdamøya, NW Svalbard. Quat. Sci. Rev. 183, 188–203. doi: 10.1016/j.quascirev.2017.03.018
Dean, W. E. (1974). Determination of carbonate and organic matter in calcareous sediments and sedimentary rocks by loss on ignition: comparison with other methods. J. Sediment. Petrol. 44, 242–258.
Dearing, J. (1999). “Magnetic Susceptibility,” in Environmental Magnetism: a practical guide. Technical Guide. No, 6, eds J. Walden, F. Oldfield, and J. Smith (London: Quaternary Research Association), 35–62.
DeVries-Zimmerman, S., Fisher, T. G., Hansen, E. C., Dean, S., and Björck, S. (2014). Sand in lakes and bogs in Allegan County, Michigan, as a proxy for eolian sand transport. Geological Soc. Am. Spec. Papers 508, 111–131. doi: 10.1130/2014.2508(07)
Eitel, B., van der Borg, K., Eberle, J., and Megies, H. (2002). Late Pleistocene/Early Holocene glacial history of northern Andreeland (northern Spitsbergen/Svalbard Archipelago): evidence from glacial and fluvio-glacial deposits. Zeitschrift fur Geomorphol. 46, 337–364.
Farnsworth, W. R., Ingólfsson, Ó., Retelle, M., and Schomacker, A. (2016). Over 400 previously undocumented Svalbard surge-type glaciers identified. Geomorphology 264, 52–60. doi: 10.1016/j.geomorph.2016.03.025
Førland, E. J., Benestad, R., Hanssen-Bauer, I., Haugen, J. E., and Skaugen, T. E. (2011). Temperature and precipitation development at svalbard 1900-2100. Adv. Meteorol. 2011:14. doi: 10.1155/2011/893790
Førland, E., and Hanssen-Bauer, I. (2000). Increased Precipitation in the Norwegian Arctic: True or False? Clim. Change 46, 485–509. doi: 10.1023/A:1005613304674
Forman, S., Lubinski, D., Ingólfsson, Ó., Zeeberg, J., Snyder, J., Siegert, M., et al. (2004). A review of postglacial emergence on Svalbard, Franz Josef Land and Novaya Zemlya, northern Eurasia. Quat. Sci. Rev. 23, 1391–1434. doi: 10.1016/j.quascirev.2003.12.007
Fouinat, L., Sabatier, P., Poulenard, J., Reyss, J. L., Montet, X., and Arnaud, F. (2017). A new CT scan methodology to characterize a small aggregation gravel clast contained in a soft sediment matrix. Earth Surf. Dynam. 5, 199–209. doi: 10.5194/esurf-5-199-2017
Francus, P., Bradley, R. S., Lewis, T., Abbott, M., Retelle, M., and Stoner, J. S. (2008). Limnological and sedimentary processes at Sawtooth Lake, Canadian High Arctic, and their influence on varve formation. J. Paleolimnol. 40, 963–985. doi: 10.1007/s10933-008-9210-x
Gilbert, R. (1990). Rafting in glacimarine environments. Geological Soc. Lond. Spec. Public. 53, 105–120. doi: 10.1144/GSL.SP.1990.053.01.06
Hagen, J. O., Liestøl, O., Roland, E., and Jørgensen, T. (1993). Glacier Atlas of Svalbard and Jan Mayen. Oslo: Norsk Polarinsitutt.
Hansen, T. (2014). Late Weichselian and Holocene Sedimentary Processes and Glacier Dynamics in Woodfjorden, Bockfjorden and Liefdefjorden, North Spitsbergen. Master, UiT The Arctic University of Norway.
Heiri, O., Lotter, A. F., and Lemchke, G. (2001). Loss on ignition as a method for estimating organic and carbonate content in sediments: reproducibility and comparability of results. J. Paleolimnol. 25, 101–110. doi: 10.1023/A:1008119611481
Isaksen, K., Nordli, Ø., Førland, E. J., Łupikasza, E., Eastwood, S., and Niedzwiedz, T. (2016). Recent warming on Spitsbergen—Influence of atmospheric circulation and sea ice cover. J. Geophys. Res. 121, 11, 913–11, 931. doi: 10.1002/2016JD025606
Karlèn, W. (1976). Lacustrine sediments and tree-line variations as indicators of climate flucutations in Lappland, northern Sweden. Geografiska Annaler. 58, 273–281.
Karlén, W. (1981). Lacustrine Sediment Studies. A Technique to Obtain a Continous Record of Holocene Glacier Variations. Geografiska Ann. A Phys. Geogr. 63, 273–281. doi: 10.1080/04353676.1981.11880042
Kylander, M. E., Ampel, L., Wohlfarth, B., and Veres, D. (2011). High-resolution X-ray fluorescence core scanning analysis of Les Echets (France) sedimentary sequence: new insights from chemical proxies. J. Quat. Sci. 26, 109–117. doi: 10.1002/jqs.1438
Lamoureux, S. (2000). Five centuries of interannual sediment yield and rainfall-induced erosion in the Canadian High Arctic recorded in lacustrine varves. Water Resour. Res. 36, 309–318. doi: 10.1029/1999WR900271
Lamoureux, S. F., Gilbert, R., and Lewis, T. (2002). Lacustrine sedimentary environments in high arctic proglacial bear lake, Devon Island, Nunavut, Canada. Arct. Antarct. Alp. Res. 34, 130–141. doi: 10.2307/1552464
Laskar, J., Robutel, P., Joutel, F., Gastineau, M., Correia, A., and Levrard, B. (2004). A long-term numerical solution for the insolation quantities of the Earth. Astron. Astrophys. 428, 261–285. doi: 10.1051/0004-6361:20041335
Leemann, A., and Niessen, F. (1994). Holocene glacial activity and climatic variations in the Swiss Alps: reconstructing a continuous record from proglacial lake sediments. Holocene 4, 259–268. doi: 10.1177/095968369400400305
Leonard, E. M. (1997). The relationship between glacial activity and sediment production: evidence from a 4450-year varve record of neoglacial sedimentation in Hector Lake, Alberta, Canada. J. Paleolimnol. 17, 319–330. doi: 10.1023/A:1007948327654
Lewis, T., Gilbert, R., and Lamoureux, S. F. (2002). Spatial and Temporal Changes in Sedimentary Processes at Proglacial Bear Lake, Devon Island, Nunavut, Canada. Arct. Antarct. Alp. Res. 34, 119–129. doi: 10.2307/1552463
Lovell, H., Fleming, E. J., Benn, D. I., Hubbard, B., Lukas, S., and Naegeli, K. (2015). Former dynamic behaviour of a cold-based valley glacier on Svalbard revealed by basal ice and structural glaciology investigations. J. Glaciol. 61, 309–328. doi: 10.3189/2015JoG14J120
Luks, B., Osuch, M., and Romanowicz, R. J. (2011). The relationship between snowpack dynamics and NAO/AO indices in SW Spitsbergen. Phys. Chem. Earth Parts A/B/C 36, 646–654. doi: 10.1016/j.pce.2011.06.004
Mangerud, J., and Svendsen, J. I. (2018). The Holocene thermal maximum around svalbard, Arctic North Atlantic; molluscs show early and exceptional warmth. Holocene 28, 65–83. doi: 10.1177/0959683617715701
Matthews, J. A., Olaf Dahl, S., Nesje, A., Berrisford, M. S., and Andersson, C. (2000). Holocene glacier variations in central Jotunheimen, southern Norway based on distal glaciolacustrine sediment cores. Quat. Sci. Rev. 19, 1625–1647. doi: 10.1016/S0277-3791(00)00008-1
Mäusbucher, R., Borg, K. v.d., Daug, G., Kroemer, E., Müller, J., and Wallner, J. (2002). Late Pleistocene and Holocene environmental changes in NW Spitsbergen - Evidence from lake sediments. Zeitschrift für Geomorphol. 46, 417–439.
Meyer, H., Opel, T., Laepple, T., Dereviagin, A. Y., Hoffmann, K., and Werner, M. (2015). Long-term winter warming trend in the Siberian Arctic during the mid- to late Holocene. Nat. Geosci. 8:122. doi: 10.1038/ngeo2349
Naeher, S., Gilli, A., North, R. P., Hamann, Y., and Schubert, C. J. (2013). Tracing bottom water oxygenation with sedimentary Mn/Fe ratios in Lake Zurich, Switzerland. Chem. Geol. 352, 125–133. doi: 10.1016/j.chemgeo.2013.06.006
Nesje, A. (1992). A piston corer for lacustrine and marine sediments. Arct. Alp. Res. 24, 257–259. doi: 10.2307/1551667
Nesje, A., Bakke, J., Dahl, S. O., Lie, Ø., and Bøe, A.-G. (2007). A continuous, high-resolution 8500-yr snow-avalanche record from western Norway. Holocene 17, 269–277. doi: 10.1177/0959683607075855
Nesje, A., Dahl, S., Matthews, J., and Berrisford, M. (2001). A ~4500 yr record of river floods obtained from a sediment core in Lake Atnsjøen, eastern Norway. J. Paleolimnol. 25, 329–342. doi: 10.1023/A:1011197507174
Nesje, A., Kvamme, M., Rye, N., and Løvlie, R. (1991). Holocene glacial and climate history of the Jostedalsbreen region, Western Norway; evidence from lake sediments and terrestrial deposits. Quat. Sci. Rev. 10, 87–114. doi: 10.1016/0277-3791(91)90032-P
Nesje, A., Olaf Dahl, S., Andersson, C., and Matthews, J. A. (2000). The lacustrine sedimentary sequence in Sygneskardvatnet, western Norway: a continuous, high-resolution record of the Jostedalsbreen ice cap during the Holocene. Quat. Sci. Rev. 19, 1047–1065. doi: 10.1016/S0277-3791(99)00090-6
Olsen, J., Anderson, N. J., and Knudsen, M. F. (2012). Variability of the North Atlantic Oscillation over the past 5,200 years. 5:808. doi: 10.1038/ngeo1589
Onarheim, I. H., Smedsrud, L. H., Ingvaldsen, R. B., and Nilsen, F. (2014). Loss of sea ice during winter north of Svalbard. Tellus A 66:23933. doi: 10.3402/tellusa.v66.23933
Oswald, W. W., Anderson, P. M., Brown, T. A., Brubaker, L. B., Hu, F. S., Lozhkin, A. V., et al. (2005). Effects of sample mass and macrofossil type on radiocarbon dating of arctic and boreal lake sediments. Holocene 15, 758–767. doi: 10.1191/0959683605hl849rr
Piva, A., Asioli, A., Schneider, R. R., Trincardi, F., Andersen, N., Colmenero-Hidalgo, E., et al. (2008). Climatic cycles as expressed in sediments of the PROMESS1 borehole PRAD1-2, central Adriatic, for the last 370 ka: 1. Integrated stratigraphy. Geochem. Geophys. Geosyst. 9, 1–21. doi: 10.1029/2007GC001713
Reimer, P. J., Bard, E., Bayliss, A., Beck, J. W., Blackwell, P. G., Ramsey, C. B., et al. (2013). IntCal13 and Marine13 Radiocarbon Age Calibration Curves 0–50,000 Years cal BP. Radiocarbon 55, 1869–1887. doi: 10.2458/azu_js_rc.55.16947
Reusche, M., Winsor, K., Carlson, A. E., Marcott, S. A., Rood, D. H., Novak, A., et al. (2014). 10Be surface exposure ages on the late-Pleistocene and Holocene history of Linnébreen on Svalbard. Quat. Sci. Rev. 89, 5–12. doi: 10.1016/j.quascirev.2014.01.017
Roland, E, and Haakensen, N. (1985). Glasiologiske undersøkelser i Norge 1982. Norges vassdrags- og elektrisitetsvesen, Vassdragsdirektoratet, Hydrologisk avdeling. Rapport nr. 1–85.
Røthe, T. O., Bakke, J., Vasskog, K., Gjerde, M., D'Andrea, W. J., and Bradley, R. S. (2015). Arctic Holocene glacier fluctuations reconstructed from lake sediments at Mitrahalvøya, Spitsbergen. Quat. Sci. Rev. 109, 111–125. doi: 10.1016/j.quascirev.2014.11.017
Rubensdotter, L., and Rosqvist, G. (2009). Influence of geomorphological setting, fluvial-, glaciofluvial- and mass-movement processes on sedimentation in alpine lakes. Holocene 19, 665–678. doi: 10.1177/0959683609104042
Salvigsen, O., and Høgvard, K. (2006). Glacial history, Holocene shoreline displacement and palaeoclimate based on radiocarbon ages in the area of Bockfjorden, north-western Spitsbergen, Svalbard. Polar Res. 25, 15–24. doi: 10.3402/polar.v25i1.6235
Salvigsen, O., and Österholm, H. (1982). Radiocarbon dated raised beaches and glacial history of the northern coast of Spitsbergen, Svalbard. Polar Res. 1982, 97–115. doi: 10.3402/polar.v1982i1.7000
Screen, J. A., and Simmonds, I. (2010). The central role of diminishing sea ice in recent Arctic temperature amplification. Nature 464:1334. doi: 10.1038/nature09051
Serreze, M., Barrett, A., Stroeve, J., Kindig, D., and Holland, M. (2009). The emergence of surface-based Arctic amplification. Cryosphere 3:11. doi: 10.5194/tc-3-11-2009
Sevestre, H., Benn, D. I., Hulton, N. R., and Bælum, K. (2015). Thermal structure of Svalbard glaciers and implications for thermal switch models of glacier surging. J. Geophys. Res. 120, 2220–2236. doi: 10.1002/2015JF003517
Sletten, K., Blikra, L. H., Ballantyne, C. K., Nesje, A., and Dahl, S. O. (2003). Holocene debris flows recognized in a lacustrine sedimentary succession: sedimentology, chronostratigraphy and cause of triggering. Holocene 13, 907–920. doi: 10.1191/0959683603hl673rp
Snyder, J. A., Miller, G. H., Werner, A., Jull, A. J. T., and Stafford, T. W. (1994). AMS-radiocarbon dating of organic-poor lake sediment, an example from Linnévatnet, Spitsbergen, Svalbard. Holocene 4, 413–421. doi: 10.1177/095968369400400409
Støren, E. N., Dahl, S. O., and Lie, Ø. (2008). Separation of late-Holocene episodic paraglacial events and glacier fluctuations in eastern Jotunheimen, central southern Norway. Holocene 18, 1179–1191. doi: 10.1177/0959683608096593
Støren, E. N., Dahl, S. O., Nesje, A., and Paasche, Ø. (2010). Identifying the sedimentary imprint of high-frequency Holocene river floods in lake sediments: development and application of a new method. Quat. Sci. Rev. 29, 3021–3033. doi: 10.1016/j.quascirev.2010.06.038
Svendsen, J. I., and Mangerud, J. (1997). Holocene glacial and climatic variations on Spitsbergen, Svalbard. Holocene 7, 45–57. doi: 10.1177/095968369700700105
Thompson, D. W. J., and Wallace, J. M. (1998). The Arctic oscillation signature in the wintertime geopotential height and temperature fields. Geophys. Res. Lett. 25, 1297–1300. doi: 10.1029/98GL00950
Thompson, R., Battarbee, R. W., O'sullivan, P., and Oldfield, F. (1975). Magnetic susceptibility of lake sediments. Limnol. Oceanogr. 20, 687–698. doi: 10.4319/lo.1975.20.5.0687
van der Bilt, W. G. M., Bakke, J., Vasskog, K., D'Andrea, W. J., Bradley, R. S., and Ólafsdóttir, S. (2015). Reconstruction of glacier variability from lake sediments reveals dynamic Holocene climate in Svalbard. Quat. Sci. Rev. 126, 201–218. doi: 10.1016/j.quascirev.2015.09.003
van der Bilt, W. G. M., Bakke, J., Vasskog, K., Røthe, T., and Støren, E. W. N. (2016). Glacier-fed lakes as palaeoenvironmental archives. Geol. Today 32, 213–218. doi: 10.1111/gto.12166
van der Bilt, W. G. M., D'Andrea, W. J., Bakke, J., Balascio, N. L., Werner, J. P., Gjerde, M., et al. (2018a). Alkenone-based reconstructions reveal four-phase Holocene temperature evolution for High Arctic Svalbard. Quat. Sci. Rev. 183, 204–213. doi: 10.1016/j.quascirev.2016.10.006
van der Bilt, W. G. M., Rea, B., Spagnolo, M., Roerdink, D. L., Jørgensen, S. L., and Bakke, J. (2018b). Novel sedimentological fingerprints link shifting depositional processes to Holocene climate transitions in East Greenland. Glob. Planet. Change 164, 52–64. doi: 10.1016/j.gloplacha.2018.03.007
Vasskog, K., Kvisvik, B. C., and Paasche, Ø. (2016). Effects of hydrogen peroxide treatment on measurements of lake sediment grain-size distribution. J. Paleolimnol. 56, 365–381. doi: 10.1007/s10933-016-9924-0
Vasskog, K., Nesje, A., Støren, E. N., Waldmann, N., Chapron, E., and Ariztegui, D. (2011). A Holocene record of snow-avalanche and flood activity reconstructed from a lacustrine sedimentary sequence in Oldevatnet, western Norway. Holocene 21, 597–614. doi: 10.1177/0959683610391316
Vasskog, K., Paasche, Ø., Nesje, A., Boyle, J. F., and Birks, H. J. B. (2012). A new approach for reconstructing glacier variability based on lake sediments recording input from more than one glacier. Quat. Res. 77, 192–204. doi: 10.1016/j.yqres.2011.10.001
Wellington, S. L., and Vinegar, H. J. (1987). X-ray computerized tomography. J. Petroleum Technol. 39, 885–898. doi: 10.2118/16983-PA
Keywords: Svalbard, Arctic climate, aeolian activity, Neoglacial, distal glacier-fed lake, X-ray CT
Citation: Røthe TO, Bakke J, Støren EWN and Bradley RS (2018) Reconstructing Holocene Glacier and Climate Fluctuations From Lake Sediments in Vårfluesjøen, Northern Spitsbergen. Front. Earth Sci. 6:91. doi: 10.3389/feart.2018.00091
Received: 10 April 2018; Accepted: 19 June 2018;
Published: 16 July 2018.
Edited by:
Daniel Nývlt, Masaryk University, CzechiaReviewed by:
Maarten Blaauw, Queen's University Belfast, United KingdomMatt Finkenbinder, Wilkes University, United States
Copyright © 2018 Røthe, Bakke, Støren and Bradley. This is an open-access article distributed under the terms of the Creative Commons Attribution License (CC BY). The use, distribution or reproduction in other forums is permitted, provided the original author(s) and the copyright owner(s) are credited and that the original publication in this journal is cited, in accordance with accepted academic practice. No use, distribution or reproduction is permitted which does not comply with these terms.
*Correspondence: Torgeir O. Røthe, dG9yZ2Vpci5yb3RoZUB1aWIubm8=